Petrel地震解释M6_Fault_Interpretation
Petrel官方地震解释培训M4_Well_Ties_Synthetics
Despiked
2
3
5
4
Log estimation – Make density from sonic
1. Right click on the well where an estimated log should be generated
1
2. Click on Use existing, select Global Well Log from the list
Execute
1
4
2
5
Acoustic impedance and Reflection coefficient series
1. In the Seismogram tab, click on Create synthetic seismogram
2. Select Density to use
2 3
Opens settings page for the object Create a new object Opens the spreadsheet for the object
Well selection
1. Select a single well or the Wells folder to work with from the drop down menu
7
Synthetic seismogram
1. Click on the Synthetic seismogram pull down menu to view its content
2. Reflection coefficients and wavelet is input when Apply or OK is clicked
Petrel中文操作手册2010-(4~5章)
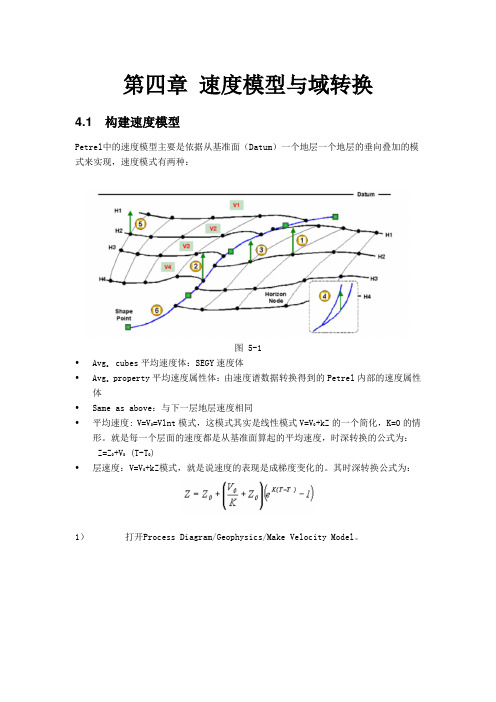
第四章速度模型与域转换4.1 构建速度模型Petrel中的速度模型主要是依据从基准面(Datum)一个地层一个地层的垂向叠加的模式来实现,速度模式有两种:图 5-1•Avg. cubes平均速度体:SEGY速度体•Avg. property平均速度属性体:由速度谱数据转换得到的Petrel内部的速度属性体•Same as above:与下一层地层速度相同•平均速度: V=V0=Vlnt模式,这模式其实是线性模式V=V0+kZ的一个简化,K=0的情形。
就是每一个层面的速度都是从基准面算起的平均速度,时深转换的公式为:Z=Z0+V0 (T-T0)•层速度:V=V0+kZ模式,就是说速度的表现是成梯度变化的。
其时深转换公式为:1)打开Process Diagram/Geophysics/Make Velocity Model。
图 5-22)在Petrel Explorer/Models中可以看到新生成的/,这个结果就是作时深转换的基础。
3)生成Velocity Models时可以选择output输出Time曲线、时深曲线、新的分层点等,进行质量控制。
图 5-3注意:当我们可以收集到等T0图和构造图(等深度图)这两种对应图件时,或者工区内有大量的井上分层数据资料时,我们可以通过Make Velocity Model的具体设置简化速度模型的人为分析。
图5-4 时深层面互校计算速度。
图5-5 时间层面和井上分层数据互校计算速度。
4.2 时间-深度转换1)确保Model Tab里面新计算获得的速度模型为激活的速度模型(粗体显示)。
2)在Input Tab里找到需要作时间-深度转换的地震数据,右键单击选择进行转换。
该步骤也可通过处理流程中Geophysics下面的弹出一个面板:图 5-63)如果是打开面板操作则可以选择不同类型的多种数据批量完成数据从时间域到深度域的转换。
第五章框架模型开始正式的建模操作之前,我们有必要整体的了解一下Process Diagram流程每个步骤的具体意义,以及各个步骤之间的联系。
PETREL操作手册文字版(中文)essca
备注:
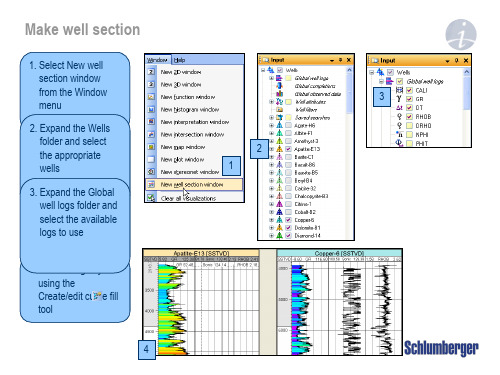
要使用功能栏中create new discrete well log 按钮,必须击活create/edit discrete log 按钮 . 在global well logs文件夹中选择的井曲 线,该曲线的settings 标签中中颜色标 签可以改变充填的图案
4 创建/编辑井分层
按钮说明
创建新多边形 层位解释 可引导的自动追踪 种子点自动追踪 断层解释
2.1 断层的地震解释
断层可解释为断层pillars或断层线,断层解释要在显示的地震剖面上完成,解释的断层 线可作为后续断层模型的输入.
断层线的解释: 1. 插入Inline Intersection并显示地震 数据(蓝色按钮). 2. 单击Seismic Interpretation处理步骤 使之处于活动状态. 3. 单击功能栏中的 Interpret Faults 按 钮 (或使用快捷键 F). 4. 在活动状态的主测线上通过数字化 断层线来解释某一主断层. 5. 记住使用快捷键N或单击Start New Polygon 按钮在每条线之间插入(断 点)标志. 6. 在同一方向上向前移动n条线继续解 释同一断层. 7. 完成一个断层的解释后单击 PETREL 资源浏览器中断层文件使之 处于非活动状态 .
备注:
也可以在PETREL 资源管理器窗口中 单击鼠标右键添加新的文件夹 (选择
Insert Folder).
1.2 载入数据
当载入数据时,要确定载入什么类型的数据.用户可以自由定义载入数据的类型,我们 建议把载入的数据分类归入不同类型的文件夹.
载入数据: 1. 击活要载入数据的文件夹 . 2. 打开菜单栏中的Insert 栏,选择 Import (on selection). 3. 在输入文件对话框中从下拉菜单中 选择正确的文件格式和准备载入的文 件. - 使用Ctrl 键可以同时载入多个文件.
Petrel地震解释M7_Horizon_Interpretation
S-crossing
Z-crossing
Setting autotrack parameters – Geometrical/Constraints
Vertical constraints
1000
1 2
Vertical range
2000
Max Vertical delta
3
3. Seed selection is based on seismic volume and points selection 4. After 3D Track is initiated, Instant undo and track will re-track the interpretation based on any changes to the parameters
Activate fault/horizon
Some of the main icons used for seismic horizon The Undo/Redo steps are limitless. These are saved for each horizon, but is lost when Petrel is closed
- Selection paintbrush (resize +/-),[Shift+ B] - Bounding box select [B] - Eraser (resize +/-), [Shift + X]
Start new line (insert flag) [N]
- Undo [Ctrl+Z] - Redo [Ctrl+Y] - Delete [Del] - Toggle seismic annotation
petrel中文手册
一、启动Petrel每个公司启动Petrel软件内容是不同的。
在这个过程中使用一个bitlock来运行Petrel,通过使用下面的程序描述来打开软件。
1. 双击桌面上的Petrel 图标启动Petrel。
2. 如果正在使用bitlock,并且是第一次运行Petrel,在执行Petrel运行前会出现一个Petrel的介绍窗口。
3. 打开Gullfaks_Demo项目。
点击文件>打开项目,从项目目录中选择Gullfaks_Demo.pet。
4. 复制项目:选择文件>另存为,可以保存数据到你的学员目录,给项目命一个新名,如Ex-1,按保存。
二、界面介绍(一)、菜单条/ 工具条与大多数PC软件一样,Petrel软件菜单条有标准的“文件”、“编辑”、“视图”、View等下拉菜单,以及一些用于打开、保存project的标准工具,在菜单条下面的工具条里还有更多工具。
在Petrel里,工具条还包含显示工具。
此外在第二个工具条里还有位于Petrel 项目窗口的右端的按钮,它具有附加的Petrel 相关的功能。
后面的工具条称为功能条,这些工具是否有效取决于选择进程表中的哪个进程。
练习步骤1. 点击上面工具条中的每一项看会出现什么。
你可以实践一些更感兴趣的选项。
2.将鼠标在第二个工具条中的按钮上慢慢移动。
将会出现描述每一个按钮功能的文本出现。
3.点击“What's This”按钮,然后再点击其它的某个按钮。
将会现该按钮的功能的更详细的描述。
(二)、Petrel资源管理器Petrel资源管理器(左上角)跟任何PC机上的windows资源管理器一样工作。
通过点击加号、减号可以打开和关闭文件夹。
你可能注意到Petrel资源管理器下面的卡片,这些卡片可以从一个文件组移到另一个。
你将花费大部分时间在输入和建模卡片上。
练习步骤1. 点击输入卡片。
2. 展开文件夹显示其内容。
3. 右键点击文件夹有效的选项,从选项列表中选择设置,弹出一个窗口,支持文件夹的几个有效功能选项。
[Petrel2014使用技巧]使用地震剖面照片进行二维地震解释
![[Petrel2014使用技巧]使用地震剖面照片进行二维地震解释](https://img.taocdn.com/s3/m/503f7e39ed630b1c59eeb5ec.png)
使用地震剖面照片进行二维地震解释如果手头只有地震剖面截图或照片,而并非实际的地震数据,但是需要进行二维地震解释的时候,根据不同的解释数据用途,可以在Petrel中有三种方式来实现。
根据解释数据的不同用途: 1) 如果解释数据用于归档数据库, 那么断层可以直接在地震剖面截图上解释,而层位解释必须基于真是的地震数据,所以需要使用插件Blueback 来将图片转换为解释数据。
2) 解释数据用来在Petrel中创建三维构造模型。
断层可以直接在图像上解释(或解释为多边形),层位可以解释为多边形。
3) 如果解释数据是用来为其他软件生成输入数据,如IGEOSS Dynel 3D: Dynel 3D需要地震解释数据作为输入数据或者使用构造三角网格(如.ts文件) 。
此处介绍如何在petrel里不用插件进行解释。
解释步骤分解如下:第一步: 输入Bitmap图片1) 使用Bitmap格式加载图片(如图1)。
2) 设置选项右上角Independent edges保持depth(Z)垂直(如图2)。
第二步:插入general intersection进行解释1) 在任意文件夹右键插入general intersection。
2) 选择三点确定general intersection的位置。
第三步:使用Make/edit polygon开始解释层位1) 创建一个”pseudo”的interpretation filter来区分不同的polygon的图像来源(如图3)。
2) 使用append polygons的功能将属于同一层位的polygon合并成一个(如图4)。
第四步: 移动Intersection面板1) 一旦移动了intersection,设置正确的视角(此处设置为west如图5)。
2) 将前一图像解释的层位当作”neighbor”也显示在解释窗口协助(如图6)。
3) 解释该图像(如图7)。
第五步: 进行断层解释1) 因为断层解释独立与地震道,可直接激活Seismic interpretation进程进行解释(图8)。
Petrel地震地质解释和建模使用技巧
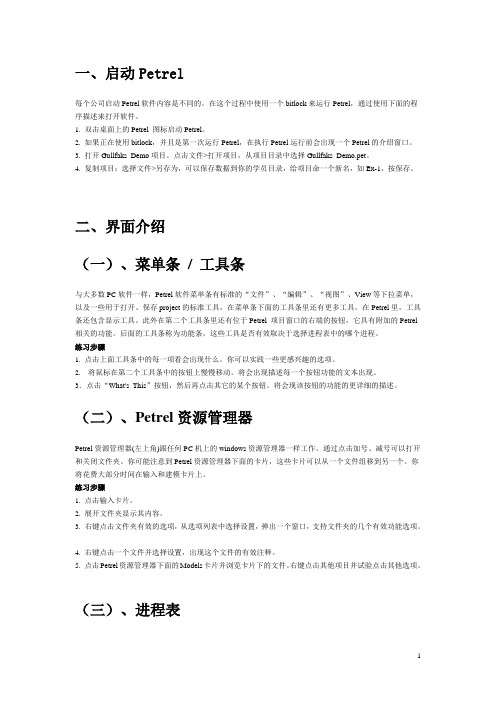
Petrel地震地质解释和建模使用技巧Petrel 合成记录工作流制作合成地震记录,进行层位标定和确定时深关系是地震解释工作中非常重要的环节。
从Petel2009.1.1,开始Petrel里有两个制作合成记录的模块,一个叫Synthetics,一个叫Seismic-Well tie。
这里介绍如何使用Synthetics模块制作合成地震记录。
从Petrel 2007开始Synthetics模块有了很大改进。
最重要的变化是其结果可在Global well logs下有相应的synthetic目录,其相应时深关系可在数据表中显示。
对同一口井可产生多个合成记录,如图1-1,1-2所示。
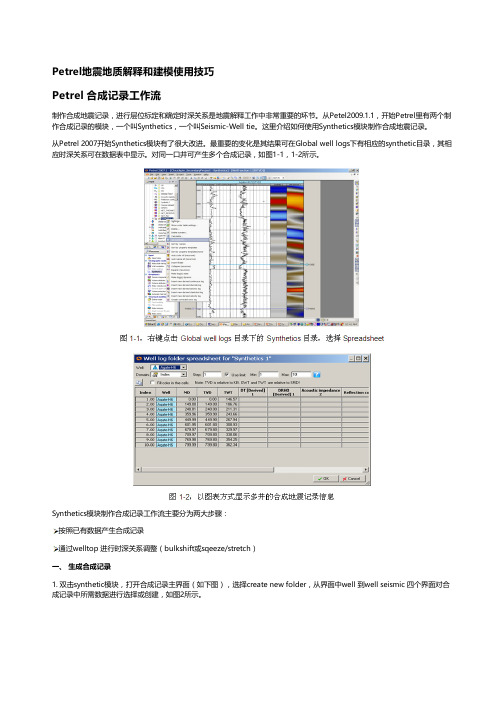
Synthetics模块制作合成记录工作流主要分为两大步骤:按照已有数据产生合成记录通过welltop 进行时深关系调整(bulkshift或sqeeze/stretch)一、 生成合成记录1. 双击synthetic模块,打开合成记录主界面(如下图),选择create new folder,从界面中well 到well seismic 四个界面对合成记录中所需数据进行选择或创建,如图2所示。
Well:选择要做合成记录的井,可多选,但每口井必须有相应的数据(DT和子波)。
Sonic and time:确定原始输入数据及时深关系。
根据实际数据品质,如果有checkshot,可用来做DT曲线校正;所有井上时深关系以工区井目录,以及每口井的Settings界面里Time界面下设置为准,Synthetics界面里的Overwrite global time log项不启用。
Create synthetic seismogram:创建合成记录选择创建合成记录所需数据:Density、Acoustic Impedence、Reflectiotion coefficients和Wavelet。
如果这些数据都不存在,或者希望修改参数重新创建,则点击黄色星状按钮创建新数据。
Petrel官方地震解释培训MDataImportCubehandlingandQC
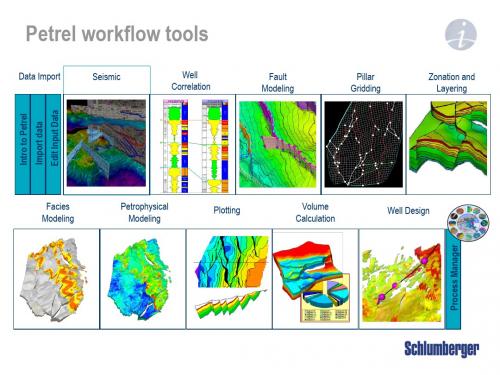
Facies Modeling
Petrophysical Modeling
Plotting
Volume Calculation
Well Design
Petrel Seismic Visualization and Interpretation
Course contents
Day 1
Day 2
Day 3
Loading seismic data - Import with preset parameters
1. Right click on a survey folder and use ‘Import (on selection)’
2. Select the file, set ‘Files of type’ and click Open
Generate Attribute cubes Generate Ant-tracking cube Auto generate fault patches Edit fault patches Convert fault patches to fault
interpretation Volume extraction Train Estimation Model
5. It is possible to scan a specified number of traces to QC the parameter selection
6. In the Input Data Dialog window, select the desired color template and correct domain
3. Right click or use the Insert menu to add seismic survey folders
Petrel官方地震解释培训M7_Depth_Conversion
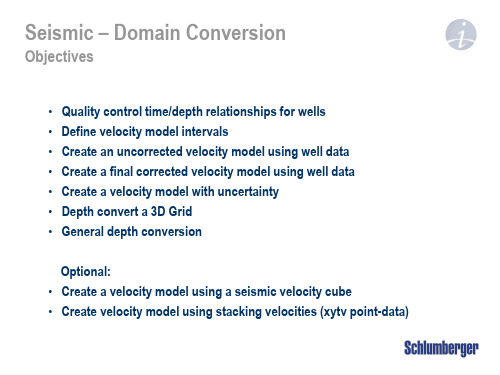
1. Constant 2. Surface 3. Horizon* 4. Well Tops
Or none
A: Auto 1. Correction (Vo) 2. TDR (Vo & k) B: User 1. Constant 2. Surface
1 2
4 3
Deterministic V0-surface
Stochastic V0-surface
5
Depth convert a 3D grid
1. Make sure the correct 3D Model is active 2. From the Process tab, under Structural Modeling, open Depth Convert 3D Grid 3. Select the appropriate Velocity Model 4. Alternatively change the pillar geometry types for faulted and non-faulted pillars before Applying 5. A new 3D Model will appear in the Models tab, with the input 3D grid name and an extension [DC]
box using the drop in arrow 5. Keep the Correction set to None
2 1
34
5
Velocity modeling using well data
1. Select type of velocity model for each interval. When using the Linvel function for modelling, constants, surfaces or Well TDR can be used as input
Petrel官方地震解释培训MPreliminaryInterpretation
• A Variance or Chaos cube needs to be generated to be used as input to the Anttracking process.
• Any other input that enhances discontinuities can be used (e.g. Coherency® ). Needs to be imported through SEG-Y loader or Open-Spirit connectivity.
Patch surface area. Click
on the histogram
representing the small
areas and click Apply
3. The small faults will be hidden
Settings for Fault patches – Stereonet filtering
1
(Chaos) and go to Volume attributes
2
2. Choose the AntTracking under
Structural methods
3
3. Select Passive or Aggressive Ants
and check the Ant-tracking setting
Petrel官方地震解释培训MReconnaissance
Objectives
• Selecting and manipulate seismic lines • Create Interpretation windows • Manipulating an Interpretation window • Display wiggle traces • Posting data in an Interpretation widow • Settings for SEG-Y seismic data • Settings for ZGY seismic data • Create and edit color palettes • Display multiple seismic views on the same screen • Linking windows • Random intersections • Composite intersections • Create a Well section fence diagram • Volume rendering
To change lines
4
3. Check box in front of a different seismic line
4. LMB on triangle above seismic or drag to new position
12 3
Manipulating an Interpretation window
4. Enable transparency for intersections combined with editing of the opacity curve under the colors tab to see through the seismic sections
Petrel地震解释技术及专业软件技能资质认证考试介绍PPT课件

-1800
-1950
-1950
-2100 -1950 -1950 -1800
6788400 6788000 6787600 6787200 6786800 6786400 6786000 6785600 6785200 6784800 6784400 6784000 6783600 6783200
It offers a unified environment where the tools you need are always readily available.
Status readout: static and continuous
Across Petrel: windows and
objects
Cut segments [T]
Activate fault [Shift+S]
Bounding box select [B]
Join selected points [J]
Select single point
Selection paintbrush Eraser [X]
自动层位追踪与质量控制
Petrel 的层位解释方法. Seeded 3D autotracking Seeded 2D autotracking Guided autotracking Manual interpretation Paintbrush autotracking Active box autotracking
-2100
-2100
452400 452800
Elev ation depth [m]
-1740.00 -1800.00 -1860.00 -1920.00 -1980.00 -20.00
Petrel地球物理简易手册2016

4
1 动指定合适的属性模板,批量加载选 ok for all,单个文件加载 选 ok 即可。
5
上图在 well section 窗口下显示加载进来的曲线。 7. 加载分层数据(marker):① input 面板下右键 import file 进入 import file 界面,选择格式文 件: petrel well tops选择 marker 数据ok;② 进入 import petrel well tops 界面,删除默认 column,手动选择 well, surface, MD, horizon type(包括 horizon, fault, other 三种)即可。进入 input data 界面,输入 nameok. 备注:(1)如果分层为多个,可添加多个 well tops。 (2)查看分层信息进行 Quality Control:well tops 右键菜单选 spreadsheetwell tops spreadsheet 查看分层数据。 8. 加载时深关系:checkshots 数据。数据基本信息包括 well name, TVD, TWT。格式为后缀 txt 或 prn 的文本文件即可。具体加载步骤:① input 面板下右键 import file 进入 import file 界面,选 择格式文件:checkshot format(ASCII) 选择 checkshots 数据ok;② 进入 import checkshots 界 面,删除默认 column,手动输入 well name, TVD, TWT 即可。Depth datum 为 KB, time datum 为 SRD。 备注:(1)petrel 中会自动将 time 值变为负值,但在数据显示中 time 值应为正值,因此在 加载数据 TWT 为正值时应将 Negate Z values 打勾,如果为负值,则不需要打勾。 (2)checkshots 位于 wellglobal well logs 中,可通过 checkshot 上点右键菜单下选 spreadsheet 查看数据。 9. 加载层位数据: ① 创建一个层位文件夹:seismic右键菜单选 new interpretation folder,即插入一个新的解释 文件夹,命名为 horizons。 ② 在 horizons 上右键选 import 进入 import file 界面,选择格式文件:本 demo 工区的解释数据 格式为 seiswork 3D interpretation(ASCII)(*.*) 选择解释层位数据open,加载界面如下:
Petrel分模块详细介绍
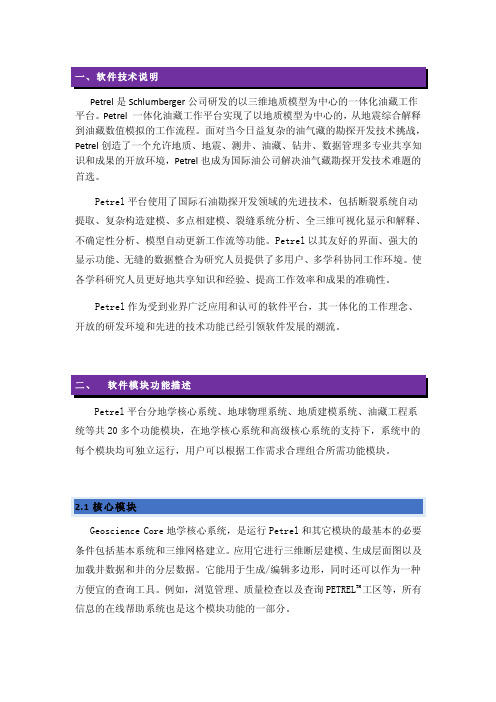
Petrel是Schlumberger公司研发的以三维地质模型为中心的一体化油藏工作平台。
Petrel 一体化油藏工作平台实现了以地质模型为中心的,从地震综合解释到油藏数值模拟的工作流程。
面对当今日益复杂的油气藏的勘探开发技术挑战,Petrel创造了一个允许地质、地震、测井、油藏、钻井、数据管理多专业共享知识和成果的开放环境,Petrel也成为国际油公司解决油气藏勘探开发技术难题的首选。
Petrel平台使用了国际石油勘探开发领域的先进技术,包括断裂系统自动提取、复杂构造建模、多点相建模、裂缝系统分析、全三维可视化显示和解释、不确定性分析、模型自动更新工作流等功能。
Petrel以其友好的界面、强大的显示功能、无缝的数据整合为研究人员提供了多用户、多学科协同工作环境。
使各学科研究人员更好地共享知识和经验、提高工作效率和成果的准确性。
Petrel作为受到业界广泛应用和认可的软件平台,其一体化的工作理念、开放的研发环境和先进的技术功能已经引领软件发展的潮流。
Petrel平台分地学核心系统、地球物理系统、地质建模系统、油藏工程系统等共20多个功能模块,在地学核心系统和高级核心系统的支持下,系统中的每个模块均可独立运行,用户可以根据工作需求合理组合所需功能模块。
2.1核心模块Geoscience Core地学核心系统,是运行Petrel和其它模块的最基本的必要条件包括基本系统和三维网格建立。
应用它进行三维断层建模、生成层面图以及加载井数据和井的分层数据。
它能用于生成/编辑多边形,同时还可以作为一种方便宜的查询工具。
例如,浏览管理、质量检查以及查询PETREL TM工区等,所有信息的在线帮助系统也是这个模块功能的一部分。
2.2地球物理(1) SEISMIC INTERPRETATION地震解释Seismic Interpretation模块提供了主要的地震解释功能。
包括地震数据体二、三维显示和浏览,使解释人员快速浏览地震数据体,优选研究目标区;断层手工解释和自动解释(Automatic Fault Picking功能);层位的二、三维手工解释和自动解释追踪功能;构造模型与地震数据体的同时显示,提高对地下地层和构造的了解。
petrel地震
二、加载井数据
1 Formats for well data
Well Date
D F
B C
二、加载井数据
3 Well Top import
A
A. 建立分层文件夹 Insert new Well Tops ,数据 浏览器下出现Well tops文件夹
B. 右键点击导入Well Tops
C. Type选择well tops
D. Specify the proper Template ,OK
三、加载地震数据
2 Seismic Date Import
A. Insert, New Seismic main Folder。右键选择Seiismic,选择Insert seismic survey folder,生成Survey 1文件夹。
B. 右键单击Survey 1,选择Import (on selection),文件类型为 SEG-Y seismic data, OK 关闭文件选择对话框。
From: 子体的第一条线. To: 子体的最后一条线.
Skip: 子体中每多少条线显示一条。 Time: 可设定一个from 和一个 to 值来确定时间范围。时间值不可以跳跃。
A
B
三、加载地震数据
3 创建 “Virtual Cropped Volume”
C. 同时,打开一个三维窗口(Tools Bar, )我们通过勾选在三维窗口中显示 该框架,切换到模式,就可以通过托拽绿色块交互选择ROI。确定好范围以 后,OK关闭设置窗口。
Petrel官方地震解释培训M5_Preliminary Interpretation 共22页
- Illegal step distance
Legal Step parameter defines how many legal step advances must be taken after an illegal step and before another illegal step is taken.
- Distance to search off track direction
• Search until discontinuity is found or exceed step distance plus illegal step distance • Search for next discontinuity (when found it defines direction of travel) • Search for next discontinuity in tracking direction within defined distance of that
The Ant-tracking attribute cube will be put in the Input tab
Ant-tracking parameters
2D example of ants path through voxels
- Discontinuity - Initial ant agents - Tracking Ant agent - Tracking direction - Step advance distance
- 1、下载文档前请自行甄别文档内容的完整性,平台不提供额外的编辑、内容补充、找答案等附加服务。
- 2、"仅部分预览"的文档,不可在线预览部分如存在完整性等问题,可反馈申请退款(可完整预览的文档不适用该条件!)。
- 3、如文档侵犯您的权益,请联系客服反馈,我们会尽快为您处理(人工客服工作时间:9:00-18:30)。
Convert fault patches to interpretation or Modeled faults
1. Activate Select/pick mode to select fault patches for conversion 2. Click on the Convert selected to fault interpretation icon. The fault interpretation is put under an Interpretation folder in the Input pane 3. Click on the Convert selected to fault in fault model icon. The modeled faults are put in Models pane of Petrel Explorer 4. Spacing and height of the modeled faults and fault sticks are controlled from the process Setting tab 1 2 3 4
Fault Interpretation
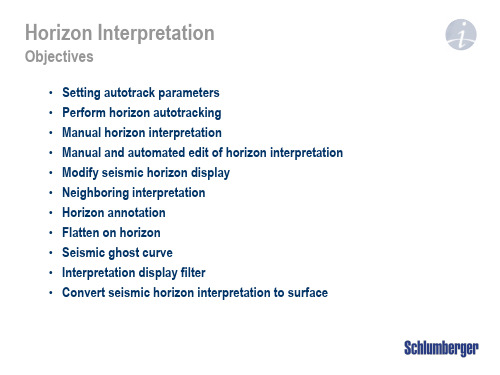
Objectives
• • • • • • • • Automatic fault extraction Settings for fault patches Stereonet and Histogram filtering Edit extracted faults Convert fault patches to fault sticks and fault model Manual fault interpretation Manipulate faults Finalize fault interpretation
- Interpret faults [F]
- Join points in segments [J] - Cut segments [T]
Activate fault
- Selection paintbrush - Bounding box select - Eraser
Start new line (insert flag) [N]
3 2
3. The small faults will be hidden
Settings for fault patches – Stereonet filtering
1. Go to the Stereonet tab and filter on the fault patch dip and azimuth 1 2 2. Faults with dip and azimuth falling in the grey area in the Stereonet are not displayed
Selecting a fault patch with Select/pick mode in a 3D window (gray patch) marks it as a red dot in the Stereonet
Interactively hide fault patches
1. Make sure the Automatic fault extraction process is activated 2. A set of tools will be available in the Function bar. Activate the Set select/pick mode icon and select fault patches to edit 1 3. Click on the Hide selected patches patches are hidden icon and the selected fault 2
1
2
3
5
4
- Interpret Faults [F] - Join Points In Segments - Cut Segments - Select & Edit/add points In 3D, display (QC) the interpreted fault Note: Fault segments are added to the active fault (bold in input pane) or to a new fault (no bolded faults in input pane).
Quality control the automatic generated faults
1. Quality check the faults against seismic and attributes. 2. Step through the volumes using the player 3. Edit/delete the points that are not correct
3. Repeat until fault is fully interpreted
4. Select patches ( and Shift + ) describing the fault icon
5. Click on Merge selected patches
2
5
3
Smooth fault patches
4. Set the Control of Fault Patch Smoothing slider to a stronger smoothing. Apply and Smooth again
2
3
Note: Patches cannot be edited, only smoothed and merged. Edit patch after converting to fault interpretation or fault model.
1. Open Settings tab for the Automatic fault extraction process, keep default parameters 2. Select the patch 3. Undo and click on the Smooth icon 1
the latest smooth if not satisfied 4
- Undo [Ctrl+Z] - Redo [Ctrl+Y] - Delete [Del]
Manual fault interpretation
1. Open an Interpretation Window and display a seismic line with a clearly defined fault 2. Insert New Interpretation Folder. Rename and right click in order to Insert New Fault interpretation 3. To activate the Fault Interpretation, click the icon or press the ’F’ key 4. Interpret the discontinuity in the data and break the fault interpretation with a flag [N] 5. Set an increment in the Plane step pull down menu. Interpret the fault in both directions
Automatic fault extraction
1 1. In the Automatic fault extraction process, go to the Extract fault patches tab 2. Left click and drop in the Ant-tracking cube in the dialog box 3. Set Fault extraction parameters and click Extract fault patches 4. Fault patches are put in Input pane
Fault dialog
3
Stereonet settings
2
Histogram settings Seeded 3D fault Toggle patch Hide patches Show hiden patches Merge patches
1
Smooth patches Convert to fault sticks Convert fault model Undo operation Delete patches
3
Semi-automatic fault patch interpretation
1. Set looser Extract fault patches parameters 2. Activate the Seeded 3D fault autotracking set a seed point on an Ant cube line icon and manually 4 1
2 3
4
Settings for fault patches – Histogram filtering
1. Right click on the fault patches object and open Settings 2. Go to the Histogram tab and filter on the Fault Patch surface area. Click on the histogram representing the small areas and click Apply 1