彩色图像分割算法:Color Image Segmentation Based on Mean Shift and Normalized Cuts
外文翻译---特征空间稳健性分析:彩色图像分割
附录2:外文翻译Robust Analysis of Feature Spaces: Color ImageSegmentationAbstractA general technique for the recovery of significant image features is presented. The technique is based on the mean shift algorithm, a simple nonparametric procedure for estimating density gradients. Drawbacks of the current methods (including robust clustering) are avoided. Feature space of any nature can be processed, and as an example, color image segmentation is discussed. The segmentation is completely autonomous, only its class is chosen by the user. Thus, the same program can produce a high quality edge image, or provide, by extracting all the significant colors, a preprocessor for content-based query systems. A 512 512 color image is analyzed in less than 10 seconds on a standard workstation. Gray level images are handled as color images having only the lightness coordinate.Keywords: robust pattern analysis, low-level vision, content-based indexing1 IntroductionFeature space analysis is a widely used tool for solving low-level image understanding tasks. Given an image, feature vectors are extracted from local neighborhoods and mapped into the space spanned by their components. Significant features in the image then correspond to high density regions in this space. Feature space analysis is the procedure of recovering the centers of the high density regions, i.e., the representations of the significant image features. Histogram based techniques, Hough transform are examples of the approach.When the number of distinct feature vectors is large, the size of the feature space is reduced by grouping nearby vectors into a single cell. A discretized feature space is called an accumulator. Whenever the size of the accumulator cell is not adequate for the data, serious artifacts can appear. The problem was extensively studied in the context of the Hough transform, e.g.. Thus, for satisfactory results a feature space should have continuous coordinate system. The content of a continuous feature space can be modeled as a sample from a multivariate, multimodal probability distribution. Note that for real images the number of modes can be very large, of the order of tens.The highest density regions correspond to clusters centered on the modes of the underlying probability distribution. Traditional clustering techniques, can be used for feature space analysis but they are reliable only if the number of clusters is small and known a priori. Estimating the number of clusters from the data is computationally expensive and not guaranteed to produce satisfactory result.A much too often used assumption is that the individual clusters obey multivariate normal distributions, i.e., the feature space can be modeled as a mixture of Gaussians. The parameters of the mixture are then estimated by minimizing an error criterion. For example, a large class of thresholding algorithms are based on the Gaussian mixture model of the histogram, e.g.. However, there is no theoretical evidence that an extracted normal cluster necessarily corresponds to a significant image feature. On the contrary, a strong artifact cluster may appear when several features are mapped into partially overlapping regions.Nonparametric density estimation avoids the use of the normality assumption. The two families of methods, Parzen window, and k-nearest neighbors, both require additional input information (type of the kernel, number of neighbors). Thisinformation must be provided by the user, and for multimodal distributions it is difficult to guess the optimal setting.Nevertheless, a reliable general technique for feature space analysis can be developed using a simple nonparametric density estimation algorithm. In this paper we propose such a technique whose robust behavior is superior to methods employing robust estimators from statistics.2 Requirements for RobustnessEstimation of a cluster center is called in statistics the multivariate location problem. To be robust, an estimator must tolerate a percentage of outliers, i.e., data points not obeying the underlying distribution of the cluster. Numerous robust techniques were proposed, and in computer vision the most widely used is the minimum volume ellipsoid (MVE) estimator proposed by Rousseeuw.The MVE estimator is affine equivariant (an affine transformation of the input is passed on to the estimate) and has high breakdown point (tolerates up to half the data being outliers). The estimator finds the center of the highest density region by searching for the minimal volume ellipsoid containing at least h data points. The multivariate location estimate is the center of this ellipsoid. To avoid combinatorial explosion a probabilistic search is employed. Let the dimension of the data be p. A small number of (p+1) tuple of points are randomly chosen. For each (p+1) tuple the mean vector and covariance matrix are computed, defining an ellipsoid. The ellipsoid is inated to include h points, and the one having the minimum volume provides the MVE estimate.Based on MVE, a robust clustering technique with applications in computer vision was proposed in. The data is analyzed under several \resolutions" by applying the MVE estimator repeatedly with h values representing fixed percentages of the data points. The best cluster then corresponds to the h value yielding the highest density inside the minimum volume ellipsoid. The cluster is removed from the feature space, and the whole procedure is repeated till the space is not empty. The robustness of MVE should ensure that each cluster is associated with only one mode of the underlying distribution. The number of significant clusters is not needed a priori.The robust clustering method was successfully employed for the analysis of a large variety of feature spaces, but was found to become less reliable once the number of modes exceeded ten. This is mainly due to the normality assumption embeddedinto the method. The ellipsoid defining a cluster can be also viewed as the high confidence region of a multivariate normal distribution. Arbitrary feature spaces are not mixtures of Gaussians and constraining the shape of the removed clusters to be elliptical can introduce serious artifacts. The effect of these artifacts propagates as more and more clusters are removed. Furthermore, the estimated covariance matrices are not reliable since are based on only p + 1 points. Subsequent post processing based on all the points declared inliers cannot fully compensate for an initial error.To be able to correctly recover a large number of significant features, the problem of feature space analysis must be solved in context. In image understanding tasks the data to be analyzed originates in the image domain. That is, the feature vectors satisfy additional, spatial constraints. While these constraints are indeed used in the current techniques, their role is mostly limited to compensating for feature allocation errors made during the independent analysis of the feature space. To be robust the feature space analysis must fully exploit the image domain information.As a consequence of the increased role of image domain information the burden on the feature space analysis can be reduced. First all the significant features are extracted, and only after then are the clusters containing the instances of these features recovered. The latter procedure uses image domain information and avoids the normality assumption.Significant features correspond to high density regions and to locate these regions a search window must be employed. The number of parameters defining the shape and size of the window should be minimal, and therefore whenever it is possible the feature space should be isotropic. A space is isotropic if the distance between two points is independent on the location of the point pair. The most widely used isotropic space is the Euclidean space, where a sphere, having only one parameter (its radius) can be employed as search window. The isotropy requirement determines the mapping from the image domain to the feature space. If the isotropy condition cannot be satisfied, a Mahalanobis metric should be defined from the statement of the task.We conclude that robust feature space analysis requires a reliable procedure for the detection of high density regions. Such a procedure is presented in the next section.3 Mean Shift AlgorithmA simple, nonparametric technique for estimation of the density gradient was proposed in 1975 by Fukunaga and Hostetler. The idea was recently generalized by Cheng.Assume, for the moment, that the probability density function p(x) of the p-dimensional feature vectors x is unimodal. This condition is for sake of clarity only, later will be removed. A sphere X S of radius r, centered on x contains the featurevectors y such that r x y ≤-. The expected value of the vector x y z -=, given x and X S is[]()()()()()dy S y p y p x y dy S y p x y S z E X X S X S X X ⎰⎰∈-=-==μ(1) If X S is sufficiently small we can approximate()()X S X V x p S y p =∈,where p S r c V X ⋅=(2)is the volume of the sphere. The first order approximation of p(y) is()()()()x p x y x p y p T∇-+=(3) where ()x p ∇ is the gradient of the probability density function in x. Then()()()()⎰∇--=X X S S Tdy x p x p V x y x y μ(4) since the first term vanishes. The value of the integral is()()x p x p p r ∇+=22μ(5) or[]()()x p x p p r x S x x E X ∇+=-∈22(6) Thus, the mean shift vector, the vector of difference between the local mean and the center of the window, is proportional to the gradient of the probability density at x. The proportionality factor is reciprocal to p(x). This is beneficial when the highest density region of the probability density function is sought. Such region corresponds to large p(x) and small ()x p ∇, i.e., to small mean shifts. On the other hand, low density regions correspond to large mean shifts (amplified also by small p(x) values).The shifts are always in the direction of the probability density maximum, the mode. At the mode the mean shift is close to zero. This property can be exploited in a simple, adaptive steepest ascent algorithm.Mean Shift Algorithm1. Choose the radius r of the search window.2. Choose the initial location of the window.3. Compute the mean shift vector and translate the search window by that amount.4. Repeat till convergence.To illustrate the ability of the mean shift algorithm, 200 data points were generated from two normal distributions, both having unit variance. The first hundred points belonged to a zero-mean distribution, the second hundred to a distribution having mean 3.5. The data is shown as a histogram in Figure 1. It should be emphasized that the feature space is processed as an ordered one-dimensional sequence of points, i.e., it is continuous. The mean shift algorithm starts from the location of the mode detected by the one-dimensional MVE mode detector, i.e., the center of the shortest rectangular window containing half the data points. Since the data is bimodal with nearby modes, the mode estimator fails and returns a location in the trough. The starting point is marked by the cross at the top of Figure 1.Figure 1: An example of the mean shift algorithm.In this synthetic data example no a priori information is available about the analysis window. Its size was taken equal to that returned by the MVE estimator, 3.2828. Other, more adaptive strategies for setting the search window size can also be defined.Table 1: Evolution of Mean Shift AlgorithmIn Table 1 the initial values and the final location,shown with a star at the top of Figure 1, are given.The mean shift algorithm is the tool needed for feature space analysis. The unimodality condition can be relaxed by randomly choosing the initial location of the search window. The algorithm then converges to the closest high density region. The outline of a general procedure is given below.Feature Space Analysis1. Map the image domain into the feature space.2. Define an adequate number of search windows at random locations in the space.3. Find the high density region centers by applying the mean shift algorithm to each window.4. Validate the extracted centers with image domain constraints to provide the feature palette.5. Allocate, using image domain information, all the feature vectors to the feature palette.The procedure is very general and applicable to any feature space. In the next section we describe a color image segmentation technique developed based on this outline.4 Color Image SegmentationImage segmentation, partioning the image into homogeneous regions, is a challenging task. The richness of visual information makes bottom-up, solely image driven approaches always prone to errors. To be reliable, the current systems must be large and incorporate numerous ad-hoc procedures, e.g.. The paradigms of gray level image segmentation (pixel-based, area-based, edge-based) are also used for color images. In addition, the physics-based methods take into account information about the image formation processes as well. See, for example, the reviews. The proposed segmentation technique does not consider the physical processes, it uses only the given image, i.e., a set of RGB vectors. Nevertheless, can be easily extended to incorporate supplementary information about the input. As homogeneity criterioncolor similarity is used.Since perfect segmentation cannot be achieved without a top-down, knowledge driven component, a bottom-up segmentation technique should·only provide the input into the next stage where the task is accomplished using a priori knowledge about its goal; and·eliminate, as much as possible, the dependence on user set parameter values.Segmentation resolution is the most general parameter characterizing a segmentation technique. Whilethis parameter has a continuous scale, three important classes can be distinguished.Undersegmentation corresponds to the lowest resolution. Homogeneity is defined with a large tolerance margin and only the most significant colors are retained for the feature palette. The region boundaries in a correctly undersegmented image are the dominant edges in the image.Oversegmentation corresponds to intermediate resolution. The feature palette is rich enough that the image is broken into many small regions from which any sought information can be assembled under knowledge control. Oversegmentation is the recommended class when the goal of the task is object recognition.Quantization corresponds to the highest resolution.The feature palette contains all the important colors in the image. This segmentation class became important with the spread of image databases, e.g.. The full palette, possibly together with the underlying spatial structure, is essential for content-based queries.The proposed color segmentation technique operates in any of the these three classes. The user only chooses the desired class, the specific operating conditions are derived automatically by the program.Images are usually stored and displayed in the RGB space. However, to ensure the isotropy of the feature space, a uniform color space with the perceived color differences measured by Euclidean distances should be used. We have chosen the *v**L space, whose coordinates are related to the RGB values by nonlinear uD was used as reference illuminant. The transformations. The daylight standard65chromatic information is carried by *u and *v, while the lightness coordinate *L can be regarded as the relative brightness. Psychophysical experiments show that *v**L space may not be perfectly isotropic, however, it was found satisfactory for uimage understanding applications. The image capture/display operations alsointroduce deviations which are most often neglected.The steps of color image segmentation are presented below. The acronyms ID and FS stand for image domain and feature space respectively. All feature space computations are performed in the ***v u L space.1. [FS] Definition of the segmentation parameters.The user only indicates the desired class of segmentation. The class definition is translated into three parameters·the radius of the search window, r;·the smallest number of elements required for a significant color, min N ;·the smallest number of contiguous pixels required for a significant image region, con N .The size of the search window determines the resolution of the segmentation, smaller values corresponding to higher resolutions. The subjective (perceptual) definition of a homogeneous region seem s to depend on the “visual activity” in the image. Within the same segmentation class an image containing large homogeneous regions should be analyzed at higher resolution than an image with many textured areas. The simplest measure of the “visual activity” can be derived from the global covariance matrix. The square root of its trace,σ, is related to the power of the signal(image). The radius r is taken proportional to σ. The rules defining the three segmentation class parameters are given in Table 2. These rules were used in the segmentation of a large variety images, ranging from simple blood cells to complex indoor and outdoor scenes.When the goal of the task is well defined and/or all the images are of the same type, the parameters can be fine tuned.Table 2: Segmentation Class Parameters2. [ID+FS] Definition of the search window.The initial location of the search window in the feature space is randomly chosen. To ensure that the search starts close to a high density region several locationcandidates are examined. The random sampling is performed in the image domain and a few, M = 25, pixels are chosen. For each pixel, the mean of its 3 3 neighborhood is computed and mapped into the feature space. If the neighborhood belongs to a larger homogeneous region, with high probability the location of the search window will be as wanted. To further increase this probability, the window containing the highest density of feature vectors is selected from the M candidates.3. [FS] Mean shift algorithm.To locate the closest mode the mean shift algorithm is applied to the selected search window. Convergence is declared when the magnitude of the shift becomes less than 0.1.4. [ID+FS] Removal of the detected feature.The pixels yielding feature vectors inside the search window at its final location are discarded from both domains. Additionally, their 8-connected neighbors in the image domain are also removed independent of the feature vector value. These nei ghbors can have “strange” colors due to the image formation process and their removal cleans the background of the feature space. Since all pixels are reallocated in Step 7, possible errors will be corrected.5. [ID+FS] Iterations.Repeat Steps 2 to 4, till the number of feature vectors in the selected searchN.window no longer exceedsmin6. [ID] Determining the initial feature palette.N vectors.In the feature space a significant color must be based on minimumminN pixels Similarly, to declare a color significant in the image domain more thanminof that color should belong to a connected component. From the extracted colors only those are retained for the initial feature palette which yield at least one connectedN. The neighbors removed at Step 4 component in the image of size larger thanminare also considered when defining the connected components Note that the threshold N which is used only at the post processing stage.is notcon7. [ID+FS] Determining the final feature palette.The initial feature palette provides the colors allowed when segmenting the image. If the palette is not rich enough the segmentation resolution was not chosen correctly and should be increased to the next class. All the pixel are reallocated basedon this palette. First, the pixels yielding feature vectors inside the search windows at their final location are considered. These pixels are allocated to the color of the window center without taking into account image domain information. The windowsare then inflated to double volume (their radius is multiplied with p32). The newly incorporated pixels are retained only if they have at least one neighbor which was already allocated to that color. The mean of the feature vectors mapped into the same color is the value retained for the final palette. At the end of the allocation procedure a small number of pixels can remain unclassified. These pixels are allocated to the closest color in the final feature palette.8. [ID+FS] Postprocessing.This step depends on the goal of the task. The simplest procedure is the removal from the image of all small connected components of size less thanN.Thesecon pixels are allocated to the majority color in their 3⨯3 neighborhood, or in the case of a tie to the closest color in the feature space.In Figure 2 the house image containing 9603 different colors is shown. The segmentation results for the three classes and the region boundaries are given in Figure 5a-f. Note that undersegmentation yields a good edge map, while in the quantization class the original image is closely reproduced with only 37 colors. A second example using the oversegmentation class is shown in Figure 3. Note the details on the fuselage.5 DiscussionThe simplicity of the basic computational module, the mean shift algorithm, enables the feature space analysis to be accomplished very fast. From a 512⨯512 pixels image a palette of 10-20 features can be extracted in less than 10 seconds on a Ultra SPARC 1 workstation. To achieve such a speed the implementation was optimized and whenever possible, the feature space (containing fewer distinct elements than the image domain) was used for array scanning; lookup tables were employed instead of frequently repeated computations; direct addressing instead of nested pointers; fixed point arithmetic instead of floating point calculations; partial computation of the Euclidean distances, etc.The analysis of the feature space is completely autonomous, due to the extensive use of image domain information. All the examples in this paper, and dozens more notshown here, were processed using the parameter values given in Table 2. Recently Zhu and Yuille described a segmentation technique incorporating complex global optimization methods(snakes, minimum description length) with sensitive parameters and thresholds. To segment a color image over a hundred iterations were needed. When the images used in were processed with the technique described in this paper, the same quality results were obtained unsupervised and in less than a second. The new technique can be used un modified for segmenting gray level images, which are handled as color images with only the *L coordinates. In Figure 6 an example is shown.The result of segmentation can be further refined by local processing in the image domain. For example, robust analysis of the pixels in a large connected component yields the inlier/outlier dichotomy which then can be used to recover discarded fine details.In conclusion, we have presented a general technique for feature space analysis with applications in many low-level vision tasks like thresholding, edge detection, segmentation. The nature of the feature space is not restricted, currently we are working on applying the technique to range image segmentation, Hough transform and optical flow decomposition.255⨯pixels, 9603 colors.Figure 2: The house image, 192(a)(b)Figure 3: Color image segmentation example.512⨯pixels, 77041 colors. (b)Oversegmentation: 21/21(a)Original image, 512colors.(a)(b)Figure 4: Performance comparison.116⨯pixels, 200 colors. (b) Undersegmentation: 5/4 colors.(a) Original image, 261Region boundaries.(a)(b)(c)(d)(e)(f)Figure 5: The three segmentation classes for the house image. The right columnshows the region boundaries.(a)(b) Undersegmentation. Number of colors extracted initially and in the featurepalette: 8/8.(c)(d) Oversegmentation: 24/19 colors. (e)(f) Quantization: 49/37 colors.(a)(b)(c)256 Figure 6: Gray level image segmentation example. (a)Original image, 256pixels.(b) Undersegmenta-tion: 5 gray levels. (c) Region boundaries.特征空间稳健性分析:彩色图像分割摘要本文提出了一种恢复显著图像特征的普遍技术。
工业机器视觉基础教程-halcon篇

工业机器视觉基础教程-halcon篇工业机器视觉是指应用机器视觉技术在工业生产中,实现产品质量检测、工业自动化等一系列目标。
而HALCON则是一款功能齐全、具备丰富图像处理库的应用授权软件。
本文将介绍HALCON图像处理中的基本操作和应用。
一、HALCON图像处理的基本操作1.图像加载:使用read_image操作,该操作可以加载多种图像格式的图片文件。
如:read_image(Image, “test.jpg”)。
2.图像显示:使用disp_image操作可以对加载图像进行可视化处理并显示在界面上。
如:disp_image(Image)。
3.图像缩放:resize_image操作可以对图像进行缩放处理,缩放后的图像尺寸可以根据需求调整。
如:resize_image(Image,Image2,800,600,”bilinear”)。
4.图像灰度化:使用rgb1_to_gray操作可以将彩色图像转化为灰度图像。
如:rgb1_to_gray(Image,Image2)。
5.边缘检测:使用edge_image操作可以对图像进行边缘检测,检测出目标区域的轮廓和边缘。
如:edge_image(Image,Image2,”canny”)。
6.形态学操作:morph_operator操作可以对图像进行形态学操作,如膨胀、腐蚀、开、闭等。
如:morph_operator(Image,Image2,”dilation”,5)。
7.颜色分割:color_segmentation操作可以根据像素的颜色信息进行分割处理,一般是针对彩色图像。
如:color_segmentation (Image,Image2,“HSV”,[1, 0,0],[255, 255, 255])。
二、HALCON图像处理的应用1.工业质检:HALCON图像处理可以应用于工业质检领域,在生产线上进行产品质量检测,包括外观、尺寸、缺陷等。
2.智能制造:HALCON图像处理可以实现机器视觉智能制造,根据生产工艺流程和生产数据进行智能制造调节和优化。
研究内容英文翻译
研究内容英文翻译研究内容research content;study content;Content双语例句全部research contents contents research content study content Content1.总之,GIS应用服务器负载平衡是分布式GIS的重要研究内容。
In conclusion, the load balancing of GIS application server is important research contents of distributed GIS.2.具体研究内容如下:1.基于RGB综合显著性的彩色图像分割方法研究。
The concrete research contents are as follows. 1. Color image segmentation based on RGB comprehensive information saliency.3.所以本课题的主要研究内容就是构建Office安全功能并验证设计与实现的一致性并消除实现与设计原形的歧义。
So the main idea of the subject is how to construct Office security functions and verify the design.4.本文的研究内容是设计开发一个基于USB摄像头的嵌入式图像采集系统。
The process of designing a image-capturing system with a USB webcamera based on embedded system is described.5.本文的研究内容就是设计SO2和H2S气体浓度测量装置。
This study is to design SO2 and H2S gas concentration measurement devices.。
基于RGB颜色空间的彩色图像分割
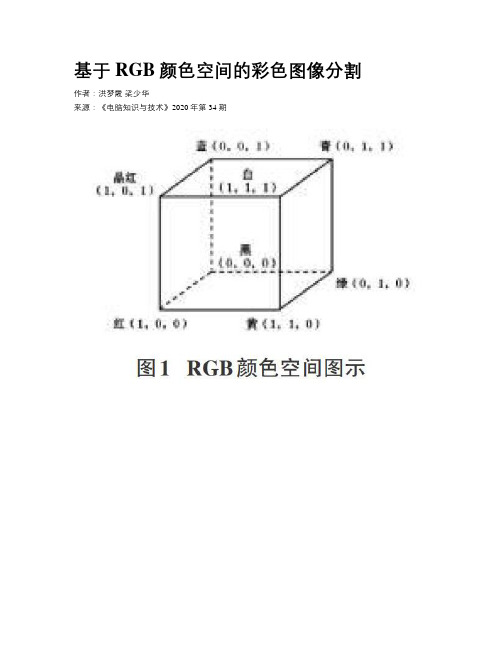
基于RGB颜色空间的彩色图像分割作者:洪梦霞梁少华来源:《电脑知识与技术》2020年第34期摘要:颜色分割可用于检测身体肿瘤、从森林或海洋背景中提取野生动物的图像,或者从单一的背景图像中提取其他彩色物体,大数据时代背景下,颜色空间对于图像分析仍然非常有用,通过在RGB和HSV颜色空间可视化图像,可以看到图像颜色分布的散点图。
通过阈值分割,确定要提取的所有像素的阈值,在所有像素中获取期望的像素,得到分割后的图像。
实验结果分析,使用OpenCV基于Python中的颜色从图像中分割对象,可以达到简单、快速、可靠的目的。
关键词:颜色空间;颜色分割;阈值分割中图分类号:TP3 文献标识码:A文章编号:1009-3044(2020)34-0225-03Abstract: Color segmentation can be used to detect body tumors, extract wildlife images from forest or marine background, or extract other color objects from a single background image. In the background of big data era, color space is still very useful for image analysis. By visualizing images in RGB and HSV color spaces, we can see the scatter map of image color distribution. Through threshold segmentation, the threshold of all the pixels to be extracted is determined, and the desired pixels are obtained from all pixels to obtain the segmented image. Experimental results show that using OpenCV to segment objects from images based on Python color can achieve the purpose of simple, fast and reliable.Key words: color space; color segmentation; threshold segmentation圖像分割是把图像分成若干个特定的、具有独特性质的区域并分割出感兴趣区域的过程。
结合蚁群和自动区域生长的彩色图像分割算法

结合蚁群和自动区域生长的彩色图像分割算法李浩;何建农【摘要】In order to overcome some shortcomings of traditional region growing algorithm , such as bad initial seed pixels and poor robustness of growing order, this paper puts forward a method of color image segmentation based on ant colony optimization region growing. First of all, according to the given threshold, we can select automatically the seed pixels by using ant colony algorithm, then select growth and adjacent termination criterion on the basis of the distance di and similarity value d (Hi,Hj), finally optimize segmentation result by using mathematical morphologymethod. We can find that this algorithm has obvious advantages in the segmentation accuracy compared with JSEG and SRG algorithm.%为克服传统区域生长算法对初始种子像素选择以及生长顺序鲁棒性较差等缺点,提出了一种基于蚁群算法优化区域生长的彩色图像分割方法。
首先,根据给定阈值,利用蚁群算法自动选取种子像素,然后,根据相邻距离 di 和相似度值 d(Hi,Hj)的值选取生长及终止准则,最后利用数学形态学方法对分割结果进行优化。
基于区域生长的彩色图像分割算法
基于区域生长的彩色图像分割算法抽象—图像分割不仅是图像处理领域的一个经典的研究主题,也是图像处理技术的热点和焦点。
随着计算机处理技术的发展和彩色应用范围的增加,彩色图像分割算法引起研究人员越来越多的关注。
彩色图像分割算法可以被看作是在灰度分割算法上的一个扩展。
但是彩色图像具有丰富的信息功能或研究一个特别适用彩色图像分割的新的图像分割方法来改善原始灰度图像。
本文提出了在传统的种子区域生长的基础上形成与流域相结合的算法的一种彩色图像自动分割区域的方法。
关键词:彩色图像分割分水岭算法种子区域生长算法1INTRODUCTION人们只关心在图像的研究和应用中的某些部分,这些部分经常被称为目标或前景,它们通常对应于图像的特定性质或特定领域。
这就需要提取并将它们分辨识别和分析对象。
在此基础上可能进一步对目标作用。
图像分割是一种技术和工艺,它可以将其分为不同的区域形象特征,并提取有利的目标。
这些特色可以是像素,灰度,颜色,质地等。
预先定义的目标可以对应一个区域或多个区域。
为了说明图像处理分割的水平,我们已经介绍了“形象工程”概念,它是涉及图像分割的理论,方法,算法,工具,设备而成德一个整体框架。
图像工程师应用研究图像领域的一个新课题,它内容非常丰富,根据抽象程度和研究方法的不同,它可以被分为三个层次: 图像处理,图像分析和图像理解。
图像处理重点在于图像之间的转化和提高图像的视觉效果。
图像分析主要是监测和衡量制定目标图像,以获取其客观信息来描述图像。
图像理解的关键是进一步研究每个目标的性质及其相互间的联系,以及得到原始图像的客观情况的解释,一次来为图像指导并计划采取措施。
图像处理,图像分析和图像理解有不同的操作。
图像处理时比较低级别的操作,它主要致力于像素水平,图像分析是中极水平,它着重于测量,表达和描述目标物。
图像理解主要是高层次的运作,本质上它注重通过计算和对数据符号的推理来描述事物。
图像分割是从图像处理到图像分析的关键步骤。
融合直方图阈值和K均值的彩色图像分割方法陈坤

2013, 49 (4)
Computer Engineering and Applications 计算机工程与应用
⦾ 图形图像处理 ⦾
融合直方图阈值和 K-均值的彩色图像分割方法
陈n, MA Yan, LI Shunbao
上海师范大学 信息与机电工程学院, 上海 200234 College of Information Mechanical and Electrical Engineering, Shanghai Normal University, Shanghai 200234, China CHEN Kun, MA Yan, LI Shunbao. Color image segmentation method by using histogram threshold and K-means. Computer Engineering and Applications, 2013, 49 (4) : 170-173. Abstract:This paper presents a simple and effective segmentation method for color image. All possible uniform regions in the color image are obtained by using the histogram threshold technique. That is, the main peak values is found in order to initialize and merge the regions and obtain the uniform regions marked by the corresponding clustering centers. The adaptive K-means clustering algorithm is given to improve compactness of the formed uniform regions. The experimental results show that, compared with IAFHA (improved ant colony-Fuzzy C-means hybrid algorithm)method, the proposed method can receive the less segmentation regions, fast segmentation speed and have certain robustness. Key words: color image segmentation; histogram threshold; K-means clustering 摘 要: 提出了一种简单有效的彩色图像分割方法。应用直方图阈值技术获得彩色图像中所有可能的均匀区域, 即通过寻
基于聚类和小波变换的彩色图像分割方法

基于聚类和小波变换的彩色图像分割方法作者:李景兰刘怀强来源:《现代电子技术》2008年第14期摘要:提出一种将聚类和小波变换相结合的彩色图像分割方法。
首先将图像划分成16×16子块,然后在块中按照视觉一致性准则进行颜色聚类,对于聚类后的子块,提取其颜色特征。
利用小波变换得到每个分块的纹理特征,将颜色特征和纹理特征的组合作为对图像进行分割的依据。
该方法将聚类算法和小波算法结合,并符合人类视觉特征的分割策略。
利用提出的算法对多幅自然图像进行分割实验,实验结果证明该算法的有效性。
关键词:彩色图像分割;颜色聚类;小波变换;纹理特征Abstract:his paper presents a color image segmentation method by combination of clustering and wavelet transform algorithmhe original image is first partitioned into 16×16 sub-blocks which are not overlapped,and then the sub-blocks are segmented by color clustering algorithm based on perceptual uniformityColor features are extracted from the segmented sub-blocksexture features of each sub-blocks are extracted by using of wavelet transformhen,the features of color and texture is combined,which is gist to segmenting imagehe proposed method combines the advantages of clustering and wavelet transform algorithm approaches,which is in accord with the human segmentation strategyhe algorithm proposed is applied to segment a number of natural images and its effectiveness and efficiency is confirmed by experimKeywords:1 引言目前,彩色图像的分割应用广泛,人们为探求符合人类视觉特征的快速分割方法[1],从不同的角度出发提出一些方法。
彩色图像分割

二值、灰度形态学
二值形态学中的运算对象是集合。设A为图像集合,S为结 构元素,数学形态学运算是用S对A进行操作。需要指出,实际 上结构元素本身也是一个图像集合。对每个结构元素可以指定 一个原点,它是结构元素参与形态学运算的参考点。应注意, 原点可以包含在结构元素中,也可以不包含在结构元素中,但 运算的结果常不相同。以下用阴影代表值为1的区域,白色代表 值为0的区域,运算是对值为1的区域进行的。二值形态学中两 个最基本的运算——腐蚀与膨胀,如图所示。
基本符号和术语
1. 元素和集合
在数字图像处理的数学形态学运算中,把一幅图像称为一个 集合。对于二值图像而言,习惯上认为取值为1的点对应于景 物中心,用阴影表示,而取值为0的点构成背景,用白色表示, 这类图像的集合是直接表示的。考虑所有值为1的点的集合为 A, 则A与图像是一一对应的。对于一幅图像A,如果点a在A
y S1
O
y
x X
X○ S1 X○ S2
O S2
x
(a)
(b)
X (c)
图 (a) 结构元素S1和S2
(b) X○S1
(c) X○S2
y S1
O
y
x
S1 X
X● S1
X● S2
O S2
x
X
S1
(a)
(b)
图 (a) 结构元素S1和S2
(c)
(b) X●S1; (c) X●S2
基于超像素的Grabcut彩色图像分割

基于超像素的Grabcut彩色图像分割辛月兰【摘要】To overcome the disadvantage of time load for the image segmentation that set up the graph model in pixels,a Grabcut color image segmentation method which is based on the super pixels is proposed in this paper.Firstly,users can calibrate a rectangular box in the target zone manually,then split the'image into small areas of the similar color (super pixels) with the watershed algorithm two times.Set up the graph model using the super pixels as the graph nodes.In order to estimate the value of GMM,use the mean of the super pixels' color value to represent the all pixels in the same area.Finally,get the minimum value of the Gibbs energy with the minimum cut algorithm to achieve the optimal segmentation.Experimental results demonstrate that the new algorithm uses the little super pixels instead of the huge number of pixels.The algorithm achieves the excellent segmentation result in short runtime,speeds up the pace of segmentation,enhances the efficiency of the algorithm.%针对以像素为节点建立图模型进行图像分割耗时的特点,文中提出了一种基于超像素的Grabcut彩色图像分割方法.首先用户在目标所在区域手动标定一个矩形框;然后用两次分水岭算法将图像过分割成区域内颜色相似的小区域(超像素),用分割得到的超像素作为图的结点构建图模型;以每个超像素的颜色均值代表所在分块的全部像素点估计GMM(高斯混合模型)参数;最后用最小割算法求得吉布斯能量的最小值达到最优分割.实验结果表明,该算法以极少数超像素代替海量像素,在得到较好分割结果的同时,极大地缩短了运行时间,加快了分割速度,提高了效率.【期刊名称】《计算机技术与发展》【年(卷),期】2013(023)007【总页数】5页(P48-51,56)【关键词】分水岭;超像素;高斯混合模型;分割【作者】辛月兰【作者单位】陕西师范大学计算机科学学院,陕西西安710062;青海师范大学物理系,青海西宁810008【正文语种】中文【中图分类】TP310 引言图割理论在图像分割问题中得到了广泛的应用,并且已经取得了一些好的成果[1~6]。
colorful_image_colorization算法原理_概述及解释说明

colorful image colorization算法原理概述及解释说明1. 引言1.1 概述本文旨在介绍colorful image colorization算法的原理,并对其进行解释和说明。
随着计算机技术的不断发展,图像处理领域也取得了长足的进步。
图像着色是图像处理中一个重要的任务,它可以将灰度图像转化为色彩丰富的彩色图像,使人们能够更好地理解和感受图像所传达的信息。
Colorful image colorization算法是一种基于深度学习的方法,利用神经网络模型实现自动化的图像着色过程。
通过训练大量数据集,算法可以学习到图像中不同区域之间的颜色关系,并生成与原始灰度图像相匹配的彩色版本。
该算法在计算机视觉、数字媒体和艺术设计等领域具有广泛应用前景。
1.2 文章结构本文首先会对colorful image colorization算法进行概述,介绍其基本原理和实现方式。
然后详细解释算法的输入与输出,并说明其核心原理。
接下来,在第三部分中会对算法进行详细解释和说明,包括预处理步骤、网络架构以及数据训练与优化策略。
第四部分将介绍实验结果与评估方法,包括数据集的选择和准备、定量评估指标和方法,以及对实验结果进行分析和讨论。
最后,本文将总结全文内容并给出相关结论。
1.3 目的本文的目的是全面阐述colorful image colorization算法的原理和实现。
通过对该算法进行概述和解释说明,读者可以充分了解其基本原理、输入输出以及核心实现方式。
同时,通过对算法进行详细解释和优化策略说明,读者可以了解到如何使用该算法进行图像着色,并在实际应用中取得良好效果。
最后,通过对实验结果与评估的介绍,读者可以对该算法在不同场景下的表现有一个全面的了解。
2. colorful image colorization算法原理:2.1 算法概述:colorful image colorization算法是一种将黑白图像转化为彩色图像的技术。
印刷电路板彩色图像分割算法研究
印刷电路板彩色图像分割算法研究摘要:针对印刷电路板图像颜色种类较少,色彩不连续且边界变化较快,并且焊盘层和碳路层与背景颜色差别较大,而线路层和背景颜色比较接近的特征,提出了一种阈值分割方法。
该方法基于hsi 颜色空间,针对不同对象进行分割时,根据其特点,采用不同的方法计算阈值进行分割。
关键词:图像分割;阈值;颜色空间;印刷电路板中图分类号:tp391 文献标识码:a 文章编号:1009-3044(2013)15-3634-03在印刷电路板(printed circuit board,pcb)缺陷自动检测系统中,图像处理软件是重要的核心部分,它包括图像预处理、图像分割、缺陷检测和定位。
图像分割是图像分析处理软件的核心。
近年来,彩色图像分割[1]与边缘提取技术越来越为人们所重视,其中阈值法[2]是最具代表性的方法之一。
该文在对印刷电路板彩色图像的颜色特征进行分析后,发现印刷电路板图像颜色种类较少,色彩不连续且边界变化明显,且焊盘层和碳路层与背景色差别很大,而线路层和背景颜色比较接近.针对以上特征,本文提出了针对不同对象而采取不同方法的一种阈值分割方法。
1 颜色空间转由于目前数码设备采集到的pcb图像是rgb图像,但在彩色图像处理的中,由于hsi颜色空间更接近人眼对颜色的感知,也与物体本身的特性有关,因此,该文pcb图像分割是在hsi空间进行。
从rgb到shi的转换关系为[3]:2 颜色量化本文研究的印刷电路板彩色图像单层裸板,其图像是由有限块区域组成,并且相同区域内颜色相似相近,实际需要处理的颜色数目较少,因此本文采用颜色量化的方法将相似相近的颜色归类处理。
量化后,图像由不超过256种颜色所组成。
3 pcb图像分割算法利用上述方法将rgb图像转换成hsi图像后,分别对电路板上的焊盘、线路以及碳线层进行分隔,具体方法如下:3.1 焊盘的双阈值分割算法标准焊盘显金黄色,其图像在hsi空间下色调s的范围为17—32,hsi空间上下限为固定值,因此可以利用双阈值对其进行分割。
灰度分割和彩色分割的方法

灰度分割和彩色分割的方法灰度分割和彩色分割是数字图像处理中常用的两种分割方法。
灰度分割是指将一幅灰度图像分成若干个区域,每个区域内的像素灰度值相同或者相似。
而彩色分割则是将一幅彩色图像按照颜色特征进行分割,得到不同的颜色区域。
在数字图像处理中,图像的分割是一个非常重要的步骤,它可以将复杂的图像转化成易于处理和理解的部分。
灰度分割和彩色分割都是基于不同特征进行图像区域划分的方法。
对于灰度图像,灰度值代表了每个像素点的亮度等级。
因此,可以通过比较不同区域内的灰度值来实现图像的灰度分割。
常见的方法包括阈值法、区域生长法、边缘检测法等。
阈值法是最简单且最常用的一种方法。
它基于一个预设阈值将图像划分为两个部分:高于阈值和低于阈值。
这种方法适用于背景与前景差异明显、噪声较少、目标物体与背景颜色差异大的情况。
但是,阈值的选择需要根据具体情况进行调整,否则可能会出现目标物体被分割成多个部分或者背景被误判为目标物体等问题。
区域生长法是一种基于像素相似性的方法。
它从一个或多个种子点开始,将像素按照相似性逐步合并成一个区域。
该方法可以自动选择合适的阈值,并且能够处理噪声和图像中存在的小尺寸目标物体。
但是,该方法容易受到图像中存在的灰度不均匀和重叠目标物体等因素的影响。
边缘检测法则是通过检测图像中不同区域之间的边缘来实现分割。
常见的方法包括Sobel算子、Canny算子、Laplacian算子等。
这种方法对于目标物体边缘清晰、背景复杂、噪声较多等情况有很好的效果。
对于彩色图像,由于每个像素点包含了RGB三个通道的信息,因此彩色分割需要考虑颜色特征。
常见的方法包括基于颜色空间变换、基于聚类分析和基于纹理特征等。
基于颜色空间变换的方法是将彩色图像转换到另一个颜色空间中,例如HSV、YCbCr等。
然后通过对某个通道进行阈值分割或者区域生长等操作来实现图像分割。
基于聚类分析的方法则是将彩色图像中的像素点按照颜色特征进行聚类,得到不同的颜色区域。
外文翻译---特征空间稳健性分析:彩色图像分割
附录2:外文翻译Robust Analysis of Feature Spaces: Color ImageSegmentationAbstractA general technique for the recovery of significant image features is presented. The technique is based on the mean shift algorithm, a simple nonparametric procedure for estimating density gradients. Drawbacks of the current methods (including robust clustering) are avoided. Feature space of any nature can be processed, and as an example, color image segmentation is discussed. The segmentation is completely autonomous, only its class is chosen by the user. Thus, the same program can produce a high quality edge image, or provide, by extracting all the significant colors, a preprocessor for content-based query systems. A 512 512 color image is analyzed in less than 10 seconds on a standard workstation. Gray level images are handled as color images having only the lightness coordinate.Keywords:robust pattern analysis, low-level vision, content-based indexing1 IntroductionFeature space analysis is a widely used tool for solving low-level image understanding tasks. Given an image, feature vectors are extracted from local neighborhoods and mapped into the space spanned by their components. Significant features in the image then correspond to high density regions in this space. Feature space analysis is the procedure of recovering the centers of the high density regions, i.e., the representations of the significant image features. Histogram based techniques, Hough transform are examples of the approach.When the number of distinct feature vectors is large, the size of the feature space is reduced by grouping nearby vectors into a single cell.A discretized feature space is called an accumulator. Whenever the size of the accumulator cell is not adequate for the data, serious artifacts can appear. The problem was extensively studied in the context of the Hough transform, e.g.. Thus, for satisfactory results a feature space should have continuous coordinate system. The content of a continuous feature space can be modeled as a sample from a multivariate, multimodal probability distribution. Note that for real images the number of modes can be very large, of the order of tens.The highest density regions correspond to clusters centered on the modes of the underlying probability distribution. Traditional clustering techniques, can be used for feature space analysis but they are reliable only if the number of clusters is small and known a priori. Estimating the number of clusters from the data is computationally expensive and not guaranteed to produce satisfactory result.A much too often used assumption is that the individual clusters obey multivariate normal distributions, i.e., the feature space can be modeled as a mixture of Gaussians. The parameters of the mixture are then estimated by minimizing an error criterion. For example, a large class ofthresholding algorithms are based on the Gaussian mixture model of the histogram, e.g.. However, there is no theoretical evidence that an extracted normal cluster necessarily corresponds to a significant image feature. On the contrary, a strong artifact cluster may appear when several features are mapped into partially overlapping regions.Nonparametric density estimation avoids the use of the normality assumption. The two families of methods, Parzen window, and k-nearest neighbors, both require additional input information (type of the kernel, number of neighbors). This information must be provided by the user, and for multimodal distributions it is difficult to guess the optimal setting.Nevertheless, a reliable general technique for feature space analysis can be developed using a simple nonparametric density estimation algorithm. In this paper we propose such a technique whose robust behavior is superior to methods employing robust estimators from statistics.2 Requirements for RobustnessEstimation of a cluster center is called in statistics the multivariate location problem. To be robust, an estimator must tolerate a percentage of outliers, i.e., data points not obeying the underlying distribution of the cluster. Numerous robust techniques were proposed, and in computer vision the most widely used is the minimum volume ellipsoid (MVE) estimator proposed by Rousseeuw.The MVE estimator is affine equivariant (an affine transformation of the input is passed on to the estimate) and has high breakdown point (tolerates up to half the data being outliers). The estimator finds the center of the highest density region by searching for the minimal volume ellipsoid containing at least h data points. The multivariate location estimate is the center of this ellipsoid. To avoid combinatorial explosion a probabilistic search is employed. Let the dimension of the data be p.A small number of (p+1) tuple of points are randomly chosen. For each (p+1) tuple the mean vector and covariance matrix are computed, defining an ellipsoid. The ellipsoid is inated to include h points, and the one having the minimum volume provides the MVE estimate.Based on MVE, a robust clustering technique with applications in computer vision was proposed in. The data is analyzed under several \resolutions" by applying the MVE estimator repeatedly with h values representing fixed percentages of the data points. The best cluster then corresponds to the h value yielding the highest density inside the minimum volume ellipsoid. The cluster is removed from the feature space, and the whole procedure is repeated till the space is not empty. The robustness of MVE should ensure that each cluster is associated with only one mode of the underlying distribution. The number of significant clusters is not needed a priori.The robust clustering method was successfully employed for the analysis of a large variety of feature spaces, but was found to become less reliable once the number of modes exceeded ten. This is mainly due to the normality assumption embedded into the method. The ellipsoid defining a cluster can be also viewed as the high confidence region of a multivariate normal distribution. Arbitrary feature spaces are not mixtures of Gaussians and constraining the shape of the removed clusters to be elliptical can introduce serious artifacts. The effect of these artifacts propagates as more and more clusters are removed. Furthermore, the estimated covariance matrices are not reliable since are based on only p + 1 points. Subsequent post processing based on all the points declared inliers cannot fully compensate for an initial error.To be able to correctly recover a large number of significant features, the problem of feature space analysis must be solved in context. In image understanding tasks the data to be analyzed originates in the image domain. That is, the feature vectors satisfy additional, spatial constraints. While these constraints are indeed used in the current techniques, their role is mostly limited to compensating for feature allocation errors made during the independent analysis of the feature space. To be robust the feature space analysis must fully exploit the image domain information.As a consequence of the increased role of image domain information the burden on the feature space analysis can be reduced. First all the significant features are extracted, and only after then are the clusters containing the instances of these features recovered. The latter procedure uses image domain information and avoids the normality assumption.Significant features correspond to high density regions and to locate these regions a search window must be employed. The number of parameters defining the shape and size of the window should be minimal, and therefore whenever it is possible the feature space should be isotropic. A space is isotropic if the distance between two points is independent on the location of the point pair. The most widely used isotropic space is the Euclidean space, where a sphere, having only one parameter (its radius) can be employed as search window. The isotropy requirement determines the mapping from the image domain to the feature space. If the isotropy condition cannot be satisfied, a Mahalanobis metric should be defined from the statement of the task.We conclude that robust feature space analysis requires a reliable procedure for the detection of high density regions. Such a procedure is presented in the next section.3 Mean Shift AlgorithmA simple, nonparametric technique for estimation of the density gradient was proposed in 1975 by Fukunaga and Hostetler. The idea was recently generalized by Cheng.Assume, for the moment, that the probability density function p(x) of the p-dimensional feature vectors x is unimodal. This condition is forS of radius r, sake of clarity only, later will be removed. A sphereXcentered on x contains the feature vectors y such thatr x y ≤-. The expected value of the vector x y z -=, given x and X S is[]()()()()()dy S y p y p x y dy S y p x y S z E X X S X S X X ⎰⎰∈-=-==μ (1) If X S is sufficiently small we can approximate()()X S X V x p S y p =∈,where p S r c V X ⋅= (2)is the volume of the sphere. The first order approximation of p(y) is()()()()x p x y x p y p T∇-+= (3) where ()x p ∇ is the gradient of the probability density function in x. Then()()()()⎰∇--=X X S S Tdy x p x p V x y x y μ (4) since the first term vanishes. The value of the integral is()()x p x p p r ∇+=22μ (5) or[]()()x p x p p r x S x x E X ∇+=-∈22 (6) Thus, the mean shift vector, the vector of difference between the local mean and the center of the window, is proportional to the gradient of the probability density at x. The proportionality factor is reciprocal to p(x). This is beneficial when the highest density region of the probability density function is sought. Such region corresponds to large p(x) and small ()x p ∇, i.e., to small mean shifts. On the other hand, low density regions correspond to large mean shifts (amplified also by small p(x) values). The shifts are always in the direction of the probability density maximum, the mode. At the mode the mean shift is close to zero. This property can be exploited in a simple, adaptive steepest ascent algorithm.Mean Shift Algorithm1. Choose the radius r of the search window.2. Choose the initial location of the window.3. Compute the mean shift vector and translate the search window by that amount.4. Repeat till convergence.To illustrate the ability of the mean shift algorithm, 200 data points were generated from two normal distributions, both having unit variance. The first hundred points belonged to a zero-mean distribution, the second hundred to a distribution having mean 3.5. The data is shown as a histogram in Figure 1. It should be emphasized that the feature space is processed as an ordered one-dimensional sequence of points, i.e., it is continuous. The mean shift algorithm starts from the location of the mode detected by the one-dimensional MVE mode detector, i.e., the center of the shortest rectangular window containing half the data points. Since the data is bimodal with nearby modes, the mode estimator fails and returns a location in the trough. The starting point is marked by the cross at the top of Figure 1.Figure 1: An example of the mean shift algorithm.In this synthetic data example no a priori information is available about the analysis window. Its size was taken equal to that returned by the MVE estimator, 3.2828. Other, more adaptive strategies for setting the search window size can also be defined.Table 1: Evolution of Mean Shift AlgorithmIn Table 1 the initial values and the final location,shown with a star at the top of Figure 1, are given.The mean shift algorithm is the tool needed for feature space analysis. The unimodality condition can be relaxed by randomly choosing the initial location of the search window. The algorithm then converges to the closest high density region. The outline of a general procedure is given below.Feature Space Analysis1. Map the image domain into the feature space.2. Define an adequate number of search windows at random locations in the space.3. Find the high density region centers by applying the mean shift algorithm to each window.4. Validate the extracted centers with image domain constraints to provide the feature palette.5. Allocate, using image domain information, all the feature vectors to the feature palette.The procedure is very general and applicable to any feature space. In the next section we describe a color image segmentation technique developed based on this outline.4 Color Image SegmentationImage segmentation, partioning the image into homogeneous regions, is a challenging task. The richness of visual information makes bottom-up, solely image driven approaches always prone to errors. To be reliable, the current systems must be large and incorporate numerous ad-hoc procedures, e.g.. The paradigms of gray level image segmentation (pixel-based, area-based, edge-based) are also used for color images. In addition, the physics-based methods take into account information about the image formation processes as well. See, for example, the reviews. The proposed segmentation technique does not consider the physical processes, it uses only the given image, i.e., a set of RGB vectors. Nevertheless,can be easily extended to incorporate supplementary information about the input. As homogeneity criterion color similarity is used.Since perfect segmentation cannot be achieved without a top-down, knowledge driven component, a bottom-up segmentation technique should ·only provide the input into the next stage where the task is accomplished using a priori knowledge about its goal; and·eliminate, as much as possible, the dependence on user set parameter values.Segmentation resolution is the most general parameter characterizing a segmentation technique. Whilethis parameter has a continuous scale, three important classes can be distinguished.Undersegmentation corresponds to the lowest resolution. Homogeneity is defined with a large tolerance margin and only the most significant colors are retained for the feature palette. The region boundaries in a correctly undersegmented image are the dominant edges in the image.Oversegmentation corresponds to intermediate resolution. The feature palette is rich enough that the image is broken into many small regions from which any sought information can be assembled under knowledge control. Oversegmentation is the recommended class when the goal of the task is object recognition.Quantization corresponds to the highest resolution.The feature palette contains all the important colors in the image. This segmentation class became important with the spread of image databases, e.g.. The full palette, possibly together with the underlying spatial structure, is essential for content-based queries.The proposed color segmentation technique operates in any of the these three classes. The user only chooses the desired class, the specific operating conditions are derived automatically by the program.Images are usually stored and displayed in the RGB space. However, to ensure the isotropy of the feature space, a uniform color space with the perceived color differences measured by Euclidean distances should be used. We have chosen the***v u L space, whose coordinates are related to the RGB values by nonlinear transformations. The daylight standard 65D was used as reference illuminant. The chromatic information is carried by *u and *v , while the lightness coordinate *L can be regarded as the relative brightness. Psychophysical experiments show that ***v u L space may not be perfectly isotropic, however, it was found satisfactory for image understanding applications. The image capture/display operations also introduce deviations which are most often neglected.The steps of color image segmentation are presented below. The acronyms ID and FS stand for image domain and feature space respectively. All feature space computations are performed in the ***v u L space.1. [FS] Definition of the segmentation parameters.The user only indicates the desired class of segmentation. The class definition is translated into three parameters·the radius of the search window, r;·the smallest number of elements required for a significant color, min N ;·the smallest number of contiguous pixels required for a significant image region, con N .The size of the search window determines the resolution of the segmentation, smaller values corresponding to higher resolutions. The subjective (perceptual) definition of a homogeneous region seems to depend on the “visual activity” in the image. Within the same segmentation class an image containing large homogeneous regions should be analyzed at higher resolution than an image with many textured areas. The simplest measure of the “visual activity” can be derived from the global covariance matrix. The square root of its trace,σ, is related to the power of the signal(image). The radius r is taken proportional to σ. The rules defining the three segmentation class parameters are given in Table 2. These rules were used in the segmentation of a large variety images, ranging from simple blood cells to complex indoor and outdoorscenes.When the goal of the task is well defined and/or all the images are of the same type, the parameters can be fine tuned.Table 2: Segmentation Class Parameters2. [ID+FS] Definition of the search window.The initial location of the search window in the feature space is randomly chosen. To ensure that the search starts close to a high density region several location candidates are examined. The random sampling is performed in the image domain and a few, M = 25, pixels are chosen. For each pixel, the mean of its 3⨯3 neighborhood is computed and mapped into the feature space. If the neighborhood belongs to a larger homogeneous region, with high probability the location of the search window will be as wanted. To further increase this probability, the window containing the highest density of feature vectors is selected from the M candidates.3. [FS] Mean shift algorithm.To locate the closest mode the mean shift algorithm is applied to the selected search window. Convergence is declared when the magnitude of the shift becomes less than 0.1.4. [ID+FS] Removal of the detected feature.The pixels yielding feature vectors inside the search window at its final location are discarded from both domains. Additionally, their 8-connected neighbors in the image domain are also removed independent of the feature vector value. These neighbors can have “strange” colors due to the image formation process and their removal cleans the background of the feature space. Since all pixels are reallocated in Step 7, possible errors will be corrected.5. [ID+FS] Iterations.Repeat Steps 2 to 4, till the number of feature vectors in the selectedN.search window no longer exceedsmin6. [ID] Determining the initial feature palette.In the feature space a significant color must be based on minimumN vectors. Similarly, to declare a color significant in the image minN pixels of that color should belong to a connected domain more thanmincomponent. From the extracted colors only those are retained for theinitial feature palette which yield at least one connected component inN. The neighbors removed at Step 4 are the image of size larger thanminalso considered when defining the connected components Note that the N which is used only at the post processing stage. threshold is notcon7. [ID+FS] Determining the final feature palette.The initial feature palette provides the colors allowed whensegmenting the image. If the palette is not rich enough the segmentationresolution was not chosen correctly and should be increased to the nextclass. All the pixel are reallocated based on this palette. First, thepixels yielding feature vectors inside the search windows at their finallocation are considered. These pixels are allocated to the color of thewindow center without taking into account image domain information. Thewindows are then inflated to double volume (their radius is multiplied with p32). The newly incorporated pixels are retained only if they have at least one neighbor which was already allocated to that color. The mean of the feature vectors mapped into the same color is the value retained for the final palette. At the end of the allocation procedure a small number of pixels can remain unclassified. These pixels are allocated to the closest color in the final feature palette.8. [ID+FS] Postprocessing.This step depends on the goal of the task. The simplest procedure is the removal from the image of all small connected components of size less N.These pixels are allocated to the majority color in their 3⨯thancon3 neighborhood, or in the case of a tie to the closest color in the feature space.In Figure 2 the house image containing 9603 different colors is shown. The segmentation results for the three classes and the region boundaries are given in Figure 5a-f. Note that undersegmentation yields a good edge map, while in the quantization class the original image is closely reproduced with only 37 colors. A second example using the oversegmentation class is shown in Figure 3. Note the details on the fuselage.5 DiscussionThe simplicity of the basic computational module, the mean shift algorithm, enables the feature space analysis to be accomplished very fast. From a 512⨯512 pixels image a palette of 10-20 features can be extracted in less than 10 seconds on a Ultra SPARC 1 workstation. To achieve such a speed the implementation was optimized and whenever possible, the feature space (containing fewer distinct elements than the image domain) was used for array scanning; lookup tables were employed instead of frequently repeated computations; direct addressing instead of nested pointers; fixed point arithmetic instead of floating point calculations; partial computation of the Euclidean distances, etc.The analysis of the feature space is completely autonomous, due to the extensive use of image domain information. All the examples in this paper, and dozens more not shown here, were processed using the parameter values given in Table 2. Recently Zhu and Yuille described a segmentation technique incorporating complex global optimization methods(snakes, minimum description length) with sensitive parameters and thresholds. To segment a color image over a hundred iterations were needed. When the images used in were processed with the technique described in this paper, the same quality results were obtained unsupervised and in less than a second. The new technique can be used un modified for segmenting gray levelimages, which are handled as color images with only the*L coordinates. In Figure 6 an example is shown.The result of segmentation can be further refined by local processing in the image domain. For example, robust analysis of the pixels in a large connected component yields the inlier/outlier dichotomy which then can be used to recover discarded fine details.In conclusion, we have presented a general technique for feature space analysis with applications in many low-level vision tasks like thresholding, edge detection, segmentation. The nature of the feature space is not restricted, currently we are working on applying the technique to range image segmentation, Hough transform and optical flow decomposition.255⨯ pixels, 9603 colors.Figure 2: The house image, 192(a)(b)Figure 3: Color image segmentation example.512⨯ pixels, 77041 colors. (b)Oversegmentation: (a)Original image, 51221/21 colors.(a ) (b ) Figure 4: Performance comparison.(a) Original image, 261116 pixels, 200 colors. (b) Undersegmentation:5/4 colors. Region boundaries.(a)(b)(c)(d)(e)(f)Figure 5: The three segmentation classes for the house image. The right column shows the region boundaries.(a)(b) Undersegmentation. Number of colors extracted initially and in thefeature palette: 8/8.(c)(d) Oversegmentation: 24/19 colors. (e)(f) Quantization: 49/37 colors.(a)(b)(c)Figure 6: Gray level image segmentation example. (a)Original image,256 pixels.256(b) Undersegmenta-tion: 5 gray levels. (c) Region boundaries.特征空间稳健性分析:彩色图像分割摘要本文提出了一种恢复显著图像特征的普遍技术。
彩色图像分割介绍
第一章绪论计算机图像处理在医学领域的应用越来越广泛,白细胞图像的自动判断就是其中的代表之一。
它能有效地减少主观干扰,提高工作效率,减轻医生负担。
近些年来,计算机硬件技术和光谱成像技术的飞速发展,使得成功研制开发出小型实用的基于多光谱的白细胞图像自动分类识别系统成为可能。
本文研究的主要目的在于对白细胞多光谱图像分割进行初步的探索研究,为系统中其后的白细胞能够准确地分类识别奠定基础。
本章简要阐述了基于多光谱的白细胞图像分割的应用背景和研究意义,回顾了国内外细胞图像分割和多光谱遥感图像分类的研究发展状况,并简要介绍了本论文的主要工作。
§1.1 概述§1.1.1 白细胞检验白细胞的光学显微镜检查是医院临床检验项目之一,特别是对各种血液病的诊断占有极其重要的地位。
它的任务是观察或测定血液中的各种白细胞的总数、相对比值、形态等,用于判断有无疾病、疾病种类以及严重程度等,特别是对类似白血病这类血液病诊断具有更加重要的意义。
白细胞分类计数的传统方法是将血液制成涂片,染色后,临床医生在显微镜下用肉眼按照有关标准,如核的形状、细胞浆的量和颜色,细胞浆颗粒的大小和颜色,整个细胞形状、稀薄与细胞间的接触等,来观察和检查这样的细胞标本[1]。
然而这项工作十分繁重,工作效率低,容易误判,且人工识别误差随检查人员而异。
同时通过观察的细胞数目较少,从统计的角度看,因样本集较小而影响诊断结果的可靠性。
计算机图像处理与分析技术伴随着信息技术的不断进步在最近20年间得到了飞速的发展,已经迅速渗透到人类生活和社会发展的各个方面,这为智能化细胞分析仪代替人工方法提供了基础。
因此,借助于现代计算机技术结合临床医生的实践经验,采用图像处理技术对图像进行处理,从而对细胞进行识别,对于医学科研与实践,以及临床诊断方面有着现实意义和非常广阔的前景。
目前已经制成的自动白细胞分析仪主要有两种类型:一类是用组织化学染色法,通过连续流动的系统,以光电效应的方式分别数出单一细胞,并可同时报告白细胞总数、各类细胞的百分率和绝对值。
背景自适应的GrabCut图像分割算法

背景自适应的GrabCut图像分割算法杨绍兵;李磊民;黄玉清【摘要】图割用于图像分割需用户交互,基于激光雷达传感器,提出了阈值法得到目标的外截矩形,再映射到图像完成交互.针对GrabCut算法耗时、对局部噪声敏感和在复杂背景提取边缘不理想等缺点,提出了背景自适应的GrabCut算法,即在确定背景像素中选取可能目标像素邻近的一部分像素作为背景像素,使背景变得简单,尤其适用于前景像素在整幅图中所占比例较小和在目标像素周围的背景相对简单的情况.实验结果表明,所提算法与GrabCut算法相比,减少了图的节点数,降低了错误率,有效的提高了运行效率,提取的目标边缘信息更加完整、平滑.【期刊名称】《计算机系统应用》【年(卷),期】2017(026)002【总页数】5页(P174-178)【关键词】图像分割;GrabCut算法;高斯混合模型;激光雷达;背景自适应【作者】杨绍兵;李磊民;黄玉清【作者单位】西南科技大学信息工程学院,绵阳621010;西南科技大学研究生院,绵阳621010;西南科技大学信息工程学院,绵阳621010【正文语种】中文图像分割是图像处理和计算机视觉领域的基础, 图像分割的算法数量众多, 其中, 图割作为一种结合图像边缘信息和纹理信息鲁棒的能量最小化方法, 得到越来越多的重视, 广泛的应用于图像分割、机器视觉等领域.2001年Yuri Y Boykov和Maric -PierrJolly[1]首次证实了离散能量函数的全局最优化能有效地用于N-D 图像的精确目标提取, 并提出了一种交互式的基于能量最小化的二值图割算法, 利用最大流/最小割算法得到全局最优解[2]. 许多学者对构建颜色空间、纹理形状以及信息模型和能量函数进行了改进, Han等[3]使用多维非线性结构颜色特征取代GMM(Gaussian Mixture Model).2004年, Rother等[4]提出GrabCut算法, 是目前目标提取最好的方法之一. Poullot等[5]提出将GrabCut用于视频无监督的前景分割, 取得了很好的效果. 针对GrabCut耗时的缺陷, 文献[6]提出用分水岭分割把像素聚成超像素, 提高分割效率; 文献[7]提出了降低原图像的分辨率来加快收敛速度; 周良芬等[8]人采用分水岭降低了错误率且提高了运行效率. Hua等[9]采用感兴趣区域(ROI)提高算法的准确率. 目前GrabCut在工程应用很少, 主要因为图割算法GMM模型的迭代求解过程复杂, 运算量大, 而且图割是一种交互式分割算法, 需要借助其他传感器, 为算法提供交互信息. 针对以上两个问题本文提出了一种用激光雷达来实现用户交互的背景自适应的GrabCut分割算法.Rother等[4]提出了Grab Cut算法在Graph cut 基础上做了一下几个方面改进: 首先, 利用RGB三通道GMM取代灰度直方图来描述背景像素和前景像素的分布; 其次, 利用迭代求取GMM中的各参数取代一次估计完成能量函数最小化; 最后, 通过非完全标记方法, 用户只需框选可能前景区域就可完成交互.1.1 相关Graph Cut分割算法设G=(V,E)为一个无向图, 其中V是一个有限非空的节点集合, E为一个无序节点对集合的边集, 给定的待分割的图像I, 要分割出目标和背景, 通过用户交互或者其他传感器的信息确定前景和背景的种子后, 可以对应构建两个特殊的终端节点: 源节点S和汇节点T, P为像素映射成图的节点集合, 则V=(S,T)∪P. 分割后, 源节点S 和目标节点相连, 汇节点T则和背景节点相连如图1(c). 要转换成对边加权的图G,将图像I每个像素映射成G中的一个节点, 像素之间的关系用图G中边的权重表示. 边分为两种, 终端节点S和T分别与像素节点连接、像素节点与像素节点连接, 分别对应的t-links和n-links.给每个像素pi一个二值标号li∈{0,1}, 其中0代表背景背景像素, 1代表目标像素, 则标号向量L={l1,l2…,lN}为二值分割结果. 边的权重(代价)既要考虑两端点所对应像素的位置, 也要考虑像素间的灰度差. 为了获得最优的二值分割结果定义一个λ加权的区域项R(L)和边界项B(L)的组合:其中:数据项中, Rp(0)为像素p为目标的代价, Rp(1)为像素p为背景的代价; 在边界项中, 如果像素p和q同属于目标或者背景, 则对应边的代价F(p,q)比较大; 如果不属于同类, 则F(p,q)较小. 综上所述, 边集E中各个边的权重(代价函数)如表1所示. Boykov[1,2]的交互式分割过程如图1所示, (a)为一个的二维图像, 将其映射为图G 得到(b)图, 其中B像素表示背景种子, O表示前景种子, 由区域项表达式(2)得到t-links, 边界项表达式(3)得到n-links. 采用最大流/最小割得到最优解.1.2 GrabCut算法原理GrabCut采用RGB颜色空间模型, 在文献[10]中用K个高斯分量(一般K=5)的全协方差GMM来分别对目标和背景建模. 存在一个向量K=(k1,…kn…kN), kn表示第n个像素的高斯分量. GrabCut采用迭代过程使目标和背景GMM的参数更优, 能量函数最小; 此外, GrabCut的交互更为简单, 只需要框出可能目标像素, 其他的视为背景像素即只需要提供框的两个斜对角坐标就能完成交互能量函数定义为式(5), 其中U(L,θ,z)为区域项, 表示一个像素被归类为目标或者背景的惩罚; V(L,z)为边界项两个像素不连续的惩罚. D(ln,kn,θ,zn)为第n个像素对应的混合高斯建模后归为前景或者背景的惩罚.GrabCut算法步骤:初始化:(1) 用户直接框选可能目标得到初始的trimap T. 框外全为背景像素TB,框内为TU, 且有.(2) 当n∈TB则ln=0, 当n∈TU则ln=1.(3) 根据前景和背景的标号, 就可以估计各自的GMM参数.迭代最小化:(1) 为每个像素分配GMM的高斯分量:(2) 从给定的图像数据z中, 学习优化GMM参数:(3) 采用能量最小化进行分割估计:(4) 重复上面步骤, 直到收敛.GrabCut需要用户交互, 在实际工程运用中, 我们需借助其他传感器的信息. 本文采用32线激光雷达完成GrabCut所需的交互信息. 激光雷达和CCD(Charge-coupled Device)的标定不是本文重点内容, 因此假定激光雷达和CCD标定已经完成, 激光雷达和CCD图像的像素建立了映射关系.如图2为激光对凹和凸障碍物检测的原理图, H为激光雷达相对地面的高度, W为凹障碍物的宽度, p1, p2, p3, p4在一条线上激光雷达扫描与地面相交的四个点, θ1, θ2, θ3为激光的发射角, 当激光雷达参数一定时θ=θ1=θ2=θ3; D为激光雷达到p1的距离, θ一定时, 随着D越大, 激光雷达两线之间的水平距离越远, 也就是说分辨率越低, 则自主机器人(如挖掘机)作业时精度不够, 因此我们把激光雷达的信息和CCD图像信息进行融合, 借助图像信息提高精度.如图3所示, I为一幅RGB图, 图中小矩形代表一个像素, 深色部分为检测到的障碍物, 外部的矩形框为所需的交互信息, 由图可知完成算法交互只需求出矩形的斜对角两个坐标(x1,y1)和(x2,y2). 激光雷达主要的作用是检测障碍物并返回可能目标框的两点坐标.在获取雷达数据后, 本文采用项志宇等[10]提出的算法, 首先进行数据滤波, 数据滤波包含两个步骤. 首先, 距离值大于一定阈值的数据点认为是不可靠的点, 直接丢弃; 再采用窗口大小为3的中值滤波除去噪声点. 数据滤波后, 把相互之间距离差在一定的阈值范围内的数据点聚成快团. 当得到障碍物的大体轮廓后, 采用外截矩形, 再映射到图像得到图3中的两个坐标(x1,y1)和(x2,y2), 完成交互.针对GrabCut算法耗时、在复杂背景提取边缘不理想等缺点, 提出了背景自适应的GrabCut算法. 图割解决图像分割问题时, 需要将图像转化为网络图, 图像较大G的节点较多, 计算量变大, 因此我们可以根据可能目标像素的个数来自适应背景像素, 这样不仅减少了图G的节点数, 而且也使背景变得更加简单, 背景的GMM 更有效, 分割效果更好.图4为背景自适应的GrabCut算法原理, 其中I为RGB图像, 深色部分为障碍物. 在为改进之前, U为可能目标像素, 为背景像素, 交互时只需得到(x1,y1)和(x2,y2)两个坐标, 再分别进行GMM, 可求得各像素属于目标或者背景的概率. 改进后, 就可以得到U为可能目标像素, 图中两个矩形框之间的像素集合B为背景像素. 在得到(x1,y1)和(x2,y2)两个坐标, 背景我们在此基础上横轴扩展m个像素, 纵轴扩展n个像素得到B, 设I大小为m0x n0的一副图像, 则:可得到约束条件:改进后的背景根据前景的变化而变化, 从而改变了GrabCut的初始化.初始化:(1) 通过激光雷达得到(x1,y1)和(x2,y2)两个坐标, 以两个坐标画一个矩形得到U, 则矩形内为可能目标像素, 得到初始的trimap T, 框内为TU, (x1-m,y1-n)和(x2+m,y2+n)两个坐标所得的矩形框内和的差集得到TB.(2) 当n∈TB则ln=0, 当n∈TU则ln=1.(3) 根据前景和背景的标号, 就可以估计各自的GMM参数.本文选择了不同背景下的3幅图, 将改进的算法和文献[4]提出的GrabCut算法进行对比分析. 实验PC配置为2.4GHz的Intel双核CPU4G内存, 在windows平台下, 采用Visual Studio 2012配置opencv2.4.9, m和n的值的选取尽量让确定背景像素(两个矩形框之间的像素)单一, 这样GMM参数更优, 分割效果更好. 在自动交互的情况下, 通过实验并考虑实时性和分割效果, 得到式(8)中的m和n的值. 当然, 这里仅仅适用一般情况训练所得到的结果, 对于在特殊环境, 还需进一步实验得到参数m和n的值.图5中, 图像背景较为复杂且光照较暗, 目标邻近背景相对单一且前景和背景像素区分度不大. (b)为文献[4]提出的算法分割效果较差, 边缘不完整, 人的下半身和头部信息丢失; (c)为本文提出的算法, 分割的目标更加准确, 边缘完整, 目标信息没有丢失.图6为背景相对单一分割的效果图, (b)和(c)分割的目标信息没有丢失信息都完整, 本文算法边缘信息更光滑.图7为草地上的分割结果, (b)和(c)总体来讲分割效果都比较好, 但由于头部周围背景相对复杂一些, 所以本文提出的算法分割的边缘更为细致.本文采用错误率error和分割时间两个定量指标对图像分割结果进行客观评价. 假设理想分割后目标像素数量为N0, 此处用人工手动分割取代理论上的理想分割, N1为采用其他算法分割后目标像素个数, 则可得到:由表2对比可知, error显著的减少, 由于在图5中, 前景像素周围的背景像素单一, 所以分割错误率减少的最多; 由分割时间对比可知, 改进的算法提高了运行效率, 图5采用本文算法运行时间减少的最多, 而图7减少的时间最少, 可以看出本文提出的算法更加适用于前景像素在整幅的像素所占比例较少的情况.综上所述, 从实时性和错误率来分析, 本文的算法提取的目标更加高效、省时, 尤其在背景较复杂和前景像素在整幅图的像素所占比例较少时, 本文的算法分割的边缘更加光滑、细致, 更加节省时间.针对在工程实现中, GrabCut算法分割时需用户交互确定部分背景和可能前景像素, 本文提出了对激光雷达信息采用阈值法得到两个坐标信息, 再映射到图像完成交互. 针对GrabCut的局限性, 本文提出了背景自适应的GrabCut自动分割算法, 背景根据可能前景像素的变化而变化, 减少了背景像素, 从而减少了图的节点数, 分割时间显著的减少. 此外, 通过减少背景像素同时也可以剪除复杂的背景, GMM建模效果更有效, 错误率降低到3.5%以内, 分割的目标细节更丰富, 提取的目标更完整, 同时获得更细致、平滑的边缘, 通过算法分割效果分析、错误率和时间开销比较, 有效的说明了本文算法的优越性.1 Boykov YY, Jolly MP. Interactive graph cuts for optimal boundary & region segmentation of objects in N-D images. Proc. 8th IEEE International Conference on Computer Vision, 2001(ICCV 2001). IEEE. 2001.105–112.2 Boykov Y, Kolmogorov V. An experimental comparison of min-cut/max-flow algorithms for energy minimization in vision. Tissue Engineering, 2005, 11(12): 1631–1639.3 Sezgin M, Sankur B. Survey over image thresholding techniques and quantitative performance evaluation. Journal of Electronic Imaging, 2004.4 Rother C, Kolmogorov V, Blake A. “GrabCut”: Interactive foreground extraction using iterated graph cuts. ACM Trans. on Graphics, 2004, 23(3): 307–312.5 Poullot S, Satoh S. VabCut: A video extension of GrabCut for unsupervised video foreground object segmentation. InternationalConference on Computer Vision Theory and Applications. IEEE. 2014. 362–371.6 徐秋平,郭敏,王亚荣.基于分水岭变换和图割的彩色图像快速分割.计算机工程,2009,35(19):210–212.7 丁红,张晓峰.基于快速收敛Grabcut的目标提取算法.计算机工程与设计,2012,33(4):1477–1481.8 周良芬,何建农.基于GrabCut改进的图像分割算法.计算机应用,2013,33(1):49–52.9 Hua S, Shi P. GrabCut color image segmentation based on region of interest. International Congress on Image and Signal Processing. IEEE. 2014.10 项志宇.针对越野自主导航的障碍物检测系统.东南大学学报:自然科学版,2005,(A02):71–74.。
HSV空间中彩色图像处理研究

HSV空间中彩色图像处理研究目录摘要 (I)Abstract (II)引言 (1)1. 绪论 (2)1.1 研究现状和存在的意义 (2)1.2图像分割的定义及常见方法 (3)1.2.1图像分割的定义: (3)1.2.2图像分割的常见方法: (4)1.3 本文的内容安排 (8)2. 颜色空间 (10)2.1常用的颜色空间介绍 (10)2.1.1颜色空间的定义: (10)2.2.2各种常见颜色空间的模型 (10)2.2 颜色空间的选择 (15)3 HSV颜色空间的图像分割 (17)3.1概述 (17)3.2HSV空间介绍及常见转化 (17)3.3 Sobel算子边缘提取及其它常见边缘提取方式介绍 (20)3.3.1Sobel算子边缘提取 (20)3.3.2其它几种常见边缘提取方法 (21)3.4.区域生长与合并 (22)3.4.1种子区的选取 (22)3.4.2区域生长与合并 (24)第4章.实验结果与分析 (25)第5章总结和展望 (28)致谢 (29)参考文献 (30)摘要自从图像处理技术走进数字化时代,彩色图像的研究就成为图像领域一项重要的技术同时也是一项艰难的技术。
但是目前彩色图像分割面临两个主要问题: 选取合适的色彩空间; 选择恰当的分割方法。
同时,在彩色图像的分割过程中,很少有自动算法能够取得非常理想的效果。
许多彩色图像分割方法不仅把灰度图像分割方法( 如直方图阈值法、聚类、区域增长、边缘检测、模糊方法、经元网络等) 应用于不同的色彩空间,而且可以直接应用于每个颜分量上,其结果再通过一定的方式进行组合即可获得最后的分割结果效果不佳。
针对上述彩色图像分割存在的问题,为了准确提取彩色图像中所需的色度信息,本文结合HSV 色彩空间3 个分量的无关性,提出了一种基于HSV 空间彩色图像分割算法,将图像的颜色值从RGB 空间转换到HSV 空间,并在目前的彩色分割方法研究的基础上,提出了一种另外的彩色图像分割算法,即合理结合边缘提取、区域生长和区域合并的方法,实现彩色图像的分割。
一种改进Grabcut算法的彩色图像分割方法
0 引言
作 为 目 标 识 别 的 基 础 ,图 像 分 割 是 计 算 机 视 觉 领 域 一 个 基 础 、重 要 的 环 节 。 分 割 效 果 对 于 后 续 特 征 提 取 及 分 类 识别有很大影响。因此提高分割精度和效率具有十分重 要的意义。
图像分割方法众多,其中 K-means 算法、分水岭算法和 Grabcut 算 法 应 用 比 较 广 泛 。 2004 年 ,Blake 等[1]使 用 高 斯 混 合 模 型 对 图 像 前 景 和 背 景 进 行 建 模 ,利 用 图 像 颜 色 信 息 实 现 彩 色 图 像 分 割 。 Rother 等[2]提 出 Grabcut 算 法 ,利 用 彩
类算法与 Grabcut 函数的方法改善以上问题。该方法通过直方图均衡化实现图像增强,然后利用 K-means 算法
以二分类的形式对像素进行聚类,利用形态学处理填充孔洞,自动获取目标物体轮廓后,结合 Grabcut 算法实现
图 像 二 次 分 割 ,最 后 利 用 颜 色 判 定 改 善 图 像 阴 影 部 分 。 实 验 结 果 表 明 ,该 方 法 可 实 现 图 像 自 动 分 割 、节 省 大 量
An Improved Grabcut Algorithm for Color Image Segmentation
WANG Gao1,YU Shen-liang2,JU Zhi-yong1,MA Su-ping1 (1. College of Photo-electricity and Computer Engineering,Shanghai University of Technology;
时间,而且对阴影部分图像处理有明显改善,具有较高的准确性和高效性。
灰度分割和彩色分割的方法

灰度分割和彩色分割的方法灰度分割和彩色分割是图像处理领域中常用的两种分割方法。
本文将对这两种方法进行详细介绍和比较。
一、灰度分割灰度分割是指将一幅彩色图像转换为灰度图像,即每个像素点的颜色只有一个灰度值。
灰度值的计算可以根据像素的RGB值来进行,常用的计算公式是将RGB值的平均值作为灰度值。
通过灰度分割,可以将彩色图像转换为灰度图像,减少图像的复杂度,方便后续处理。
灰度分割的步骤如下:1. 读取彩色图像,获取图像的宽度和高度。
2. 对每个像素点的RGB值进行计算,得到灰度值。
3. 将灰度值赋给对应的像素点,生成灰度图像。
4. 保存灰度图像。
灰度分割的优点是简单易实现,不需要太多的计算和处理,适用于一些简单的图像处理任务。
但是,灰度分割会丢失图像的颜色信息,对于一些需要保留颜色信息的任务,效果不理想。
二、彩色分割彩色分割是指将一幅彩色图像根据颜色进行分割,即将图像中不同颜色的区域分开。
彩色分割常用的方法有基于阈值的分割、基于区域的分割和基于边缘的分割等。
1. 基于阈值的分割:根据像素的颜色值与预设的阈值进行比较,将颜色值在阈值范围内的像素点划分为同一区域。
这种方法适用于颜色分布比较集中的图像。
2. 基于区域的分割:将图像划分为若干个区域,每个区域具有相似的颜色特征。
可以使用聚类算法如K-means进行区域划分。
这种方法适用于颜色分布比较复杂的图像。
3. 基于边缘的分割:通过检测图像的边缘来进行分割,边缘是指灰度变化明显的地方。
可以使用边缘检测算法如Canny算法进行边缘检测。
这种方法适用于图像边缘比较清晰的情况。
彩色分割的优点是可以保留图像的颜色信息,适用于一些需要对颜色进行分析和处理的任务。
但是,彩色分割的实现较为复杂,需要考虑颜色的分布特征和算法的选择。
三、灰度分割和彩色分割的比较灰度分割和彩色分割有各自的优点和适用场景。
灰度分割简单易实现,适用于一些简单的图像处理任务,但是会丢失图像的颜色信息。
基于局部优先的彩色图像分割算法
基于局部优先的彩色图像分割算法张琦;陈金勇;帅通【期刊名称】《无线电工程》【年(卷),期】2016(046)008【摘要】In view of unfavorable clustering effect and high computational complexity for color image segmentation,a novel algo⁃rithm which can supply effective color image segmentation is proposed in this paper.The algorithm is only used for processing and opera⁃tion of small regions,thus significantly improving the computational complexity and the quality of image segmentation.Meanwhile,the local priority is defined,consideringthe lightness and other detailed information of small regions in order to reduce the probability of generating some inappropriate partitioning when constructing the graph by using only the lightness information ofpixels.The experimental results show that this algorithm has better image segmentation effect.%针对彩色图像分割聚类算法效果不理想以及计算复杂度较高的问题,提出了一种有效的彩色图像分割算法。
- 1、下载文档前请自行甄别文档内容的完整性,平台不提供额外的编辑、内容补充、找答案等附加服务。
- 2、"仅部分预览"的文档,不可在线预览部分如存在完整性等问题,可反馈申请退款(可完整预览的文档不适用该条件!)。
- 3、如文档侵犯您的权益,请联系客服反馈,我们会尽快为您处理(人工客服工作时间:9:00-18:30)。
Color Image Segmentation Based onMean Shift and Normalized CutsWenbing Tao,Hai Jin,Senior Member,IEEE,andYimin Zhang,Senior Member,IEEEAbstract—In this correspondence,we develop a novel approach that provides effective and robust segmentation of color images.By incor-porating the advantages of the mean shift(MS)segmentation and the normalized cut(Ncut)partitioning methods,the proposed method requires low computational complexity and is therefore very feasible for real-time image segmentation processing.It preprocesses an image by using the MS algorithm to form segmented regions that preserve the desirable discontinuity characteristics of the image.The segmented regions are then represented by using the graph structures,and the Ncut method is applied to perform globally optimized clustering.Because the number of the segmented regions is much smaller than that of the image pixels, the proposed method allows a low-dimensional image clustering with significant reduction of the complexity compared to conventional graph-partitioning methods that are directly applied to the image pixels.In addition,the image clustering using the segmented regions,instead of the image pixels,also reduces the sensitivity to noise and results in enhanced image segmentation performance.Furthermore,to avoid some inappro-priate partitioning when considering every region as only one graph node, we develop an improved segmentation strategy using multiple child nodes for each region.The superiority of the proposed method is examined and demonstrated through a large number of experiments using color natural scene images.Index Terms—Color image segmentation,graph partitioning,mean shift (MS),normalized cut(Ncut).I.I NTRODUCTIONImage segmentation is a process of dividing an image into different regions such that each region is nearly homogeneous,whereas the union of any two regions is not.It serves as a key in image analysis and pattern recognition and is a fundamental step toward low-level vision, which is significant for object recognition and tracking,image re-trieval,face detection,and other computer-vision-related applications [1].Color images carry much more information than gray-level ones [24].In many pattern recognition and computer vision applications,the color information can be used to enhance the image analysis process and improve segmentation results compared to gray-scale-based ap-proaches.As a result,great efforts have been made in recent years to investigate segmentation of color images due to demanding needs. Existing image segmentation algorithms can be generally classified into three major categories,i.e.,feature-space-based clustering,spa-tial segmentation,and graph-based approaches.Feature-space-based clustering approaches[12],[13]capture the global characteristics of the image through the selection and calculation of the image features, which are usually based on the color or texture.By using a specific distance measure that ignores the spatial information,the feature Manuscript received August3,2006;revised December10,2006.This work was supported by the National Natural Science Foundation of China under Grant60603024.This paper was recommended by Associate Editor I.Bloch. W.Tao and H.Jin are with the Cluster and Grid Computing Laboratory, School of Computer Science and Technology,Huazhong University of Science and Technology,Wuhan430074,China,and also with the Service Computing Technology and System Laboratory,School of Computer Science and Technol-ogy,Huazhong University of Science and Technology,Wuhan430074,China (e-mail:wenbingtao@;hjin@).Y.Zhang is with the Center for Advanced Communications,Villanova University,Villanova,PA19085USA(e-mail:yimin.zhang@). Color versions of one or more of thefigures in this paper are available online at .Digital Object Identifier10.1109/TSMCB.2007.902249samples are handled as vectors,and the objective is to group them into compact,but well-separated clusters[7].Although the data clustering approaches are efficient infinding salient image features,they have some serious drawbacks as well.The spatial structure and the detailed edge information of an image are not preserved,and pixels from disconnected regions of the image may be grouped together if their feature spaces overlap.Given the importance of edge information,as well as the need to preserve the spatial relation-ship between the pixels on the image plane,there is a recent tendency to handle images in the spatial domain[11],[28].The spatial segmen-tation method is also referred to as region-based when it is based on region entities.The watershed algorithm[19]is an extensively used technique for this purpose.However,it may undesirably produce a very large number of small but quasi-homogenous regions.Therefore,some merging algorithm should be applied to these regions[20],[28]. Graph-based approaches can be regarded as image perceptual grouping and organization methods based on the fusion of the feature and spatial information.In such approaches,visual group is based on several key factors such as similarity,proximity,and continuation[3], [5],[21],[25].The common theme underlying these approaches is the formation of a weighted graph,where each vertex corresponds to n image pixel or a region,and the weight of each edge connecting two pixels or two regions represents the likelihood that they belong to the same segment.The weights are usually related to the color and texture features,as well as the spatial characteristic of the corresponding pixels or regions.A graph is partitioned into multiple components that minimize some cost function of the vertices in the components and/or the boundaries between those components.So far,several graph cut-based methods have been developed for image segmentations[8], [14],[22],[23],[27],[30],[31].For example,Shi and Malik[23] proposed a general image segmentation approach based on normalized cut(Ncut)by solving an eigensystem,and Wang and Siskind[8] developed an image-partitioning approach by using a complicated graph reduction.Besides graph-based approaches,there are also some other types of image segmentation approaches that mix the feature and spatial information[4],[29].This correspondence concerns a Ncut method in a large scale. It has been empirically shown that the Ncut method can robustly generate balanced clusters and is superior to other spectral graph-partitioning methods,such as average cut and average association[23]. The Ncut method has been applied in video summarization,scene detection[17],and cluster-based image retrieval[18].However,image segmentation approaches based on Ncut,in general,require high computation complexity and,therefore,are not suitable for real-time processing[23].An efficient solution to this problem is to apply the graph representation strategy on the regions that are derived by some region segmentation method.For example,Makrogiannis et al.[20] developed an image segmentation method that incorporates region-based segmentation and graph-partitioning approaches.This method first produces a set of oversegmented regions from an image by using the watershed algorithm,and a graph structure is then applied to represent the relationship between these regions.Not surprisingly,the overall segmentation performance of the region-based graph-partitioning approaches is sensitive to the region segmentation results and the graph grouping strategy.The inherent oversegmentation effect of the watershed algorithm used in[20]and [28]produces a large number of small but quasi-homogenous regions, which may lead to a loss in the salient features of the overall image and,therefore,yield performance degradation in the consequent region grouping.To overcome these problems,we propose in this correspondence a novel approach that provides effective and robust image segmentation1083-4419/$25.00©2007IEEEwith low computational complexity by incorporating the mean shift (MS)and the Ncut methods.In the proposed method,wefirst perform image region segmentation by using the MS algorithm[4],and we then treat these regions as nodes in the image plane and apply a graph structure to represent them.Thefinal step is to apply the Ncut method to partition these regions.The MS algorithm is a robust feature-space analysis approach[4] which can be applied to discontinuity preserving smoothing and image segmentation problems.It can significantly reduce the number of basic image entities,and due to the good discontinuity preservingfiltering characteristic,the salient features of the overall image are retained.The latter property is particularly important in the partitioning of natural images,in which only several distinct regions are used in representing different scenes such as sky,lake,sand beach,person,and animal, whereas other information within a region is often less important and can be neglected.However,it is difficult to partition a natural image into significative regions to represent distinct scenes,depending only on the MS segmentation algorithm.The main reason is that the MS algorithm is an unsupervised clustering-based segmentation method, where the number and the shape of the data cluster are unknown a priori.Moreover,the termination of the segmentation process is based on some region-merging strategy applied to thefiltered image result,and the number of regions in the segmented image is mainly determined by the minimum number of pixels in a region,which is denoted as M(i.e.,regions containing less than M pixels will be eliminated and merged into its neighboring region).In our proposed approach,therefore,an appropriate value of M is chosen to yield a good region representation in the sense that the number of segmented regions is larger than the number of typical scenes,but is much smaller than the number of pixels in the image,and the boundary information of the typical scenes is retained by the boundaries of the regions. The Ncut method[23],on the other hand,can be considered as a classification method.In most image segmentation applications,the Ncut method is applied directly to the image pixels,which are typically of very large size and thus require huge computational complexity. For example,to use the Ncut method in[26],a gray image has to be decimated into a size of160×160pixels or smaller.In summary,it is difficult to get real-time segmentation using the Ncut method.In the proposed method,the Ncut method is applied to the segmented regions instead of the raw image pixels.As such,it eliminates the major problem of the Ncut method that requires prohibitively high complexity.By applying the Ncut method to the preprocessed regions rather than the raw image pixels,the proposed method achieves a significant reduction of the computational cost and,therefore,renders real-time image segmentation much more practically implemental. On the other hand,due to some approximation in the implementation of the Ncut method,the segmentation processing of a graph exploiting the lower dimensional region-based weight matrix also provides more precise and robust partitioning performance compared to that based on the pixel-based weight matrix.This correspondence is organized as follows.In Section II,we introduce the background of the proposed method.In Section III,the proposed algorithm is described for effective color image partition-ing.In Section IV,we demonstrate the superiority of the proposed method by comparing the performance of the proposed approach to existing methods using a variety of color natural scene images.Finally, Section V concludes this correspondence.II.MS AND G RAPH P ARTITIONINGA.Image Region Segmentation Based on MSThe computational module based on the MS procedure is an ex-tremely versatile tool for feature-space analysis.In[4],two applica-tions of the feature-space analysis technique are discussed based on the MS procedure:discontinuity preservingfiltering and the segmentation of gray-level or color images.In this section,we present a brief review of the image segmentation method based on the MS procedure [4],[9],[10].We consider radially symmetric kernels satisfying K(x)= c k,d k( x 2),where constant c k,d>0is chosen such that ∞K(x)dx=∞c k,d k( x 2)dx=1[note that k(x)is defined only for x≥0].k(x)is a monotonically decreasing function and is referred to as the profile of the kernel.Given the function g(x)=−k (x)for profile,the kernel G(x)is defined as G(x)=c g,d g( x 2).For n data points x i,i=1,...,n,in the d-dimensional space R d,the MS is defined asm h,G(x)=ni=1x i gx−x i 2ni=1gx−x i 2−x(1)where x is the center of the kernel(window),and h is a bandwidth parameter.Therefore,the MS is the difference between the weighted mean,using kernel G as the weights and x as the center of the kernel (window).The MS method is guaranteed to converge to a nearby point where the estimate has zero gradient[4].Regions of low-density values are of no interest for the feature-space analysis,and in such regions,the MS steps are large.On the other hand,near local maxima,the steps are small,and the analysis is more refined.The MS procedure,thus,is an adaptive gradient ascent method[6].The center position of kernel G can be updated iteratively byy j+1=ni=1x i gy j−x ih2ni=1gy j−x ih2,j=1,2, (2)where y1is the center of the initial position of the kernel.Based on the above analysis,the MS imagefiltering algorithm can be obtained.First,an image is represented as a2-D lattice of p-dimensional vectors(pixels),where p=1for gray-level images, p=3for color images,and p>3for multispectral images.The space of the lattice is known as the spatial domain,while the graph level and the color of spectral information are represented in the range domain.For both domains,the Euclidean metric is assumed.Let x i and z i,i=1,...,n,respectively,be the d-dimensional(d=p+2) input and thefiltered image pixels in the joint spatial-range domain. The segmentation is actually a merging process performed on a region that is produced by the MSfiltering.The use of the MS seg-mentation algorithm requires the selection of the bandwidth parameter h=(h r,h s),which,by controlling the size of the kernel,determines the resolution of the mode detection.B.Spectral Graph PartitioningAmong many graph theoretic algorithms,spectral graph-partitioning methods have been successfully applied to many areas in computer vision,including motion analysis[16],image segmentation [8],[23],[27],[31],image retrieval[18],video summarization[17], and object recognition[15].In this correspondence,we use one of these techniques,namely,the Ncut method[23],for region clustering. Next,we briefly review the Ncut method based on the studies in[14], [23],and[27].Roughly speaking,a graph-partitioning method attempts to organize nodes into groups such that the intragroup similarity is high and theFig.1.(a)Original image.(b)Result image after using the MS segmentation algorithm.(c)Labeled regions.(d)RAGs produced by the node space relation,with a region corresponding to a node.(e)Final region-partitioning result using the Ncut method on the RAG in(d).intergroup similarity is low.Given a graph G=(V,E,W),where Vis the set of nodes,and E is the set of edges connecting the nodes.A pair of nodes u andνis connected by an edge and is weightedby w(u,ν)=w(ν,u)≥0to measure the dissimilarity between them.W is an edge affinity matrix with w(u,ν)as its(u,ν)th element.Thegraph can be partitioned into two disjoint sets A and B=V−Aby removing the edges connecting the two parts.The degree ofdissimilarity between the two sets can be computed as a total weight ofthe removed edges.This closely relates to a mathematical formulationof a cut[22]cut(A,B)=u∈A,ν∈Bw(u,ν).(3)This problem offinding the minimum cut has been well studied[22],[23],[27].However,the minimum cut criterion favors groupingsmall sets of isolated nodes in the graph because the cut definedin(3)does not contain any intragroup information[23].In otherwords,the minimum cut usually yields overclustered results when itis recursively applied.This motivates several modified graph partitioncriteria,including the Ncut[23]Ncut(A,B)=cut(A,B)assoc(A,V)+cut(A,B)assoc(B,V)(4)where assoc(A,V)denotes the total connection from nodes in A to all nodes in the graph,and asso(B,V)is similarly defined.Unlike the cut criterion that has a bias in favor of cutting small sets of nodes,the Ncut criterion is unbiased.III.P ROPOSED A PPROACHA.Description of the Algorithm SchemeWe now describe our proposed algorithm.From a data-flow point of view,the outline of the proposed algorithm can be characterized as the following.First,an image is segmented into multiple separated regions using the MS algorithm.Second,the graph representation of these regions is constructed,and the dissimilarity measure between the regions is defined.Finally,a graph-partitioning algorithm based on the Ncut is employed to form thefinal segmentation map.The regions produced by the MS segmentation can be represented by a planar weighted region adjacency graph(RAG)G=(V,E,W) that incorporates the topological information of the image structure and region connectivity.The majority of region-merging algorithms define the region dissimilarity metric as the distance between two adjacent regions in an appropriate feature space.This dissimilarity metric plays a decisive role in determining the overall performance of the image segmentation process.To define the measure of dissimilarity between neighboring regions,wefirst define an appropriate feature space.Features like color,texture,statistical characteristics,and2-D shape are useful for segmentation purposes and can be extracted from an image region.We adopt the color feature in this paper because it is usually the most dominant and distinguishing visual feature and adequate for a number of segmentation tasks.The average color components are computed over a region’s pixels and are described by a three-element color vector.When an image is segmented based on the MS method into n regions R i,i=1,...,n,the mean vector ¯XR i={¯x1i,¯x2i,¯x3i}is computed for each region,where¯x1i,¯x2i, and¯x3i are the mean pixel intensities of the i th region in the three different color spaces,respectively.Proper selection of the color spaces is important to the development of a good region-merging algorithm.To obtain meaningful segmentation results,the perceived color difference should be associated with the Euclidean distance in the color space.The spaces L∗u∗v∗and L∗a∗b∗have been particularly designed to closely approximate the perceptually uniform color spaces.In both cases,L∗, which is the lightness(relative brightness)coordinate,is defined in the same way.The two spaces differ only in the chromaticity coordinates, and in practice,there is no clear advantage of using one over the other. In this paper,we employed L∗u∗v∗motivated by its linear mapping property[2].By defining the color space,we can compute the weight matrix W of all regions.The weight w(u,ν)between regions u andνis defined asw(u,ν)=e−F(u)−F(ν) 22d I,if u andνare adjacent0,otherwise(5)where F(u)={L(u),u(u),v(u)}is the color vector of region u,and · 2denotes the vector norm operator.In addition,d I is a positive scaling factor that determines the sensitivity of w(u,ν)to the color difference between nodes u andν.Under a graph representation,region grouping can be naturally formulated as a graph-partitioning problem.In the proposed method, the Ncut algorithm is used to solve such a problem.The major difference between the proposed method and the conventional Ncut algorithm is that the construction of the weight matrix is based not on the pixels of the original image but rather on the segmentation result of the MS algorithm.The advantages of using regions instead of pixels in constructing the weight matrix are twofold:1)It offers a considerable reduction of computational complexity,since the number of basic image entities is by far smaller than that of the pixels.Thus,the size of the weight matrix and,subsequently,the complexity of the graphTABLE IW EIGHT M ATRIX W OF A LL R EGION N ODESFig. 2.(a)RAGs produced by the node space relations,with a regioncorresponding to three nodes.(b)Final region-partitioning result using theNcut method on the RAG in(a).(c)Partitioning result using the Ncut methodimplemented by Cour et al.[26].form thefirst cluster,regions3–5the second cluster,regions6–12thethird cluster,and regions13and14the fourth cluster.C.Segmentation Improvement Using Multiple Child NodesAlthough the graph-partitioning process merges the regions gener-ated by the MS algorithm into four clusters,thefinal region segmen-tation result in Fig.1(e)is not perfect because the sky and the topregion of the mountain near the sky are merged into the same cluster.The grouping of the other regions is not satisfactory either.It is wellFig.3.Test results of color images with partitioning class k=3in(a)and k=6in(b).(First column)The original test images.(Second column)The region segmentation results by the MS algorithm.The white lines show the contour boundaries of these regions,and the number of regions of the result image in each row of(a)and(b)(from top to bottom)is90,28,104,106,90,38,159,97,and66,respectively.(Third column)The contour images of thefinal region-merging results using the proposed method.(Fourth column)The original images overlapped with the contour of thefinal region-partitioning results.(Fifth column)The partitioning results by directly applying the Ncut method to the image pixels[26].The image size is240×160.known that the Ncut algorithms try tofind a“balanced partition”[23] of a weighted graph,and the cut does not have a bias in favor of cutting small sets of isolated nodes in the graph.Therefore,it is not surprising that the sky cannot be segmented out because it is only considered as a node of the weighted graph.An effective solution to this problem is to consider every region generated by the MS algorithm as multiple nodes rather than a single one.The child nodes of a region have the same feature value and are all adjacent with all the child nodes of the neighboring region.That is to say,there are edges between all the child nodes of two adjacentregions.The weights between the child nodes within a region areall one,whereas the weights between the child nodes between twoadjacent regions are all the same and equal to the weight betweenthe two regions.This yields a new weight matrix W C=W⊗1C, where⊗denotes the Kronecker product operator,and1C is the C×Cmatrix with all unit entries.In this experiment,we set the number ofchild nodes in each region to C=3,and the top-left12×12entriesof W C,which correspond to regions1–4as shown in bold fonts inFig.4.Test results of color images with the variable partitioning class.The partitioning class k of each row(from top to bottom)is4,6,8,10,and12,respectively. The number of regions of the result image in the second column is(from top to bottom)49,117,92,128,and98,respectively.The size of the image is160×240 for thefirst row and240×160for other rows.TABLE IIIC OMPARED C OMPUTATIONAL C OST B ETWEEN THE P ROPOSED M ETHOD AND THE Ncut M ETHODshows the segmentation results of the Ncut method implemented byCour et al.[26]where the sky is separated into two parts.IV.E XPERIMENTAL R ESULTSWe have applied the proposed algorithm for the segmentation of aset of color images with natural scenes.In this section,we present theexperimental results,indicating the different stages of the method.Thecontrastive experiment results using the Ncut method implemented byCour et al.[26]are also presented for comparison.The sizes of allthe test images are either240×160or160×240.The parametersof the MS segmentation algorithm are set to h=(h r,h s)=(6,8) and M=50.With this parameter setting,the number of the regionsproduced by the MS algorithm is less than200regions(i.e.,the RAGhas less than200nodes)for all the test images we used.Therefore,the dimension of the weight matrix is dramatically reduced from thenumber of image pixels to the number of regions,and subsequently,thecomplexity of the graph structure employed for image representationis also reduced.To retain the advantage of the balanced partition of theNcut method,we use C=3to construct the weight matrix W C.The test examples include three image sets.The results of thefirstset of examples are shown in Fig.3(a),where the partitioning classk is three.The results of the second set of examples are shown inFig.3(b),where k=6.The results of the third set of examples areshown in Fig.4with varying values of k.In eachfigure,thefivecolumns respectively show,from left to right,the original test image,the resultant image after applying the MS segmentation algorithm,the contour image of thefinal region partitioning,the original imagesoverlapped with thefinal partitioning contour,and the partitioningresult using the Ncut method implemented by Cour et al.[26].As discussed in Section III-C,considering a region produced by theMS algorithm as several identical child nodes can prevent the pixels inthis region from being divided into several parts when the Ncut methodis applied.For example,in the second row of Fig.3(a),the imageincludes thefisher in the foreground and the lake in the background.Therefore,an effective segmentation method should distinguish thefisher from the lake background.However,when the Ncut method isdirectly applied to the image pixels,the image is partitioned into threeregions where each region includes one part of the lake.If wefirstprocess the image using the MS segmentation algorithm,then the mostpixels of the lake background are formed into a region.The proposedmethod treats this region as several nodes with the identical charac-teristic and,as such,avoids partitioning the lake into several differentparts.The experimental results of the second andfifth rows in Fig.3(b)and the third andfifth rows in Fig.4also support the same claim.For all the experimental results shown in Figs.3and4,the proposedmethod effectively partitions the natural scenes into several mean-ingful regions and provides an improved performance compared tothe Ncut method,which does not always yield meaningful regions.Fig.3(a)shows images with relatively simple scene,and thus,a smallpartitioning class of k=3is chosen.The test sets in Figs.3(b)and4include more complicated color natural scenes,and thus,a larger valueof k is used.Finally,we consider the computational cost of the proposed methodand compare it with that of the Ncut method.A PC,which is equippedwith a2.0-GHz Pentium CPU and512-MB memory,is used.The maincomputational cost of the Ncut method is to compute the eigenvectorsof the source image.In the experiments used in this paper,the Ncutmethod[26]requires30–50s to compute the eigenvectors of the grayimage of240×160pixels.The computation of the proposed methodconsists of two sections.Thefirst section is to segment the original im-age using the MS segmentation algorithm,which takes approximately2s to process an image.The second section is to partition the region nodes produced by the MS segmentation algorithm using the Ncut method,which depends on the number of the initial region nodes and the requestedfinal regions.In the experiments performed in this paper, the number of the regions is less than200,and for C=3,the number of the child nodes is less than600.The computation of partitioning the regions using the Ncut method takes less than300ms.Table III compares the computational cost between the proposed method and the Ncut method for the images depicted in Figs.3and4.The significant reduction of the computational cost by using the proposed method is evident.Moreover,we notice that the MS algorithm is more feasible for parallel operations than the Ncut method because the complicated eigendecomposition problem in the Ncut method is difficult to be par-allelized.In the proposed method,the main computational cost is the region segmentation,whereas the computational cost of partitioning the region nodes using the Ncut method is negligibly small.Thus,the proposed method is more feasible to real-time image processing,such as content-based image retrieval,particularly when parallel processing is used.V.C ONCLUSIONIn this correspondence,we have developed a new algorithm for the segmentation of color images.The proposed algorithm takes the advantages of the MS segmentation method and the Ncut grouping method,whereas their drawbacks are avoided.The use of the MS method permits the formation of segments that preserve discontinuity characteristic of an image.On the other hand,the application of the region adjacent graph and Ncut methods to the resulting segments, rather than directly to the image pixels,yields superior image segmen-tation performance.The proposed method requires significantly lower computational complexity and,therefore,is feasible to real-time image processing.A CKNOWLEDGMENTThe authors would like to thank the anonymous reviewers for their valuable comments.R EFERENCES[1]N.Pal and S.Pal,“A review on image segmentation techniques,”PatternRecognit.,vol.26,no.9,pp.1277–1294,Sep.1993.[2]G.Wyszecki and W.S.Stiles,Color Science:Concepts and Methods,Quantitative Data and Formulae,2nd ed.New York:Wiley,1982.[3]G.Kanizsa,Grammatica del Vedere.Bologna,Italy,1980.[4]aniciu and P.Meer,“Mean shift:A robust approach toward featurespace analysis,”IEEE Trans.Pattern Anal.Mach.Intell.,vol.24,no.5, pp.603–619,May2002.[5]B.Caselles,B.Coll,and J.-M.Miorel,“A Kanisza programme,”Progr.Nonlinear Differential Equations Appl.,vol.25,pp.35–55,1996.[6]R.van den Boomgaard and J.van de Weijer,“On the equivalenceof local-modefinding,robust estimation and mean-shift analysis as used in early vision tasks,”in Proc.Int Conf.Pattern Recog.,2002, pp.30927–30930.[7]R.O.Duda,P.E.Hart,and D.G.Sork,Pattern Classification.New York:Wiley-Interscience,2000.[8]S.Wang and J.M.Siskind,“Image segmentation with ratio cut,”IEEETrans.Pattern Anal.Mach.Intell.,vol.25,no.6,pp.675–690,Jun.2003.[9]Y.Cheng,“Mean shift,mode seeking,and clustering,”IEEE Trans.Pat-tern Anal.Mach.Intell.,vol.17,no.8,pp.790–799,Aug.1995.[10]aniciu,“An algorithm for data-driven bandwidth selection,”IEEETrans.Pattern Anal.Mach.Intell.,vol.25,no.2,pp.281–288,Feb.2003.[11]V.Grau,A.U.J.Mewes,M.Alcaniz,R.Kikinis,and S.K.Warfield,“Improved watershed transform for medical image segmentation using prior information,”IEEE Trans.Image Process.,vol.23,no.4,pp.447–458,Apr.2004.[12]D.W.Jacobs,D.Weinshall,and Y.Gdalyahu,“Classification with non-metric distances:Image retrieval and class representation,”IEEE Trans.Pattern Anal.Mach.Intell.,vol.22,no.6,pp.583–600,Jun.2000.。