AIX性能问题诊断及调优
AIX性能下降检查解决案例
AIX性能下降检查解决案例(客户名称、时间、问题关键字)【处理时间】2016年8月1日【客户名称】华夏信用卡【主机信息】要有详细的硬件描述、数据库版本描述主机:IBM 、8205-E6D 四个Lpar分区操作系统:AIX 7100-03-05数据库:【业务系统】业务系统名称、有版本信息更好【关键字】Lpar、CPU折叠功能、性能优化。
关键字3个【处理人员】系统集成--刘党旗【问题说明】现象:对于使用共享CPU的AIX分区,当系统负载偏低时,基于JAVA的应用程序可能会被延迟执行,交易执行时间变长。
事件分析主要原因是在分区负载偏低时,AIX操作系统的CPU折叠功能只开启一个虚拟CPU,所有线程均被调度到该CPU 的第一个线程中。
解决方案可以通过HMC/ASMI设置,关闭操作系统的CPU折叠功能**折叠功能对系统的影响** 关闭CPUfolding的影响:关闭了系统内核对微分区环境的自动调度优化;所有的VP都会被调度到hypervisor,不管这些VP上是否有实际负载;更高的hypervisor延时,物理资源亲和度也可能受到影响。
** 关闭CPU folding的好处:对于分区sizing非常完美的情形下,比如EC:VP始终控制在不低于1:2,而且处理器池资源从未受限,这时关闭folding可能获得一定的性能收益(主要是通过减少VPM管理开销,以及避免unfold展开CPU 延迟)后续跟踪性能优化明显**折叠功能介绍虚拟处理器管理(VirtualProcessorManagement),也称之为处理器折叠技术(CPUFolding),是一项Power虚拟化特性,用于控制一个LPAR处理使用的VP(VirtualProcessor)数量。
按目前AIX的设置,默认对微分区(即共享处理器分区)开启了处理器折叠功能;而专有处理器分区(dedicatedLPAR)则默认关闭此功能。
处理器折叠技术的作用主要体现在两个方面:1)节能,如果一个物理核心对应的所有VP都处于被折叠状态PowerVMhypervisor可以将这颗核心置于低能耗状态。
topas

topas什么是topastopas是一个性能分析工具,它可以用来监视和诊断AIX操作系统上的性能问题。
topas可以显示当前系统的性能指标,例如CPU利用率、内存利用率、磁盘IO、网络流量等。
它还可以提供实时的数据,帮助用户了解系统的负载情况,发现性能瓶颈,并进行性能调优。
为什么需要topas在一个复杂的计算机系统中,性能问题常常是困扰用户的一个难题。
当系统出现性能瓶颈时,很可能会导致用户体验下降,甚至系统崩溃。
因此,及时发现和解决性能问题对于系统的稳定和可靠运行非常重要。
topas作为一个性能分析工具,为用户提供了实时的性能监控和分析功能,帮助用户快速定位和解决性能问题。
它可以帮助用户了解系统的负载情况,找出性能瓶颈,从而采取相应的措施进行性能优化。
topas的特点和优势1.实时性能监控:topas可以实时获取系统的性能指标,例如CPU利用率、内存利用率、磁盘IO、网络流量等。
用户可以通过一个终端界面实时查看这些指标的数值,从而了解系统的工作情况。
这对于性能监控和调优非常有帮助。
2.多种视图模式:topas提供了多种不同的视图模式,用于展示系统性能的不同方面。
例如,用户可以选择查看实时的性能指标,也可以查看历史的性能数据。
这些视图模式可以满足用户的不同需求,帮助用户更好地理解和分析系统的性能问题。
3.可定制性:topas可以根据用户的需求进行定制,用户可以选择显示哪些性能指标、设置数据刷新的频率等。
这使得topas非常灵活和可扩展,可以适应不同的应用场景。
4.用户友好性:topas的界面简单直观,易于使用。
用户可以通过键盘操作来切换视图模式、查看性能指标等。
这使得用户能够快速上手,快速定位和解决系统的性能问题。
topas的使用方法使用topas可以分为以下几个步骤:步骤一:启动topas在AIX操作系统中,可以通过在命令行中输入topas命令来启动topas。
启动后,topas将开始实时监控系统的性能指标,并在终端界面显示。
Tuxedo性能调优经验谈
Tuxedo性能调优经验谈Tuxedo 9.0 for AIX与Oracle 10 XA连接网友:chinakkee 发布于:2006.11.13 09:54(共有条评论) 查看评论| 我要评论系统说明TUXEDO版本:9.0 安装目录/opt/bea/tuxedo9.0ORACLE版本:10.2.0.1 安装目录/u01/app/oracle一、Tuxedo 9 for AIX的安装1、创建一个用户为Tuxedo,用户组为bea2、创建/opt/bea为tuxedo的安装目录,$mkdir /opt/bea$chown tuxedo.bea /opt/bea$chmod 770 /opt/bea#bootinfo -k64$ sh tuxedo9_aix53_64.bin -i consolePreparing to install...WARNING: /tmp does not have enough disk space!Attempting to use /home/tuxedo for install base and tmp dir.Extracting the JRE from the installer archive...Unpacking the JRE...Extracting the installation resources from the installer archive...Configuring the installer for this system's environment...Launching installer...Preparing CONSOLE Mode Installation...===================================================== ======Choose Locale...----------------->1- EnglishCHOOSE LOCALE BY NUMBER: 1===================================================== ======(created with InstallAnywhere by Zero G)-------------------------------------------------------------------------------===================================================== ======Introduction------------BEA End User Clickwrap 001205Copyright (c) BEA Systems, Inc.All Rights Reserved.DO YOU ACCEPT THE TERMS OF THIS LICENSE AGREEMENT? (Y/N): y===================================================== ======Choose Install Set------------------Please choose the Install Set to be installed by this installer.->1- Full Install2- Server Install3- Full Client Install4- Jolt Client Install5- ATMI Client Install6- CORBA Client Install7- Customize...ENTER THE NUMBER FOR THE INSTALL SET, OR PRESS TO ACCEPT THE DEFAULT : 1===================================================== ======Choose BEA Home---------------1- Create new BEA Home2- Use existing BEA HomeEnter a number: 21- /opt/beaExisting BEA Home directory: 1===================================================== ======Choose Product Directory------------------------1- Modify Current Selection (/opt/bea/tuxedo9.0)2- Use Current Selection (/opt/bea/tuxedo9.0)Enter a number: 2===================================================== ======Pre-Installation Summary------------------------Please Review the Following Before Continuing:Product Name:Tuxedo 9.0Install Folder:/opt/bea/tuxedo9.0Link Folder:/home/tuxedoDisk Space Information (for Installation Target):Required: 386,803,702 bytesAvailable: 2,625,392,640 bytesPRESS TO CONTINUE:===================================================== ======Ready To Install----------------InstallAnywhere is now ready to install Tuxedo 9.0 onto your system at thefollowing location:/opt/bea/tuxedo9.0PRESS TO INSTALL:===================================================== ======Installing...-------------[==================|==================|=============== =][------------------|------------------|------------------|------------------]===================================================== ======Configure tlisten Service-------------------------Password: tuxedoVerify Password: tuxedoPassword Accepted! Press "Enter" to continue.===================================================== ======SSL Installation Choice.------------------------Would you like to install SSL Support?->1- Yes2- NoENTER THE NUMBER FOR YOUR CHOICE, OR PRESS TO ACCEPT THE DEFAULT:: 2===================================================== ======License Installation Choice---------------------------Would you like to install your license now?->1- Yes2- NoENTER THE NUMBER FOR YOUR CHOICE, OR PRESS TO ACCEPT THE DEFAULT:: 2===================================================== ======Installation Complete---------------------Congratulations. Tuxedo 9.0 has been successfully installed to:/opt/bea/tuxedo9.0PRESS TO EXIT THE INSTALLER:安装完毕,需要把license文件重命名为lic.txt copy到$TUXDIR/udataobj/二、TUxedo 9 连接Oracle 10g配置前提是在Tuxedo 9 上安装Oracle 10g client还有安装C编译器(不一定要用Visual Age C/C+用户能够通过sqlplus连接oracle数据库1、ORACLE的的配置sqlplus[email=system@testcrm]system@testcrm[/email]SQL> @$ORACLE_HOME\rdbms\admin\xaview.sqlSQL>grant select on v$xatrans$ to public with grant option;SQL>grant select on v$pending_xatrans$ to public with grant option;SQL>grant select EMP to ScottSQL>GRANT SELECT ON DBA_PENDING_TRANSACTIONS TO Scott;注:scott默认为lock,需要用alter user scott account unlock,解锁。
优化AIX 7内存性能 第二部分 监视内存情况并分析结果【ps+sar+svmon +vmstat】

优化AIX 7内存性能第二部分监视内存的使用情况并分析其结果【ps+sar+svmon +vmstat】简介内存子系统调优中最重要的部分并不涉及实际的调优工作。
在对系统进行调优之前,必须弄清楚主机系统的实际运行情况。
要做到这一点,AIX® 7 管理员必须知道应该使用何种工具以及如何对将要捕捉的数据进行分析。
再次重申前面的调优文章(见 参考资料)中所介绍的原则:必须先监视主机,才能对系统进行正确地调优,无论它是作为逻辑分区 (LPAR) 运行还是在自己的物理服务器上运行。
可以使用许多命令来捕捉和分析数据,所以需要了解这些命令,以及其中的哪些命令最适合想要进行的工作。
在捕捉了数据之后,需要对结果进行分析。
有些问题初看起来像是 CPU 的问题,但是经过分析之后,可以诊断出是内存或 I/O 问题,前提是使用合适的工具捕捉数据并知道如何进行分析工作。
只有在正确地完成了这些工作之后,才可以考虑对系统进行实际的更改。
如果医生不了解病史和目前的症状,就无法诊治疾病;同样,也需要在优化子系统之前对其进行诊断。
如果在出现 CPU 或者 I/O 瓶颈的情况下对内存子系统进行优化,这将是毫无帮助的,甚至可能会影响主机的正常运行。
本文将帮助您理解正确地进行诊断的重要性。
您将看到,性能调优远不只是实际的调优工作本身。
在您将要学习的工具中,有一些是通用的监视工具,所有版本的 UNIX® 都提供这些工具,另外一些工具是专门为 AIX 7 编写的。
必须获得基准数据;这是已知环境的关键数据,调优决策都以此作为基础。
不要等到用户开始向服务台抱怨糟糕的性能时,才开始监视系统。
应该在将服务器投入生产环境中后尽快捕捉数据。
如果做到了这一点,那么就可以积极主动地进行调优,其目标是在用户指出问题之前找到它。
如果不了解系统正常运行时的数据,那么就无法确定所查看的数据是否表示存在性能问题。
这是所有适当的性能调优方法的一部分;必须有效地捕捉数据,并正确地分析结果和趋势。
aix 常用命令
aix 常用命令AIX常用命令AIX(Advanced Interactive eXecutive)是IBM公司的一款UNIX操作系统,广泛应用于企业级服务器系统中。
本文将介绍AIX 常用命令,帮助读者更好地理解和使用该操作系统。
一、系统管理命令1. whoami:查询当前登录用户的用户名;2. hostname:查看主机名;3. uname -a:显示系统的各种信息,如内核版本、硬件平台等;4. uptime:查看系统的运行时间和负载情况;5. date:显示当前日期和时间;6. topas:实时监控系统性能,包括CPU利用率、内存使用情况等;7. lparstat -i:显示LPAR(Logical Partition)信息,包括分区的配置和资源利用情况;8. lsdev:列出设备列表;9. errpt:查看系统错误日志,用于排查故障;10. ps -ef:显示当前系统的进程列表;11. mksysb:创建系统备份;12. bootlist:设置系统启动顺序。
二、文件和目录管理命令1. ls:列出当前目录下的文件和子目录;2. pwd:显示当前工作目录的路径;3. cd:切换工作目录;4. mkdir:创建新的目录;5. rm:删除文件或目录;6. cp:复制文件或目录;7. mv:移动文件或目录;8. find:按照指定条件查找文件;9. du:查看目录或文件的磁盘使用情况;10. df:显示文件系统的使用情况;11. cat:查看文件内容;12. vi:编辑文本文件。
三、用户和权限管理命令1. useradd:创建新用户;2. userdel:删除用户;3. passwd:修改用户密码;4. chuser:修改用户属性;5. chown:修改文件或目录的所有者;6. chmod:修改文件或目录的权限;7. chgrp:修改文件或目录的所属组;8. groups:查看用户所属的组;9. su:切换用户身份;10. visudo:编辑sudoers文件,配置用户的sudo权限。
AIX 性能调优
IBM TRAINING®A26AIX Performance TuningJaqui LynchLas Vegas, NVAIX Performance TuningUpdated Presentation will be at:/papers/pseries-a26-aug06.pdfJaqui LynchSenior Systems EngineerMainline Information SystemsAgenda•AIX v5.2 versus AIX v5.3•32 bit versus 64 bit •Filesystem Types•DIO and CIO•AIX Performance Tunables •Oracle Specifics •Commands•ReferencesNew in AIX 5.2•P5support•JFS2•Large Page support (16mb)•Dynamic LPAR•Small Memory Mode–Better granularity in assignment of memory to LPARs •CuOD•xProfiler•New Performance commands–vmo, ioo, schedo replace schedtune and vmtune •AIX 5.1 Status–Will not run on p5 hardware–Withdrawn from marketing end April 2005–Support withdrawn April 2006AIX 5.3•New in5.3–With Power5 hardware•SMT•Virtual Ethernet•With APV–Shared Ethernet–Virtual SCSI Adapter–Micropartitioning–PLMAIX 5.3•New in5.3–JFS2 Updates•Improved journaling•Extent based allocation•1tb filesystems and files with potential of 4PB•Advanced Accounting•Filesystem shrink for JFS2•Striped Columns–Can extend striped LV if a disk fills up•1024 disk scalable volume group–1024 PVs, 4096 LVs, 2M pps/vg•Quotas•Each VG now has its own tunable pbuf pool–Use lvmo commandAIX 5.3•New in5.3–NFSv4 Changes•ACLs–NIM enhancements•Security•Highly available NIM•Post install configuration of Etherchannel and Virtual IP –SUMA patch tool–Last version to support 32 bit kernel–MP kernel even on a UP–Most commands changed to support LPAR stats–Forced move from vmtune to ioo and vmo–Page space scrubbing–Plus lots and lots of other things32 bit versus 64 bit•32 Bit•Up to 96GB memory •Uses JFS for rootvg •Runs on 32 or 64 bit hardware •Hardware all defaults to 32 bit•JFS is optimized for 32 bit• 5.3 is last version of AIX with 32 bit kernel •64 bit•Allows > 96GB memory •Current max is 256GB (arch is 16TB) except 590/595 (1TB & 2TB)•Uses JFS2 for rootvg •Supports 32 and 64 bit apps•JFS2 is optimized for 64 bitFilesystem Types•JFS•2gb file max unless BF •Can use with DIO •Optimized for 32 bit •Runs on 32 bit or 64 bit •Better for lots of small file creates and deletes •JFS2•Optimized for 64 bit •Required for CIO •Can use DIO•Allows larger file sizes •Runs on 32 bit or 64 bit •Better for large files and filesystemsGPFSClustered filesystemUse for RACSimilar to CIO –noncached, nonblocking I/ODIO and CIO•DIO–Direct I/O–Around since AIX v5.1–Used with JFS–CIO is built on it–Effectively bypasses filesystem caching to bring data directlyinto application buffers–Does not like compressed JFS or BF (lfe) filesystems•Performance will suffer due to requirement for 128kb I/O –Reduces CPU and eliminates overhead copying data twice–Reads are synchronous–Bypasses filesystem readahead–Inode locks still used–Benefits heavily random access workloadsDIO and CIO•CIO–Concurrent I/O–Only available in JFS2–Allows performance close to raw devices–Use for Oracle dbf and control files, and online redo logs,not for binaries–No system buffer caching–Designed for apps (such as RDBs) that enforce writeserialization at the app–Allows non-use of inode locks–Implies DIO as well–Benefits heavy update workloads–Not all apps benefit from CIO and DIO –some arebetter with filesystem caching and some are saferthat wayPerformance Tuning•CPU–vmstat, ps, nmon•Network–netstat, nfsstat, no, nfso•I/O–iostat, filemon, ioo, lvmo•Memory–lsps, svmon, vmstat, vmo, iooNew tunables•Old way–Create rc.tune and add to inittab•New way–/etc/tunables•lastboot•lastboot.log•Nextboot–Use –p –o options–ioo–p –o options–vmo–p –o options–no –p –o options–nfso–p –o options–schedo-p –o optionsTuneables1/3•minperm%–Value below which we steal from computational pages -default is 20%–We lower this to something like 5%, depending on workload•Maxperm%–default is 80%–This is a soft limit and affects ALL file pages (including those in maxclient)–Value above which we always steal from persistent–Be careful as this also affects maxclient–We no longer tune this –we use lru_file_repage instead–Reducing maxperm stops file caching affecting programs that are running•maxclient–default is 80%–Must be less than or equal to maxperm–Affects NFS, GPFS and JFS2–Hard limit by default–We no longer tune this –we use lru_file_repage instead•numperm–This is what percent of real memory is currently being used for caching ALL file pages •numclient–This is what percent of real memory is currently being used for caching GPFS, JFS2 and NFS •strict_maxperm–Set to a soft limit by default –leave as is•strict_maxclient–Available at AIX 5.2 ML4–By default it is set to a hard limit–We used to change to a soft limit –now we do notTuneables2/3•maxrandwrt–Random write behind–Default is 0 –try 32–Helps flush writes from memory before syncd runs•syncd runs every 60 seconds but that can be changed–When threshhold reached all new page writes are flushed to disk–Old pages remain till syncd runs•Numclust–Sequential write behind–Number of 16k clusters processed by write behind•J2_maxRandomWrite–Random write behind for JFS2–On a per file basis–Default is 0 –try 32•J2_nPagesPerWriteBehindCluster–Default is 32–Number of pages per cluster for writebehind•J2_nRandomCluster–JFS2 sequential write behind–Distance apart before random is detected•J2_nBufferPerPagerDevice–Minimum filesystem bufstructs for JFS2 –default 512, effective at fs mountTuneables3/3•minpgahead, maxpgahead, J2_minPageReadAhead & J2_maxPageReadAhead–Default min =2 max = 8–Maxfree–minfree>= maxpgahead•lvm_bufcnt–Buffers for raw I/O. Default is 9–Increase if doing large raw I/Os (no jfs)•numfsbufs–Helps write performance for large write sizes–Filesystem buffers•pv_min_pbuf–Pinned buffers to hold JFS I/O requests–Increase if large sequential I/Os to stop I/Os bottlenecking at the LVM–One pbuf is used per sequential I/O request regardless of the number of pages–With AIX v5.3 each VG gets its own set of pbufs–Prior to AIX 5.3 it was a system wide setting•sync_release_ilock–Allow sync to flush all I/O to a file without holding the i-node lock, and then use the i-node lock to do the commit.–Be very careful –this is an advanced parameter•minfree and maxfree–Used to set the values between which AIX will steal pages–maxfree is the number of frames on the free list at which stealing stops (must be >=minfree+8)–minfree is the number used to determine when VMM starts stealing pages to replenish the free list–On a memory pool basis so if 4 pools and minfree=1000 then stealing starts at 4000 pages– 1 LRUD per pool, default pools is 1 per 8 processors•lru_file_repage–Default is 1 –set to 0–Available on >=AIX v5.2 ML5 and v5.3–Means LRUD steals persistent pages unless numperm< minperm•lru_poll_interval–Set to10–Improves responsiveness of the LRUD when it is runningNEW Minfree/maxfree•On a memory pool basis so if 4 pools andminfree=1000 then stealing starts at 4000pages•1 LRUD per pool•Default pools is 1 per 8 processors•Cpu_scale_memp can be used to changememory pools•Try to keep distance between minfree andmaxfree<=1000•Obviously this may differvmstat -v•26279936 memory pages•25220934 lruable pages•7508669 free pages• 4 memory pools•3829840 pinned pages•80.0 maxpin percentage•20.0 minperm percentage•80.0 maxperm percentage•0.3 numperm percentage All filesystem buffers•89337 file pages•0.0 compressed percentage•0 compressed pages•0.1 numclient percentage Client filesystem buffers only•80.0 maxclient percentage•28905 client pages•0 remote pageouts scheduled•280354 pending disk I/Os blocked with no pbuf LVM –pv_min_pbuf •0 paging space I/Os blocked with no psbuf VMM –fixed per page dev •2938 filesystem I/Os blocked with no fsbuf numfsbufs•7911578 client filesystem I/Os blocked with no fsbuf•0 external pager filesystem I/Os blocked with no fsbuf j2_nBufferPerPagerDevice •Totals since boot so look at 2 snapshots 60 seconds apart•pbufs, psbufs and fsbufs are all pinnedno -p -o rfc1323=1no -p -o sb_max=1310720no -p -o tcp_sendspace=262144no -p -o tcp_recvspace=262144no -p -o udp_sendspace=65536no -p -o udp_recvspace=655360nfso -p -o nfs_rfc1323=1nfso -p -o nfs_socketsize=60000nfso -p -o nfs_tcp_socketsize=600000vmo -p -o minperm%=5vmo -p -o minfree=960vmo -p -o maxfree=1088vmo -p -o lru_file_repage=0vmo -p -o lru_poll_interval=10ioo -p -o j2_maxPageReadAhead=128ioo -p -o maxpgahead=16ioo -p -o j2_maxRandomWrite=32ioo -p -o maxrandwrt=32ioo -p -o j2_nBufferPerPagerDevice=1024ioo -p -o pv_min_pbuf=1024ioo -p -o numfsbufs=2048ioo -p -o j2_nPagesPerWriteBehindCluster=32Increase the following if using raw LVMs (default is 9)Ioo –p –o lvm_bufvnt=12Starter Set of tunablesNB please test these before putting intoproduction vmstat -IIGNORE FIRST LINE -average since bootRun vmstat over an interval (i.e. vmstat 2 30)System configuration: lcpu=24 mem=102656MB ent=0kthr memory page faults cpu---------------------------------------------------------------------------r b avm fre re pi po fr sr cy in sy cs us sy id wa pc ec 56 1 18637043 7533530 0 0 0 0 0 0 4298 24564 986698 2 0 0 12.00 100.057 1 18643753 7526811 0 0 0 0 0 0 3867 25124 9130 98 2 0 0 12.00 100.0System configuration: lcpu=8 mem=1024MB ent=0.50kthr memory page faults cpu------------------------------------------------------------------------------r b p avm fre fi fo pi po fr sr in sy cs us sy id wa pc ec1 1 0 170334 968 96 163 0 0 190 511 11 556 662 1 4 90 5 0.03 6.81 1 0 170334 1013 53 85 0 0 107 216 7 268 418 02 92 5 0.02 4.4Pc = physical processors consumed –if using SPPEc = %entitled capacity consumed –if using SPPFre may well be between minfree and maxfreefr:sr ratio 1783:2949 means that for every 1783 pages freed 2949 pages had to be examined. ROT was 1:4 –may need adjustingTo get a 60 second average try: vmstat 60 2Memory and I/O problems•iostat–Look for overloaded disks and adapters•vmstat•vmo and ioo(replace vmtune)•sar•Check placement of JFS and JFS2 filesystems and potentially the logs•Check placement of Oracle or database logs•fileplace and filemon•Asynchronous I/O•Paging•svmon–svmon-G >filename•nmon•Check error logsioo Output•lvm_bufcnt= 9•minpgahead= 2•maxpgahead= 8•maxrandwrt = 32 (default is 0)•numclust= 1•numfsbufs= 186•sync_release_ilock= 0•pd_npages= 65536•pv_min_pbuf= 512•j2_minPageReadAhead = 2•j2_maxPageReadAhead = 8•j2_nBufferPerPagerDevice = 512•j2_nPagesPerWriteBehindCluster = 32•j2_maxRandomWrite = 0•j2_nRandomCluster = 0vmo OutputDEFAULTS maxfree= 128 minfree= 120 minperm% = 20 maxperm% = 80 maxpin% = 80 maxclient% = 80 strict_maxclient = 1 strict_maxperm = 0OFTEN SEEN maxfree= 1088 minfree= 960 minperm% = 10 maxperm% = 30 maxpin% = 80 Maxclient% = 30 strict_maxclient = 0 strict_maxperm = 0numclient and numperm are both 29.9So numclient-numperm=0 aboveMeans filecaching use is probably all JFS2/NFS/GPFSRemember to switch to new method using lru_file_repageiostatIGNORE FIRST LINE -average since bootRun iostat over an interval (i.e. iostat2 30)tty: tin tout avg-cpu: % user % sys % idle % iowait physc% entc0.0 1406.0 93.1 6.9 0.0 0.012.0 100.0Disks: % tm_act Kbps tps Kb_read Kb_wrtn hdisk1 1.0 1.5 3.0 0 3hdisk0 6.5 385.5 19.5 0 771hdisk14 40.5 13004.0 3098.5 12744 13264 hdisk7 21.0 6926.0 271.0 440 13412 hdisk15 50.5 14486.0 3441.5 13936 15036 hdisk17 0.0 0.00.00 0iostat–a AdaptersSystem configuration: lcpu=16 drives=15tty: tin tout avg-cpu: % user % sys % idle % iowait0.4 195.3 21.4 3.3 64.7 10.6Adapter: Kbps tps Kb_read Kb_wrtnfscsi1 5048.8 516.9 1044720428 167866596Disks: % tm_act Kbps tps Kb_read Kb_wrtn hdisk6 23.4 1846.1 195.2 381485286 61892408 hdisk9 13.9 1695.9 163.3 373163554 34143700 hdisk8 14.4 1373.3 144.6 283786186 46044360 hdisk7 1.1 133.5 13.8 628540225786128 Adapter: Kbps tps Kb_read Kb_wrtnfscsi0 4438.6 467.6 980384452 85642468Disks: % tm_act Kbps tps Kb_read Kb_wrtn hdisk5 15.2 1387.4 143.8 304880506 28324064 hdisk2 15.5 1364.4 148.1 302734898 24950680 hdisk3 0.5 81.4 6.8 3515294 16043840 hdisk4 15.8 1605.4 168.8 369253754 16323884 iostat-DExtended Drive Reporthdisk3 xfer: %tm_act bps tps bread bwrtn0.5 29.7K 6.8 15.0K 14.8Kread: rps avgserv minserv maxserv timeouts fails29.3 0.1 0.1784.5 0 0write: wps avgserv minserv maxserv timeouts fails133.6 0.0 0.3 2.1S 0 0 wait: avgtime mintime maxtime avgqsz qfull0.0 0.00.2 0.0 0iostat Otheriostat-A async IOSystem configuration: lcpu=16 drives=15aio: avgc avfc maxg maif maxr avg-cpu: % user % sys % idle % iowait150 0 5652 0 12288 21.4 3.3 64.7 10.6Disks: % tm_act Kbps tps Kb_read Kb_wrtnhdisk6 23.4 1846.1 195.2 381485298 61892856hdisk5 15.2 1387.4 143.8 304880506 28324064hdisk9 13.9 1695.9 163.3 373163558 34144512iostat-m pathsSystem configuration: lcpu=16 drives=15tty: tin tout avg-cpu: % user % sys % idle % iowait0.4 195.3 21.4 3.3 64.7 10.6Disks: % tm_act Kbps tps Kb_read Kb_wrtnhdisk0 1.6 17.0 3.7 1190873 2893501Paths: % tm_act Kbps tps Kb_read Kb_wrtnPath0 1.6 17.0 3.7 1190873 2893501lvmo•lvmo output••vgname= rootvg(default but you can change with –v)•pv_pbuf_count= 256–Pbufs to add when a new disk is added to this VG •total_vg_pbufs= 512–Current total number of pbufs available for the volume group.•max_vg_pbuf_count= 8192–Max pbufs that can be allocated to this VG•pervg_blocked_io_count= 0–No. I/O's blocked due to lack of free pbufs for this VG •global_pbuf_count= 512–Minimum pbufs to add when a new disk is added to a VG •global_blocked_io_count= 46–No. I/O's blocked due to lack of free pbufs for all VGslsps–a(similar to pstat)•Ensure all page datasets the same size although hd6 can be bigger -ensure more page space than memory–Especially if not all page datasets are in rootvg–Rootvg page datasets must be big enough to hold the kernel •Only includes pages allocated (default)•Use lsps-s to get all pages (includes reserved via early allocation (PSALLOC=early)•Use multiple page datasets on multiple disks –Parallelismlsps outputlsps-aPage Space Physical Volume Volume Group Size %Used Active Auto Typepaging05 hdisk9 pagvg01 2072MB 1 yes yes lvpaging04 hdisk5 vgpaging01 504MB 1 yes yes lvpaging02 hdisk4 vgpaging02 168MB 1 yes yes lvpaging01 hdisk3 vgpagine03 168MB 1 yes yes lvpaging00 hdisk2 vgpaging04 168MB 1 yes yes lvhd6 hdisk0 rootvg512MB 1 yes yes lvlsps-sTotal Paging Space Percent Used3592MB 1%Bad Layout aboveShould be balancedMake hd6 the biggest by one lp or the same size as the others in a mixedenvironment like thisSVMON Terminology•persistent–Segments used to manipulate files and directories •working–Segments used to implement the data areas of processesand shared memory segments•client–Segments used to implement some virtual file systems likeNetwork File System (NFS) and the CD-ROM file system•/infocenter/pseries/topi c/com.ibm.aix.doc/cmds/aixcmds5/svmon.htmsvmon-Gsize inuse free pin virtualmemory 26279936 18778708 7501792 3830899 18669057pg space 7995392 53026work pers clnt lpagepin 3830890 0 0 0in use 18669611 80204 28893 0In GB Equates to:size inuse free pin virtualmemory 100.25 71.64 28.62 14.61 71.22pg space 30.50 0.20work pers clnt lpagepin 14.61 0 0 0in use 71.22 0.31 0.15 0General Recommendations•Different hot LVs on separate physical volumes•Stripe hot LV across disks to parallelize•Mirror read intensive data•Ensure LVs are contiguous–Use lslv and look at in-band % and distrib–reorgvg if needed to reorg LVs•Writeverify=no•minpgahead=2, maxpgahead=16 for 64kb stripe size•Increase maxfree if you adjust maxpgahead•Tweak minperm, maxperm and maxrandwrt•Tweak lvm_bufcnt if doing a lot of large raw I/Os•If JFS2 tweak j2 versions of above fields•Clean out inittab and rc.tcpip and inetd.conf, etc for things that should not start–Make sure you don’t do it partially–i.e. portmap is in rc.tcpip and rc.nfsOracle Specifics•Use JFS2 with external JFS2 logs(if high write otherwise internal logs are fine)•Use CIO where it will benefit you–Do not use for Oracle binaries•Leave DISK_ASYNCH_IO=TRUE in Oracle•Tweak the maxservers AIO settings•If using JFS–Do not allocate JFS with BF (LFE)–It increases DIO transfer size from 4k to 128k–2gb is largest file size–Do not use compressed JFS –defeats DIOTools•vmstat –for processor and memory•nmon–/collaboration/wiki/display/WikiPtype/nmon–To get a 2 hour snapshot (240 x 30 seconds)–nmon-fT-c 30 -s 240–Creates a file in the directory that ends .nmon•nmon analyzer–/collaboration/wiki/display/WikiPtype/nmonanalyser–Windows tool so need to copy the .nmon file over–Opens as an excel spreadsheet and then analyses the data•sar–sar-A -o filename 2 30 >/dev/null–Creates a snapshot to a file –in this case 30 snaps 2 seconds apart •ioo, vmo, schedo, vmstat–v•lvmo•lparstat,mpstat•Iostat•Check out Alphaworks for the Graphical LPAR tool•Many many moreOther tools•filemon–filemon -v -o filename -O all–sleep 30–trcstop•pstat to check async I/O–pstat-a | grep aio| wc–l•perfpmr to build performance info forIBM if reporting a PMR–/usr/bin/perfpmr.sh300lparstatlparstat-hSystem Configuration: type=shared mode=Uncapped smt=On lcpu=4 mem=512 ent=5.0 %user %sys %wait %idle physc%entc lbusy app vcsw phint%hypv hcalls0.0 0.5 0.0 99.5 0.00 1.0 0.0 -1524 0 0.5 154216.0 76.3 0.0 7.7 0.30 100.0 90.5 -321 1 0.9 259Physc–physical processors consumed%entc–percent of entitled capacityLbusy–logical processor utilization for system and userVcsw–Virtual context switchesPhint–phantom interrupts to other partitions%hypv-%time in the hypervisor for this lpar–weird numbers on an idle system may be seen/infocenter/pseries/index.jsp?topic=/com.ibm.aix.doc/cmds/aixcmds3/lparstat.htmmpstatmpstat–sSystem configuration: lcpu=4 ent=0.5Proc1Proc00.27%49.63%cpu0cpu2cpu1cpu30.17%0.10% 3.14%46.49%Above shows how processor is distributed using SMTAsync I/OTotal number of AIOs in usepstat–a | grep aios| wc–lOr new way is:ps–k | grep aio| wc-l4205AIO max possible requestslsattr –El aio0 –a maxreqsmaxreqs4096 Maximum number of REQUESTS TrueAIO maxserverslsattr –El aio0 –a maxserversmaxservers 320 MAXIMUM number of servers per cpu TrueNB –maxservers is a per processor setting in AIX 5.3Look at using fastpathFastpath can now be enabled with DIO/CIOSee Session A23 by Grover Davidson for a lot more info on Async I/OI/O Pacing•Useful to turn on during backups (streaming I/Os)•Set high value to multiple of (4*n)+1•Limits the number of outstanding I/Osagainst an individual file•minpout–minimum•maxpout–maximum•If process reaches maxpout then it issuspended from creating I/O untiloutstanding requests reach minpoutNetwork•no –a & nfso-a to find what values are set to now•Buffers–Mbufs•Network kernel buffers•thewall is max memory for mbufs•Can use maxmbuf tuneable to limit this or increase it–Uses chdev–Determines real memory used by communications–If 0 (default) then thewall is used–Leave it alone–TCP and UDP receive and send buffers–Ethernet adapter attributes•If change send and receive above then also set it here–no and nfso commands–nfsstat–rfc1323 and nfs_rfc1323netstat•netstat–i–Shows input and output packets and errors foreach adapter–Also shows collisions•netstat–ss–Shows summary info such as udp packets droppeddue to no socket•netstat–m–Memory information•netstat–v–Statistical information on all adaptersNetwork tuneables•no -a•Using no–rfc1323 = 1–sb_max=1310720(>= 1MB)–tcp_sendspace=262144–tcp_recvspace=262144–udp_sendspace=65536(at a minimum)–udp_recvspace=655360•Must be less than sb_max•Using nfso–nfso-a–nfs_rfc1323=1–nfs_socketsize=60000–nfs_tcp_socketsize=600000•Do a web search on “nagle effect”•netstat–s | grep“socket buffer overflow”nfsstat•Client and Server NFS Info •nfsstat–cn or –r or –s–Retransmissions due to errors•Retrans>5% is bad–Badcalls–Timeouts–Waits–ReadsUseful Links• 1. Ganglia–• 2. Lparmon–/tech/lparmon• 3. Nmon–/collaboration/wiki/display/WikiPtype/nmon• 4. Nmon Analyser–/collaboration/wiki/display/WikiPtype/nmonanalyser • 5. Jaqui's AIX* Blog–Has a base set of performance tunables for AIX 5.3 /blosxomjl.cgi/• 6. vmo command–/infocenter/pseries/v5r3/index.jsp?topic=/com.ibm.aix.doc/cmds/aixcmds6/vmo.htm •7. ioo command–/infocenter/pseries/v5r3/index.jsp?topic=/com.ibm.aix.doc/cmds/aixcmds3/ioo.htm •8. vmstat command–/infocenter/pseries/v5r3/index.jsp?topic=/com.ibm.aix.doc/cmds/aixcmds3/ioo.htm •9. lvmo command–/infocenter/pseries/v5r3/index.jsp?topic=/com.ibm.aix.doc/cmds/aixcmds3/ioo.htm •10. eServer Magazine and AiXtra–/•Search on Jaqui AND Lynch•Articles on Tuning and Virtualization•11. Find more on Mainline at:–/ebrochureQuestions?Supplementary SlidesDisk Technologies•Arbitrated–SCSI20 or 40 mb/sec–FC-AL 100mb/sec–Devices arbitrate for exclusive control–SCSI priority based on address •Non-Arbitrated–SSA80 or 160mb/sec–Devices on loop all treated equally–Devices drop packets of data on loopAdapter Throughput-SCSI100%70%Bits Maxmby/s mby/s Bus DevsWidth •SCSI-15 3.588•Fast SCSI10788•FW SCSI20141616•Ultra SCSI201488•Wide Ultra SCSI 4028168•Ultra2 SCSI402888•Wide Ultra2 SCSI80561616•Ultra3 SCSI1601121616•Ultra320 SCSI3202241616•Ultra640 SCSI6404481616•Watch for saturated adaptersCourtesy of /terms/scsiterms.htmlAdapter Throughput-Fibre100%70%mbit/s mbit/s•13393•266186•530371• 1 gbit717• 2 gbit1434•SSA comes in 80 and 160 mb/secRAID Levels•Raid-0–Disks combined into single volume stripeset–Data striped across the disks•Raid-1–Every disk mirrored to another–Full redundancy of data but needs extra disks–At least 2 I/Os per random write•Raid-0+1–Striped mirroring–Combines redundancy and performanceRAID Levels•RAID-5–Data striped across a set of disks–1 more disk used for parity bits–Parity may be striped across the disks also–At least 4 I/Os per random write(read/write to data and read/write toparity)–Uses hot spare technology。
aix 面试题
aix 面试题在应聘AIX相关岗位时,面试官常常会问及与AIX相关的面试题,以评估应聘者的技术能力和专业知识。
本文将介绍一些常见的AIX面试题,并给出相应的答案和解析。
1. 什么是AIX操作系统?AIX(Advanced Interactive eXecutive)是IBM公司开发的一种基于UNIX的操作系统。
它是为IBM Power Systems服务器设计的,主要用于企业级应用和数据库。
2. 请简要介绍一下AIX的特点和优势。
AIX具有以下几个特点和优势:- 可靠性高:AIX采用了冗余设计和可靠的错误检测与恢复机制,以确保系统持续稳定运行。
- 扩展性强:AIX支持多处理器和多线程技术,可以有效利用硬件资源,满足高性能和扩展性需求。
- 安全性好:AIX提供了丰富的安全功能和机制,如访问控制、权限管理和身份验证,保护系统和数据的安全性。
- 管理和调优:AIX提供了一系列的管理工具和性能调优机制,方便管理员进行系统管理和性能优化。
- 兼容性强:AIX与其他UNIX-like操作系统兼容,并且支持多种软件和应用的移植。
3. 请解释一下在AIX中如何创建文件系统。
在AIX中,可以使用mkfs命令来创建文件系统。
例如,创建一个ext3文件系统,可以使用以下命令:```mkfs -V jfs2 -O ext /dev/hdX```其中,/dev/hdX是磁盘分区设备名称。
4. 如何在AIX系统上查看网络接口状态?可以使用ifconfig命令来查看AIX系统上的网络接口状态。
例如,查看所有网络接口的状态,可以使用以下命令:```ifconfig -a```该命令将显示系统上所有网络接口的详细信息,包括接口名称、IP 地址、MAC地址等。
5. 在AIX系统上如何查看进程及其资源占用情况?可以使用ps命令来查看AIX系统上的进程及其资源占用情况。
例如,查看所有进程及其资源占用情况,可以使用以下命令:```ps -ef```该命令将显示系统上所有进程的详细信息,包括进程ID、父进程ID、CPU占用、内存占用等。
性能优化问题诊断报告

性能优化问题诊断报告性能优化问题诊断报告为了解决系统性能问题,我们进行了一系列的诊断和分析,并得出以下报告。
问题描述:在使用系统进行大量数据处理时,系统出现了明显的性能下降。
具体表现为系统响应时间延长、数据处理速度变慢等。
诊断过程及结果:1. 系统配置检查:我们首先检查了系统的硬件配置和网络环境。
系统的硬件配置达到了最低要求,并且网络连接正常。
2. 系统日志分析:我们分析了系统的日志文件,并发现了一些异常信息。
具体来说,有大量的资源竞争和死锁现象。
3. 数据处理流程分析:我们仔细分析了系统的数据处理流程,并发现了一些潜在的问题。
具体来说,数据处理过程中存在着大量的重复计算和多次数据读取的情况。
根据以上的诊断结果,我们得出了以下的优化方案:优化方案:1. 系统优化:针对系统资源竞争和死锁问题,我们建议对系统进行优化。
可以采取一系列的措施,如增加系统资源、调整系统配置以提高系统的并发能力,并使用锁机制避免资源竞争和死锁。
2. 数据处理优化:针对数据处理过程中的重复计算和多次数据读取问题,推荐进行数据缓存和计算结果缓存。
通过使用缓存可以避免重复计算和多次读取的情况,从而提高数据处理速度。
3. 算法优化:在数据处理过程中,我们还发现了一些算法上的优化空间。
建议对算法进行优化,减少不必要的计算和数据访问操作,提高算法的效率。
4. 性能测试及监控:为了持续优化系统性能,建议进行性能测试和监控。
通过性能测试可以及时发现系统性能问题,并进行针对性的优化。
同时,通过性能监控可以实时监测系统的运行情况,及时调整优化策略。
结论:经过诊断和分析,我们发现系统性能问题主要是由于资源竞争、死锁、重复计算和多次数据读取等原因导致的。
通过采取优化方案,我们可以有效地解决这些问题,并提高系统的性能。
建议按照优化方案逐步进行优化,并持续进行性能测试和监控,以确保系统的稳定和高效运行。
以上是本次性能优化问题的诊断报告,希望对解决系统性能问题有所帮助。
AIX操作系统性能分析报告
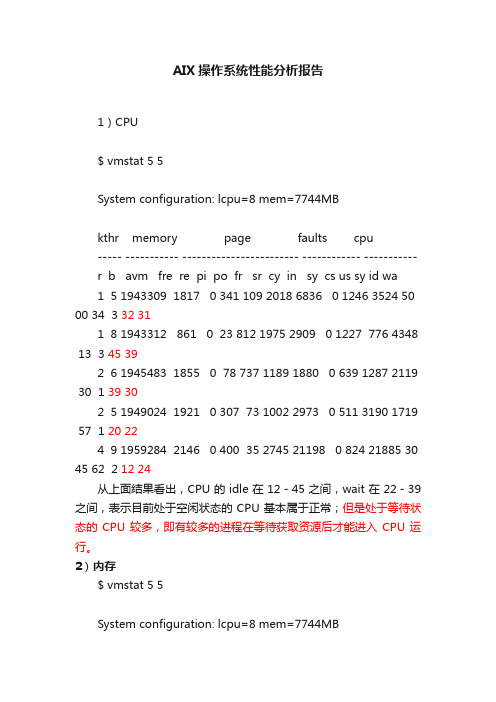
AIX操作系统性能分析报告1)CPU$ vmstat 5 5System configuration: lcpu=8 mem=7744MBkthr memory page faults cpu----- ----------- ------------------------ ------------ ----------- r b avm fre re pi po fr sr cy in sy cs us sy id wa1 5 1943309 1817 0 341 109 2018 6836 0 1246 3524 5000 34 3 32 311 8 1943312 861 0 23 812 1975 2909 0 1227 776 4348 13 3 45 392 6 1945483 1855 0 78 737 1189 1880 0 639 1287 2119 30 1 39 302 5 1949024 1921 0 307 73 1002 2973 0 511 3190 1719 57 1 20 224 9 1959284 2146 0 400 35 2745 21198 0 824 21885 30 45 62 2 12 24从上面结果看出,CPU的idle在12-45之间,wait在22-39之间,表示目前处于空闲状态的CPU基本属于正常;但是处于等待状态的CPU较多,即有较多的进程在等待获取资源后才能进入CPU运行。
2)内存$ vmstat 5 5System configuration: lcpu=8 mem=7744MBkthr memory page faults cpu----- ----------- ------------------------ ------------ ----------- r b avm fre re pi po fr sr cy in sy cs us sy id wa1 5 1943309 1817 0 341 109 2018 6836 0 1246 3524 5000 34 3 32 311 8 1943312 861 0 23 812 1975 2909 0 1227 776 4348 13 3 45 392 6 1945483 1855 0 78 737 1189 1880 0 639 1287 2119 30 1 39 302 5 1949024 1921 0 307 73 1002 2973 0 511 3190 1719 57 1 20 224 9 1959284 2146 0 400 35 2745 21198 0 824 21885 30 45 62 2 12 24从上面看出,avm(激活虚拟内存页)为1.95M*4K=7.8G;fre(物理内存中的空闲页)为1.9k*4k=7.6M,而物理内存有8G,表示物理内存已经被充分利用。
AIX性能调优-牛新庄-

AIX性能调优系统资源(物理资源,逻辑资源)系统瓶颈性能概念一个程序执行步骤性能调整流程Instructor GuideFigure 1-6. Program Execution Hierarchy AU187.0 Notes:IntroductionIn the graphic above, the left side represents hardware entities that are loosely matched to the appropriate operating system entity on the right side. A program must go from the lowest level of being stored on disk, to the highest level being the processor running program instructions.Hardware hierarchy overviewWhen a program runs, it makes its way up the hardware and operating systemhierarchies, more or less in parallel. Each level on the hardware side is scarcer and more expensive than the one below it. There is contention for resources amongprograms and time spent in transitional from one level to the next. Usually, the time required to move from one hardware level to another consists primarily of the latency of the lower level, that is, the time from the issuing of a request to the receipt of the first data.1-18 AIX 5L System Administration III© Copyright IBM Corp. 2000, 2006Course materials may not be reproduced in whole or in partInstructor Guide Disks are the slowest hardware operationBy far the slowest operation that a running program does (other than waiting on a human keystroke) is to obtain code or data from a disk. Disk operations are necessary for read or write requests for programs. System tuning activities frequently turn out to be hunts for unnecessary disk I/O or searching for disk bottlenecks since disk operations are the slowest operations. For example, can the system be tuned to reduce paging? Is one disk too busy causing higher seek times because it has multiple filesystems which have a lot of activity?Real memoryRandom Access Memory (RAM) access is fast compared to disk, but much moreexpensive per byte. Operating systems try to keep program code and data that are in use in RAM. When the operating system begins to run out of free RAM, it needs to make decisions about what types of pages to write out to disk. Virtual memory is the ability of a system to use disk space as an extension of RAM to allow for more efficient use of RAM.Paging and page faultsIf the operating system needs to bring a page into RAM that has been written to disk or has not been brought in yet, a page fault occurs, and the execution of the program is suspended until the page has been read in from disk. Paging is a normal part of the operation of a multi-processing system. Paging becomes a performance issue when free RAM is short and pages which are in memory are paged-out and then paged back in again causing process threads to wait for slower disk operations. How virtual memory works will be covered in another unit of this course.Translation Lookaside Buffers (TLBs)One of the ways that programmers are insulated from the physical limitations of the system is the implementation of virtual memory. The programmer designs and codes the program as though the memory were very large, and the system takes responsibility for translating the program's virtual addresses for instructions and data into realaddresses that are needed to get the instructions and data from RAM. Since thisaddress-translation process is time-consuming, the system keeps the real addresses of recently accessed virtual memory pages in a cache called the Translation Lookaside Buffer (TLB).As long as the running program continues to access a small set of program and data pages, the full virtual-to-real page-address translation does not need to be redone for each RAM access. When the program tries to access a virtual-memory page that does not have a TLB entry, called a TLB miss, dozens of processor cycles, called theTLB-miss latency are required to perform the address translation.© Copyright IBM Corp. 2000, 2006Unit 1. Performance Analysis and Tuning Overview1-19Course materials may not be reproduced in whole or in partInstructor GuideCachesTo minimize the number of times the program has to experience the RAM latency, systems incorporate caches for instructions and data. If the required instruction or data is already in the cache (a cache hit), it is available to the processor on the next cycle (that is, no delay occurs); otherwise, a cache miss occurs. If a given access is both a TLB miss and a cache miss, both delays occur consecutively.Depending on the hardware architecture, there are two or three levels of cache, usually called L1, L2, and L3. If a particular storage reference results in an L1 miss, then L2 is checked. If L2 generates a miss, then the reference goes to the next level, either L3, if it is present, or RAM.Pipeline and registersA pipelined, superscalar architecture allows for the simultaneous processing of multipleinstructions, under certain circumstances. Large sets of general-purpose registers and floating-point registers make it possible to keep considerable amounts of the program's data in registers, rather than continually storing and reloading the data.Operating system hierarchy overviewThe operating system works on a thread level. When a user requests the execution of a program, AIX performs a number of operations to transform the executable program on disk to a running program. First, the directories in the user's current PATH must be scanned to find the correct copy of the program. Then the system loader (not to be confused with ld, the binder) must resolve any external references from the program to shared libraries. Finally, the system branches to the entry point of the program and the resulting page fault causes the program page that contains the entry point to be brought into RAM.Interrupt handlersThe mechanism for notifying the operating system that an external event has taken place is to interrupt the currently running thread and transfer control to an interrupt handler (FLIH or SLIH). Before the interrupt handler can run, enough of thegeneral-purpose registers must be saved to ensure that the system can restore the context of the running thread after interrupt handling is complete.ThreadsA thread is the current execution state of a single instance of a program. In AIX, accessto the processor and other resources is allocated on a thread basis, rather than a process basis. Multiple threads can be created within a process by the application program. Those threads share the resources owned by the process within which they are running.1-20 AIX 5L System Administration III© Copyright IBM Corp. 2000, 2006Course materials may not be reproduced in whole or in partWaiting threadsWhenever an executing thread makes a request that cannot be satisfied immediately, such as an I/O operation (either explicit or as the result of a page fault) or the granting ofa lock, it is put in a Wait state until that request is complete. Normally, this results inanother set of TLB and cache latencies, in addition to the time required for the request itself. However, it also allows other threads which are ready to run to gain access to the CPU.When a thread is replaced by another thread on a CPU, this is a context switch. A context switch can also occur when a thread finishes its timeslice or, as stated above, it must wait for a resource. Whenever a context switch occurs, there may be additional latencies due to cache misses. Context switches are a normal function of amulti-processing system, but an abnormally high rate of context switches could be a symptom of a performance problem.Dispatchable threadsWhen a thread is dispatchable, but not actually running, it is put in a run queue to run on an available CPU. If a CPU is available, it will run right away, otherwise it must wait. Currently dispatched threadThe scheduler chooses the thread that has the strongest claim to use the processor.When the thread is dispatched, the logical state of the processor is restored to what was in effect when the thread was last interrupted.Effect of the use of cache, RAM, and paging space on program performanceAccess time for the various components increase exponentially as you move away from the processor. For example, a one second access time for a 1 GHz CPU would be the equivalent of 100 seconds for a L3 cache access, 6 minutes for a RAM access, and 115 days for a local disk access! As you can see, the closer you are to the core, the faster the access is. Understanding how to reduce more expensive (performance-wise)bottlenecks is key to performance management.© Copyright IBM Corp. 2000, 2006Unit 1. Performance Analysis and Tuning Overview1-21Course materials may not be reproduced in whole or in partFigure 1-8. Performance Analysis Flowchart AU187.0 Notes:Tuning is a processThe flowchart in the visual above can be used for performance analysis and it illustrates that tuning is an iterative process. We will be following this flowchart throughout our course.The starting point for this flowchart is the Normal Operations box. The first piece of data you need is a performance goal. Only by having a goal, or a set of goals, can you tell if there is a performance problem. The goals may be something like a specific response time for an interactive application or a specific length of time in which a batch job needs to complete. Tuning without a specific goal could in fact lead to the degradation of system performance.Once you decide there is a performance problem and you analyze and tune the system, you must then go back to the performance goals to evaluate whether more tuning needs to occur.© Copyright IBM Corp. 2000, 2006Unit 1. Performance Analysis and Tuning Overview1-27Course materials may not be reproduced in whole or in partAdditional testsThe additional tests that you perform at the bottom right of the flowchart relate to the four previous categories of resource contention. If the specific bottleneck is well hidden, or you missed something, then you must keep testing to figure out what is wrong. Even when you think you’ve found a bottleneck, it’s a good idea to do additional tests to identify more detail or to make sure one bottleneck is not masquerading as another. For example, you may find a disk bottleneck, but in reality it’s a memory bottleneck causing excessive paging.1-28 AIX 5L System Administration III© Copyright IBM Corp. 2000, 2006Course materials may not be reproduced in whole or in partFigure 1-9. Performance Analysis Tools AU187.0 Notes:CPU analysis toolsCPU metrics analysis tools include:-vmstat, iostat, sar, lparstat and mpstat which are packaged with bos.acct -ps which is in bos.rte.control-cpupstat which is part of mands-gprof and prof which are in bos.adt.prof-time (built into the various shells) or timex which is part of bos.acct-emstat and alstat are emulation and alignment tools from bos.perf.tools-netpmon, tprof, locktrace, curt, splat, and topas are in bos.perf.tools-trace and trcrpt which are part of bos.sysmgt.trace-truss is in bos.sysmgt.ser_aids1-30 AIX 5L System Administration III© Copyright IBM Corp. 2000, 2006Course materials may not be reproduced in whole or in partInstructor Guide-smtctl is in bos.rte.methods-Performance toolbox tools such as xmperf, 3dmon which are part of perfmgr Memory subsystem analysis toolsSome of the memory metric analysis tools are:-vmstat which is packaged with bos.acct-lsps which is part of bos.rte.lvm-topas, svmon and filemon are part of bos.perf.tools-Performance toolbox tools such as xmperf, 3dmon which are part of perfmgr-trace and trcrpt which are part of bos.sysmgt.trace-lparstat is part of bos.acctI/O subsystem analysis toolsI/O metric analysis tools include:-iostat and vmstat are packaged with bos.acct-lsps, lspv, lsvg, lslv and lvmstat are in bos.rte.lvm-lsattr and lsdev are in bos.rte.methods-topas, filemon, and fileplace are in bos.perf.tools-Performance toolbox tools such as xmperf, 3dmon which are part of perfmgr-trace and trcrpt which are part of bos.sysmgt.traceNetwork subsystem analysis toolsNetwork metric analysis tools include:-lsattr and netstat which are part of .tcp.client-nfsstat and nfs4cl as part of .nfs.client-topas and netpmon are part of bos.perf.tools-ifconfig as part of .tcp.client-iptrace and ipreport are part of .tcp.server-tcpdump which is part of .tcp.server-Performance toolbox tools such as xmperf, 3dmon which are part of perfmgr-trace and trcrpt which are part of bos.sysmgt.trace© Copyright IBM Corp. 2000, 2006Unit 1. Performance Analysis and Tuning Overview1-31Course materials may not be reproduced in whole or in partInstructor GuideAIX 5L V5.3 enhancements to analysis toolsSeveral changes were made in AIX 5L V5.3 to the analysis tools. Changes were made at different maintenance levels for V5.3.The tprof command has new -E option to enable event based profiling and the new -f option allows you to set the sampling frequency for event-based profiling. There were updates to PMAPI including updates to pmlist and there are two new commands for hardware analysis: hpmcount and hpmstat. These are not covered in this course.The topas command has a new -D panel for disk analysis.There are new commands for obtaining statistics specific to a logical partition. These give statistics for POWER Hypervisor activity or for tracking real CPU utilization in a simultaneous multi-threading or shared processor (Micro-Partition) environment. A new register was added called the Processor Utilization Resource Register (PURR) to track logical and virtual processor activity. Commands such as sar and topas willautomatically use the new PURR statistics when in a simultaneous multi-threading or shared processor (Micro-Partition) environment and you will see new columns reporting partition statistics in those environments. Trace-based commands now have new hooks for viewing PURR data. Some commands such as lparstat, mpstat, and smtctl are new for AIX 5L V5.3 and work in a partitioned environment.The AIX 5L Virtualization Performance Management course covers all differences in performance analysis and tuning in a partitioned environment.1-32 AIX 5L System Administration III© Copyright IBM Corp. 2000, 2006Course materials may not be reproduced in whole or in partInstructor GuideFigure 1-10. Performance Tuning Process AU187.0 Notes:OverviewPerformance tuning is one aspect of performance management. The definition ofperformance tuning sounds simple and straight forward, but it’s actually a complex process.Performance tuning involves managing your resources. Resources could be logical (queues, buffers, etc.) or physical (real memory, disks, CPUs, network adapters, etc.).Resource management involves the various tasks listed here. We will examine each of these tasks later.Tuning always must be done based on performance analysis. While there arerecommendations as to where to look for performance problems, what tools to use, and what parameters to change, what works on one system may not work on another. So there is no cookbook approach available for performance tuning that will work for all systems.The wheel graphic in the visual above represents the phases of a more formal tuning project. Experiences with tuning may range from the informal to the very formal where reports and reviews are done prior to changes being made. Even for informal tuning actions, it is essential to plan, gather data, develop a recommendation, implement, and document.Figure 1-11. Performance Tuning Tools AU187.0 Notes:CPU tuning toolsCPU tuning tools include:-nice, renice, and setpri modify priorities.nice and renice are in the bos.rte.control fileset.setpri is a command available with the perfpmr package.-schedo (schedtune in AIX 5L V5.1) modifies scheduler algorithms (in the bos.perf.tune fileset).-bindprocessor binds processes to CPUs (in the bos.mp fileset).-chdev modifies certain system tunables (in the bos.rte.methods fileset).-bindintcpu can bind an adapter interrupt to a specific CPU (in thedevices.chrp.base.rte fileset).-procmon is in bos.perf.gtools.Instructor GuideMemory tuning toolsMemory tuning tools include:-vmo and ioo (vmtune in AIX 5L V5.1) for various VMM, file system, and LVM parameters (in bos.perf.tune fileset)-chps and mkps modify paging space attributes (in bos.rte.lvm fileset)-fdpr rearranges basic blocks in an executable so that memory footprints become smaller and cache misses are reduced (in perfagent.tools fileset) -chdev modifies certain system tunables (in bos.rte.methods fileset)I/O tuning toolsI/O tuning tools include:-vmo and ioo modify certain file system and LVM parameters (in bos.perf.tune fileset) (Use vmtune prior to AIX 5L V5.2.)-chdev modifies system tunables such as disk and disk adapter attributes (in bos.rte.methods fileset)-migratepv moves logical volumes from one disk to another (in bos.rte.lvm fileset) -lvmo displays or sets pbuf tuning parameters (in bos.rte.lvm fileset)-chlv modifies logical volume attributes (in bos.rte.lvm fileset)-reorgvg moves logical volumes around on a disk (in bos.rte.lvm fileset)Network tuning toolsNetwork tuning tools include:-no modifies network options (in .tcp.client fileset)-nfso modifies NFS options (in .nfs.client fileset)-chdev modifies network adapter attributes (in bos.rte.methods fileset)-ifconfig modifies network interface attributes (in .tcp.client fileset)CPU在定位CPU性能问题时,从监视 CPU 使用率的统计数据入手。
AIXIBM小型机文系统PPT课件

sar命令
系统活动报告工具,可收集、报告和 保存系统活动信息,用于历史性能分 析。
常见性能问题诊断思路
CPU性能问题
内存性能问题
首先查看CPU使用率是否过高,如果是则 需要进一步分析是哪个进程或线程导致的 ,以及是否存在资源争用等问题。
检查内存使用率是否过高,是否存在内存 泄漏等问题。同时需要注意虚拟内存的使 用情况,如分页活动是否频繁等。
导致数据丢失。
PART 05
AIXIBM小型机网络配置 与优化
REPORTING
网络连接方式选择及配置步骤
01
02
03
网络连接方式选择
根据实际需求,选择适合 的网络连接方式,如LAN 、WAN、VPN等。
配置网络参数
设置IP地址、子网掩码、 默认网关等网络参数,确 保网络通信正常。
配置网络服务
根据实际需求,配置DNS 、DHCP、FTP等网络服 务,提供便捷的网络应用 环境。
磁盘性能问题
网络性能问题
磁盘IO通常是系统性能的瓶颈之一。需要 关注磁盘的读写速度、IOPS、等待时间等 指标,以及是否存在磁盘争用等问题。
网络延迟、丢包等问题都可能导致系统性 能下降。需要关注网络带宽、延迟、丢包 率等指标,并分析网络配置是否合理。
系统资源优化建议提供
CPU优化建议
内存优化建议
磁盘优化建议
AIXIBM小型机文系 统PPT课件
REPORTING
• AIXIBM小型机概述 • AIXIBM小型机硬件组成 • AIXIBM小型机操作系统及软件支持 • AIXIBM小型机文件系统详解 • AIXIBM小型机网络配置与优化 • AIXIBM小型机性能监控与调优
目录
服务器性能诊断与调优策略

服务器性能诊断与调优策略随着信息技术的不断发展,服务器在现代企业中扮演着至关重要的角色。
服务器性能的高低直接影响着企业的运行效率和用户体验。
因此,对服务器性能进行定期的诊断和调优显得尤为重要。
本文将介绍服务器性能诊断的方法和调优策略,帮助企业更好地管理和优化服务器性能。
一、服务器性能诊断1. 监控系统资源利用率首先,要对服务器的系统资源利用率进行监控。
包括CPU利用率、内存利用率、磁盘利用率、网络带宽利用率等。
通过监控这些指标,可以及时发现服务器性能瓶颈,为后续的调优工作提供依据。
2. 分析系统日志系统日志是服务器性能问题的重要线索。
通过分析系统日志,可以了解服务器的运行状态、异常情况和错误信息,帮助定位问题所在。
特别是要关注系统的错误日志和警告日志,及时处理异常情况。
3. 进行性能测试定期进行性能测试是发现服务器性能问题的有效手段。
可以通过压力测试工具模拟大量用户访问,观察服务器的响应速度和吞吐量,发现潜在的性能瓶颈。
4. 使用性能监控工具利用专业的性能监控工具对服务器进行监控和分析,可以实时了解服务器的运行状态,发现性能问题并及时采取措施。
常用的性能监控工具包括Zabbix、Nagios、Cacti等。
二、服务器性能调优策略1. 优化系统配置根据服务器的实际需求,合理配置系统参数。
包括调整内核参数、优化网络设置、增加缓存大小等。
通过优化系统配置,提升服务器的性能表现。
2. 升级硬件设备如果服务器性能问题较为严重,可以考虑升级硬件设备。
比如增加内存条、更换高性能CPU、使用SSD硬盘等。
硬件升级可以有效提升服务器的性能水平。
3. 优化数据库性能数据库是服务器的核心组件之一,优化数据库性能对整个服务器性能至关重要。
可以通过索引优化、查询优化、定期清理无用数据等手段提升数据库性能。
4. 负载均衡对于高访问量的服务器,可以考虑引入负载均衡技术。
通过负载均衡,将用户请求分发到多台服务器上,避免单台服务器负载过高,提高整体性能和稳定性。
软件系统运维技术中常见的性能问题分析

软件系统运维技术中常见的性能问题分析在软件系统运维技术中,性能问题是常见的挑战之一。
无论是企业级应用程序还是个人电脑上的软件,都可能受到性能问题的困扰。
本文将介绍一些常见的软件系统性能问题,并探讨如何进行问题分析和解决。
1. 响应时间过长当用户感到软件响应时间过长时,这往往是一个严重的性能问题。
可能的原因包括:- 硬件资源不足:服务器的处理能力不足、硬盘空间不足等。
解决方法是增加服务器的处理能力,优化数据存储和管理。
- 网络延迟:如果软件与数据库或其他服务器之间存在网络延迟,则响应时间会大大增加。
解决方法是优化网络连接并考虑使用缓存技术来减少网络传输。
- 代码优化不足:软件代码的设计和编写可能存在效率低下的问题,导致响应时间过长。
解决方法是进行代码优化,例如使用更高效的算法和数据结构,减少不必要的计算等。
2. 内存泄漏内存泄漏是指软件使用过程中未能正确释放内存,导致内存占用逐渐增加,最终导致系统崩溃。
内存泄漏可能的原因包括:- 非正常的对象引用:对象在使用完后未被正确释放,导致内存无法回收。
解决方法是仔细检查代码,确保在不再使用对象时释放对它的引用。
- 缓存管理不当:过多或长时间不使用的缓存对象可能导致内存泄漏。
解决方法是优化缓存策略,及时清理不再使用的缓存对象。
- 第三方库或框架的问题:某些第三方库或框架可能存在内存泄漏的问题。
解决方法是及时更新相关软件组件,并检查是否有已知的内存泄漏问题。
3. 并发访问冲突多个用户同时对同一资源进行访问可能导致并发访问冲突,进而导致系统性能下降甚至崩溃。
并发访问冲突可能的原因包括:- 数据库锁:多个查询或更新操作之间的数据库锁争夺可能导致性能问题。
解决方法是优化数据库设计、使用合适的锁策略,并考虑使用缓存技术减少对数据库的频繁访问。
- 线程竞争:多个线程同时访问共享变量可能导致数据不一致或死锁。
解决方法是使用同步机制,例如锁或信号量,来保证多个线程之间的互斥访问。
AIX维护手册簿 第 5 部分:问题地确定和解决

IBM AIX V5.3 系统管理(Test 222)认证指南系列,第 5 部分:问题的确定和解决(上)Shiv Dutta (sdutta@), 技术顾问, IBM2007 年 12 月 20 日本文分两部分向您介绍不同的问题确定工具,以及何时使用它们。
还提供了一些示例,说明如何解释这些命令的输出以及如何采取正确的操作。
本文是摘自 IBM 红皮书《IBM Certification Study Guide eServer p5 and pSeries Administration and Support for AIX 5L Version 5.3》。
问题确定和解决这个部分提供了一些相关的信息以帮助您解决网络、硬件、或者操作系统方面的问题。
网络问题在这一部分中,您将了解系统中网络支持和故障诊断的一些重要的方面,包括修改网络适配器和接口。
请注意,本部分并没有提供网络支持方面的所有内容(因为网络可能是非常复杂的环境),但是为支持专业人员提供了一个很好的起点。
ping 命令ping 命令适用于下列情况:确定网络以及各种外部主机的状态跟踪和隔离硬件和软件问题测试、测量和管理网络ping 命令发送一个 Internet Control Message Protocol (ICMP) ECHO_REQUEST,以便从网络中的某台主机或者网关那里获取一个 ICMP ECHO_RESPONSE。
如果这台主机正在运行,并且位于该网络中,那么它将对 ECHO 请求做出响应。
每个 ECHO 请求包含一个Internet Protocol (IP) 和 ICMP Header,后面紧跟着一个 timeval 结构,以及足够数量的字节以填充数据包。
在缺省情况下,ping 命令每秒发送一个数据报,并为每个接收到的响应输出一行内容。
ping 命令将计算往返时间,以及数据包丢失的统计信息,并在结束时显示简要的汇总信息。
当程序超时、或者收到一个 SIGINT 信号 (Ctrl-C) 时,ping 命令将会结束。
AIX参数调整
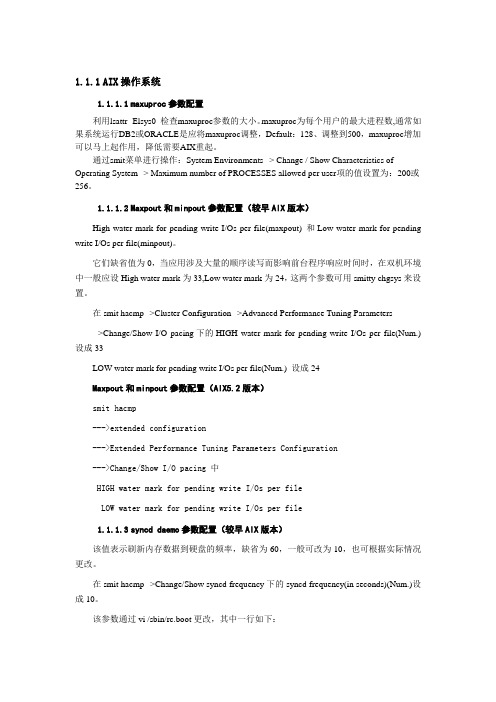
1.1.1AIX操作系统1.1.1.1maxuproc参数配置利用lsattr -Elsys0 检查maxuproc参数的大小。
maxuproc为每个用户的最大进程数,通常如果系统运行DB2或ORACLE是应将maxuproc调整,Default:128、调整到500,maxuproc增加可以马上起作用,降低需要AIX重起。
通过smit菜单进行操作:System Environments--> Change / Show Characteristics ofOperating System--> Maximum number of PROCESSES allowed per user项的值设置为:200或256。
1.1.1.2Maxpout和minpout参数配置(较早AIX版本)High water mark for pending write I/Os per file(maxpout) 和Low water mark for pendingwrite I/Os per file(minpout)。
它们缺省值为0,当应用涉及大量的顺序读写而影响前台程序响应时间时,在双机环境中一般应设High water mark为33,Low water mark为24,这两个参数可用smitty chgsys来设置。
在smit hacmp-->Cluster Configuration-->Advanced Performance Tuning Parameters-->Change/Show I/O pacing下的HIGH water mark for pending write I/Os per file(Num.)设成33LOW water mark for pending write I/Os per file(Num.) 设成24Maxpout和minpout参数配置(AIX5.2版本)smit hacmp--->extended configuration--->Extended Performance Tuning Parameters Configuration--->Change/Show I/O pacing 中HIGH water mark for pending write I/Os per file LOW water mark for pending write I/Os per file1.1.1.3syncd daemo参数配置(较早AIX版本)该值表示刷新内存数据到硬盘的频率,缺省为60,一般可改为10,也可根据实际情况更改。
服务器性能优化的常见问题与解决方法

服务器性能优化的常见问题与解决方法在当今数字化时代,服务器的性能至关重要。
企业、组织和个人都依赖服务器来托管网站、应用程序和数据存储。
然而,随着业务规模的增长和用户要求的提高,服务器的性能可能会变得不足以满足需求。
本文将探讨服务器性能优化的常见问题,并提供解决方法。
1. 硬件问题硬件问题是导致服务器性能下降的常见原因之一。
以下是一些常见的硬件问题及其解决方法:1.1 内存不足:当服务器过载时,内存不足可能会导致性能问题。
解决方法是增加服务器的内存容量,及时清理内存中的垃圾数据。
1.2 CPU瓶颈:服务器的CPU性能不足可能会导致请求响应时间延长。
解决方法包括升级到更强大的CPU或添加多个CPU核心。
1.3 存储问题:服务器的存储系统可能会限制性能。
使用高性能的固态硬盘(SSD)替换传统的机械硬盘(HDD)可以显著提升服务器的读写速度。
2. 网络问题网络问题是影响服务器性能的另一个重要因素。
以下是一些常见的网络问题及其解决方法:2.1 带宽限制:如果服务器使用的带宽不足以处理大量请求,性能就会受到限制。
解决方法包括升级带宽或使用负载均衡技术来分散流量。
2.2 网络延迟:高延迟会导致请求响应时间延长。
使用内容分发网络(CDN)可以将静态内容分发到离用户更近的服务器,从而减少延迟。
2.3 网络安全:恶意攻击和网络威胁可能导致服务器性能下降。
使用防火墙、入侵检测系统和其他网络安全措施可以保护服务器免受攻击。
3. 软件问题软件问题也可能导致服务器性能不佳。
以下是一些常见的软件问题及其解决方法:3.1 操作系统配置不当:操作系统的错误配置可能会影响服务器性能。
优化操作系统的配置参数,例如文件句柄限制和网络缓冲区大小,可以改善性能。
3.2 无效的代码:服务器端应用程序中存在低效、复杂或冗余的代码可能会导致性能问题。
对代码进行审查和优化,删除无用的代码和查询,以提高性能。
3.3 数据库优化不当:服务器上的数据库可能成为性能瓶颈。
AIX系统硬件故障定位
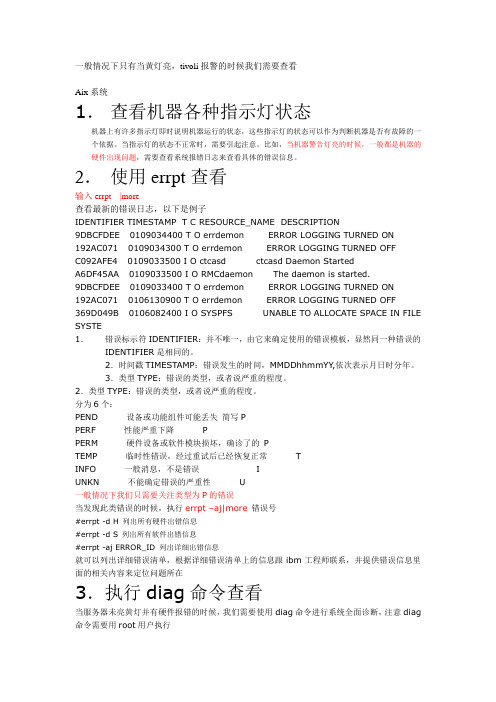
一般情况下只有当黄灯亮,tivoli报警的时候我们需要查看Aix系统1.查看机器各种指示灯状态机器上有许多指示灯即时说明机器运行的状态,这些指示灯的状态可以作为判断机器是否有故障的一个依据。
当指示灯的状态不正常时,需要引起注意。
比如,当机器警告灯亮的时候,一般都是机器的硬件出现问题,需要查看系统报错日志来查看具体的错误信息。
2.使用errpt查看输入errpt |more查看最新的错误日志,以下是例子IDENTIFIER TIMESTAMP T C RESOURCE_NAME DESCRIPTION9DBCFDEE 010******* T O errdemon ERROR LOGGING TURNED ON192AC071 010******* T O errdemon ERROR LOGGING TURNED OFFC092AFE4 010******* I O ctcasd ctcasd Daemon StartedA6DF45AA 010******* I O RMCdaemon The daemon is started.9DBCFDEE 010******* T O errdemon ERROR LOGGING TURNED ON192AC071 010******* T O errdemon ERROR LOGGING TURNED OFF369D049B 010******* I O SYSPFS UNABLE TO ALLOCATE SPACE IN FILE SYSTE1.错误标示符IDENTIFIER:并不唯一,由它来确定使用的错误模板,显然同一种错误的IDENTIFIER是相同的。
2.时间戳TIMESTAMP:错误发生的时间,MMDDhhmmYY,依次表示月日时分年。
3.类型TYPE:错误的类型,或者说严重的程度。
2.类型TYPE:错误的类型,或者说严重的程度。
分为6个:PEND 设备或功能组件可能丢失简写PPERF 性能严重下降PPERM 硬件设备或软件模块损坏,确诊了的PTEMP 临时性错误,经过重试后已经恢复正常TINFO 一般消息,不是错误IUNKN 不能确定错误的严重性U一般情况下我们只需要关注类型为P的错误当发现此类错误的时候,执行errpt –aj|more错误号#errpt -d H 列出所有硬件出错信息#errpt -d S 列出所有软件出错信息#errpt -aj ERROR_ID 列出详细出错信息就可以列出详细错误清单,根据详细错误清单上的信息跟ibm工程师联系,并提供错误信息里面的相关内容来定位问题所在3.执行diag命令查看当服务器未亮黄灯并有硬件报错的时候,我们需要使用diag命令进行系统全面诊断,注意diag 命令需要用root用户执行> 选高级诊断(Advance Diagnostic)> 选问题诊断(Problem Determination)或选系统检查(System Verification)(选PD 会对系统错误记录进行分析)如果有提问是否查看历史纪录,选择yesdiag运行后会给出SRN 代码,故障设备名称及百分比,地址代码等。
IBM-AIX-系统性能检测
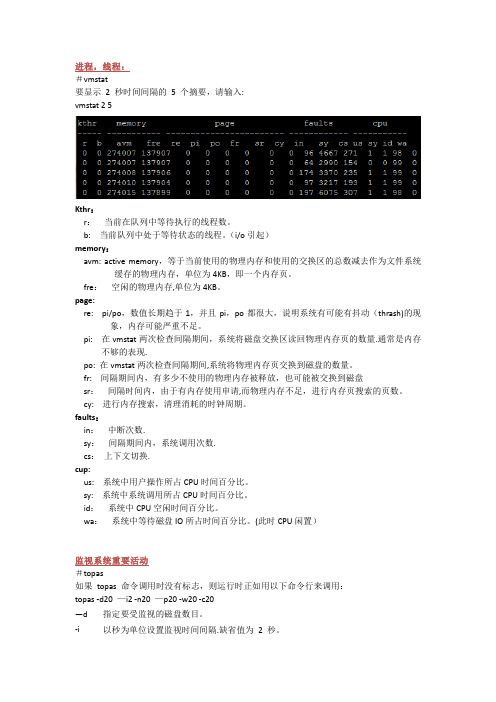
进程,线程:#vmstat要显示2 秒时间间隔的 5 个摘要,请输入:vmstat 2 5Kthr:r:当前在队列中等待执行的线程数。
b: 当前队列中处于等待状态的线程。
(i/o引起)memory:avm: active memory,等于当前使用的物理内存和使用的交换区的总数减去作为文件系统缓存的物理内存,单位为4KB,即一个内存页。
fre:空闲的物理内存,单位为4KB。
page:re: pi/po,数值长期趋于1,并且pi,po都很大,说明系统有可能有抖动(thrash)的现象,内存可能严重不足。
pi: 在vmstat两次检查间隔期间,系统将磁盘交换区读回物理内存页的数量.通常是内存不够的表现.po: 在vmstat两次检查间隔期间,系统将物理内存页交换到磁盘的数量。
fr: 间隔期间内,有多少不使用的物理内存被释放,也可能被交换到磁盘sr:间隔时间内,由于有内存使用申请,而物理内存不足,进行内存页搜索的页数。
cy: 进行内存搜索,清理消耗的时钟周期。
faults:in:中断次数.sy:间隔期间内,系统调用次数.cs:上下文切换.cup:us: 系统中用户操作所占CPU时间百分比。
sy: 系统中系统调用所占CPU时间百分比。
id:系统中CPU空闲时间百分比。
wa:系统中等待磁盘IO所占时间百分比。
(此时CPU闲置)监视系统重要活动#topas如果topas 命令调用时没有标志,则运行时正如用以下命令行来调用:topas -d20 —i2 -n20 —p20 -w20 -c20—d指定要受监视的磁盘数目。
-i以秒为单位设置监视时间间隔.缺省值为2 秒。
—n指定要受监视的热网络接口的数目.-p指定要受监视的热进程数目。
—w指定要受监视的热工作负载管理(WLM)类的数目.-c指定要受监视的热CPU 的数目。
缺省输出如下所示,包含两个固定部分和一个可变部分。
显示器左边的最上方两行显示了topas 命令运行所在的系统的名称、上次查看的日期和时间以及监视时间间隔。
AIX性能调优
管理作业的方法
-前台运行的作业通过: - batch - nice - /etc/security/limits -后台运行的作业通过: - renice
基本的性能分析
查看CPU 查看运行 队列长度 高队列长度 否 高数据页交换 是 是 可能是CPU限制 可能是内存限制 是 是 高CPU 使用率 否 查看内存 否 查看磁盘 磁盘间平衡 否
性能调优的限制
-性能的度量经常是不确定的 -调优方法并不总是可靠的 -没有标准的途径或详尽的说明书 -相互冲突的需求 -不可预测的使用 -复杂的系统相互作用 -敏感的资源要求
明确工作量
分类: -工作站 -多用户环境 -服务器 -需求的类型和等级 -软件包 -内部的应用 -真实世界的度量 -没有基准
05:08:11 05:08:11 9.03 0.22 05:08:5005:08:57 7773.12 52.83
Tue May 23 05:22:00 1999 Tue May 23 05:08:00 1999
基本的性能分析
查看CPU sar -u 查看运行 队列长度 sar -q 高队列长度 否 高数据页交换 是 是 可能是CPU限制 可能是内存限制 是 是 高CPU 使用率ห้องสมุดไป่ตู้否 查看内存vmstat 否 查看磁盘 iostat 磁盘间平衡 否
平衡磁 盘负载
可能是磁盘/SCSI限制
CPU的使用情况(sar –u)
这条命令的语法是: # sar [options] interval number 例如: # sar –u 60 3 AIX NODE 2 3 00000211 07/06/99 %usr %sys %wio %idle 08:25:11 48 52 0 0 08:26:10 63 37 0 0 08:27:12 59 41 0 0 . . Average 56 44 0 0
- 1、下载文档前请自行甄别文档内容的完整性,平台不提供额外的编辑、内容补充、找答案等附加服务。
- 2、"仅部分预览"的文档,不可在线预览部分如存在完整性等问题,可反馈申请退款(可完整预览的文档不适用该条件!)。
- 3、如文档侵犯您的权益,请联系客服反馈,我们会尽快为您处理(人工客服工作时间:9:00-18:30)。
在AIX日常运维中,性能问题一直是一个很重要的问题,为了让操作系统能正常平稳高效的运行,便需要一些武功秘籍来进行快速定准并解决问题,本次我们便来讨论一下我们可以用到的武功秘籍。
所谓性能问题,主要几种在CPU、内存、I/O三个大类别,因此我们分类进行讨论。
类别一:CPU
检查系统的三把斧头一招便是topas,这个是最常用也是最有效的一招,通过topas的输出可以看到CPU的使用情况。
从topas的输出我们主要关注如下4个指标:
那么判定系统忙不忙的一个指标为Idle%,正常情况下,Idle%的值如果低于10%,则这个系统的CPU就需要注意了,此时关注一下是User%高还是Kern%高,如果是User%高,则说明是应用程序占用CPU较多,反之则说明操作系统本身占用CPU较高。
(但是请注意:并不是所有Kern%高都是操作系统本身导致的,也有可能是应用程序调用了系统本身的函数,这样也会把这部分消耗算在Kern%头上)
在拍完第一板斧后,我们继续向下分析,拍第二板斧trpof,这个可以理解为精简版的trace,一般情况下执行这个命令对系统负载影响不太大,因此可以用这个工具先粗略看一下相关的进程。
通过tprof可以看出占用CPU排名靠前的进程。
如果root cause还没有找到,那么便使出大招,收trace数据。
在收集trace 数据前请先注意以下原则:
①收集trace数据会对当前系统的负载有影响,在CPU已经达到99%时,再收集trace有可能把操作系统搞夯。
②一定要等到问题重现时收集trace,由于trace产生的数据量巨大,因此要收集有效时间段的trace。
如果不确定问题什么时候重现,可以写个判断脚本,收集循环trace。
③用root用户进行trace收集
④需要预估trace数据的大小,然后根据预估的空间,在操作系统上找一个空间较大的地方存放数据。
trace数据的大小可以用下列公式算出:预估数据大小=逻辑CPU的个数* 10MB
(其中逻辑CPU的个数可以用vmstat | grep -i lcpu命令查看)
在执行完上述收集命令后,会生成trace的raw文件。
此时产生一个curt.out文件,可以直接进行阅读。
首先可以从“System Summary”字段看到各种类型的进程分别占用CPU的比例。
然后从“Application Summary”可以看到应用占用CPU的排名。
也可以从“System Calls Summary”可以看到系统函数调用排名情况。
OK,到此我们便把这三把斧拍完了,那么我们来讨论一个真实的案例,来从中看看这三把斧是怎么拍的。
故障描述:
生产环境CPU使用率高,导致应用程序运行缓慢,批量程序无法按时完成。
系统环境:
AIX 6100-07-05
处理过程:
Step1,使用topas查看,发现CPU使用率很高,其中大部分为Kern%占用Step2,收集tprof数据,tprof -skeuj -x sleep 10,找到占用CPU最高的两个进
Step3,收集trace数据,并进行分析,发现绝大多数是系统调用。
当时以为是操作系统的BUG或者操作系统本身导致的,初步判断和应用程序没有关系,但后来证明当时这个想法是错误的,这也说明并不是所有kernel高是由于系统本身造成的,如果应用程序调用系统本身函数,也算在kernel头上。
☺
Step4,通过curt文件输出,看到占用kernel最高的是paged_ds_start函数。
Step5,分析调用paged_ds_start函数的进程为ndmsmgr,这是一个应用的进程!
Step6,那么分析ndmsmgr为什么会调用较高的kernel运算。
使用truss命令跟踪这个进程。
经分析这个进程在对文件进行操作完成后对文件执行close操作时有报错,返回值为ERR#9 EBADF,该报错表述有无效的文件描述符,经查发现这进程会调用close函数,把文件描述符从0到65533的文件全部关闭一遍。
也就是说应用进程在调用大量的close()函数导致系统kernel使用率飙升! 这也就把耗资源的账伪造到了kernel头上。
☺
最终升级应用程序解决了该问题。
类别二:内存
下面我们来讨论内存的使用情况,首先也可以使用topas命令进行内存使用情况的查看。
从topas的输出中可以看到物理内存共有64GB,paging space共有16个GB。
其中物理内存部分:计算内存使用了27%,文件系统缓存使用了9%。
那么问题来了,真正用于运算的内存是多少呢?答案是物理内存的27%。
切记一定不要把文件系统缓存的使用当成内存的真实消耗。
因此当有新的内存申请时,文件系统的缓存是可以被换出来的。
那么一般来看,当计算内存达到90%时,则系统就会有性能问题;当达到95%以上,一般就会产生内存换页,这时就会把物理内存中的数据换到了paging space中,而如果短时间内有大量的换页产生,就很有可能引起操作系统夯,而如果在有HACMP或者oracle RAC集群环境中,就有可能导致集群强制把操作系统重启。
因此对计算内存的监控非常重要。
说到内存,不得不说的是svmon这个命令,这个命令可以查看更细的内存使用情况,例如每个进程占用多少内存等等信息。
可以用svmon -G命令查看内存的整体使用情况。
那么问题又来了,这个输出应该怎么看?图中virtual字段是真实消耗的计算内存的业面数,size是物理内存的业面数,因此计算内存的比值=4406839/16777216=27%。
那么如何查看每个进程所使用的内存量呢?可以用svmon -P <PID>来进行查看。
在下图中这个例子中可以看到计算内存的使用量共有11804个4K页面+185910个64KB页面。
换算为4KB页面共有2986364个。
但注意:这些内存有些是这个进程独享的,有些是多个进程共享的,因此在进行总和分析时不能简单的把所有内存值相加。
下面我们来看看占有内存的排名情况,我们要按占用内存的量由多到少进行排列,这个可以按如下方式进行(注意:最后一列已经换算成MB):
另外,perfPMR也是收集性能数据常用的工具,下载网址如下:
ftp:///aix/tools/perftools/perfpmr
可以用perfPMR提供的脚本进行memdetails.sh进行更详细的内存数据收集。
也可以使用nmon对内存进行分析,可以看到一天内的内存整体使用情况。
其中深红色的为计算内存,淡蓝色的为文件系统缓存,黄色的为文件系统缓存。
也可以按进程看到占用内存的情况。
类别三:I/O
谈起I/O不可避免的要首先了解LVM相关的一些技巧。
我们先谈谈lv的mapping关系,这个东西说起来很简单,但实际上它和I/O 的性能和LV误删后的恢复有密切的关系,因此了解清楚LV映射对于系统运维有很大的帮助。
可以通过lslv -m <lvname>看到lv的分布情况。
这个排序是按着LP的编号进行的,这个顺序很重要,如果lv被误删后,可以根据这个排序把lv重建回来。
通过fileplace命令也可以看到详细的分布信息。
通过readvgda <hdisk>可以通过磁盘读取到VGDA的信息,这里边包含了所有LV的mapping信息。
因此经常备份vgda信息对于灾难恢复很有必要。
通过getlvcb命令可以得到LVCB的信息。
在了解完了LV的分布后,我们回到性能监控上,iostat是一个很好用的命令。
通过这个命令可以看到每个磁盘的繁忙程度、响应时间、是否有I/O排队等信息。
topas -D也可以看到磁盘的相关信息。
但在topas输出中一定注意CPU中的idle%是否较高,由于idle%说明CPU在等待I/O,因此如果有idle%数值时,一定检查一下存储盘是否有问题。
结束语
本次从AIX CPU、内存、I/O三个方面探讨了相关的问题诊断及调整,可以当作抛砖引玉,供大家进行讨论参考。