三维电子地图论文中英文资料外文翻译文献

合集下载

外文翻译-移动平台的三维地图导航系统

外文翻译-移动平台的三维地图导航系统

武汉大学课程论文课程名称:当代地图学任课教师:黄长青姓名:文定红学号:2015286190126年级专业:2015级测绘工程院系单位:测绘遥感信息工程国家重点实验室移动平台的三维地图导航系统Tatsuo Minohara, Faculty of Policy Informatics, Chiba University of Commerce, Chiba, Japan摘要传统的民用直升机和飞机需要用到先进的导航系统,这些系统的操作运行具有良好的发展前景。

利用移动平板电脑,飞行员可以获取导航,而不需要通过内置的导航系统。

将直升机和飞机的导航系统同地图结合起来,需要用到UV A或者航拍多轴摄像机。

具有各种常用作用的飞行系统,其形态尺寸变得越来越小,与此同时用来运输的飞机等形态尺寸仍旧较大。

然而,总是存在一些小飞行器频繁扰乱飞机飞行路径的问题。

利用一个理想的系统,可以使得这个控制多轴摄像机进行摄影的控制器可以识别出运输飞机的飞行路径。

预测飞机飞行路径并加入到飞行器的导航系统中,可以帮助多轴摄像机避免经过飞机的飞行航线。

特别地,在UV A和多轴航拍摄像机的控制下,对飞机的姿态和位置状态的认识是非常有必要的。

地图就应该像射击一样被投影到导航系统中。

这篇文章就是提出了一种导航系统,可以结合3D地图,并进行飞行器轨迹的预测。

预计该系统可以被用于各种尺寸大小的飞行器,尺寸较小的有无人飞行器,尺寸较大的有民用直升机和飞机。

1.背景介绍对于一般的飞行器辅助设备,Garmin已经发行了一套移动平板软件,Garmin Pilot[1]。

Jeppesen也推出了FliteDeck Pro[2]。

这些应用都具有几何地图,天气地图,包括DME/VOR 和NDB的无线电导航图和ILS的功能,同时还能获取在机场附近存在的飞机航线信息(地图)。

Garmin Pilot还具有可以进行三维观察的地形图。

然而,包含街道宽度以及建筑等的三维视图的详细地面图对于一个城市来说是很重要的。

测绘工程矿山测量论文中英文资料对照外文翻译文献综述

测绘工程矿山测量论文中英文资料对照外文翻译文献综述

测绘工程矿山测量中英文资料对照外文翻译文献综述The measurement of the surveying and mapping in mineSince the seventy s, as the electronic technology and laser technology development, the type of surveying and mapping instruments with electronics (such as range finder, electronic tachometer, gyroscopes) to the traditional surveying and mapping instruments methods produced profound effect. In satellite remote sensing, global positioning system, as a representative of the space on earth observation technology in surveying and mapping application in the science of mature, computer technology, system scientifically based geographic information system and application for the emergence of surveying and mapping information source of access, analyze, management, processing and application fully provide strong technical support, automation and intelligence of surveying and mapping system is already in investigation, therefore we can say, the modern mapping technology is undergoing a profound revolution. Mining of measuring technology of an important application field, in the vast coal, metal mines, nonferrous mine production process played an important role. Mine survey of modern task is: in mine exploration, design, development and production of the different stages of the operation of the ground and underground mining area, the space, resources, (in mineral and land resources and environment are mainly) information acquisition, storage, processing, display and use for reasonable and effective development resources, protecting the resources, protecting the environment, management, industrial and environmental services for the continuous development of the station. In order to realize its modern task, mine measurement must be making full use of modern surveying and mapping instruments and techniques, put the advanced modern technology with mine surveying the actual work,specific characteristics, and the combination of broaden the living space mine survey and business scope, promote the reform and development of mine survey, adapt to the market economy system and mining system reform needs. Electronic tachometer, space information technology, the inertial measurement system and other modern surveying and mapping instruments have been in mine survey technology is used to further development and are constantly.This paper to modern surveying and mapping instruments of the development of the technology and its application in mine.1、Electronic tachometer and its application in mine survey:Electronic tachometer as the most widely used surveying and mapping instruments, is electronic technology and optical technology development of the combination of the photoelectric measuring instrument, is also set range finder, electronic advantages in a wide range of instruments, application prospects, the intelligent electronic tachometer is currently the biggest selling surveying and mapping instruments, is also the main future development direction. Intelligent electronic tachometer is with light, electricity and magnetism, machine of the latest scientific achievements, set the location, measuring Angle for the integration of advanced instrument. The international advanced electronic tachometer are on a memory card, internal memory or electronic hand book way, way of double record data transmission communication function, can receive external computer instruction by the computer input data, also can to outside the computer output data. The international advanced electronic tachometer have Japanese SOKKIA POWERSET series production of electronic tachometer and SET5F, SET6F, SET5W electronic tachometer, Swiss produces the TCA100 and TCA1800 electronic tachometer, Japan NIKON DTM-A series of electronic tachometer, etc. Our country has just south of the surveying and mapping instruments company production NTS-200 series electronic tachometer. Electronic tachometer has set up a file in the engineering survey, mine surveying, cadastral etc a wide range of applications, its development and application is in rapid developing. Electronic tachometer because and has the advantages of transit and range finder, and provide measurement results in digital form, its simple operation, stable performance, data can be through the electronic hand book and thecomputer to carry on the advantages of communication in the mine in the measurement of a wide range of applications. The ground control survey, topographic, engineering surveying all available is, contact measurement, the measurement work can also be used inunderground i To as a representative of the intelligent, digital instrument is minesurveying instrument one of the development direction in the future. Based on theelectronic tachometer and the modern computer technology can establish a mine 3 d data to be automatic collection, transmission,processing of mine surveying dataprocessing system, instead of traditional hand book records, manual entry, detailed calculation of repetitive work. In addition, electronic tachometer in mine surfacemovement monitoring, land reclamation project implementation, mine construction aspects also have been applied, each big ore measurement organizations are to instead of traditional instruments for routine measure the work, not only improves the efficiency, picked up speed, and reduced the development, and to ensure the accuracy2、Space information technology and its application in the measurement of the mine.The core of spatial information technology and the subject is the "3 S" technology (Remote Sensing:RS)、 (Global Positioning System GPS)、 (Grographic Information System:GIS) Remote sensing including satellite remote sensing and remote sensing, remote sensing data topographic map surveying as the important means in practice has a wide range of applications, satellite remote sensing for mapping is also mine of study and has made some significant results, based on remote sensing data to build digital terrain model (DTM) and then used in surveying and mapping work has won more applications. GPS as a cause of surveying and mapping in the traditional concept of major change technology, has become a main technology of land measurement method, also is the most potential mobile technology, in mine measurement, control survey, project survey, environment monitoring, disaster prevention and reduction of the navigation transport plays a significant role. Because not only have all-weather GPS, high precision and high flexibility, and the advantages of the traditional measuring technology without strict control, compared the level measurement, don't take points between depending on the point, withoutthe need to build standard, there is no error accumulation, the three dimensional positioning etc, and in the field measurement model, error sources and data processing to the traditional concept of surveying and mapping is a revolutionary change. The geographic information system as the geographical distribution of space of therelevant data collecting, processing, management, analysis of computer technology system, and its development and application of surveying and mapping the development of science is of great significance, is the modern mapping technology of important technical support. With "3 S" integration or integrated as the leading technology of space information system has gradually become the surveying and mapping learning or the earth informat ics new technology system and the work pattern, its advanced nature, timeliness obvious. With the space information technology for technical support, modern surveying and mapping instruments, technology is in rapid development in. The measurement of the remote sensing technology in the mines application has experienced a long time, and has accumulated rich experience.For remote sensing, it can be used as remote sensing data mining on the data topographic map surveying data source, like a piece of correction, through visual interpretation, field adjustable draw the work, complete the topographic map surveying and mapping. Compared with the traditional mapping method, using remote sensing data of mapping speed, low cost, high precision, it is a kind of application very extensive mapping method. Remote sensing in mine measurement of the applications of the key theory and technology also is in the investigation. Application of remote sensing data mining area, can obtain real-time, dynamic and comprehensive information source, to the mining area environment monitoring of the mining area environment protection to provide decision support. Remote sensing data mining area for prospecting, geological conditions, roof and floor of coal seam in such aspects as research has been applied, all these, explains the application of remote sensing technique in mining measurement is mine surveying realize its modern task important guarantee. GPS technology in the measurement of the mine is mainly applied to replace traditional ground surveying and mapping work. Using GPS technology such as mining surface movement monitoring, hydrology monitoring, miningarea control elevation hole net establishment or measure, reform, GPS receiver with performance to price has been rising, and its application in the measurement of minework the ground has become a part of the modern mine survey is an important support technology. Used in mining area the geographic information system is for mine geographical information system, or called mine material source environment alinformation system (MRIES). MREIS has become the important developing directionmine survey. With mining area environment resources information system as a platformto all kinds of measurement techniques for data acquisition approach, can build a collection of data acquisition, processing, management, analysis and output in oneof the automation, intelligent technology system, as the sustainable developmentof mining decision support system. Mine survey MREIS work is to establish the fistwork, and to create a MREIS mine surveying is an inevitable trend. Therefore, theGPS in the mining area is first applied used in a mine measurement information system established measurement, and then based on this establish the mining area environment information system resources. Space information technology is mine surveying realize its modern task of important technical support and guarantee, "3S" technology and other measuring instrument technology on the basis of the organic combination of the mining area environment information system is the spatial data information technology in mine survey of the applications of the comprehensiveresults.3 .the inertial measurement system and its application in the measurement ofthe mineThe inertial measurement system (Inertial ISS) is a kind of navigation and positioning technology, have all-w, autonomous, fast can flexible and advantages,the earth measurement, engineering surveying and mining measure the work of automation and versatility provided another kind of new technology. It is to usethe principle of inertial navigation, and earn geodetic data (longitude and latitude, elevation, azimuth, gravity anomaly and vertical deflection, etc.) of a kind of technology system.ISS can be divided into two categories: platform utility system and typesystem in the field of surveying and mapping, ISS main application target includes:(1) control measure, such as the existing control point review, encryption, and aerial control, etc.; (2) pipeline monitoring, orientation, crustal deformation, the surface subsidence observation; (3) underground positioning, all kinds of engineering and construction measure; (4) earthquake, gravity survey, geophysical research; (5) shaft and cans of vertical way beam of monitoring, etc. GPS/ISS combination system is to meet high precision navigation and positioning of the development direction of the request. This combination system can make the GPS and the performance of theISS, can get a lot of complementary to the whole land measurement model dataprocessing, and make sure that 3 d coordinate and the positioning and the precision of the navigation unstable, and increased significantly. The inertial measurement system in mine to the measurement of the Lord is applied in application in themeasurement of the application, the activities of the underground measurement, and of course the ground also has been applied in many fields, such as stated above. ISS in mines in China, the application in the measurement of work is to carry out in-depth,continue to develop. With GPS + ISS combination system used in mines measurement is a promising a technologyFour other new technology in the new instrument of surveying and mapping application to the measurement of the mineOther modern surveying and mapping instruments, such as laser point to meter, the gyro th, digital levels and related technology are all mine surveying and mapping measurement is used, and with the instrument technology as the foundation, formed many mining measurement instrument, as mine survey for the application of modern instruments and techniques.Mine survey as a cross subject, the development and the progress and the mining technology and the development of the mining project, measuring instruments and equipment of science and technology and the development of other subjects like mathematical science, computer science, etc, the development are closely related. Modern mapping technology is based on the electronic technology, space technology, optical technology, computer technology based on comprehensive technology, and has the intelligence, automation and so on a series of advantages. Modern science and technology, the rapid development of surveying and mapping can surely promote the further development of mine survey. With modern technology, mining engineeringsurveying and mapping technology and related science and technology as the foundation, the mine survey will form and collect data acquisition, processing, management, transmission, analysis, expression, application, output for the integration of intelligence, automation technology system for mine resources, environmental information system establishment provide fundamental material, promoting mine sustainable development.测绘在矿山测量中的发展七十年代以来,随着电子技术和激光技术的发展,光电结合型的测绘仪器(如测距仪、全站仪、陀螺仪)对传统的测绘仪器方法产生了深刻的影响。

测绘外文文献

测绘外文文献

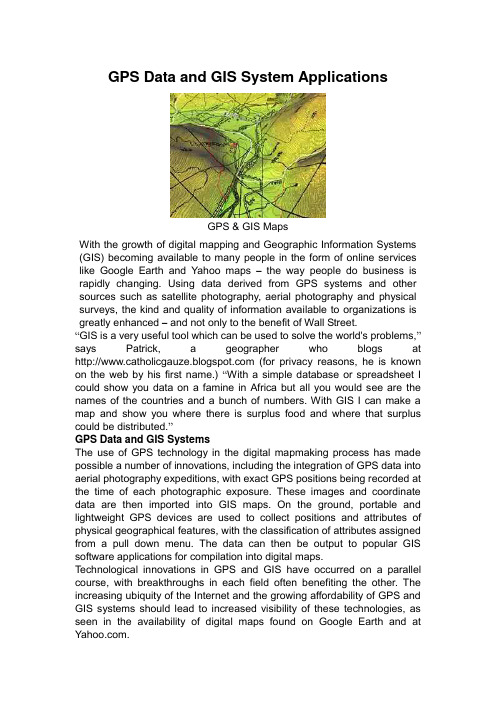
GPS Data and GIS System ApplicationsGPS & GIS MapsWith the growth of digital mapping and Geographic Information Systems (GIS) becoming available to many people in the form of online services like Google Earth and Yahoo maps –the way people do business is rapidly changing. Using data derived from GPS systems and other sources such as satellite photography, aerial photography and physical surveys, the kind and quality of information available to organizations is greatly enhanced – and not only to the benefit of Wall Street.“GIS is a very useful tool which can be used to solve the world's problems,”says Patrick, a geographer who blogs at (for privacy reasons, he is known on the web by his first name.) “With a simple database or spreadsheet I could show you data on a famine in Africa but all you would see are the names of the countries and a bunch of numbers. With GIS I can make a map and show you where there is surplus food and where that surplus could be distributed.”GPS Data and GIS SystemsThe use of GPS technology in the digital mapmaking process has made possible a number of innovations, including the integration of GPS data into aerial photography expeditions, with exact GPS positions being recorded at the time of each photographic exposure. These images and coordinate data are then imported into GIS maps. On the ground, portable and lightweight GPS devices are used to collect positions and attributes of physical geographical features, with the classification of attributes assigned from a pull down menu. The data can then be output to popular GIS software applications for compilation into digital maps.Technological innovations in GPS and GIS have occurred on a parallel course, with breakthroughs in each field often benefiting the other. The increasing ubiquity of the Internet and the growing affordability of GPS and GIS systems should lead to increased visibility of these technologies, as seen in the availability of digital maps found on Google Earth and at .A Catalyst For ChangeIndeed, if a recent media project at Google is any indication, GPS and GIS-enabled mapmaking may not only change the way we view the world, it may contribute to improving the lives of those in it. In collaboration with the U.S. Holocaust Memorial Museum, the folks at Google unveiled in April an unprecedented online mapping initiative to bring awareness of the Darfur crisis to the public, in the hopes of creating positive social change."At Google, we believe technology can be a catalyst for education and action,”said Eliot Schrage, Google Vice President of Global Communications and Public Affairs, in a recent press release. “…Crisis in Darfur‟will enable Google Earth users to visualize and learn about the destruction in Darfur as never before and join the Museum‟s efforts in responding to this continuing international catastrophe”(cited from /intl/en/press/pressrel/darfur_mapping.html.)As online users use virtual technology to fly over Africa, they‟ll see actual photographic images of the devastation that bears witness to the ongoing destruction of 1,600 villages by the Janjaweed militia and Sudanese forces – including 100,000 homes, as well as mosques, schools, and other critical structures, according to the release.The project uses data compiled from sources as diverse as the U.S. State Department and the United Nations, as well independent photographers and Holocaust Museum. The virtual experience can be viewed by downloading the free Google Earth software at . Additional information about the museum‟s Genocide Prevention Mapping Initiative can be accessed at the website of the Holocaust Museum at /googleearth .‘Neither Good Nor Evil’Geographer Patrick, who developed a master‟s thesis using freeware GIS software, and is currently a graduate teaching assistant in environmental geography, says he feels that due to the widespread availability of network-based programs, “GIS is about to go through such a radical evolution that it will surprise many….These new tools are also incredibly easy. I predict it will soon be possible to earn a degree in GIS from your average tech school.”Patrick runs a Windows®XP-based laptop with a variety of GIS applications, favoring open-source software and freeware for most of his work, and uses the popular ArcGIS application from ESRI for the most complex data and image crunching. He suggests that, like any tool, the benefit to society of using geographical information systems depends on the intentions of the user: “GIS is a great tool but that's all it is,” Patrick told me, “it is neither good nor evil. What matters is who is using it and the goals they wish to accomplish. As a culture we must continue to teach morals and ethics. This is the best and only reasonable way GIS can have a positive effect on the world.”As tools like Google Earth and similar GIS platforms bring the world closer together, every single one of us gains billions of neighbors every time we log onto the Internet. Hopefully this fact will make it harder to turn our back on the plight of developing communities in crisis, like Darfur.。

基于Google Earth平台的城市三维虚拟地图的研究与构建

基于Google Earth平台的城市三维虚拟地图的研究与构建

基于Google Earth平台的城市三维虚拟地图的研究与构建付晓;张景秋;周爱华【摘要】A new solution to designing a multi-perspective three-dimensional virtual urban map was proposed after studying the characteristics, the formation and the present technology of three-dimension maps. A new three- dimension model combined with some real cases was created on Google Sketchup. Google Earth Platform makes map sharing and issuing possible. The display of the geographic data of the same region can increase maps' geographic information and enrich map display methods, by which a more effective service can be provided for urban planning and building.%以数字化时代的地图演变趋势为研究的切入点,通过对三维虚拟地图的特点分析、架构体系研究以及现有技术的比较,提出一种多视角的城市三维虚拟地图的建设方案,并结合实例利用Google Sketchup技术完成三维建模,在GoogleEarth平台上实现城市三维虚拟地图的共享与发布。

通过不同视角的城市三维虚拟地图对同一区域的地理数据进行展示,进一步提高了地图的地理信息量,丰富了地图的展示手段,可为城市规划与建设提供有力的决策服务。

卫星定位导航外文翻译文献

卫星定位导航外文翻译文献

卫星定位导航外文翻译文献(文档含中英文对照即英文原文和中文翻译)原文:MODERN GEODETIC REFERENCE FRAMES FOR PRECISE SATELLITE POSITIONING AND NAVIGATIONJ. Kouba and J. PopelarGeodetic Survey Division, Geomatics Canada, Natural Resources Canada (NRCan) 615 Booth Street,Ottawa, Ontario, Canada K1A EO9ABSTRACTThe NAD83 and WGS84 reference coordinate frames were established more than a decade ago to satisfy most mapping, charting, positioning and navigation applications. They are consistent at the 1-2 metre level on a continental and global scales respectively, reflecting the limitations of available data and techniques. With rapid improvementsin positioning accuracy, mainly due to GPS, submetre navigation has become practical and reference frames at the cm to mm level are required by the most demanding users. The IERS Terrestrial Reference Frame (ITRF) was established in 1988 by the International Earth Rotation Service (IERS) to facilitate precise monitoring of the Earth Orientation Parameters (EOP) based on state-of-the-art techniques such as Very Long Baseline Interferometry (VLBI) and Satellite Laser Ranging (SLR). With the establishment of the International GPS Service for Geodynamics (IGS) in 1994, the ITRF is directly accessible to users world-wide by means of precise global GPS satellite orbit/clock solutions and a large number of IGS monitoring stations. The most recent ITRF solutions, designated ITRF92 and ITRF93, are based on space geodetic observations including GPS up to the end of 1993 providing global consistency at the cm level. The Canadian Active Control System (CACS) facilitates access to ITRF through active participation in IGS and VLBI. Fiducial VLBI points included in NAD83 provide a direct link to ITRF and make it possible to upgrade NAD83 coordinates in order to satisfy positioning and navigation requirements with cm precision in the future. CACS facilitates the most efficient connections to the ITRF and NAD83 reference frames for high precision positioning by GPS as well as for general spatial referencing needs in Canada.1. INTRODUCTIONIn geodesy a reference coordinate frame implies a scale, orientation and coordinate origin as part of a reference system which also includes Earth planetary models and constants necessary for satellite orbit determination, ge- odynamic and geophysical data analysis. Satellite navigation systems made it possible to establish a truly global geocentric reference system which was quickly adapted for precise geodetic positioning, especially over long distances. For the first time it was possible to determine distortions and misorientation of classical geodetic networks around the world. The U.S. Navy Navigation Satellite System (NNSS), also called Transit or simply Doppler (Kershner and Newton, 1962) became the basis for the U.S.Department of Defense World Geodetic System 1972 (WGS72) and later WGS84 which define global geocentric reference frames consistent at about the 1-2 metre level. To upgrade and correct distortions of the classical North American Datum 1927 (NAD27), a readjustment of the geodetic networks in Canada, USA, Mexico and Greenland was jointly undertaken. This new datum, designated NAD83, was nominally made compatible with WGS84 by being geocentric and oriented according to transformed Doppler positions, but in addition the NAD83 adjustment included VLBI (Very Long Baseline Interferometry) baselines. Thus both, WGS84 and NAD83, are consistent at about one metre, mainly due to the limitations of the Doppler techniques (Kouba, 1993). GPS and other space based techniques such as VLBI and Satellite Laser Ranging (SLR) provide data with higher precisions to support studies of crustal dynamics and polar motion which require a more accurate global reference frame. The IERS Terrestrial Reference Frame (ITRF) was established in 1988 and is updated on an annual basis by the International Earth Rotation Service (IERS) to keep it current and to improve knowledge of station velocities which are necessary for maintaining the accuracy of this global reference frame. NAD83 can be related to ITRF precisely for a given epoch by a transformation based on common VLBI stations. The Canadian Active Control System (CACS) provides the most efficient method to upgrade NAD83 coordinates in Canada in order to meet positioning and navigation requirements with cm precision in the future.2. NORTH AMERICAN GEODETIC DATUM: NAD83The North American Datum 1927 (NAD27) was established at the beginning of this century using continental triangulation with a centrally located datum point at Meades Ranch in Kansas, USA (Ross, 1936). Satellite geodesy in the 60's and 70's detected the approximately 100 m offset of the NAD27 origin with respect to the geocenter as well as distortions exceeding tens of meters in some parts of the geodetic control network (Mueller, 1974). A new reference frame wasrequired to facilitate use of efficient and precise satellite geodetic techniques in surveying and navigation. Satellite Doppler positions and several VLBI baselines which had been establishedbefore the end of 1986, were used to provide a framework and to define the geodetic datum in a new way. The North American Datum 1983 (NAD83) was based on Doppler station coordinates transformed to conform with the international convention for geocentric origin, scale and orientation of the reference ellipsoid (NOAA, 1989). Classical geodetic observations for more than 260,000 control points have been readjusted and integrated within the framework to provide the NAD83 coordinates of the horizontal control network monuments for practical use. Thus, NAD83 in its original version provides a reference frame for horizontal positioning with accuracies at the one meter level corresponding to satellite Doppler precision somewhat diluted by errors in the classical triangulation arcs included in the NAD83 network adjustment. At this level of precision there was no need to introduce station velocities and NAD83 is considered to be attached to the North American tectonic plate. The NAD83 reference frame satisfies most practical needs for mapping, charting, navigation and spatial referencing in North America where sub-meter accuracy is not required. However, today the increased precision of geodetic GPS measurements requires a reference frame consistency at a cm level which would facilitate studies of crustal dynamics related to plate tectonics and natural hazards associated with seismic or volcanic activities, etc. The accuracy of the VLBI baselines which contributed to the definition of NAD83 not only provides an effective way to relate NAD83 to more accurate reference frames at a 2cm level (Soler et al., 1992) but also facilitates precision upgrades using accurate geodetic space techniques. Such an approach will assure continuous improvements of positioning accuracy as well as traceability to NAD83 which is of great practical importance.3. WORLD GEODETIC SYSTEM: WGS84WGS84 is a global geodetic reference system which has been established and maintained by the U.S. Department of Defense to facilitate positioning and navigation world wide (DMA, 1991). The terrestrial coordinate reference frame corresponding to WGS84 has been updated to keep pace with increasing precision of GPS positioning andnavigation technology in general use.3.1 ORIGINAL WGS84 TERRESTRIAL EFERENCE FRAMEWGS84 world wide terrestrial reference frame was initially based only on satellite Doppler coordinates transformed in the same way as for NAD83. However, a different set of Doppler stations was used and no VLBI baseline measurements were included in the network adjustment. This approach produced a globally homogeneous geodetic reference frame with an accuracy of 1-2 m reflecting the limitations of the Doppler technique. Station velocities were ignored as they were of little importance. Although the Doppler WGS84 reference frame is comparable with that of NAD83 in North America, the lack of precise VLBI framework makes it impossible to relate WGS84 to current, more accurate reference frames with a precision better than 1m. Significant improvement can be achieved if the WGS84 framework adopted for GPS operations is considered. This WGS84 (GPS) terrestrial reference frame is based on WGS84 coordinates of 10 GPS tracking stations used by the U.S. DoD for generation of operational (broadcast) satellite orbits and clock parameters.3.2 REVISED WGS84(G730) TERRESTRIALREFERENCE FRAMEThe WGS84 (GPS) coordinates of the 10 GPS tracking stations have been revised using several weeks of GPS observations from a global network of 32 stations (10 DoD + 22 IGS) in a simultaneous adjustment of satellite orbits and station coordinates; the coordinates of 8 IGS stations were constrained to the values adopted by the International Earth Rotation Service (IERS) and the IERS value of the geocentric constant of gravitation was used. This improved reference frame for GPS, designated WGS84 (G730) to refer to GPS week 730, shows global consistency at about the 10cm level and uses NUVEL-1 plate motion model for station velocities (Swift, 1994; De Mets at al., 1990). Since the beginning of 1994, DMA has used WGS84 (G730) in post- processing and it is expected to be adopted for the computation of operational (broadcast) GPS satellite orbits in the near future (Malys and Slater, 1994).4. IERS TERRESTRIAL REFERENCE FRAME: ITRFIn order to facilitate precise Earth rotation and polar motion monitoring by modern space geodetic techniques the Bureau International de l'Heure (BIH) established in 1984 the BIH Terrestrial System (BTS84) based mainly on VLBI, SLR and satellite Doppler observations. In 1988 when BIH was superseded by IERS the IERS Terrestrial Reference Frame (ITRF88) was created to meet the following requirements (Boucher, 1990):Figure 1. Residual differences between NAD83 and ITRF92 (1994.0) for the CACSmonitoring stations.(a) it is geocentric with the origin at the center of mass of the whole Earth including the oceans and the atmosphere;(b) its orientation is consistent with the BIH Earth Orientation Parameter (EOP) series for the epoch 1984.0;(c) the station velocity model shall not produce any residual rotation with respect to the Earth crust;(d) the scale corresponds to the local coordinate system of the Earth in the senseof the relativistic theory of gravitation.Since 1988, an ITRF solution has been produced on an annual basis to incorporate new observations and stations as appropriate to satisfy the above requirements. The tectonic plate motion model NUVEL-1 was used to derive station velocities while enforcing the no residual rotation requirement. This combined with the somewhat uneven global distribution of the ITRF stations produced a 0.2 mas/year rotation between ITRF and IERS EOP (IERS Annual Report 1992) which accumulated by 1992 to a significant misalignment of about 1 mas. The NUVEL-1 model station velocities were revised to take into account observed VLBI and SLR station velocities where available, to produce ITRF92 which included about 150 stations. GPS observations offer the most efficient technique for the densification of ITRF when integrated in the VLBI framework which maintains the absolute orientation and scale. Mean station position errors for VLBI and GPS networks included in ITRF92 are summarized in Table 1 which shows cm level consistency for the global solutions (Boucher at al., 1993). Improvements in determination of station velocities and further densification to obtain more homogeneous coverage on all continents will be critical for maintaining and increasing the ITRF accuracy in the future.Table 1. Consistency of VLBI and GPS global solutions included in ITRF92Solution N Weighted RMS [cm] 2D 3DVLBI(GIUB) 7 0.6 0.7 VLBI(GSFC) 70 0.4 0.6 VLBI(JPL) 7 1.1 1.5 VLBI(NOAA) 55 0.3 0.5 VLBI(USNO) 15 0.7 0.7GPS(CODE) 12 0.4 0.7 GPS(CSR) 24 1.2 1.3 GPS(EMR) 17 0.4 0.6 GPS(ESA) 32 3.1 3.4GPS(JPL) 39 0.6 0.7 GPS(SIO) 40 1.3 1.85. TRANSFORMATION BETWEEN TERRESTRIAL REFERENCE FRAMESPractically useful transformations between different terrestrial reference frames are based on their most accurate common set of stations which are then used to determine seven transformation parameters and provide basic RMS information on the consistency of the relationship. Residual systematic differences can be mapped or represented analytically if they exceed significantly the RMS value of the coordinate differences after the transformation. The residual differences between NAD83 and ITRF92 (epoch 1994.0) positions for the Canadian Active Control System (CACS) monitoring stations are shown in Figure 1. However, such deviations should be investigated and corrected if they represent accumulation of systematic errors. Revisions of this kind provide natural upgrade path for any terrestrial reference frame and enhance significantly its practical importance by gradually eliminating unacceptable errors. The WGS84 (G730) reference frame is an example of a comprehensive revision in response to practical needs of GPS applications. Table 2 lists the 7 transformation parameters between the terrestrial reference frames discussed above and ITRF92 (epoch 1988.0). The global consistency of the terrestrial reference frames has improved by almost two orders of magnitude over the last decade as evident from Table 2. It has been achieved by a meticulous application of the complementary techniques of VLBI and satellite geodesy. The maintenance of the cm level terrestrial reference frame consistency requires systematic monitoring of crustal and terrain dynamics including monument stability. Continuous monitoring of the Earth rotational dynamics by VLBI is necessary for high precision applications of satellite positioning and navigation systems which have made this rapid progress in global geodesy possible.Table 2. Transformation parameters with respect to ITRF92(epoch 1988.0)6. ACCESS TO MODERN TERRESTRIALREFERENCE FRAMESThe high precision, global scope and dynamic nature of space techniques, particularly GPS in general use today, demand new approaches to the maintenance and access to terrestrial reference frames. As pointed out above, the modern terrestrial reference frames must be connected to the best available realization of the inertial frame provided by VLBI and must facilitate determination of station velocities in the geocentric coordinate system. This is presently accomplished by a combined solution for a global network of fiducial VLBI stations augmented by SLR and GPS stations for which geocentric coordinates and velocities are obtained from series of observations and geodynamic models; the solution defines a "control network" for a given epoch, e.g. 1988 for ITRF. Monitoring of "control station" velocities and the Earth rotation parameters (ERP), needed for inertial reference, requires continuous observation at some of the "control network stations" which creates an Active Control System (ACS). Such reference system offers two complementary modes of access to its terrestrial reference frame and supports real-time high precision global positioning and navigation.6.1 CANADIAN ACTIVE CONTROL SYSTEMCACSThe Geodetic Survey Division (GSD), Geomatics Canada in collaboration with the Geological Survey of Canada (GSC) has established CACS as an essential component a modern fully integrated spatial reference system to support geodetic positioning, navigation and general purpose spatial referencing. CACS represents the Canadian contribution to the International GPS Service for Geodynamics (IGS) and facilitatesdirect integration of Canadian stations within ITRF. The CACS network configuration (Fig. 1) augmented by about l8 globally distributed IGS stations provides continuous data for daily precise GPS satellite orbit and clock offset determination constrained by about 13 fiducial VLBI stations to facilitate positioning with highest precision for geodetic control networks and crustal dynamic studies as well as generation of high quality orbit predictions forreal-time applications. The quality of the CACS results in comparison to the other IGS Analysis Centers can be seen in Table 3. GSD is also responsible for coordination of the IGS Analysis Centers and combination of their results into the official IGS products (Beutler at al., 1993).Table 3. IGS Combined Orbit Summary, week 0758 (July 17 - July 23, 1994) Mean and standard deviations of transformation parameters. WRMS - orbit RMS weighted by the orbit accuracy codes. Units: meters, mas, ppb, nano-sec, nano-sec/day.Three strategies have been developed for the integration of regional GPS stations and networks in ITRF or related terrestrial reference frames, e.g. NAD83, WGS84. The first strategy uses sequential global processing for addition of data from regional stations to the system of normal equations and obtain updated global solution with coordinates of the regional stations. The second strategy uses the CACS/IGS precise orbits in baseline double-difference processing to establish high precision regional networks for special geodetic and geodynamic applications with mm or ppbprecision (Fig. 2). The third strategy uses the CACS/IGS precise satellite ephemerides and clock offset data and undifferenced GPS observations for single point positioning with accuracy corresponding to the pseudorange measurement precision of the GPS receiver used.DRAO-ALBH Baseline, Length 301.768387 kmSigma=32..95 mmFigure 2. Variations in the DRAO (Penticton) -ALBH (Victoria) baseline length solutions (after Dragert at al., 1994).This rather simple approach can satisfy wide range of spatial referencing and navigation requirements with one meter or better precision (Fig. 3). Real-time wide area differential GPS (WADGPS) service can only be supported by an active control system like CACS which assures continuous, efficient and economical access to the reference frame. In this way all activities and operations can be related to a common, accurate and reliable global spatial reference frame by means of GPS. CACS satisfies both requirements of a modern terrestrial reference frame: maintains a network of fiducial reference stations and provides continuous monitoring and updating of all variable system parameters which are necessary for precise and consistent user positioning.Figure 3. CACS USER POSITIONING INTERFACE: Initial convergence tests based on CACS post-processed orbits/clocks and a single receiver pseudorange/phase ata.6.2 CANADIAN BASE NETWORK - CBNThe traditional method of access to a reference frame is based on differential positioning with respect to control stations with "known" coordinates in the required reference frame. These are determined either during the reference frame definition or the later integration of so called control surveys. Such an approach was necessary due to the elaborate and time consuming procedures used in the past to obtain reference station coordinates with required accuracy. Nevertheless, the need to maintain an accurate terrestrial network of monumented reference stations in addition to an active control system is twofold. Firstly, it provides control points for tecniques other than GPS and facilitates calibration and performance analysis of survey instrumentation and procedures. Secondly, it densifies the network of active control points while providing direct connections to classical geodetic horizontal and vertical control networks. Station spacing is generally greater and special considerations are required for site selection and monumentation to support higher precision and efficiency of operations. The determination of station velocitiesrequires regular reoccupations and systematic analysis of monument stability and crustal dynamics. The Canadian Base Network (Fig. 4) is to play an important role in the integration of the horizontal and vertical geodetic control networks and support studies of crustal deformations and seismic hazards in Canada.Figure 4. Proposed station spacing for the Canadian Base Network (CBN).7. CONCLUSIONSGPS technology offers users the most versatile, accurate and economical system for geodetic positioning, navigation and general purpose spatial referencing to date. In order to maximize system performance and effectiveness, GPS applications depend on continuous monitoring of the GPS satellites with respect to conventional terrestrial and celestial reference frames. Modern terrestrial reference frames are based on the spacetime coordinate system centered at the geocenter and must take account of Earth tectonic plate motion anddeformation to provide a cm level accuracy potential. ITRF has been implemented and maintained to satisfy the highest accuracy positioning requirements on the global scale. NAD83 has been implemented to satisfy mapping, charting and navigation applications where sub-meter accuracy is not required; however the VLBI framework provides an upgrade path to a cm accuracy NAD83 reference frame rigidly connected to the North American plate. The transformation parameters (Table 2) facilitate transformations between the reference frames to accommodate user needs. The active control system (ACS) provides efficient and economical direct access to the terrestrial reference frames with the required accuracy and facilitate real-time high precision spatial referencing and navigation.REFERENCESBeutler,G., J. Kouba, T. Springer, Combining the orbits of the IGS Processing centers, Proc. IGS Analysis Center Workshop, 20-56, 1993.Boucher, C., Definition and Realization of Trrestrial Reference Systems for Monitoring Earth Rotation, in Variations in Earth Rotation, D.D. McCarthy and W.E. Carter (eds), 197-201, 1990.Boucher,C., Z. Altamimi and L. Daniel, ITRF station coordinates, a paper presebted at the IGS Network Operations Workshop, Silver Spring, Md., USA, Oct. 18-21, 1993. DeMets,C., R.G. Gordon, D.F. Argus and S. Stein, Current plate motions, Geophys. J. Int., 101, 425- , 1990.Dragert, H., M.Schmidt and X. Chen, The Continuous GPS Tracking for Deformation Studies in Southwestern British Columbia, ION GPS 94, Salt Lake City, Utah, September 20-23, 1994.DMA TR 8350.2, Department of Defense World Geodetic System 1984, Its Definition and Relationships with Local Geodetic System, 2nd Ed., Sep. 1991.IERS 1992 Annual Report, International Earth Rotation Service (IERS), Observatoire de Paris, July 1993.IERS 1993 Annual Report, International Earth Rotation Service (IERS), Observatoirede Paris, July 1994.Kershner, R.B. and R.R. Newton, The TRANSIT System, J. Inst. Navigation, 15, 129-144, 1962.Kouba, J., A review of geodetic and geodynamic satellite Doppler positioning, Review of Space Physics, 21(1), 27- 40, 1983.Kouba, J. , P. Tetrault, R. Ferland and F. Lahaye, IGS data processing at the EMR Master Active Control System Centre, Proc. of 1993 IGS Workshop, 123-132, 1993. Malys,S., and J.A. Slater, Maintenance and enhancemens of the WGS84, ION GPS, Salt Lake City, Utah, September 20-23, 1994.McCarthy, D.D., IERS Standards (1992), IERS Technical Note 13, Observatoire de Paris, July 1992. Mueller, I.I., Review of problems associated with conventional geodetic datums, The Canadian Surveyor, Vol.28, No.5, 514-523, December, 1974.NOAA Professional Paper NOS 2, North American Datum of 1983, Edited by C.R. Schwarz, National Geodetic Survey, NOS, NOAA, U.S. Department of Commerce, 1989.Ross, J.E.R., Triangualtion in Ontario and Quebec, Geodetic Survey of Canada Publication No. 90, Department on Interior, Ottawa, Canada, 1936.Soler, T., J.D. Love, L.W. Hall, R. H. Foote, GPS results from statewide High Precision Networks in the United States, Proc. Int. Geod. Symp. on Satell. Positioning 6th, 573-582, 1992.Swift, E., Improved WGS84 Coordinates for the Defense Mapping Agency and Air Force GPS Tracking Sites, ION GPS 94, Salt Lake City, Utah, September 20-23, 1994.现代大地测量参考框架进行精确的卫星定位导航J.库巴和J. Popelar大地测量部,测绘加拿大,加拿大自然资源部(NRCan)615展位街,渥太华,安大略省,加拿大K1A EO9在NAD83和WGS84坐标参考框架建立超过十年前,以满足大多数测绘,制图,定位和导航应用。

3D打印论文中英文资料外文翻译文献

3D打印论文中英文资料外文翻译文献

3D打印论文中英文资料外文翻译文献原文3D printing technology and its applicationAbstract3D printing technology in the industrial product design, especially the application of digital product model manufacturing is becoming a trend and hot topic. Desktop level gradually mature and application of 3D printing devices began to promote the rise of the Global 3D printing market, Global industrial Analysis company (Global Industry Analysis Inc) research report predicts Global 3D printing market in 2018 will be $2.99 billion.Keywords: 3D printing; Application; Trend1 3D printing and 3D printers3D printing and 3D printing are two entirely different concepts.3D printing is separated into different angles the picture of the red, blue two images, then the two images according to the regulation of parallax distance overprint together, using special glasses to create the 3D visual effect, or after special treatment, the picture printed directly on the special grating plate, thus rendering 3D visual effect of printing technology. And 3D printing refers to the 3D ink-jet printing technology, stacked with hierarchical processing forms, print increase step by step a material to generate a 3D entity, meet with 3D models, such as laser forming technology of manufacturing the same real 3D object digital manufacturing technology.3D printers, depending on thetechnology used by its working principle can be divided into two categories:1.1 3D printer based on 3D printing technologyBased on 3D printing technology of 3D printer, by stored barrels out a certain amount of raw material powder, powder on processing platform is roller pushed into a thin layer, then the print head in need of forming regional jet is a kind of special glue. At this time, met the adhesive will rapidly solidified powder binder, and does not meet the adhesive powder remain loose state. After each spray layer, the processing platform will automatically fall a bit, according to the result of computer chip cycle, until the real finished. After just remove the outer layer of the loose powder can obtain required for manufacturing three-dimensional physical.1.2 3D printers based on fused deposition manufacturing technologyBased on fused deposition manufacturing technology of the working principle of 3D printer is first in the control software of 3D printers into physical data generated by CAD and treated generated to support the movement of materials and thermal spray path. Then hot nozzle will be controlled by computer according to the physical section contour information in printed planar motion on the plane, at the same time by thermoplastic filamentous material for wire agency sent to the hot shower, and after the nozzle to add heat and melt into a liquid extrusion, and spraying in the corresponding work platform. Spray thermoplastic material on the platform after rapid cooling form the outline of a thickness of 0.1 mm wafer, forming a 3D printing section. The process cycle, load, decrease of bench height then layers of cladding forming stacked 3D printing section, ultimately achieve the desired three-dimensional object.2 The application of 3D printing needsThe 3D printing technology support for a variety of materials, can be widely used in jewelry, footwear, industrial design, construction, automotive, aerospace, dental, medical, and even food, etc. Different areas., according to the requirements of application targets used by material with resin, nylon, gypsum, ABS, polycarbonate (PC) or food ingredients, etc.3D printers of rapid prototyping technology has a distinct advantage in the market, the huge potential in the production application, hotapplications outlined below.2.1 Industrial applications"Air cycling" is located in Bristol, UK the European aeronautic defense and Space Company using 3D printers, application of 3D printing technology to create the world's first print bike. The bike to use as strong as steel and aluminum alloy material of nylon, the weight is 65% lighter than metal materials. More interestingly, "air bike", chain wheels and bearings are printed at a time, without the original manufacture parts first, and then the parts together of assembly process, after printing, bicycles will be able to move freely. Bicycle manufacturing process like printing discontinuous in graphic print as simple lines, 3D printer can print out the object space is not connected to each other.2.2 Medical applicationsIn medicine, the use of 3D printing will two-photon polymer and biological functional materials combination modified into the capillaries, not only has good flexibility and compatibility of human body, also can be used to replace the necrosis of blood vessels, combined with artificial organs, partly replacing experimental animals in drug development. Biotechnology in Germany in October 2011 show, Biotechnical Fair), using 3D printers print artificial blood capillary to attract the attention of the participants, these artificial capillary has been applied in clinical medicine.2.3 application of daily life"3D food printer" is developed by Cornell University in New York, the United States food manufacturing equipment. The "3D food printer" used similar routine computer printers, the working principle of ingredients and ingredients in the container (cartridge) in advance only need to enter the required recipe, by supporting the CAD software can keep the food "print out". For many chefs, the new kitchen cooking means that they can create new dishes make food more individuality, higher food value. Using the "3D food printer" making food, from raw materials to finished products can significantly reduce the link, so as to avoid the pollution in the links of food processing, transportation, packing and so on and preservation, etc. Because ofthe cooking materials and ingredients must be placed in the printer, so food raw materials must be liquid or other can "print" state.2.4 IT applicationsRecently, a group of researchers in Disney's use of 3D printing in the same effect with the organic glass high pervious to light plastic, at low cost to print out the LCD screen with a variety of sensors, realize the new breakthrough in the IT applications. Using 3D printing light pipe can produce high-tech international chess; the chess pieces can detect and display the current location. Although the monochrome screen compared with in the daily life, rich and colorful display some insignificant, but it has a 3D printing the advantages of low cost, simple manufacturing process. In addition to the display screen, the use of 3D printing will also be able to print out a variety of sensors. These sensors can be through the stimulation such as infrared light to detect touch, vibration, and the results output.3D printing will create more for life and wisdom city of IT applications.3 The development trend of 3D printing technology3D printing technology continues to develop, greatly reduce the cost of the already from research and development of niche space into the mainstream market, the momentum of development is unstoppable, has become a widespread concern and civil market rapidly emerging new areas.3D printing production model, the application of gifts, souvenirs and arts and crafts, greatly attracted social attention and investment, development speed, the market began to quantity and qualitative leap. It is predicted that in 2020, 3D printing products will account for 50% of the total production. In the next 10 years on the computer to complete the product design blueprint, gently press the "print" key, 3D printers can bit by bit with the designed model. Now some foundry enterprises began to develop selective laser sintering, 3D printer and its application to complex casting time reduced from 3 months to 10 days. Engine manufacturers through 3D printing, large six-cylinder diesel engine cylinder head of sand core development cycles, reduced to 1 week from the past 5 months. The biggest advantage of 3D printing is to expand the designers’ imagination space.As long as you can on the computer design into 3D graphics, whether is different stylesof dress, elegant handicraft, or personalized car, as long as can solve the problem of material, can achieve 3D printing.With 3D printing technology breakthroughs, constantly improved increasingly, the new material of 3D printing in improving speed, size, its technology is constantly optimized, expanding application fields, especially in the field of graphic art potential, producer of the concept of 3D model can better communicate ideas or solutions, a picture can be more than a few hundred or even thousands of words of description. Professionals believe that personalized or customized 3D printing can be envisioned a real-time 3D model in the eyes, can quickly improve product, growth will be more than imagine, will shape the future of social applications.3D printing technology to eliminate traditional production line, shorten the production cycle, greatly reduce production waste, raw materials consumption will be reduced to a fraction of the original.3D printing is not only cost savings, improve production precision, also will make up for the inadequacy of traditional manufacturing, and will rise rapidly in the civilian market, thus opening a new era of manufacturing, bring new opportunities and hope for the printing industry.译文3D打印技术及其应用摘要3D打印技术在工业产品设计,特别是数字产品模型制造领域的应用正在成为一种潮流和热门话题。

【精品】GIS-毕业设计-文献翻译-中英文-地理信息系统网络应用电力系统克里特岛

【精品】GIS-毕业设计-文献翻译-中英文-地理信息系统网络应用电力系统克里特岛

附录一:英文原文A GIS WEB –APPLICATION FOR POWER SYSTEM OF CRETEJ。

Syllignakis,C。

Adamakis, T.M。

PapazoglouThe Technological Educational Institute of Crete (TEIC),Greece ABSTRACTGeographical Information System (GIS)applications are very helpful tools for displaying and analyzing informationfor several technological fields. The research group of Electrical Power System Lab (EPSL) of TEIC is developing aGIS software application for displaying the operational conditions of the power system of Crete,presenting alsocritical information and statistical data for system’s characteristics。

This tool is intended to help training of engineersin the Electrical Department of TEIC to simulate and visualize power system operation and characteristics。

Besides,this tool is very helpful for a power system engineer in observing the whole system operations and system's data。

浅析公路3维电子地图

浅析公路3维电子地图

浅析公路3维电子地图王润平(山西省交通规划勘察设计院山西太原030012 )Ana ly s i s of 3D E l ec t ron ic Roa d M a pW AN G R unping摘要: 3维电子地图是以模拟的形式更加直观地表达现实世界。

介绍了公路 3 维电子地图的应用方向及发展现状,以“山西大运高速公路信息系统”为例,论述了公路3 维电子地图的实现及其关键技术,并对公路3维电子地图的应用前景作了展望。

关键词:公路地图; 3 维电子地图;数字地面模型;数据模型;公路信息系统中图法分类号: P285. 3; P208电子地图是20世纪80 年代初出现的地图新品种,是传统纸质地图与现代技术的结合。

电子地图是以数字地图为基础, 计算机系统为处理平台, 屏幕上实时显示为形式,并提供统计、查询、分析等功能的地图,具有数据与软件的集成性、过程交互性、信息表达多样性、无级缩放与多尺度数据、快速高效的地图检索和地图分析、多维与动态可视化、共享性、低成本性等许多传统纸质地图不可比拟的特点[ 1 ] 。

电子地图的出现使地图的应用范围扩展到了政府决策、市政建设、企业管理、移动互联、电子商务等更广阔的领域。

近年来,在我国逐渐兴起的导航定位、数字城市、网络电子地图等则将电子地图的应用渗透到社会的方方面面[ 2 ] 。

2维电子地图是经过对现实世界的符号化, 以抽象的方式来表达人类对客观世界的认知,而3 维电子地图则是通过模拟的方式更加直观地表达这种认知。

随着计算机软硬件、数字图形图像处理、地理信息建模、虚拟现实等相关技术的发展, 2 维电子地图逐渐向3 维方向发展,并逐渐成为发展的主流。

公路3维电子地图属于专题3 维电子地图,是3 维电子地图在公路建设管理方面的应用,根据应用目的不同,选取适当的基础地理数据与公路专题数据相结合,经计算机系统和3维可视化模块处理, 在屏幕上以3维的形式实时显示公路信息,并提供信息检索、查询、分析等功能。

物联网毕业论文中英文资料外文翻译文献

物联网毕业论文中英文资料外文翻译文献

物联网毕业论文中英文资料外文翻译文献Internet of Things1.the definition of connotationThe English name of the Internet of Things The Internet of Things, referred to as: the IOT.Internet of Things through the pass, radio frequency identification technology, global positioning system technology, real-time acquisition of any monitoring, connectivity, interactive objects or processes, collecting their sound, light, heat, electricity, mechanics, chemistry, biology, the location of a variety of the information you need network access through a variety of possible things and things, objects and people in the Pan-link intelligent perception of items and processes, identification and management. The Internet of Things IntelliSense recognition technology and pervasive computing, ubiquitous network integration application, known as the third wave of the world's information industry development following the computer, the Internet. Not so much the Internet of Things is a network, as Internet of Things services and applications, Internet of Things is also seen as Internet application development. Therefore, the application of innovation is the core of the development of Internet of Things, and 2.0 of the user experience as the core innovation is the soul of Things.2.The meaning of "material"Where the "objects" to meet the following conditions can be included in the scope of the"Internet of Things":1. Receiver have the appropriate information;2. Have a data transmission path;3. Have a certain storage capabilities;4. To have the CPU;5.To have the operating system;6. Have specialized applications;7. Have a data transmitter;8. Follow the communication protocol of Things;9. World Network, a unique number that can be identified.3. "Chinese style" as defined inInternet of Things (Internet of Things) refers to is the ubiquitous (Ubiquitous) terminal equipment (Devices) and facilities (Facilities), including with the "inner intelligence" sensors, mobile terminals, industrial systems, floor control system, the family of Intelligentfacilities, video surveillance systems, and external can "(Enabled), such as RFID, a variety of assets (the Assets), personal and vehicle carrying the wireless terminal" intelligent objects or animals "or" smart dust "(the Mote), through a variety of wireless and / or cable over long distances and / or short-range communication networks to achieve interoperability (M2M), application integration (the Grand Integration), and based on cloud computing, SaaS operation mode, in internal network (intranet), private network (extranet), and / or the Internet (Internet) environment, the use of appropriate information security mechanisms to provide a safe, controlled and even personalized real-time online monitoring, retrospective positioning, alarm linkage, command and control plan management, remote control, security, remote repair and maintenance, online upgrades, statistical reporting, decision support, the leadership of the desktop (showcase of the Cockpit Dashboard) management and service functions, "Everything," "efficient, energy saving, security environmental protection, "" possession, control, Camp integration [1].4.EU definitionIn September 2009, the Internet of Things and enterprise environments held in Beijing, China-EU Seminar on the European Commission and Social Media Division RFID Division is responsible for Dr. Lorent Ferderix, given the EU's definition of things: the Internet of Things is adynamic global network infrastructure, it has a standards-based and interoperable communication protocols, self-organizing capabilities, including physical and virtual "objects" of identity, physical attributes, virtual features and smart interface and seamless integration of information networks . Internet of Things Internet and media, the Internet and business Internet one, constitute the future of the Internet.5.changeThe Internet of Things (Internet of Things) the word universally recognized at home and abroad Ashton, Professor of the MIT Auto-ID Center in 1999 first proposed to study RFID. The report of the same name released in 2005, the International Telecommunication Union (ITU), the definition and scope of the Internet of Things has been a change in the coverage of a larger expansion, no longer refers only to the Internet of Things based on RFID technology.Since August 2009, Premier Wen Jiabao put forward the "Experience China" Internet of Things was officially listed as a national one of the five emerging strategic industries, to write the "Government Work Report" Internet of Things in China has been the great concern of the society as a whole degree of concern is unparalleled in the United States, European Union, as well as other countries.The concept of Internet of Things is not so much a foreign concept, as it has been the concept of a "Made in China", his coverage of the times, has gone beyond the scope of the 1999 Ashton professor and the 2005 ITU report referred to, Internet of Things has been labeled a "Chinese style" label.6.BackgroundThe concept of Internet of Things in 1999. Internet-based, RFID technology and EPC standards, on the basis of the computer Internet, the use of radio frequency identification technology, wireless data communication technology, a global items of information to real-time sharing of the physical Internet "Internet of things" (referred to as the Internet of Things) , which is also the basis of the first round of the China Internet of Things boom set off in 2003.The sensor network is built up based on sensing technology network. Chinese Academy of Sciences in 1999 on the start sensor network research and has made some achievements in scientific research, the establishment of applicable sensor network.1999, held in the United States, mobile computing and networking International Conference, "The sensor network is a developmentopportunity facing humanity in the next century. In 2003, the United States, "Technology Review" proposed sensor network technology will be future changes ten people's lives first.November 17, 2005, the WSIS held in Tunis (WSIS), the International Telecommunication Union released ITU Internet Report 2005: Internet of Things ", citing the concept of the" Internet of things ". The report pointed out that the ubiquitous "Internet of Things" communication era is approaching, all the objects in the world, from tires to toothbrushes, from housing to the tissue via the Internet, take the initiative to be exchanged. Radio Frequency Identification (RFID), sensor technology, nanotechnology, intelligent embedded technology will be more widely used.According to the description of the ITU, the era of things, a short-range mobile transceivers embedded in a variety of daily necessities, human beings in the world of information and communication will receive a new communication dimension, from any time communication between people of the place of connection extended to the communication connection between persons and things and things and things. The Internet of Things concept of the rise, largely due to the International Telecommunication Union (ITU), the title of Internet of Things 2005 annual Internet Report. However, the ITU report the lack of a clear definition of Things.Domestic Internet of Things is also there is no single standard definition, but the Internet of Things In essence, the Internet of Things is a polymer application of modern information technology to a certain stage of development and technological upgrading of various sensing technology modern network technology and artificial intelligence and automation technology aggregation and integration of applications, so that the human and material wisdom of dialogue to create a world of wisdom. Because the development of the Internet of Things technology, involving almost all aspects of IT, innovative application and development of a polymer, systematic, and therefore be called revolutionary innovation of information industry. Summed up the nature of the Internet of Things is mainly reflected in three aspects: First, the Internet features that need to be networked objects must be able to achieve the interoperability of the Internet; identification and communication features, that is included in the Internet of Things "objects" must to have the functions of automatic identification and physical objects communication (M2M); intelligent features, the network system should have automated, self-feedback and intelligent control features January 28, 2009, Obama became the President of the United States, held with U.S. business leaders a "round table", as one of the only two representatives, IBM CEO Sam Palmisano for thefirst time that "the wisdom of the Earth" this concept, it is recommended that the new government to invest in a new generation of intelligent infrastructure.February 24, 2009 news, IBM Greater China CEO money crowd called "Smarter Planet" strategy announced in the forum 2009IBM.This concept was put forth, that is the great concern of the United States from all walks of life, and even analysts believe that IBM's vision is very likely to rise to U.S. national strategy, and caused a sensation in the world. IBM believes that the industry, the next phase of the mission is to make full use of the new generation of IT technology in all walks of life among specifically, is the embedded sensors and equipment to the power grid, railways, bridges, tunnels, highways, buildings, water supply systems dams, oil and gas pipelines and other objects, and is generally connected to the formation of Things.Strategy conference, IBM, and implant the concept of "wisdom" in the implementation of the infrastructure, strong, not only in the short term to stimulate the economy, promote employment, and in a short period of time for China to build a mature wisdom infrastructure platform.IBM "Smarter Planet" strategy will set off again after the wave of Internet technology industrial revolution. Former IBM CEO Lou Gerstner has raised an important point of view, every 15 years, a revolution in computing model. This judgment is the same as Moore's Law accurately call it a "15-year cycle Law". Before and after 1965, changes to the mainframe as a symbol, 1980 marked by the popularization of personal computers, 1995, the Internet revolution. Each such technological change are caused by the enterprise, industry and even the national competitive landscape of major upheaval and change. To a certain extent in the Internet revolution is ripening by the "information superhighway" strategy. 1990s, the Clinton administration plan for 20 years, $ 200 billion to -4000 billion, construction of the U.S. National Information Infrastructure, to create a huge economic and social benefits.Today, the "Smarter Planet" strategy by many Americans that there are many similarities with the "information superhighway", the same they revive the economy, a key strategy for competitive advantage. The strategy can be set off, not only for the United States, such as the Internet revolution was the wave of technological and economic concern, more attention from the world."Internet of Things prospects are very bright, it will dramatically change our current way of life." Demonstration director of the Center of Nanjing University of Aeronautics and Astronautics,National Electrical and Electronic Zhao Guoan said. Industry experts said that the Internet of things to our life personification of the things became a kind of human.Goods (goods) in the world of physical objects associated with each other "exchange", without the need for human intervention. The Internet of Things using radio frequency identification (RFID) technology, to achieve the interconnection and sharing of the automatic identification of goods (products) and information through the computer Internet. It can be said that the Internet of Things depict the world is full of intelligent. In the world of Internet of Things, material objects connected to the dragnet.The second session, held at Peking University in November 2008, China Mobile Government Seminar "Knowledge Society and Innovation 2.0", the experts made the mobile technology, the Internet of Things technology led to the development of economic and social form, innovative forms of change, and promote the The next generation of innovation for the knowledge society as the core of user experience (innovative 2.0) the formation of innovation and development of the form to pay more attention to the user to focus on people-oriented. Research institutions is expected to 10 years, the Internet of Things may be mass adoption of this technology will develop into one of thousands of yuan-scale high-tech market, the industry than the Internet 30 times.It is learned that the things industry chain can be broken down into the identity, perception, processing and information transfer, four links, each link of the key technologies for the wireless transmission network of RFID, sensors, smart chip and telecom operators. EPOSS in the "Internet of Things in 2020" report, an analysis predicted that the future development of the Internet of Things will go through four stages, 2010, RFID is widely used in the field of logistics, retail and pharmaceutical objects interconnect 2010 to 2015, 2015 ~ In 2020, the object into the semi-intelligent, intelligent objects into 2020.As the vanguard of the Internet of Things, RFID has become the most concerned about the technology market. The data show that the global RFID market size in 2008 from $ 4.93 billion in 2007 rose to $ 5.29 billion, this figure covers all aspects of the RFID market, including tags, readers and other infrastructure, software and services. RFID card and card-related infrastructure will account for 57.3 percent of the market, reaching $ 3.03 billion. Application from financial and security industries will drive the market growth of RFID cards. Analysys International forecasts, the Chinese RFID market size in 2009 will reach 5.0 billion, a CAGR of 33%, in which the electronic tag is more than 3.8 billion yuan, the reader close to 700 million yuan, software and services marketto reach 500 million yuan pattern.MEMS is the abbreviation of the micro-electromechanical systems, MEMS technology is built on the basis of micro / nano, the market prospect is broad. The main advantage of the MEMS sensor is the small size, large-scale mass production cost reduction, mainly used in two major areas of automotive and consumer electronics. Under ICInsight the latest report is expected in 2007-2012, global sales of semiconductor sensors and actuators based on MEMS will reach 19 percent compound annual growth rate (CAGR), compared with $ 4.1 billion in 2007 to five years will achieve $ 9.7 billion in annual sales.7.PrincipleInternet of Things is on the basis of the computer Internet, RFID, wireless data communications technology, to construct a cover everything in the world's "Internet of Things". In this network, the goods (products) to each other "exchange", without the need for human intervention. Its essence is the use of radio frequency identification (RFID) technology to achieve the interconnection and sharing of the automatic identification of goods (products) and information through the computer Internet.The Internet of Things is a very important technology is radio frequency identification (RFID) technology. RFID is radio frequency identification (Radio Frequency Identification) technology abbreviation, is an automatic identification technology in the 1990s began to rise, the more advanced a non-contact identification technology. The development of RFID technology based on a simple RFID system, combined with existing network technology, database technology, middleware technology, to build a one composed by a large number of networked readers and numerous mobile label, much larger than the Internet of Things trend.RFID, It is able to let items "speak" a technique. In the "Internet of Things" concept, RFID tags are stored in the specification and interoperability information collected automatically by wireless data communications network to a central information system, to achieve the identification of goods (products), and then through the open computer network for information exchange and sharing, items "transparent" management.The information technology revolution in the Internet of Things is referred to as IT mobile Pan of a specific application. Internet of Things through IntelliSense, identification technology and pervasive computing, ubiquitous network convergence applications, breaking the conventionalthinking before, human beings can achieve ubiquitous computing and network connectivity [3]. The traditional thinking has been the separation of physical infrastructure and IT infrastructure: on the one hand, airports, roads, buildings, while on the other hand, the data center, PC, broadband. In the era of the "Internet of Things", reinforced concrete, cable with the chip, broadband integration into a unified infrastructure, in this sense, the infrastructure is more like a new site of the Earth, the world really works it, which including economic management, production operation, social and even personal life. "Internet of Things" makes it much more refined and dynamic management of production and life, to manage the future of the city to achieve the status of "wisdom" to improve resource utilization and productivity levels, and improve the relationship between man and nature. 8.Agency1, institution-buildingAs the first national Internet of Things industry community organizations - the application of professional Committee of China Electronic Chamber of Things technology products (referred to as: "objects of the IPCC"), the Ministry of Civil Affairs in June 2010, preliminary approved by the Ministry of August being reported that the Ministry of Civil Affairs for final approval.2, the main taskServe as a bridge between business and government to assist the Government of the industry guidance, coordination, consultation and services to help members to reflect the business requirements to the Government; coordinate the relationship between enterprises to strengthen technical cooperation, product distribution, the elimination of vicious competition ; supervision of members the correct implementation of national laws and regulations, to regulate the industry; member of information communication technology products, cooperation, resource sharing, capital operation, and promote the application of Internet of Things technologies and products, and promote the Internet of Things industrial scale , co-development.9.ConstructionInternet of Things in the practical application to carry out requires the involvement of all walks of life, and need the guidance of the national government as well as related regulations and policies to assist the launching of the Internet of Things has the scale, broad participation, management, technical, and material properties, etc. other features, the technical problem is the most crucial issues of Things billion Bo logistics consulting, Internet of Things technology is an integratedtechnology, a system not yet which company has overall responsibility for network planning and construction of the entire system, theoretical studies have commenced in all walks of life and the practical application is limited to within the industry. The key is on the planning and design and research and development of the Internet of Things research in the field of RFID, sensors, embedded software, and transmission of data calculation. In general, to carry out the steps of the Internet of things mainly as follows:(1) identified the object attributes, properties, including static and dynamic properties of the static property can be stored directly in the label, the dynamic properties need to start with sensors to detect real-time;(2) the need to identify the equipment to complete the reading of object attributes, and information into a data format suitable for network transmission;(3) the object of information transmitted over the network to the information processing center (processing center may be distributed, such as home computers or mobile phones, may also be centralized, such as China Mobile IDC) by the processing center to complete the object communication calculation.10.key areasInternet of Things 4 key areas:(1) RFID;(2) sensor network;(3) The M2M;(4) integration of the two.11.TrendIndustry experts believe that the Internet of things on the one hand can improve economic efficiency and significant cost savings; the other hand, can provide technical impetus to global economic recovery. Currently, the United States, the European Union are all invested heavily in-depth study to explore the Internet of Things. The country is also highly concerned about the emphasis of Things, Industry and Information Technology Ministry in conjunction with the relevant departments are conducting research in a new generation of IT to the formation of policies and measures to support the development of a new generation of IT.China Mobile CEO Wang Jianzhou has repeatedly mentioned the Internet of Things willbecome the focus of future development of China Mobile. He will be invited to Taiwan to produce RFID, sensors and bar code manufacturers and China Mobile. According to him, the use of the Internet of Things technology, Shanghai Mobile has a number of industrial customers tailor the data collection, transmission, processing and business management in one set of wireless application solutions. The latest data show that Shanghai Mobile has more than 100,000 chips mounted on a taxi, bus, various forms of matter networking applications in all walks of prowess, to ensure the orderly operation of the city. During the Shanghai World Expo, "the bus services through" will be fully applied to the Shanghai public transport system, the smooth flow traffic to the most advanced technology to protect Expo area; for logistics transportation management, e-logistics ", will provide users with real-time accurate information of Cargo, vehicle tracking and positioning, the transport path selection, logistics network design and optimization services greatly enhance the comprehensive competitiveness of logistics enterprises.In addition, the popularization of the "Internet of Things" for the number of animals, plants and machinery, sensors and RFID tags of items and related interface devices will greatly exceed the number of mobile phones. The promotion of the Internet of Things will become a drive to promote economic development for the industry to open up a potential development opportunities. According to the current demand on the Internet of Things, in recent years, billions of sensors and electronic tags, which will greatly promote the production of IT components, while increasing the number of job opportunities.According to reports, it is necessary to truly build an effective Internet of things, there are two important factors. First, the scale, only with the scale to make the items of intelligence play a role. For example, a city of one million vehicles, if we only 10000 vehicles installed on the smart system, it is impossible to form an intelligent transportation system; two mobility items are usually not static, but in the state of the movement , we must maintain the items in the state of motion, and even high-speed motion state can at any time for dialogue.FORRESTER of the authority of the U.S. advisory body predicted that 2020, the world of business of the Internet of Things, compared with the business of interpersonal communication, will reach 30 to 1, so the "Internet of Things" is known to be the next one trillion communications services.Internet of Things heat wave Why is rapidly growing in China? Internet of Things in Chinarapid rise thanks to the several advantages of our country in terms of things.In the early 1999 launched the Internet of Things core sensor network technology research, R & D level in the world; the second, sensor network field in the world, China is the standard one of the dominant country, the patent owner; third China is one of the countries to achieve a complete industrial chain of Things; Fourth, China's wireless communications network and broadband coverage provides a solid infrastructure to support the development of the Internet of Things; Fifth, China has become the world's first the three major economies, with strong economic strength to support the development of the Internet of Things.12.MythThe current understanding of the Internet of things there are a lot of misunderstanding, which is also a direct impact on our understanding of Things on the development of the logistics industry, it is necessary first to distinguish errors, clarify our thinking.One sensor networks or RFID network equivalent of Things. The fact that sensor technology, or RFID technology, or are simply one of the information collection technology. In addition to the sensor technology and RFID technology, GPS, video recognition, infrared, laser, scanning can be achieved automatically identify physical objects to communicate technical information collection technology can become the Internet of Things. Sensor networks or RFID network is just an application of Things, but not all of Things.Second, the Internet of Things as a myriad of unlimited extension of the Internet of Things as a completely open for all things, all of the interconnections, all shared Internet platform.In fact, the Internet of Things is not simple infinite extension of the global sharing of the Internet. Even if the Internet is also not only refers to we typically think of the international sharing computer network, Internet, WAN and LAN. Internet of Things can be both an extension of our usual sense of the Internet to the matter; LAN, professional can also be based on real needs and industrial applications. The reality is not necessary and can not make all the items networking; no need to make professional, LAN must be connected to the global Internet sharing platform. Of things in the future the Internet will be very different from the professional network of similar smart logistics, smart transportation, smart grid; the intelligence community and other local area network is the largest use of space.Ter, that the ubiquitous network of the Internet of Things Internet of Things, and therefore theInternet of Things is a castle in the air, is difficult to achieve the technology. In fact the Internet of things are real, many of the primary Internet of Things applications already for our services. The Internet of Things concept is introduced in many real-world applications based on polymeric integrated innovation, pre-existing network with the Internet of Things, intelligent, automated system, summarized and upgrading it upgraded from a higher perspective our knowledge.Four of Things as a basket, and everything installed inside; based on self-awareness, and only be able to interact, communication products as the Internet of Things applications. For example, just embedded some of the sensors, to become the so-called Internet of Things appliances; products labeled with RFID tags, became the Internet of Things applications.esThings widely used throughout the intelligent transportation, environmental protection, government, public safety, peace at home, smart fire, industrial monitoring, environmental monitoring, elderly care, personal health, floriculture, water monitoring, food traceability, enemy detection and intelligence collection and other fields.International Telecommunication Union in 2005, a report has portrayed the picture of the era of the "Internet of Things": car when the driver operational errors will automatically alarm; briefcase will remind the owner forgot something; clothes will "tell" washing machine color and water temperature requirements. Billion Bo logistics consulting vivid introduction of Things in the logistics field, for example, a logistics company, application of Things truck, when loading overweight, the car will automatically tell you overloaded and overload how many, but the space remaining , the severity of goods with how to tell you; when handling staff unloading a cargo packaging may be shouting "throw you hurt me", or "My dear, you do not get too barbaric, you can?"; when the driver and others gossip, trucks will pretend boss's voice roaring "stupid, the grid!Internet of things to make full use of a new generation of IT technology in all walks of life among, specifically, is embedded sensors and equipment to the power grid, railways, bridges, tunnels, highways, buildings, water systems, dams, oil and gas pipelines, etc.kinds of objects, and then "Internet of Things" with the existing Internet to integrate and realize the integration of human society and the physical system, which in this integrated network, there is the ability to super-powerful central computer cluster, integrated network staff implementation of real-time management and control of the machinery, equipment and infrastructure, on this basis, the human。

测绘专业毕业设计中英文文献GIS

测绘专业毕业设计中英文文献GIS

Definitions of GIS“GIS” is an acronym meaning of Geographic Information System. In order to provide a good understanding of GIS, the following two definitions given by R hind (1989) and the UnitedStates Geological Survey (USGS, 1997) respectively are presented first.1 “a system of hard w are, software, a n d procedures designed to support the capture, management, manipulation , analysis, modeling, and display of spatially referenced data for solving complex planning an d management problems .”2 “a co mputer system capable of assembling , storing, manipulating, and displaying geographically referenced information , i.e., data identified according to their location .”GIS books generally adopt the ideas expressed by these two definitions. These two characteristics distinguish GIS from other types of information systems: The word “Geographic” in GIS explains “spatially” where things are such as the location of nations, states, counties, cities, schools, roads, rivers, lakes, and the list can go on and on. Spatially means where on the earth’s surface an object or feature is located. T his can be as simple as the latitude and longitude of a feature. T he geographic feature or object can be anything of interest.“ Information” in GIS is the “data” or “attribute” information about specific features that we are interested in. The name of the feature, what the feature is, the location of the feature, and any other information that is important. An example could be the name of a city , w here it is located , ho w big it is in square feet ( area) , its population , its population in the past, and any other information that is important . “System” in GIS is the computer software that is written to help people analyze the data, look at the data and combineit in various ways to show relationships or to create geographic models .A GIS can be made up of a variety of software and hardware tools, as long as they are integrated to provide a functional geographic data processing tool.As mentioned above, GIS is a computer system that links geographic information (where things are) with descriptive information (what things are) . Unlike a flat paper map, w here“What you see is w hat you get”, a GIS can present m any layers of different information. To use a paper map, all you do is unfold it. Spreadout before you is a representation of cities and roads, mountains and rivers, railroads, and political boundaries. T he cities are represented by little dots or circles, the roads by black lines, the mountain peaks by tiny triangles, and the lakes by s m all blue areas similar to the real lakes . A digital map is not muchmore difficult to use than a paper map. As on the paper map, there are dots or points that represent features on the map such as cities, lines that represent features such as roads, and small areas that represent features such as lakes . All this information—where the point is located , how long the road is, and even how many square miles a lake occupies—is stored as layers in digital for m at as a pattern of ones and zeros in a computer . Think of this geographic data as layers of information underneath the computer screen. Each layer represents a particular the m e or feature of the map. O ne the m e could be made up of all the roads in an area. Another me could represent all the lakes in the same area. Yet another could represent all the cities. These themes can be laid on top of one another, creating a stack of information about the same geographic area. E ach layer can be turned off and on, as if you were peeling a layer off the stack or placing it back on. You control the amount of information about an area that you want to see, at anytime, on any specific map. The technology components of a GIS can be explained interims of hard ware, software and human resources. GIS hard ware includes: computers, computer configuration/ net works, input devices, printers, and storage systems. Computers for GIS usage can be P Cs or supercomputers. These computers can be stand-alone units or can be hooked into a network environment. Input devices include digitizers and scanners. Printers and plotters are used to produce a hardcopy map. GIS storage systems include: optical disks, magnetic disks (such as a hard drive), floppy disks or magnetic tapes.GIS software includes both GIS program and special application packages, such as digital Terrain modeling and network analysis. The main difference between GIS software programs and desktop mapping programs is the ability of GIS programs to perform spatial analysis. ARC/ INFO by Environ mental Systems Research Institute (ESRI) Inc. is one of typical examples of GIS software packages. Desktop mapping programs offer m any of the same features, as a GIS, but their ability to support spatial analyses are limited. They are developed to satisfy individual user needs for mapping presentations. MapInfo developed by MapInfo Corp is an example of popular desktop mapping programs. Human resources used to operate a GIS typically include: operational staff, technicalprofessional staff, and management personnel Operational staffers people such as (1) cartographers, who monitor the design of map displays, thestandards for map symbols and standard map series, (2) data capturers, who converts map into digital form and (3) potential usersof a GIS . Technical professional staff include (1) information analysts w ho solve particular user problems and satisfy their information needs, (2) system administrators, who are responsible for keeping the system (hardware/ software) operational , (3) programmers, who translate the application specifications prepared by the analyst into programs and (4) the database administrator, w ho assists the analysts, programmers and users to organize geographic features into layers, identify sources of data , develop coding structures for no graphics data, and document information about the contents of the databases . Management personnel include (1 ) the manager, who monitors the daily performance of the GIS project Implementation team and manages the output production as required by the organization and (2) the Quality Assurance Coordinator w ho manages the output of the final product to ensure that it meets the conversion specification and data acceptance plan. H o w a GIS Works:A GIS works by providing a way to capture or input data , store , retrieve and manage the data , manipulate and analyze the data , and finally a w ay of displaying that data as a map or as a document or both . Let’s take a closer look as each of these aspects of GIS.Data Input: All GIS data ha s to be in a digital form at so whether it’s a report, a photo, a map, or information gathered in the field , it has to be made digital . Obtaining geographic data to insert into a GIS is a large subject in which includes a number of different approaches. One of the most common ways to collect spatial geographic data is to perform a physical survey. This includes surveying the land, underwater areas, and underground features of the earth (which are referred to as field survey, hydrographic survey and mining survey respectively) .Basic forms of data input include: (1) Typing: Reports, survey documents,population statistics, etc., all have to be entered into the computer preferably in a data base for m at or as tabular data . (2) Scanning: Paper maps such as topographic maps, aerial photographs, remotely sensed images if not already in a digital for m at need to be scanned and then georeferenced or georectified. When a picture or a map or an aerial photo is georeferenced it will open in a GIS program in the right place on a map in relation to other map objects being viewed. They will be in the proper place spatially. (3) Digitizing: currently digitizing is the most common method for converting existing maps and images into digital form. Digitizingis basically tracing points, lines, or areas fro m a paper map , or aerial photo so that instead of a photograph or a raster image , there is no w a digital line graphic or vector file .(4) GPS data capture: Data can also be placed in a GIS as points, lines, and polygons from a GPS unit if it has the capability of recording such information. (5) Aerial photography/remote sensing: T his is an increasingly popular way to gather spatial data. Aerial photographs are taken fro m an aircraft, after which they are measured and interpreted. Similarly, satellite re mote sensing can be interpreted for physical features and attributes. (6)Censuses: Censuses conducted by the U.S. Census Bureau gather a variety of demographic data such as population , age structure , sex ratio, race co m position , employment rates . (7) Statistics: Statistics are a set of mathematical methods used to collect and analyze data .These methods include the collection and study of data at different time intervals and at a fixed location, providing information for yearbooks, weather station reports, etc. This information often has a spatial component and can thus be incorporated into a GIS. (8) Tracking: Tracking is a process of collecting attribute data on changes that occur at a location over a period of time. Examples of tracking include: monitoring the change of an ecosystem, and real-time monitoring of a moving objects such as vehicles.Data Storage, Retrieval, and Management: Different types of information required for a GIS require storage which allows the information to be updated and queried for analysis by the user. There are two types of information to be stored; spatial data and attribute data, which is the topic of next text. Data Manipulation and Analysis: A good system and/ or software package allows the user to define and execute spatial and attribute procedures. T his is commonly thought of as the heart of the GIS. Overlaying, buffering, modeling, and analysis are so m e of the methods used in building a coverage or project. It also takes the users knowledge to recognize what is seen in the resulting map and data. The power of GIS is in the analysis of data.Data Output: Usually this is a map or graphic, which the user has generated after analyzing the data. School districts can use GIS to help the m in decisions like school boundaries and then create a map to distribute to the community. Tabular data and reports can be generated as w ell to help explain the details seen in the map or graphic and ho w the conclusions w ere derived.地理信息系统基础GIS定义GIS是一个只取首字母的地理信息系统意义的缩写词。

三维电子地图的设计与实现毕业设计中英文对照资料外文翻译文献

三维电子地图的设计与实现毕业设计中英文对照资料外文翻译文献

中英文对照资料外文翻译文献基于WebGIS的校园三维电子地图的设计与实现一.导言如今,数字化和信息化是当今时代的主题。

随着信息革命和计算机科学的发展,计算机技术已经渗透到科学的各个领域,并引起了许多革命性的变化,在这些科目,古代制图学也不例外。

随着技术和文化的不断进步,地图变化的形式和内容也随之更新。

在计算机图形学中,地理信息系统(GIS)不断应用到Web,制作和演示的传统方式经历了巨大的变化,由于先进的信息技术的发展,地图的应用已经大大延长。

在这些情况下,绘图将面临广阔的发展前景。

电子地图是随之应运而生的产品之一。

随着计算机技术,计算机图形学理论,遥感技术,航空摄影测量技术和其他相关技术的飞速发展。

用户需要的三维可视化,动态的交互性和展示自己的各种地理相关的数据处理和分析,如此多的关注应支付的研究三维地图。

东北石油大学及其周边地区的基础上本文设计并建立三维电子地图。

二.系统设计基于WebGIS的校园三维电子地图系统的具有普通地图的一般特性。

通过按键盘上的箭头键(上,下,左,右),可以使地图向相应的方向移动。

通过拖动鼠标,可以查看感兴趣的任何一个地方。

使用鼠标滚轮,可以控制地图的大小,根据用户的需求来查看不同缩放级别的地图。

在地图的左下角会显示当前鼠标的坐标。

在一个div 层,我们描绘了一个新建筑物的热点,这层可以根据不同的地图图层的显示,它也可以自动调整。

通过点击热点,它可以显示热点的具体信息。

也可以输入到查询的信息,根据自己的需要,并得到一些相关的信息。

此外,通过点击鼠标,人们可以选择检查的三维地图和卫星地图。

主要功能包括:•用户信息管理:检查用户名和密码,根据权限设置级别的认证,允许不同权限的用户通过互联网登录系统。

•位置信息查询:系统可以为用户提供模糊查询和快速定位。

•地图管理:实现加载地图,地图查询,图层管理,以及其他常见的操作,例如距离测量和地图放大,缩小,鹰眼,标签,印刷等等。

•漫游地图:使用向上和向下键漫游的任何区域的地图,或拖动和拖放直接。

信息技术发展趋势研究论文中英文外文翻译文献

信息技术发展趋势研究论文中英文外文翻译文献

信息技术发展趋势研究论文中英文外文翻译文献本文旨在通过翻译介绍几篇关于信息技术发展趋势的外文文献,以帮助读者更全面、深入地了解该领域的研究进展。

以下是几篇相关文献的简要介绍:1. 文献标题: "Emerging Trends in Information Technology"- 作者: John Smith- 发表年份: 2019本文调查了信息技术领域的新兴趋势,包括人工智能、大数据、云计算和物联网等。

通过对相关案例的分析,研究人员得出了一些关于这些趋势的结论,并探讨了它们对企业和社会的潜在影响。

2. 文献标题: "Cybersecurity Challenges in the Digital Age"- 作者: Anna Johnson- 发表年份: 2020这篇文献探讨了数字时代中信息技术领域所面临的网络安全挑战。

通过分析日益复杂的网络威胁和攻击方式,研究人员提出了一些应对策略,并讨论了如何提高组织和个人的网络安全防护能力。

3. 文献标题: "The Impact of Artificial Intelligence on Job Market"- 作者: Sarah Thompson- 发表年份: 2018这篇文献研究了人工智能对就业市场的影响。

作者通过分析行业数据和相关研究,讨论了自动化和智能化技术对各个行业和职位的潜在影响,并提出了一些建议以适应未来就业市场的变化。

以上是对几篇外文文献的简要介绍,它们涵盖了信息技术发展趋势的不同方面。

读者可以根据需求进一步查阅这些文献,以获得更深入的了解和研究。

关于TITAN3DGeo-view在水利水电信息工程中的应用论文外文翻译-中英文论文翻译

关于TITAN3DGeo-view在水利水电信息工程中的应用论文外文翻译-中英文论文翻译

字数:共计2441字论文题目:关于TITAN 3D Geo-view在水利水电信息工程中的应用第一部分外文翻译About TITAN 3D Geo-view information in theWater Resources and Hydropower Engineering Abstract: TITAN 3D Geo-view is rapidly in recent years developed a geoscience data and computer combination of a new geo-information science and technology, which incorporates real-world objects in the geological position and related properties of organic combine to meet the user to learn information management,and with its unique geological data analysis and visualization of expression, a variety of decision support.Keywords: Water Resources and Hydropower; engineering one, TITAN 3D Geo-view three-dimensional visualization features Introduction to Science Information System (TITAN 3DGeo-view) is the first large-scale three-dimensional visualization of geo-information system software platform, is a'digital land 'Construction and land resource management and effective information technology tools for different users can extract some of these components characteristics, constitute a series of applications can also be basedon the user's specific needs, based on the core module to supplement the development, the formation of specialized applications. TITAN 3D Geo-view is built on grass-roots (data collection point), can be a variety of geological data collection, storage, management, processing and use of basic information systemsand integrated systems. The system has the following salient features: (1) with astrong theme of the core database, technical approach and stacked composite application model (2) using object-oriented technology, data warehouse technology and network technology, has a 'multi-S (DBS , CIS, RS, GPS, CADS and ES, etc.) 'combined with integrated features (3) the use of industry or sectorunified data model, a standard code system, standardized schema legend, the agreed approach and common software interface, a higher professional characteristics.Two, TITAN 3D Geo-view of research applications so far, domestic and foreign research to study three-dimensional visualization software has been a lot of information, but for its research applications, summarized the situation summedup in two ways First, the use of TITAN 3D Geo- view the system to handle the user's data; second is TITAN 3D Geo-view based on the development of the use ofits library to develop user-specific secondary three-dimensional visualization of geo-information system software has been successfully applied to include Water, water, underground utilities, disaster prevention and defense, underground caverns, mining and other items of engineering design and construction of the geological survey information for urban and rural construction, mineral exploitation and environmental protection of the project site, geological exploration, disaster prevention , project management and planning decision making and its product types include: (1) three-dimensional urban geology and groundwater resources management information system, (2) three-dimensional subsurface structure and engineering survey, design system, (3) three-dimensional design of mineral exploration and mining information systemsof these applications in real time, fast, dynamic access, management and processing of mineral resources, water conservancy, hydropower, roads, railways, tunnels, bridges, subways, air defense facilities, geological exploration,development and design and construction information, can be applied to urbanand rural construction, project management, environmental monitoring, seismic zoning, 'disaster prevention and planning decision-making.Three, TITAN 3D Geo-view in the construction of water conservancy and hydropower project applications will TITAN 3D Geo-view used in the construction of water conservancy and hydropower project, the digitization of information, visualization, visualized as a starting point, the construction processcan be complex image with an image to describe it, for the full, accurate and rapid analytical grasp of the whole construction process provides a powerful analyticaltool, to achieve the efficient application of engineering and scientific information management, and design visualization results, and thus to provide an intuitive decision-making and design image information to support this decision to the construction design and provides a simple science, image analysis and intuitive visualization tools designed to help promote water conservancy and hydropower,work smart, modern development, and greatly increase the project design and management the level of modernization, engineering design community to promote the 'design revolution.'1 TITAN 3D Geo-view three-dimensional modeling of three-dimensional data model, application of geological data is based on a series of geological survey data, including geological mapping in a variety of point-like data, including trenching,adits, shafts and drill holes and other linear data, as well as geological maps, geological data, such as flat profile and only after interpolation simulation, so thatone-dimensional, two-dimensional data after a three-dimensional characteristicsof three-dimensional, so we can not as a simple data one-dimensional, two-dimensional data structures to handle, and three-dimensional datastructures can not be directly described the need to seek a kind of hierarchy, bothline and surface description can describe the body, and one line into one side andthe surface after the topology methods to maintain, compared to the border instead of (B-Rep: Boundary Replace-ment) model is more appropriate. The model used to replace the physical boundaries of the entity, and by the boundary topology to create the link. space objects normally can be decomposed into a collection of four types of elements, namely point, line, surface and body, each element of the geometry data type, type, logo and the topological relationship between the composition of three-dimensional boundaries of the entity to represent it, and through space topology relationship to establish the boundariesof the contact is conducive to physical location and topology of space to maintain,but also conducive to further the three-dimensional geological model and the dynamic evolution of the shear vector simulation method using B-Rep model forhuman-computer interaction modeling process.2 TITAN 3D Geo-View-Aided Design Application SubsystemThe complexity of 3D editing, interactive three-dimensional geological data edit transition to TITAN 3D Geo-view two-dimensional editing subsystem, the approach include: (1) geological map, or directly edit the geological section, (2)the establishment of auxiliary section, directly edit the geological map or geological profile of the data mainly from the original trenching, adits, shafts and boreholes, etc. as raw data preparation, three-dimensional systems can also provide external interfaces to other format data imported into the system, suchas DXF, 3D, WAL, WAP, WAT, DEM, 3DV, BMP, SHP, CRD, CEX data formats,while providing external interfaces, other software applications to export systemfor the auxiliary section will provide users with cutting sections in the current model, the formation of the current model set position profile, enter the two-dimensional subsystem on the basis of geological knowledge and experience profile to edit amendment to the geological profile in line with current regional geology, edited After the edited profile information to a three-dimensional system, involved in modeling.Fourth, the prospect TITAN 3D Geo-view itself is in constant development, it isthe construction of water conservancy and hydropower projects in the application should also continue to develop. Application development, not onlywith TITAN 3D Geo-view itself is a combination of development, but also with the Water Resources and Hydropower Engineering combining professional in the construction of water conservancy and hydropower projects in the future, TITAN 3D Geo-view combined with other technologies will be more closely applied more widely.??? water conservancy and hydropower engineering layout visualization program requirements are not limited to simple The performance for interactive layout options to modify, component-based TI-TAN 3D Geo-view (ComTITAN 3D Geo-view) is an important application development trends. Conclusion TITAN 3D Geo-view powerful spatial analysis features and graphical display capabilities for engineering design and research results provide a strongvisual expression of modern methods, but, TITAN 3D Geo-view applied to the construction of water conservancy and hydropower projects there are many notwholly satisfactory, such as database modeling applications is still relatively weak,can be integrated with different technologies to overcome. With Ger, View the application of in-depth study, a single TITAN 3D Geo-view applications the existence of defects and deficiencies will be resolved and weaken gradually. integration of various techniques to become TITAN 3DGeo-view of the clear trends in the application, whether it is combined with simulation technology, orin the 3s, 4s, and more s the concept of integration, the embodied in a kind ofmultiple systems, multiple technology integration ideas, which will also promotethe TITAN 3DGeo-view of the more in-depth applications. With the large-scalewater conservancy and hydropower engineering information management, real-time, rapid demand Web-based transmission GIS application to become inthe future, TITAN3D Geo-view with the direction of applied research projects with short, should TITAN 3D Geo-view can be combined with other technology integration, give full play to their strengths, learn from each other in an integrated manner for the construction of water conservancy and hydropower project services第二部分中文论文关于TITAN 3D Geo-view在水利水电信息工程中的应用摘要:TITAN 3D Geo-view是近年来迅速发展起来的一门地学数据与计算机相结合的新型地学信息科学技术,它把现实世界中对象的地质位置和相关属性有机地结合起来,满足用户对地学信息的管理,并借助其特有的地学数据分析功能和可视化表达,进行各种辅助决策。

三维建筑模型论文中英文资料对照外文翻译文献

三维建筑模型论文中英文资料对照外文翻译文献

三维建筑模型论文中英文资料对照外文翻译文献三维建筑模型中英文资料Constructing Rules and Scheduling Technology for 3DBuilding ModelsZhengwei SUI, Lun WU, Jingnong WENG, Xing LIN, Xiaolu JIAbstract3D models have become important form of geographic data beyond conventional 2D geospatial data. Buildings are important marks for human to identify their environments, because they are close with human life, particularly in the urban areas. Geographic information can be expressed in a more intuitive and effective manner with architectural models being modeled and visualized in a virtual 3D environment. Architectural model data features with huge data volume, high complexity,non-uniform rules and so on. Hence, the cost of constructing large-scale scenes is high. Meanwhile, computers are lack of processing capacity upon a large number of model data. Therefore, resolving the conflicts between limited processing capacity of computer and massive data of model is valuable. By investigating the characteristics of buildings and the regular changes of viewpoint in virtual 3D environment, this article introduces several constructing rules and scheduling techniques for 3D constructing of buildings, aiming at the reduction of data vol ume and complexity of model and thus improving computers’ efficiency at schedul ing large amount of architectural models. In order to evaluate the efficiency of proposed constructing rules and scheduling technology listed in the above text, the authors carry out a case study by 3D constructing the campus of PekingUniversity using the proposed method and the traditional method. The two results are then examined and compared from aspects of model data volume, model factuality, speed of model loading, average responding time during visualization, compatibility and reusability in 3D geo-visualization platforms: China Star, one China’s own platform for 3D global GIS manufactured by the authors of this paper. The result of comparison reveals that models built by the proposed methods are much better than those built using traditional methods. For the constructing of building objects in large-scale scenes, the proposed methods can not only reduce the complexity and amount of model data remarkably, but can also improving computers’ efficiency.Keywords:Constructing rules, Model scheduling, 3D buildingsI. INTRODUCTIONIn recent years, with the development of 3D GIS (Geographical Information System) software like Google Earth, Skyline, NASA World Wind, large-scale 3D building models with regional characteristics have become important form of geographic data beyond conventional 2D geospatial data, like multi-resolution remote sensing images and vector data [1].Compared to traditional 2D representation, geographic information can be expressed in a more intuitive and effective manner with architectural models being modeled and visualized in a virtual 3D environment. 3D representation and visualization provides better visual effect and vivid urban geographic information, and thus plays an important role in people's perceptions of their environment. Meanwhile, the 3D building data is also of great significance for the construction of digitalcities.But how to efficiently visualize thousands of 3D building models in a virtual 3D environment is not a trivial question. The most difficult part of the question is the conflicts between limited processing capacity of computer and massive volume of model data, particularly in the procedure of model rendering. T aking the 3D modelingof a city for the example using traditional 3D modeling method, suppose there are 100 000 buildings to model in the urban area and the average size of model data for each building is roughly 10 M. So the total data volume of building models in the city could reach a TB level. However, the capacity of ordinary computer memory is only in the GB scale. Based on this concern, the authors proposed the scheduling technology for large-scale 3D buildings models in aspects of model loading and rendering. Due to the lack of building constructing rules and standard, models of buildings vary in aspects of constructing methods, textures collection and model data volume, especially in aspects of model reusability and factuality. Such a large amount of data without uniform constructing rules becomes a huge challenge for data storage, processing and visualization in computers. It also brings the problem of incompatibility among different 3D GIS systems.After years of research in GIS (Geographic Information System), people have accumulated a number of ways to solve the above problems [3]. However in virtual 3D environment, because of the difference in data organization and manners of human computer interaction (HCI), we need to apply a new standardized method of modeling and scheduling for 3D models. At present, there is no such a uniform method as the constructingspecification or standard for the modeling of 3D buildings. Existing approaches are insufficient and inefficient in the scheduling of large-scale building models, resulting in poor performance or large memory occupancy. In response to such questions, the authors proposed a new method for the construction of 3D building models. Models built using the proposed methods could be much better than those built using traditional methods. For the 3D modeling of building objects in scenes of large scale, the proposed methods can not only remarkably reduce the complexity and amount of model data, but can also improving the reusability and factuality of models. Concerning the scheduling of large-scale building models, the Model Loading Judgment Algorithm (MLJA) proposed in this paper could solve the optimal judgment problem of model loading in 3D vision cone, particularly in circumstance with uncertain user interactions.This paper first examines and analyzes existing problems in constructing andscheduling steps of 3D building models. Then the authors propose a set of constructing rules for 3D building models together with methods of model optimization. Besides, special scheduling technology and optimization method for model rendering is also applied in this paper for large-scale 3D building models. In order to evaluate the efficiency of proposed rules and methods, a case study is undertaken by constructing a 3D model for the main campus of Peking University and Shenzhen using both the proposed method and the traditional method respectively. The two resulting 3D models of Peking University campus and Shenzhen are then examined and compared with one other in aspects of model data volume, model factuality,speed of model loading, average responding time during visualization, compatibility and reusability in various 3D geo-visualization platforms like China Star (one China’s own platform for 3D global GIS manufactured by the authors), Skyline, etc. Result of comparison tells that provided similar factuality of models, using the proposed method of us, the data volume of models was reduced by 86%; the speed of model loading was increased by 70%; the average responding time of model during visualization and interaction speed was reduced by 83%. Meanwhile, the compatibility and reusability of 3D model data are also improved if they are constructed using our approach.II. MODELING RULES OF 3D BUILDINGS 3D scene is the best form of visualization for digital city systems. While constructing 3D models for buildings objects, proper methods and rules should be used, which are made with full concerns of the characteristics of 3D building models [2]. The resulting models should be robust, reusable and suitable enough for transmission over computer network, and should at the same time be automatically adapted to system capability.Generally speaking, methods of constructing 3D building models can be classified into three types: wireframe modeling, surface modeling and solid modeling. In normal circumstances, to model buildings in 3D format, the framework of building should be constructed first according to the contour features, number of floors, floorheight, aerial photograph and liveaction photos of buildings. Then, gather the characteristics of scene that the buildings to model are representing. Important characteristics include buildings aerial photograph or liveaction shooting photos. Finally, map the gathered texture to model framework, optimize themodel and create database of the 3D building models.Although there have already been many approaches for the construction of 3D building models, a unified modeling method and rules are still needed to improve the efficiency, quality, facilitate checking, reusability and archiving of constructed models. By investigating the characteristics of buildings, we found that buildings have regular geometric solid for modeling, similar texture on the surfaces of different directions, high similarity in small-scale models of buildings, etc. According to these, this article gives a discussion on the modeling rules from three aspects, including constructing rules of the 3D building models, texture mapping rules of 3D building models and optimization method for constructed models based on mentioned constructing rules.A. Constructing rules of the 3D building modelsThe 3D building modeling refers to the procedure of representing true buildings from the real world into computer in the form of 3D objects [4]. Human beings, as the creator and at the same time potential users of models, play a key role in this procedure. People are different from each other in the understanding of the building objects, methods of modeling and the software tools they use for modeling. Such differences among people who carry out modeling work at the same time lead to the 3D models of diverse quality and low efficiency. So the 3D building constructing rules proposed in this article become necessary and helpful to solve the above problems.1) Combine similar floors as a whole and keep the roof independent2) Share similar models and process the details especially3) Constructing in the unit of meters4) Define central point of the model5) Unified model codes6) Reduce number of surfaces in a single model7) Reduce combination of the models8) Rational split of modelsB. Texture mapping rules of 3D buildingsBased on the framework of 3D models, we need to attach these models with proper textures to create a better visualization effect for 3D buildings. The quality of texture mapping has a direct impact on the visual effect of the scene whiling being rendered [5]. Since the graphics card of computer will load all the textures together when rendering a model, texture mapping rules and the quality of the texture mapping can directly influence the efficiency of rendering as well.C. Optimization of models based on constructing rulesBased on constructing rules and the characteristics of 3D building models, the authors develop a software tool to optimize the 3D building models automatically. The optimizations impl emented in the software tool contain the deletion of models’ internal textures, merging adjacent vertices/lines/surfaces, removing un-mapped framework and so on. Besides, the software can enhance the shape of the whole model, texture position and model facticity in the procedure of model optimization.III. SCHEDULING TECHNOLOGY OF LARGE-SCALE 3DBUILDING MODELSFor the 3D visualization of large-scale architectural models, a series of measures could be applied to ensure the efficient rendering of models. Important measures includes the scene organization, vision cone cutting, elimination of textures on thebackside of models, Shader optimization, LOD Algorithm, math library optimization, memory allocation optimization, etc..How to display thousands of 3D cit y buildings’ models in a virtual 3D environment is not trivial. The main problem is the scheduling of models [7]. It determines when and which models to be loaded. This problem can be divided into two smaller problems: Find visible spatial region of models in 3D environment, and optimization method of model rendering efficiency.A. Find visible spatial region of models in 3D environmentAccording to operating mechanism of computers during 3D visualization and the characteristics of large-scale 3D scene, we need to determine the position of current viewpoint first before loading signal models or urban-unit models. Then in response to the regular changes of viewpoint in virtual 3D environment, the system will preload the 3D model data into memory automatically. In this way, frequent IO operations can be reduced and thus overall efficiency of system gets improved. A new algorithm named MLJA (Model Loading Judgment Algorithm) is proposed in this paper in order to find out visible region of models in the 3D environment. The algorithm integrates the graticules and elevation information to determine the current viewpoint of users in the 3D space. And with the movement of viewpoint, the algorithm schedules the loading of model correspondingly and efficiently.B. Optimization method of model rendering efficiencyThe scheduling method of large-scale 3D building models proposed above is an effective way to solve the problem caused the contradiction between large model data volume and limited capacity of computers. According to the algorithm, we can avoidloading the whole large-scale 3D building models at one time for the sake of limited computer memory, and then improve system efficiency in the procedure of model loading and abandoning. Due to the limited capacity of GPU and local video memory, we need a further research on how to display the loaded model data in more efficient manner. In the remaining part of this paper, the authors will continue to introduce several methods on the optimization of model rendering in the vision cone.1) Elimination of textures on the backside of modelsThe backside of the 3D model is invisible to the users. If we omit the texture mapping for the 3D model on the backside, the processing load of graphic card will be reduced as much as at least 50%. Besides, according to an investigation on procedure of actual model rendering, the authors found that on the backside of the 3D model, the invisible texture is rendered in a counter-clockwise manner against the direction of eyesight, while the visible texture mapping is rendered in clockwise manner. So we can omit the rendering of models which is intended to be rendered incounterclockwise manner. Therefore, the textures won’t exist on the back of 3D models. The graphic card could then work more rapidly and efficiently.2) Eliminate the shielded modelBy calculating the geometric relationship between 3D models in the scene, the shielded models can be omitted while displaying the scene with appropriate shielding patches. Through this way, we can effectively reduce the usage of graphics card memory, and thus achieve higher rendering efficiency and faster 3D virtual system.In the virtual 3D geographic information system, we oftenobserve 3D models from a high altitude. It is especially true for large-scale outdoor 3D models. The usual arrangement of 3D building models are always sparse, however the real block is very small. Therefore, establishing an index for visual control, which is similar to the BSP tree, doesn’t amount to much. Through carefully stud ying DirectX, we found that we can take advantage of the latest Z-buffering technology of DirectX to implement the shielding control of models.3) Optimization method of the Shader instructionsIn shader 3.0 technology, SM (Shader Model) is a model which can optimize the rendering engine. A 3D scene usually contains several shaders. Among these shaders, some deal with the surfaces and skeletons of buildings, and others deal with the texture of 3D building models.Geometry can be handled quickly by shader batch process. The shader can combine similar culmination in 3D building models, deal with the correlation operation of a single vertex, determine the physical shape of the model, link the point, line, triangle and other polygons for a rapid processing while create new polygons, etc. We can assign the computing task to shader and local video memory directly in a very short time without bothering the CPU. In this case, visual effects of smoke, explosions and other special effects and complex graphics are no longer necessary to be processed by the CPU of computer. Such features of shader can speed up both the CPU and graphic card in processing huge amount of 3D models.4) LOD algorithm of large-scale 3D sceneLOD (Level of Detail) is a common and effective solution to resolve theconflicts between real time visualization and the authenticityof models [8]. By investigating the main features and typical algorithms of LOD technology, the authors proposed a new structure for dynamic multi-level display. This structure not only can be applied to the mesh simplification of models with many different but fixed topologies, but also can be applied to the mesh simplification of models with variable topology. Therefore, the LOD technology can be applied to any grid model. Based on the above concerns, the authors also design a mesh simplification algorithm for variable topology through vertices merge. Via the dual operations of vertex merging and splitting, we can achieve smooth transition across different LOD levels of models, and automatically change the model topology.These above techniques plays important role in 3D scene. It can not only enable a rapid visualization of large-scale scene, but also can provide a high-resolution display of scene at a local scale with plenty of architectural details.IV. CONCLUDING REMARKSConstructing rules and scheduling technology plays an important role in the application of large-scale 3D buildings. Since people’s demand for 3D expression brings a challenge of high-efficiency and high-quality to virtual 3D environment, the methods proposed in this article give a good try in these aspects. According to the authors’ research and case studies in this paper, integration of constructing rules and scheduling technology is promising in providing powerful tools to solve the conflicts between limited processing capacity of computer and massive data of models. The result of our case study on Peking University indicates that the proposed new method on constructing rules and scheduling technology for large-scale 3D scene is highly feasible and efficient in practice. The proposedmethods can not only standardize the procedure of model construction, but also can significantly shorten the time taken in scheduling large-scale 3D buildings. It introduces a new effective way to develop applications for large-scale three-dimensional scene.构建三维建筑模型的规则和调度技术隋正伟,邬伦, 翁敬农,林星,季晓璐摘要三维模型已成为超越了传统的二维地理空间数据的一种重要的地理数据形式。

全球定位系统 毕业论文外文文献翻译

全球定位系统  毕业论文外文文献翻译

外文资料及译文1.外文资料全球定位系统第一节The principle of GPS一、GPSGPS(Navigation Satellite Timing and Ranging /Global Position System ),GPS clock and distance navigation system/global positioning systems, referred to as globalpositioning system (GPS), along withthe rapid development of modernscience and technology, and set up anew generation of satellite navigationand positioning system precision.Global positioning system (GPS) is in1973 by U.S. defense forces began toorganize, and common basiccompletion in 1993. This systemconsists of space constellation, groundcontrol and user receiver is composedof three parts.(一)Global positioning system 图1-1 GPS Satellite distribution1.1 Space constellationGPS space by 24 working partconstellation spare satellite and three satellite. Work in 6 orbit satellite distribution within the surface. Each track surface distribution has 3 ~ 4 satellite, satellite orbits earth's equator Angle relative to the average height of 55, orbit for 20200 kilometers. Satellite operating cycle for 11 hours 45 minutes. Therefore, in the same station daily satellite layout is roughly same, just four minutes every day in advance. Each satellite about 5 hours every day in the horizon, located above the horizon of the satellite number with more time and place, at least 4 November, most. This layout can guarantee on earth at any time, any place can also observed above four satellites.Satellite signal transmission and reception and the influence, so the GPS is a global, all-weather real-time navigation and positioning for system. After the completion of the global positioning system, its work in the space distribution of satellite 1-1 as shown. GPS satellite zips are installed on the light, microprocessors, message signal emission equipment, storage, and provide power supply by solar cells have little fuel, satellite is used to regulate the satellite orbit and posture, and in the monitor of instruction, start spare satellite.1.2 The ground monitoring systemGPS ground monitoring system in the world by five sites. One master station, 3 injection station. Five monitor are equipped with automatic acquisition, data center, double-frequency GPS receiver, precision clock, environmental data sensors and computing devices, and to master station provides all kinds of observation data. Master station (in Colorado) for system management and data processing center, its main content is the use of this site and other monitor the observation data of the satellite's star calendar calculation and satellite clock and atmospheric delay correction parameter, provide global positioning system, and the time base station, these parameters to adjust sidetracked into orbit, the satellite to enable spare satellite instead of failure satellite, etc. Injection station master station will be calculated and satellite star calendar, clock, satellite navigation message and other control commands into corresponding satellite etc, and storage system into the correctness of monitoring information. Besides, the master station, GPS ground monitoring system, various unattended highly automated and standardized work.1.3 User equipment partsUser equipment including GPS receiver host, antenna, power and data processing software component. The host for the microcomputer, quartz oscillators core, and the corresponding input and output interface, and equipment. In the special software under control, the host for homework, satellite data acquisition, processing and storage of the equipment, the system state inspection, alarm and maintenance, the receiving system of automatic management. Antenna, often used for collecting all from each azimuth, arbitrary nonnegative Angle of satellite signal. Due to the satellite antenna pedestal weak signal in a pre-amplifier, amplification, reoccupy coaxial cable input host. Power supply for host and aerial part, can use through rectifier voltage, the mains, also can use the accumulator.(二)Global positioning system (GPS) signalsGPS satellite launch a coherent wave, the wavelength 1L and frequency respectively 2L :f MHZ,cm f MHZ,cm L L L L 11221575421912276024====..λλ1L and 2L as a carrier with two modulation signal, a kind of navigation signal, another kind is message signal. Navigation signal S Mb 023.1 is divided again, frequency m A C 293=λ for code rate for the coarse yards (C/A code) and the rate SMb 023.1for the essence, the frequency of m p 3.291=λcode (P). Thick yards (C/A code) repeat each signal encoding, can quickly capture signal, according to the design for rough positioning, Pure code (P) yards signal encoding every seven, and repeat each satellite, structure is very complex, not capture, but can be used for accurate positioning. Message signal while the rate s bit 50to the carrier 1L and 2L modulation in, including satellite, the correct star calendar and satellite working state. Through the message signal receiver can choose the best one group of graphics, positioning signals observation data processing..第二节 GPS Positioning method一、 GPS Positioning method classification(一)、 The static and dynamic positioningBy means of static GPS positioning and can be divided into dynamic positioning.1、Static positioningIf you stay in the surrounding relatively fixed protection can not perceive motion, or movement is so slowly that require months or years, namely that can be reflected in the earth for fixed-point relative coordinates is fixed, the determination method for the coordinates of static positioning is called. In the mathematics model of the static localization, the position is constant. Due to the rapid solutions of GPS "unknown" technology of the cycle time of operation, static already shortened to a few minutes, so, in addition to the original geodetic measurement and monitoring of the force applied, rapid static orientation has been widely applied to the common measurement and engineering measurement.2、 Dynamic positioningCars, ships, aircraft and aircraft in motion, people often need to know their real-time position. In these sports carrier mounted on GPS receiver, real-time GPS signals measured antenna location, called the GPS kinematic positioning. If the only measure the real-time position, the carrier of sports also determine the speed, time and location, etc, thus guidingstatus parameters to reserve the object orientation, called the navigation movement. GPS navigation is virtually dynamic positioning.(二)、Absolute positioning and relative locationAccording to determine the GPS receiver in earth coordinate system in different position, can be divided into a single absolute positioning and the relative positioning, such as machine, 2-1.1、Absolute positioning图2-1 Absolute and relative positioningTo determine the absolute positioning is independent coordinate system in the position of the dot. Because single absolute positioning error by satellite reception when the effect, low precision. Mainly used for low precision dynamic positioning, such as ships, aircraft navigation of mineral resources, geological investigation, Marine fishing and determine the relative position of the initial value.2、Relative positioningRelative location is determined simultaneous tracking same GPS signals of several sets of the relative position between the receiver is a kind of method. Since the synchronous observation, the synchronization of many error signal obtained station is identical or similar (such as satellite clock error, error, the signal of the star alex atmospheric transmission error, etc.), can avoid or weaken these errors, obtain high relative position. Relative positioning, signal processing and data than absolute orientation is complex, relative positioning is the synchronization between baseline vector (station), and 3d coordinate need at least a spot for known to the rest of the each point coordinates. The static and dynamic positioning can position by relative positioning, such as earthdeformation measurement, ground control aerial photogrammetry, etc.In the dynamic positioning, often USES "difference", a GPS receiver will be placed on the base coordinate, known as the receiver in sports, all receivers carrier, according to the known synchronous control results, the positioning correct number starting position, in order to improve the real-time to positioning accuracy. This is based on a single point positioning and relative location of positioning mode.(三)、 Pseudorange method and the carrier phase methodGPS satellite positioning, according to the different signal processing, can divide again pseudorange method and the carrier phase method.1、Pseudorange methodThe positioning principle is simple. When positioning, receiver and the oscillation ofA satellite signal the same group (P yards range yards or C/A code), through delay and receiver receive signals, when two groups compared each other completely coincide (related to signal measured signals, namely for the delay in quantity, satellite signal transmission time with A series of modified times the speed of light, satellites and draw the oblique distance antenna phase center. If the four (or above), i.e. the distance can satellite stations calculate intersection method of location and clock error four unknown. Due to the wavelength m p 3.29λrange yards m A C 293=λ. To one percent of the estimated $yards range resolution, length of to 0.3 meters (P) and 3 meters (C/A code) the ranging accuracy. Therefore, the pseudorange accuracy is relatively low.2、The carrier phase methodThe carrier is a measure of carrier signal, measurements, determine the satellite signal and reference signal receiver, calculate the phase difference observation. Then the same principle and pseudorange method, the position of the station clock error, etc. The wavelength modulated symbol cm L 191=λ,cm L 242=λ, than much shorter wavelength of one percent, to $yards range resolution, estimating length reached 1.9 cm (P) and 2.4 L centimeters (C/A code) the ranging accuracy. In the measurement and precision air triangle measuring, high precision, often USES relative positioning method, the carrier phase to eliminate system error.The carrier phase method for measuring the complete phase observation data ϕfrom several parts:ϕϕϕϕφφ=-=+=++S R R N N I n tF 00~()() (2-1)Type: s ϕfor the first phase, the observational S,R ϕ for the position of the receiverobservation R phase, ~ϕfor the actual phase observations,0N for the whole cycle count,also called the whole cycle unknown, ()φInt for the actual observation time t the integer part, first observed 0t for the duration of zero, every moment, observation 0t by continuous accumulated through counter counts, called after the cycle count, ()φR F for the actual observation in the integer part, with high precision measurement.二、GPS positioning operation modeMainly includes GPS real-time GPS navigation positioning, afterwards (with) the dynamic positioning and used to measure the static or dynamic) relative orientation accurate.1 . GPS kinematic positioningGPS real-time navigation) is required (and observation data in the positioning of the moment, its main purpose is to navigation. AS mentioned above, the absolute positioning (single point positioning) by the us government's "SA" (choose usability) and "AS" (the electronic technology, the influence of deception by civil service standard of GPS level position precision of 100 meters. So many users using differential GPS system (CDGPS and WADGPS) to improve the precision. CDGPS pseudorange method and the users of the station standing range within 100 miles, precision for 5 ~ 10 meters. The carrier phase method CDGPS (also called RTK) standing and users in the station within range, 30 kilometers, the accuracy of cm. And WADGPS big scope is to create multiple known coordinates, standing and vice standing vice standing by data from receiving chain of error sources, after three corrections to users, communication WADGPS pseudorange method for positioning accuracy of about 1 ~ 3 meters, CDGPS superior. And stood and vice standing distance can reach over 1000 kilometers.2. Dynamic positioning postprocessingThis is a kind of carrier phase of dynamic positioning technologies. Usually a receiver is placed in the ground, and the other on the known a (or more) receiver in high-speed motion object, jr, afterwards synchronous according to the carrier phase difference between objects in motion relative to determine the location of known. Its characteristic is standing with users need to stand between the transmission of real-time data, the distance between the two is less restricted. But in high-speed motion of the object is how to determine the unknown 0N and the whole week jump problem is the technical difficulties. In recent years, the GPS technology of dynamic initialization OTF (again) greatly improve something comes after the practicability of the dynamic positioning. It can reach thecm-level positioning accuracy. Mainly applicable and low orbit satellite cm-level precision GPS satellite, aerial photogrammetry, airborne gravimetry, magnetic moment of determine the cm-level 3d coordinate of the airborne GPS technology.ed to measure the static(and dynamic) relative positioningStatic relative positioning using two sets of (or above), the GPS receiver respectively in each of the baseline endpoints, synchronous observation above four satellites 0.5 ~ 1 hour, baseline length in 20 kilometers. The baseline netted closed graph, constitute the whole event after adjustment, the precision can reach D5. Applicable to higher+1mm⋅ppmaccuracy of measurement and control of national land earth deformation monitoring, etc.Rapid static relative position in the central area with a base station, GPS receiver continuous tracking all visible satellites, in order to each other a receiver to the above five starting synchronous satellites, each 1 ~ 2 minutes to benchmark station starting at baseline length within 15 kilometers, with the benchmark stood for radiation center. Afterwards the processing precision can reach D+15, but poor reliability. Applicable to smallmm⋅ppmrange of control measure, engineering surveying and cadastration, etc.Accurate dynamic relative position in the zone, a GPS receiver with benchmark for tracking all visible satellites, another a receiver in starting sites for five first above synchronous satellites for 1-2 minutes and then keep track of all of the satellite, under the situation of continuous flow to the observation of the number of seconds, the observatory was starting to stand at the baseline length benchmark within 15 kilometers. Its characteristic is starting to keep each phase lock. In case of loss locks, must extend unlocked site observation time after 1 ~ 2 minutes to determine the unknownN and the0 whole cycle count cycle()φInt. Accurate dynamic relative positioning error in baseline can reach 1 ~ 2 cm long, suitable for engineering measurement circuit measurements and topography measurement, etc.第三节GPS application一、The GPS in engineering applicationIn surveying and mapping, GPS satellite positioning technology field has been used to establish the national geodetic measurement accuracy control network, determination ofthe earth; the dynamic parameters of the global To establish the land and sea, high-precision measurement datum of land and sea islands; measurement of surveying and mapping al Used for monitoring earth plate motion and the crustal deformation, Used for engineering measure, establish a city and the major means of engineering control network, Used for testing the aerospace photography instant camera position, only a very small ground control or no ground control chart, causing rapid aerial geographic information system, the global environment of remote sensing technology revolution.In the survey, using GPS technology to develop international league, establish the control of global network, provide high-precision geocentric coordinate, determination and refining geoid. So, for every Chinese department of surveying and mapping work, establish various measurement control network, provides the high plane and elevation 3d benchmarks.In the engineering survey, the application of static GPS positioning technology, relatively precise control network layont for mining cities, and the subsidence monitoring, oil dam deformation monitoring, high-rise buildings deformation monitoring, tunnel breakthrough measurement precision engineering etc. Encryption, using GPS surveying asbuilts of real-time dynamic positioning technologies (hereinafter referred to as RTK surveying and mapping) of scale topographic map and used in the construction of engineering construction lofting.In aerial photogrammetry, using GPS surveying workers also aerial technology field control measure, aerial electricity GPS navigation, airborne flying into the figure of the electricity, etc.On earth, GPS technology used in dynamic monitoring global and regional plate, plate motion of movement monitoring.The global positioning system (GPS) technology has been used in Marine measurement, underground terrain mapping and, moreover, the military defense, intelligent transportation, post and telecommunications, surveying, coal, oil, building and management of agricultural, meteorology, land, environmental monitoring, finance, public security departments and industry, in aerospace, test, physical detection, etc, also pose measurement are conducted the research and application of GPS technology.二、The GPS in scientific research applicationsThe global positioning system (GPS) used in mobile positioning and economical solutions when we directly transferred to customer service center, the mobile phone to check with customer directly short message (GPS positioning, minutes and seconds data format), if the use of electronic map software, general inter-city direct support of its inputGPS data, minutes and seconds, if use the function orientation LingTu days in Beijing, can use the new 5 special software of GPS positioning master manual input coordinates function orientation, this scheme is suitable for low frequency ZhaChe. Enhanced when customers can purchase special satellite positioning management host, it can not only be receiving many car positioning short message, and stored in computer automatic classification, each vehicle is to build a database of clicking a mouse button, finding a car, as long as all the locating records on target data will automatically switch to electronic map shows the location, click on the progress vehicle or the back button on electronic map can demonstrate in the form of automobile, each vehicle can take different names, facilitate management more cars, very convenient, more frequent query for car. Along with the rapid development of urbanization, urban scale expands unceasingly, to provide convenient and fast traffic intelligent transportation information service system, will be the future trend of development, In addition, navigation and positioning system based on mobile phone service, will become the trend for the people to pursue. In the future, all can move, will depend on the GPS. GPS will like mobile phones, Internet, for our life greatly influence. Therefore, the GPS will form the huge industry value chain, significant social and economic benefits.三、In the emerging field of application of GPSRTK technology is RTK network a milestone in the development of technology. This technique by several stations composed a network, and has a terminal. Each station by telecommunications network (fiber or DDN) will observation data, the central station to station by reference data and the model through a solution within the pressure-difference method is correct and its through GSM/GPRS public Internet user, users send according to the real-time difference correct information can obtain higher precision. Compared with the traditional RTK technology, network RTK distance between the base can be long, sichuan VRS seismological bureau standing space than average system construction of 60 kilometers, is the longest baseline once more than 90 kilometers. So, same area covered only need less station can be achieved, cost can be greatly reduced. At the same time, the concept of network calculation model makes more reliable. Traditional RTK system if a base, the user can occur in the base area in the implementation of homework, covering technology in network RTK nonexistent this problem, because the center will automatically according to the user's position and the operation condition of choosing base stations operations. With modern communication technology, the computer storage technology and the rapid development of space technology, measuring method and mode has achieved great progress. GPS network in the information revolution is RTK arises inthe new space data acquisition method. It combines modern technology of communication and information technology, computer network distributed storage and processing technology of virtual reference, standing technology (VRS) among, and modern geodetic technology. GPS network is more advanced technology of RTK integration, this system for the country's infrastructure provide conveniences. Also for "digital city provides real-time reliable source.2.译文全球定位系统第一节 GPS的原理概述一、全球定位系统GPSGPS(Navigation Satellite Timing and Ranging /Global Position System ),授时与测距导航系统/全球定位系统,简称GPS全球定位系统,是随着现代科学技术的迅速发展而建立起来的新一代卫星导航和精密定位系统。

建筑设计毕业论文中英文资料外文翻译文献

建筑设计毕业论文中英文资料外文翻译文献

毕业论文中英文资料外文翻译文献Architecture StructureWe have and the architects must deal with the spatial aspect of activity, physical, and symbolic needs in such a way that overall performance integrity is assured. Hence, he or she well wants to think of evolving a building environment as a total system of interacting and space forming subsystems. Is represents a complex challenge, and to meet it the architect will need a hierarchic design process that provides at least three levels of feedback thinking: schematic, preliminary, and final.Such a hierarchy is necessary if he or she is to avoid being confused , at conceptual stages of design thinking ,by the myriad detail issues that can distract attention from more basic consideration s .In fact , we can say that an architect’s ability to distinguish the more basic form the more detailed issues is essential to his success as a designer .The object of the schematic feed back level is to generate and evaluate overall site-plan, activity-interaction, and building-configuration options .To do so the architect must be able to focus on the interaction of the basic attributes of the site context, the spatial organization, and the symbolism as determinants of physical form. This means that ,in schematic terms ,the architect may first conceive and model a building design as an organizational abstraction of essential performance-space in teractions.Then he or she may explore the overall space-form implications of the abstraction. As an actual building configuration option begins to emerge, it will be modified to include consideration for basic site conditions.At the schematic stage, it would also be helpful if the designer could visualize his or her options for achieving overall structural integrity and consider the constructive feasibility and economic of his or her scheme .But this will require that the architect and/or a consultant be able to conceptualize total-system structural options in terms of elemental detail .Such overall thinking can be easily fed back to improve the space-form scheme.At the preliminary level, the architect’s emphasis will shift to the elaboration of his or her more promising schematic design options .Here the architect’s structural needs will shift toapproximate design of specific subsystem options. At this stage the total structural scheme is developed to a middle level of specificity by focusing on identification and design of major subsystems to the extent that their key geometric, component, and interactive properties are established .Basic subsystem interaction and design conflicts can thus be identified and resolved in the context of total-system objectives. Consultants can play a significant part in this effort; these preliminary-level decisions may also result in feedback that calls for refinement or even major change in schematic concepts.When the designer and the client are satisfied with the feasibility of a design proposal at the preliminary level, it means that the basic problems of overall design are solved and details are not likely to produce major change .The focus shifts again ,and the design process moves into the final level .At this stage the emphasis will be on the detailed development of all subsystem specifics . Here the role of specialists from various fields, including structural engineering, is much larger, since all detail of the preliminary design must be worked out. Decisions made at this level may produce feedback into Level II that will result in changes. However, if Levels I and II are handled with insight, the relationship between the overall decisions, made at the schematic and preliminary levels, and the specifics of the final level should be such that gross redesign is not in question, Rather, the entire process should be one of moving in an evolutionary fashion from creation and refinement (or modification) of the more general properties of a total-system design concept, to the fleshing out of requisite elements and details.To summarize: At Level I, the architect must first establish, in conceptual terms, the overall space-form feasibility of basic schematic options. At this stage, collaboration with specialists can be helpful, but only if in the form of overall thinking. At Level II, the architect must be able to identify the major subsystem requirements implied by the scheme and substantial their interactive feasibility by approximating key component properties .That is, the properties of major subsystems need be worked out only in sufficient depth to very the inherent compatibility of their basic form-related and behavioral interaction . This will mean a somewhat more specific form of collaboration with specialists then that in level I .At level III ,the architect and the specific form of collaboration with specialists then that providing for all of the elemental design specifics required to produce biddable construction documents .Of course this success comes from the development of the Structural Material.1.Reinforced ConcretePlain concrete is formed from a hardened mixture of cement ,water ,fine aggregate, coarse aggregate (crushed stone or gravel),air, and often other admixtures. The plastic mix is placed and consolidated in the formwork, then cured to facilitate the acceleration of the chemical hydration reaction lf the cement/water mix, resulting in hardened concrete. The finished product has high compressive strength, and low resistance to tension, such that its tensile strength is approximately one tenth lf its compressive strength. Consequently, tensile and shear reinforcement in the tensile regions of sections has to be provided to compensate for the weak tension regions in the reinforced concrete element.It is this deviation in the composition of a reinforces concrete section from the homogeneity of standard wood or steel sections that requires a modified approach to the basic principles of structural design. The two components of the heterogeneous reinforced concrete section are to be so arranged and proportioned that optimal use is made of the materials involved. This is possible because concrete can easily be given any desired shape by placing and compacting the wet mixture of the constituent ingredients are properly proportioned, the finished product becomes strong, durable, and, in combination with the reinforcing bars, adaptable for use as main members of any structural system.The techniques necessary for placing concrete depend on the type of member to be cast: that is, whether it is a column, a bean, a wall, a slab, a foundation. a mass columns, or an extension of previously placed and hardened concrete. For beams, columns, and walls, the forms should be well oiled after cleaning them, and the reinforcement should be cleared of rust and other harmful materials. In foundations, the earth should be compacted and thoroughly moistened to about 6 in. in depth to avoid absorption of the moisture present in the wet concrete. Concrete should always be placed in horizontal layers which are compacted by means of high frequency power-driven vibrators of either the immersion or external type, as the case requires, unless it is placed by pumping. It must be kept in mind, however, that over vibration can be harmful since it could cause segregation of the aggregate and bleeding of the concrete.Hydration of the cement takes place in the presence of moisture at temperatures above 50°F. It is necessary to maintain such a condition in order that the chemical hydration reaction can take place. If drying is too rapid, surface cracking takes place. This would result in reduction of concrete strength due to cracking as well as the failure to attain full chemical hydration.It is clear that a large number of parameters have to be dealt with in proportioning a reinforced concrete element, such as geometrical width, depth, area of reinforcement, steel strain, concrete strain, steel stress, and so on. Consequently, trial and adjustment is necessary in the choice ofconcrete sections, with assumptions based on conditions at site, availability of the constituent materials, particular demands of the owners, architectural and headroom requirements, the applicable codes, and environmental reinforced concrete is often a site-constructed composite, in contrast to the standard mill-fabricated beam and column sections in steel structures.A trial section has to be chosen for each critical location in a structural system. The trial section has to be analyzed to determine if its nominal resisting strength is adequate to carry the applied factored load. Since more than one trial is often necessary to arrive at the required section, the first design input step generates into a series of trial-and-adjustment analyses.The trial-and –adjustment procedures for the choice of a concrete section lead to the convergence of analysis and design. Hence every design is an analysis once a trial section is chosen. The availability of handbooks, charts, and personal computers and programs supports this approach as a more efficient, compact, and speedy instructional method compared with the traditional approach of treating the analysis of reinforced concrete separately from pure design.2. EarthworkBecause earthmoving methods and costs change more quickly than those in any other branch of civil engineering, this is a field where there are real opportunities for the enthusiast. In 1935 most of the methods now in use for carrying and excavating earth with rubber-tyred equipment did not exist. Most earth was moved by narrow rail track, now relatively rare, and the main methods of excavation, with face shovel, backacter, or dragline or grab, though they are still widely used are only a few of the many current methods. To keep his knowledge of earthmoving equipment up to date an engineer must therefore spend tine studying modern machines. Generally the only reliable up-to-date information on excavators, loaders and transport is obtainable from the makers.Earthworks or earthmoving means cutting into ground where its surface is too high ( cuts ), and dumping the earth in other places where the surface is too low ( fills). Toreduce earthwork costs, the volume of the fills should be equal to the volume of the cuts and wherever possible the cuts should be placednear to fills of equal volume so as to reduce transport and double handlingof the fill. This work of earthwork design falls on the engineer who lays out the road since it is the layout of the earthwork more than anything else which decides its cheapness. From the available maps ahd levels, the engineering must try to reach as many decisions as possible in the drawing office by drawing cross sections of the earthwork. On the site when further information becomes available he can make changes in jis sections and layout,but the drawing lffice work will not have been lost. It will have helped him to reach the best solution in the shortest time.The cheapest way of moving earth is to take it directly out of the cut and drop it as fill with the same machine. This is not always possible, but when it canbe done it is ideal, being both quick and cheap. Draglines, bulldozers and face shovels an do this. The largest radius is obtained with thedragline,and the largest tonnage of earth is moved by the bulldozer, though only over short distances.The disadvantages of the dragline are that it must dig below itself, it cannot dig with force into compacted material, it cannot dig on steep slopws, and its dumping and digging are not accurate.Face shovels are between bulldozers and draglines, having a larger radius of action than bulldozers but less than draglines. They are anle to dig into a vertical cliff face in a way which would be dangerous tor a bulldozer operator and impossible for a dragline. Each piece of equipment should be level of their tracks and for deep digs in compact material a backacter is most useful, but its dumping radius is considerably less than that of the same escavator fitted with a face shovel.Rubber-tyred bowl scrapers are indispensable for fairly level digging where the distance of transport is too much tor a dragline or face shovel. They can dig the material deeply ( but only below themselves ) to a fairly flat surface, carry it hundreds of meters if need be, then drop it and level it roughly during the dumping. For hard digging it is often found economical to keep a pusher tractor ( wheeled or tracked ) on the digging site, to push each scraper as it returns to dig. As soon as the scraper is full,the pusher tractor returns to the beginning of the dig to heop to help the nest scraper.Bowl scrapers are often extremely powerful machines;many makers build scrapers of 8 cubic meters struck capacity, which carry 10 m ³ heaped. The largest self-propelled scrapers are of 19 m ³struck capacity ( 25 m ³ heaped )and they are driven by a tractor engine of 430 horse-powers.Dumpers are probably the commonest rubber-tyred transport since they can also conveniently be used for carrying concrete or other building materials. Dumpers have the earth container over the front axle on large rubber-tyred wheels, and the container tips forwards on most types, though in articulated dumpers the direction of tip can be widely varied. The smallest dumpers have a capacity of about 0.5 m ³, and the largest standard types are of about 4.5 m ³. Special types include the self-loading dumper of up to 4 m ³ and the articulated type of about 0.5 m ³. The distinction between dumpers and dump trucks must be remembered .dumpers tip forwards and the driver sits behind the load. Dump trucks are heavy, strengthened tipping lorries, the driver travels in front lf the load and the load is dumped behind him, so they are sometimes called rear-dump trucks.3.Safety of StructuresThe principal scope of specifications is to provide general principles and computational methods in order to verify safety of structures. The “ safety factor ”, which according to modern trends is independent of the nature and combination of the materials used, can usually be defined as the ratio between the conditions. This ratio is also proportional to the inverse of the probability ( risk ) of failure of the structure.Failure has to be considered not only as overall collapse of the structure but also asunserviceability or, according to a more precise. Common definition. As the reaching of a “ limit state ” which causes the construction not to accomplish the task it was designed for. Ther e are two categories of limit state :(1)Ultimate limit sate, which corresponds to the highest value of the load-bearing capacity. Examples include local buckling or global instability of the structure; failure of some sections and subsequent transformation of the structure into a mechanism; failure by fatigue; elastic or plastic deformation or creep that cause a substantial change of the geometry of the structure; and sensitivity of the structure to alternating loads, to fire and to explosions.(2)Service limit states, which are functions of the use and durability of the structure. Examples include excessive deformations and displacements without instability; early or excessive cracks; large vibrations; and corrosion.Computational methods used to verify structures with respect to the different safety conditions can be separated into:(1)Deterministic methods, in which the main parameters are considered as nonrandom parameters.(2)Probabilistic methods, in which the main parameters are considered as random parameters.Alternatively, with respect to the different use of factors of safety, computational methods can be separated into:(1)Allowable stress method, in which the stresses computed under maximum loads are compared with the strength of the material reduced by given safety factors.(2)Limit states method, in which the structure may be proportioned on the basis of its maximum strength. This strength, as determined by rational analysis, shall not be less than that required to support a factored load equal to the sum of the factored live load and dead load ( ultimate state ).The stresses corresponding to working ( service ) conditions with unfactored live and dead loads are compared with prescribed values ( service limit state ) . From the four possible combinations of the first two and second two methods, we can obtain some useful computational methods. Generally, two combinations prevail:(1)deterministic methods, which make use of allowable stresses.(2)Probabilistic methods, which make use of limit states.The main advantage of probabilistic approaches is that, at least in theory, it is possible to scientifically take into account all random factors of safety, which are then combined to define the safety factor. probabilistic approaches depend upon :(1) Random distribution of strength of materials with respect to the conditions of fabrication and erection ( scatter of the values of mechanical properties through out the structure );(2) Uncertainty of the geometry of the cross-section sand of the structure ( faults andimperfections due to fabrication and erection of the structure );(3) Uncertainty of the predicted live loads and dead loads acting on the structure;(4)Uncertainty related to the approximation of the computational method used ( deviation of the actual stresses from computed stresses ).Furthermore, probabilistic theories mean that the allowable risk can be based on several factors, such as :(1) Importance of the construction and gravity of the damage by its failure;(2)Number of human lives which can be threatened by this failure;(3)Possibility and/or likelihood of repairing the structure;(4) Predicted life of the structure.All these factors are related to economic and social considerations such as:(1) Initial cost of the construction;(2) Amortization funds for the duration of the construction;(3) Cost of physical and material damage due to the failure of the construction;(4) Adverse impact on society;(5) Moral and psychological views.The definition of all these parameters, for a given safety factor, allows construction at the optimum cost. However, the difficulty of carrying out a complete probabilistic analysis has to be taken into account. For such an analysis the laws of the distribution of the live load and its induced stresses, of the scatter of mechanical properties of materials, and of the geometry of the cross-sections and the structure have to be known. Furthermore, it is difficult to interpret the interaction between the law of distribution of strength and that of stresses because both depend upon the nature of the material, on the cross-sections and upon the load acting on the structure. These practical difficulties can be overcome in two ways. The first is to apply different safety factors to the material and to the loads, without necessarily adopting the probabilistic criterion. The second is an approximate probabilistic method which introduces some simplifying assumptions ( semi-probabilistic methods ) .文献翻译建筑师必须从一种全局的角度出发去处理建筑设计中应该考虑到的实用活动,物质及象征性的需求。

三维电子地图中OSM Buildings的运用分析

三维电子地图中OSM Buildings的运用分析

三维电子地图中OSM Buildings的运用分析摘要:三维电子地图优点显著,可以直观模拟表达地理实景,以全新的人性化表达方式,为人们的日常生活、网上办事和网络娱乐提供便捷的解决方案。

本文将OSMBuildings与传统二维电子地图相结合,以不同的方式达到了与GoogleMapsMapGL同样的效果,并且由于开源的特点,利用OSMBuildings构建起来的三维电子地图更有定制性,可以支持三维建筑物属性的定制修改,更灵活、更方便,体现了OSMBuildings在三维电子地图中的运用价值。

关键词:OSMBuildings;三维地图;建筑物模型1三维电子地图与OSM Buildings随着IT技术的不断发展,电子地图逐渐在实践过程中得到了广泛的应用和发展。

电子地图和能够提供更为详尽信息的地理信息系统(GIS,Geography Information System)联合使用可以为实际运用提供更大的便利,因此二者的应用得到了前所未有的发展。

从目前的研究和发展现状上来看,主要的应用领域集中在空间数据的二维可视化。

随着在空间数据二维可视化应用领域的不断成熟,对于三维空间处理问题的需求不断增加,对于三维电子地图技术的需求与日俱增。

从应用的角度来分析,研究三维电子地图模型具有重要的实践意义。

三维电子地图模型可以有效的增强地图的整体表现力,同时三维电子地图模型还可以在很大程度上提高广大地图用户的使用和认识地图的水平。

从这个角度来看,运用三维可视化来发展地图技术已经成为了一种趋势和必然。

OSM是开源wiki地图(OpenStreetMap)的简称,其有一套关于简单3D建筑物(Simple3DBuildings)的定义以及构建方式。

OSMBuildings的建筑物模型基于简单3D建筑物的定义并在此基础之上不断扩展完善3D模型的其他属性。

OSMBuildings目前支持GeoJSON格式的三维建筑物数据,所支持的建筑物属性包括高度、建筑物外墙颜色和建筑物房顶颜色,支持设置光照阴影,但目前细节仍不完备,利用OSMBuildings构建的三维建筑物只能看到三维建筑物的线条和轮廓,不支持模型纹理属性。

3D文献翻译(参考模板)

3D文献翻译(参考模板)

3D褶皱演化和斜向收敛形成的逆冲带)本文介绍了用一系列设计的比例模型来模拟由于正交和斜向收敛形成发育的逆冲带的结果。

构造出来的模型用来展现被一个隆起的造山岩心所分离的双向聚散造山楔,它包括前楔和后楔。

模型根据一个3m×1.3m的变形钻机(钻井装置)构造的。

我们用数字摄影记录模型的渐进演化的,而且用来分析的图片是动画的。

实验表明收敛的角度从正交(90°)低至15°。

正交模型常被制作为长形,线状的严格楔形的前楔褶皱,而且逆冲带与狭形隆起的岩心和陡峭的后楔逆冲系统一起,平行于收敛边缘。

前楔的斜角一般在11-12°,而后楔则保持一个更陡峭的角度38-42°。

具有收敛倾向的模型以60和45°的角度,倾斜于由双向聚散的逆冲楔形的边缘,其逆冲断层的走向平行于该边缘。

这里只有少量的连接的,贯通的走滑断层的迹象,但是像剪切系统的雁行式的河间地发育在45°倾斜的模型中。

其辅助的斜滑运动可以在一些逆冲断层中观察到。

与此相反,对于30和15°的斜向收敛模型,强烈变形,分块发育的陡峭倾斜的前楔没有精密的斜度。

贯穿连通的走滑断层发育在这些模型中的切割轴向隆起带的部位。

该模型分析的数字摄影的动画显示了推力系统的发起和传播。

尤其是,它很明确的表明在任何一个时间内,若干逆冲断层是同时运动的。

贯穿于适当倾斜的收敛模型中的串联交叉的刨面几乎很难与正交模型中的横截面区分的。

正交收敛实验的结果是将井与巴基斯坦盐岭地图上的断层和褶皱模式对比得到的。

60和45°的斜向收敛模型将井与走滑断层分块变形的扎个罗斯对比。

高度倾斜模型显示很强的分块变形,穿透平行边缘的走滑断层与在委内瑞拉东北发现的断层相似。

1.前言许多含油气冲断带,包括伊朗和伊拉克的扎格罗斯“只是褶皱带”(Alavi1994; Beydoun, 1988; Beydoun et al., 1992; Blanc, Allen, Inger, & Hassani, 2003),巴布亚新几内亚褶皱带(Cole et al.,2000; Hill, Norvick, Keetley, & Adams, 2000),阿尔巴尼亚(Velaj et al., 1999), 阿巴拉契亚山脉(Hatcher, Osberg,Drake,Robinson,&Thomas, 1990),和南美洲的亚安第斯山褶皱带(Roeder & Chamberlin, 1995; Tankard et al., 1995)是斜向或正交收敛-俯冲和(或)碰撞的结果。

地理信息系统中英文对照外文翻译文献

地理信息系统中英文对照外文翻译文献

中英文对照外文翻译(文档含英文原文和中文翻译)A Survey on Spatio-Temporal Data WarehousingAbstractGeographic Information Systems (GIS) have been extensively used in various application domains, ranging from economical, ecological and demographic analysis,to city and route planning. Nowadays, organizations need sophisticated GIS-based Decision Support System (DSS) to analyze their data with respect to geographic information, represented not only as attribute data, but also in maps. Thus, vendors are increasingly integrating their products, leading to the concept of SOLAP (Spatial OLAP). Also, in the last years, and motivated by the explosive growth in the use of PDA devices, the field of moving object data has been receiving attention from the GIS community. However, not much has been done in providing moving object databases with OLAP functionality. In the first part of this paper we survey theSOLAP literature. We then move to Spatio-Temporal OLAP, in particular addressing the problem of trajectory analysis. We finally provide an in-depth comparative analysis between two proposals introduced in the context of the GeoPKDD EU project: the Hermes-MDC system,and Piet, a proposal for SOLAP and moving objects,developed at the University of Buenos Aires, Argentina.Keywords: GIS, OLAP, Data Warehousing, MovingObjects, Trajectories, AggregationINTRODUCTIONGeographic Information Systems (GIS) have been extensively used in various application domains, ranging from economical, ecological and demographic analysis, to city and route planning (Rigaux, Scholl, & V oisard, 2001; Worboys, 1995). Spatial information in a GIS is typically stored in different so-called thematic layers (also called themes). Information in themes can be stored in data structures according to different data models, the most usual ones being the raster model and the vector model. In a thematic layer, spatial data is annotated with classical relational attribute information, of (in general) numeric or string type. While spatial data is stored in data structures suitable for these kinds of data, associated attributes are usually stored in conventional relational databases. Spatial data in the different thematic layers of a GIS system can be mapped univocally to each other using a common frame of reference, like a coordinate system.These layers can be overlapped or overlayed to obtain an integrated spatial view.On the other hand, OLAP (On Line Analytical Processing) (Kimball,1996; Kimball & Ross, 2002) comprises a set of tools and algorithms that allow efficiently querying multidimensional databases, containing large amounts of data, usually called Data Warehouses. In OLAP, data is organized as a set of dimensions and fact tables. In the multidimensional model, data can be perceived as a data cube, where each cell contains a measure or set of (probably aggregated) measures of interest. As we discuss later, OLAP dimensions are further organized in hierarchies that favor the data aggregation process (Cabibbo & Torlone, 1997). Several techniques and algorithms have been developed for query processing, most of them involving some kind of aggregate precomputation (Harinarayan, Rajaraman, & Ullman, 1996).The need for OLAP in GISDifferent data models have been proposed for representing objects in a GIS. ESRI () first introduced the Coverage data model to bind geometric objects to non-spatial attributes that describe them. Later, they extended this model with object-oriented support, in a way that behavior can be defined for geographic features (Zeiler,1999). The idea of the Coverage data model is also supported by the Reference Model proposed by the Open Geospatial Consortium (). Thus, in spite of the model of choice,there is always the underlying idea of binding geometric objects to objects or attributes stored in (mostly) object-relational databases (Stonebraker & Moore, 1996). In addition, query tools in commercial GIS allow users to overlap several thematic layers in order to locate objects of interest within an area, like schools or fire stations.For this, they use indexing structures based on R-trees (Gutman, 1984).GIS query support sometimes includes aggregation of geographic measures, for example, distances or areas (e.g., representing different geological zones). However, these aggregations are not the only ones that are required, as we discuss below.Nowadays, organizations need sophisticated GIS-based Decision Support System (DSS) to analyze their data with respect to geographic information, represented not only as attribute data, but also in maps, probably in different thematic layers. In this sense, OLAP and GIS vendors are increasingly integrating their products (see, for instance,Microstrategy and MapInfo integration in /, and /). In this sense, aggregate queries are central to DSSs. Classical aggregate OLAP queries (like “total sales of cars in California”), and aggregation combined with complex queries involving geometric components (“total sales in all villages crossed by the Mississippi river and within a radius of 100 km around New Orleans”) must be efficiently supported. Moreover, navigation of the results using typical OLAP operations like roll-up or drill-down is also required. These operations are not supported by commercial GIS in a straightforward way. One of the reasons is that the GIS data models discussed above were developed with “transactional” queries in mind. Thus, the databases storing nonspatial attributes or objects are designed to support those (nonaggregate) kinds of queries. Decision support systems need a different data model, where non-spatial data, probably consolidated from different sectors in an organization, is stored in a data warehouse. Here,numerical data are stored in fact tables built along several dimensions.For instance, if we are interested in the sales of certain products in stores in a given region, we may consider the sales amounts in a fact table over the three dimensions Store, Time and Product. In order to guarantee summarizability (Lenz & Shoshani, 1997), dimensions are organized into aggregation hierarchies. For example, stores can aggregate over cities which in turn can aggregate into regions and countries. Each of these aggregation levels can also hold descriptive attributes like city population, the area of a region, etc. To fulfill the requirements of integrated GIS-DSS, warehouse data must be linked to geographic data. For instance, a polygon representing a region must be associated to the region identifier in the warehouse. Besides, system integration in commercial GIS is not an easy task. In the current commercial applications, the GIS and OLAP worlds are integrated in an ad-hoc fashion, probably in a different way (and using different data models) each time an implementation is required, even when a data warehouse is available for non-spatial data.An Introductory Example. We present now a real-world example for illustrating some issues in the spatial warehousing problematic. We selected four layers with geographic and geological features obtained from the National Atlas Website (). Theselayers contain the following information: states, cities, and rivers in North America, and volcanoes in the northern hemisphere (published by the Global V olcanism Program - GVP). Figure 1 shows a detail of the layers containing cities and rivers in North America, displayed using the graphic interface of the Piet implementation we discuss later in the paper. Note the density of the points representing cities (particularly in the eastern region). Rivers are represented as polylines. Figure 2 shows a portion of two overlayed layerscontaining states (represented as polygons) and volcanoes in the northern hemisphere.There is also non-spatial information stored in a conventional data warehouse. In this data warehouse, dimension tables contain customer,stores and product information, and a fact table contains stores sales across time. Also, numerical and textual information on the geographic components exist (e.g., population, area), stored as usual as attributes of the GIS layers.In the scenario above, conventional GIS and organizational data can be integrated for decision support analysis. Sales information could be analyzed in the light of geographical features, conveniently displayed in maps. This analysis could benefit from the integration of both worlds in a single framework. Even though this integration could be possible with existing technologies, ad-hoc solutions are expensive because,besides requiring lots of complex coding, they are hardly portable. To make things more difficult, ad-hoc solutions require data exchange between GIS and OLAP applications to be performed. This implies that the output of a GIS query must be probably exported as members in dimensions of a data cube, and merged for further analysis. For example, suppose that a business analyst is interested in studying the sales of nautical goods in stores located in cities crossed by rivers. She could first query the GIS, to obtain the cities of interest. She probably has stored sales in a data cube containing a dimension Store or Geography with city as a dimension level. She would need to“manually” select the cities of interest (i.e., the ones returned by the GIS query) in the cube, to be able to go on with the analysis (in the best case, an ad-hoc customized middleware could help her). Of course, she must repeat this for each query involving a (geographic) dimension inthe data cube.Figure 1. Two overlayed layers containing cities and rivers in North America.On the contrary, GIS/Data warehousing integration can provide a more natural solution. The second part of this survey is devoted to spatio-temporal datawarehousing and OLAP. Moving objects databases (MOD) have been receiving increasing attention from the database community in recent years, mainly due to the wide variety of applications that technology allows nowadays. Trajectories of moving objects like cars or pedestrians, can be reconstructed by means of samples describing the locations of these objects at certain points in time. Although thereFigure 2. Two overlayed layers containing states in North America and volcanoes in thenorthern hemisphere.exist many proposals for modeling and querying moving objects, only a small part of them address the problem of aggregation of moving objects data in a GIS (Geographic Information Systems) scenario. Many interesting applications arise, involving moving objects aggregation, mainly regarding traffic analysis, truck fleet behavior analysis, commuter traffic in a city, passenger traffic in an airport, or shopping behavior in a mall. Building trajectory data warehouses that can integrate with a GIS is an open problem that is starting to attract database researchers. Finally, the MOD setting is appropriate for data mining tasks, and we also comment on this in the paper. In this paper, we first provide a brief background on GIS, data warehousing and OLAP, and a review of the state-of-the-art in spatial OLAP. After this, we move on to study spatio-temporal data warehousing, OLAP and mining. We then provide a detailed analysis of the Piet framework, aimed at integrating GIS, OLAP and moving object data, and conclude with a comparison between this proposal, and the Hermes data cartrridge and trajectory datawarehouse developed in the context of the GeoPKDD project (Information about the GoePKDD project can be found at http://www.geopkdd.eu).A SHORT BACKGROUNDGISIn general, information in a GIS application is divided over several thematic layers. The information in each layer consists of purely spatial data on the one hand, that is combined with classical alpha-numeric attribute data on the other hand (usually stored in a relational database). Two main data models are used for the representation of the spatial part of the information within one layer, the vector model and the raster model. The choice of model typically depends on the data source from which the information is imported into the GIS.The Vector Model. The vector model is used the most in current GIS (Kuper & Scholl, 2000). In the vector model, infinite sets of points in space are represented as finite geometric structures, or geometries, like, for example, points, polylines and polygons. More concretely, vector data within a layer consists in a finite number of tuples of the form (geometry, attributes) where a geometry can be a point, a polyline or a polygon. There are several possible data structures to actually store these geometries (Worboys, 1995).The Raster Model. In the raster model, the space is sampled into pixels or cells, each one having an associated attribute or set of attributes. Usually, these cells form a uniform grid in the plane. For each cell or pixel, the sample value of some function is computed and associated to the cell as an attribute value, e.g., a numeric value or a color. In general, information represented in the raster model is organized intozones, where the cells of a zone have the same value for some attribute(s). The raster model has very efficient indexing structures and it is very well-suited to model continuous change but its disadvantages include its size and the cost of computing the zones.Spatial information in the different thematic layers in a GIS is often joined or overlayed. Queries requiring map overlay are more difficult to compute in the vector model than in the raster model. On the other hand, the vector model offers a concise representation of the data, independent on the resolution. For a uniform treatment of different layers given in the vector or the raster model, in this paper we treat the raster model as a special case of the vector model. Indeed, conceptually, each cell is, and each pixel can be regarded as, a small polygon; also, the attribute value associated to the cell or pixel can be regarded as an attribute in the vector model.Data Warehousing and OLAPThe importance of data analysis has increased significantly in recent years as organizations in all sectors are required to improve their decision-making processes in order to maintain their competitive advantage. We said before that OLAP (On Line Analytical Processing) (Kimball, 1996; Kimball & Ross, 2002) comprises a set of tools and algorithms that allow efficiently querying databases that contain large amounts of data. These databases, usually designed for read-only access (in general, updating isperformed off-line), are denoted data warehouses. Data warehouses are exploited in different ways. OLAP is one of them. OLAP systems are based on a multidimensional model, which allows a better understanding of data for analysis purposes and provides better performance for complex analytical queries. The multidimensional model allows viewing data in an n-dimensional space, usually called a data cube (Kimball & Ross,2002). In this cube, each cell contains a measure or set of (probably aggregated) measures of interest. This factual data can be analyzed along dimensions of interest, usually organized in hierarchies (Cabibbo & Torlone, 1997). Three typical ways of OLAP tools implementation exist: MOLAP (standing for multidimensional OLAP), where data is stored in proprietary multidimensional structures, ROLAP (relational OLAP), where data is stored in (object) relational databases, and HOLAP (standing for hybrid OLAP, which provides both solutions. In a ROLAP environment, data is organized as a set of dimension tables and fact tables, and we assume this organization in the remainder of the paper.There are a number of OLAP operations that allow exploiting the dimensions and their hierarchies, thus providing an interactive data analysis environment. Warehouse databases are optimized for OLAP operations which, typically, imply data aggregation or de-aggregation along a dimension, called roll-up and drill-down, respectively. Other operations involve selecting parts of a cube (slice and dice) and reorienting the multidimensional view of data (pivoting). In addition to the basic operations described above, OLAP tools provide a great variety of mathematical, statistical, and financial operators for computing ratios, variances, ranks,etc.It is an accepted fact that data warehouse (conceptual) design is still an open issue in the field (Rizzi & Golfarelli, 2000). Most of the data models either provide a graphical representation based on the Entity- Relationship (E/R) model or UML notations, or they just provide some formal definitions without user-oriented graphical support. Recently, Malinowsky and Zimányi (2006) propose the MultiDim model. This model is based on the E/R model and provides an intuitive graphical notation. Also recently, Vaisman (Vaisman, 2006a, 2006b) introduced a methodology for requirement elicitation in Decision Support Systems, arguing that methodologies used for OLTP systems are not appropriate for OLAP systems.Temporal Data WarehousesThe relational data model as proposed by Codd (1970), is not wellsuited for handling spatial and/or temporal data. Data evolution over time must be treated in this model, in the same way as ordinary data. This is not enough for applications that require past, present, and/or future data values to be dealt with by the database. In real life such applications abound. Therefore, in the last decades, much research has been done in the field of temporal databases. Snodgrass (1995) describes the design of the TSQL2 Temporal Query Language, an upward compatible extension of SQL-92. The book, written as a result of a Dagstuhl seminar organized in June 1997 by Etzion, Jajodia, andSripada (1998), contains comprehensive bibliography, glossaries for both temporal database and time granularity concepts, and summaries of work around 1998. The same author (Snodgrass, 1999), in other work, discusses practical research issues on temporal database design and implementation.Regarding temporal data warehousing and OLAP, Mendelzon and Vaisman (2000, 2003) proposed a model, denoted TOLAP, and developed a prototype and a datalog-like query language, based on a (temporal) star schema. Vaisman, Izquierdo, and Ktenas (2006) also present a Web-based implementation of this model, along with a query language, called TOLAP-QL. Eder, Koncilia, and Morzy (2002) also propose a data model for temporal OLAP supporting structural changes. Although these efforts, little attention has been devoted to the problem of conceptual and logical modeling for temporal data warehouses. SPATIAL DATA WAREHOUSING AND OLAPSpatial database systems have been studied for a long time (Buchmann, Günther, Smith, & Wang, 1990; Paredaens, Van Den Bussche, & Gucht, 1994). Rigaux et al. (2001) survey various techniques, such as spatial data models, algorithms, and indexing methods, developed to address specific features of spatial data that are not adequately handled by mainstream DBMS technology.Although some authors have pointed out the benefits of combining GIS and OLAP, not much work has been done in this field. Vega López,Snodgrass, and Moon (2005) present a comprehensive survey on spatiotemporal aggregation that includes a section on spatial aggregation. Also, Bédard, Rivest, and Proulx (2007) present a review of the efforts for integrating OLAP and GIS. As we explain later, efficient data aggregation is crucial for a system with GIS-OLAP capabilities.Conceptual Modeling and SOLAPRivest, Bédard, and Marchand (2001) introduced the concept of SOLAP (standing for Spatial OLAP), a paradigm aimed at being able to explore spatial data by drilling on maps, in a way analogous to what is performed in OLAP with tables and charts. They describe the desirable features and operators a SOLAP system should have.Although they do not present a formal model for this, SOLAP concepts and operators have been implemented in a commercial tool called JMAP, developed by the Centre for Research in Geomatics and KHEOPS, see /en/jmap/solap.jsp. Stefanovic, Han, and Koperski (2000) and Bédard, Merret, and Han (2001), classify spatial dimension hierarchies according to their spatial references in: (a) non-geometric;(b) geometric to non-geometric; and (c) fully geometric. Dimensions of type (a) can be treated as any descriptive dimension (Rivest et al., 2001). In dimensions of types (b) and (c), a geometry is associated to members of the hierarchies. Malinowski and Zimányi (2004) extend this classification to consider that even in the absence of several related spatial levels, a dimension can be considered spatial. Here, a dimension level is spatial if it is represented as a spatial data type (e.g., point, region), allowing them to link spatial levels through topological relationships (e.g., contains, overlaps). Thus, a spatial dimension is a dimension that contains at least one spatial hierarchy. A critical point inspatial dimension modeling is the problem of multiple-dependencies, meaning that an element in one level can be related to more than one element in a level above it in the hierarchy. Jensen, Kligys, Pedersen, and Timko (2004)address this issue, and propose a multidimensional data model for mobile services, i.e., services that deliver content to users, depending on their location.This model supports different kinds of dimension hierarchies, most remarkably multiple hierarchies in the same dimension, i.e., multiple aggregation paths. Full and partial containment hierarchies are also supported. However, the model does not consider the geometry, limiting the set of queries that can be addressed. This means that spatial dimensions are standard dimensions referring to some geographical element (like cities or roads).Malinowski and Zimányi (2006) also propose a model supporting multiple aggregation paths. Pourabbas (2003) introduces a conceptual model that uses binding attributes to bridge the gap between spatial databases and a data cube. The approach relies on the assumption that all the cells in the cube contain a value, which is not the usual case in practice, as the author expresses. Also, the approach requires modifying the structure of the spatial data to support the model. No implementation is presented.Shekhar, Lu, Tan, Chawla, & Vatsavai (2001) introduced MapCube, a visualization tool for spatial data cubes. MapCube is an operator that, given a so-called base map, cartographic preferences and an aggregation hierarchy, produces an album of maps that can be navigated via roll-up and drill-down operations.Spatial Measures. Measures are characterized in two ways in the literature, namely: (a) measures representing a geometry, which can be aggregated along the dimensions; (b) a numerical value, using a topological or metric operator. Most proposals support option (a), either as a set of coordinates (Bédard et al., 2001; Rivest et al., 2001; Malinowski & Zimányi, 2004; Bimonte, Tchounikine, & Miquel, 2005), or a set of pointers to geometric objects (Stefanovic et al., 2000). Bimonte et al. (Bimonte et al., 2005) define measures as complex objects (a measure is thus an object containing several attributes). Malinowski and Zimányi (2004) follow a similar approach, but defining measures as attributes of an n-ary fact relationship between dimensions.Damiani and Spaccapietra (2006) propose MuSD, a model allowing defining spatial measures at different granularities. Here, a spatial measure can represent the location of a fact at multiple levels of (spatial) granularity. Also, an algebra of SOLAP operators is proposed.Spatial AggregationIn light of the discussion above, it should be clear that aggregation is a crucial issue in spatial OLAP. Moreover, there is not yet a consensus about a complete set of aggregate operators for spatial OLAP. We now discuss the classic approaches to spatial aggregation. Han et al. (1998) use OLAP techniques for materializing selected spatial objects, and proposed a so-called Spatial Data Cube, and the set of operations that can be performed on this data cube. The model only supports aggregation of spatial objects.Pedersen and Tryfona (2001) propose the pre-aggregation of spatial facts. First, they pre-process these facts, computing their disjoint parts in order to be able to aggregate them later. This pre-aggregation works if the spatial properties of the objects are distributive over some aggregate function. Again, the spatial measures are geometric objects.Given that this proposal ignores the geometries, queries like “total population of cities crossed by a river” are not supported. The paper does not address forms other than polygons, although the authors claim that other more complex forms are supported by the method, and the authors do not report experimental results.With a different approach, Rao, Zhang, Yu, Li, and Chen (2003), and Zhang, Li, Rao, Yu, Chen, and Liu (2003) combine OLAP and GIS for querying so-called spatial data warehouses, using R-trees for accessing data in fact tables. The data warehouse is then exploited in the usualOLAP way. Thus, they take advantage of OLAP hierarchies for locating information in the R-tree which indexes the fact table.Although the measures here are not only spatial objects, the proposal also ignores the geometric part of the model, limiting the scope of the queries that can be addressed. It is assumed that some fact table, containing the identifiers of spatial objects exists. Finally, these objects happen to be points, which is quite unrealistic in a GIS environment, where different types of objects appear in the different layers. Some interesting techniques have been recently introduced to address the data aggregation problem. These techniques are based on the combined use of (R-tree-based) indexes, materialization (or preaggregation) of aggregate measures, and computational geometry algorithms.Papadias, Tao, Kalnis, and Zhang (2002) introduce the Aggregation Rtree (aR-tree), combining indexing with pre-aggregation. The aR-tree is an R-tree that annotates each MBR (Minimal Bounding Rectangle) with the value of the aggregate function for all the objects that are enclosed by it. They extend this proposal in order to handle historic information (see the section on moving object data below), denoting this extension aRB-tree (Papadias, Tao, Zhang, Mamoulis, Shen, and & Sun, 2002). The approach basically consists in two kinds of indexes: a host index, which is an R-tree with the summarized information, and a B-tree containing time-varying aggregate data. In the most general case, each region has a B-tree associated, with the historical information of the measures of interest in the region. This is a very efficient solution for some kinds of queries, for example, window aggregate queries (i.e., for the computation of the aggregate measure of the regions which intersect a spatio-temporal window). In addition, the method is very effective when a query is posed over a query region whose intersection with the objects in a map must be computed on-thefly,and these objects are totally enclosed in the query region. However, problems may appear when leaf entries partially overlap the query window. In this case, the result must be estimated, or the actual results computed using the base tables. In fact, Tao, Kollios, Considine, Li,and Papadias (2004), show that the aRB-tree can suffer from the distinct counting problem, if the object remains in the same region for several timestamps.时空数据仓库的调查摘要地理信息系统已被广泛应用于不同的应用领域,包括经济,生态和人口统计分析,城市和路线规划。

  1. 1、下载文档前请自行甄别文档内容的完整性,平台不提供额外的编辑、内容补充、找答案等附加服务。
  2. 2、"仅部分预览"的文档,不可在线预览部分如存在完整性等问题,可反馈申请退款(可完整预览的文档不适用该条件!)。
  3. 3、如文档侵犯您的权益,请联系客服反馈,我们会尽快为您处理(人工客服工作时间:9:00-18:30)。

三维电子地图论文中英文资料外文翻译文献The Design and Implementation of 3D Electronic Map of Campus Based on WEBGISI. INTRODUCTIONNowadays, digitalization and informatization are the theme of our times. With the development of information revolution and computer science, computer technology has penetrated into all fields of science and caused many revolutionary changes in these subjects, the ancient cartography also can't escape. With the technical and cultural constantly progress, the form and the content of the map change and update as well. As the computer graphics, geographic information systems (GIS) constantly applied to the Web, the conventional way of fabrication and demonstration has suffered great change, and the application of the Map has extended dramatically owing to the development of advanced information technology. Under these circumstances, cartography will be faced with promising prospect. It has branched out into many new products. One of the products come into being is the e-map [1]. With the rapid development of the computer technology, computer graphics theory, remote sensing technology, photogram metric technology and other related technology. Users require handling and analysis of three-dimension visualization, dynamic interactivity and show their various geo-related data, so much attention should be paid to the research of three dimensional maps. This article based on the Northeast Petroleum University and its surroundings designs and creates the three-dimensional electronic map.II. FUNCTIONDESIGNThree-dimensional electronic map system of campus based on WEBGIS has general characteristics of the common maps. Through pressing the arrow keys (Up, Down, Left, And Right) on the keyboard, one can make the map move towards the correspondingdirection of translation. Through dragging mouse, one can see wherever he likes. Using the mouse wheel, you can control a map's magnitude, according to the user's needs to view different levels of map. The lower left of the map where will display the current coordinate of the mouse on the map. In a div layer, we depict a hotspot of new buildings, this layer can be displayed according to the different map layers, it also can automatically scale. By clicking on hot spots, it can show the hot spot's specific information. One can also type into the query information based on his need, and get some relevant information. In addition, one can choose to check the three dimensional maps and satellite maps through clicking the mouse.Major functions:•User information management: Check the user name and password, set level certification depending on the permissions, allow users of different permissions to login the system via the Internet.•The inquiry of Location information: System can provide users with fuzzy inquires and quick location.•Map management: Implement loading maps, map inquires, layer management, and other common operations such as distance measurement, and maps zoom, eagle eye, labels, printing, and more.•Roam the map: Use the up and down keys to roam any area of the map, or drag-and-drop directly.III. THE PROCESS OF SYSTEM DEVELOPMENTTo the first, we collect the information which contains the outward appearance of architectural buildings, the shape of the trees the design of the roads. And then, we construct three dimensional scenes with 3DS MAX software [2]. That is to say we render the scene and achieve the high-defmition map, after that we cut the map into small pictures with the cut figure program, at last we built the html pages which can asynchronous load maps and achieve the function of the electronic maps. The flow chart of the system development will be shown in Figure 1:Figure 1 system development flow chartTraditional maps have strict requirements on mathematical laws, map symbols and cartographic generalization when in design. The production of network landscape electronic map also has its own technical standards which is superior to the traditional map. The three-dimensional electronic map has different zoom levels; therefore it needs not the strict scale but the unified production standards. Map symbol usually imitate the real world as much as possible and simplify itself at the same time. The scope of the screen is far greater than the fixed vision of papery maps. Cartographic generalizations think much of the balance between the abstract model and the actual performance results.As for the data acquisition and management, such as the introduction and the information users obtained from the map are final results of data acquisition. In the beginning, we collect the needed data including the name, the address, the introduction and the digital photos of the buildings and prepare for the subsequent three-dimensional modeling. After collecting the data, we should pay attention to archival and backup the files in case of loss.In order to get the map, a good preparation of the design of the standard scene is necessary. We set the parameter of the underlay, lights, altitudes, render effects and so on, so as to ensure the final fruit of our effort will have a uniform effect. The spatial entity'sperformances usually show up as the form of spot, line and surface in the three-dimensional electronic map.Compared with vector graphics, the grid graphics have unparalleled advantages. The combination of the grid graphics and the WEBGIS's background publishing technology can improve the response speed of system and save system's inputs. System achieves the interaction with the map with the JavaScript languages. Seeing that there lie differences in supporting the scripting languages on various browsers, testing all kinds of functions by different browsers is a crucial step.IV. KEY TECHNOLOGIESThe developments of three-dimensional electronic maps are inseparable with the development of related areas, and it learns research methods, techniques and tools from other areas. While the researches of other areas are directly applied to the development and construction of three - dimensional electronic map, and Computer graphics, 3-D GIS, Virtual Reality and Geographic Data Base, the modeling of virtual scene and so became the technical support of the three-dimensional electronic map system.The WEBGIS technology on which three-dimensional electronic map system of campus based is a standard Software technology which means without any commercial software's support. During the development of the system we make use of the common available technology which includes the JavaScript technology, Ajax technology, XML technology, etc.Ajax is not a one fold technology, it is a mixture which mixes multiple technologies together, including the document object which used to display on the web and its hierarchical structure document object model DOM, and CSS that used to define the elements of style, and data exchange format XML or JSON, implementation and asynchronous server of XMLHttpRequest and client script language JavaScript [3]. Ajax takes advantage of non-synchronous interaction technology which means there is no need to update pages; therefore, it will lessen the user's waiting time both psychologically and physically. That is why it will be easier to be accepted by public.EXT is an excellent Ajax framework written in JavaScript; it has nothing to do with the back-end technology and can be used to develop rich client applications with agorgeous appearance. The system enables the EXT combined with JSP to achieve the other page functions of the electronic map. The system combines the EXT with the Prototype whose framework bears the burden of creating a rich client and a highly interactive Web application, which realizes the application of the rich client efficiently and manage the safety of the client in a safe way that could be controlled.JavaScript is the principle technology of the system during the design and the implementation process. It allows a variety of tasks which can be completed solely on the client, and without the participation of the network and server which used to support the distributed computing and processing, and therefore reducing the invisible waste of resources. JavaScript allows neither the access to the local hard disk, nor the data to be saved to the server, let alone to modify and delete network documents. The single way to browse the Web information and realize dynamic interaction is through the browser, which can effectively guard against the data-loss, consequently the system reaches a high security coefficient. JavaScript can be used to customize the browser according to the diverse users, the more user-friendly the design of web pages is, the easier the method for the users to master. JavaScript technology means through the small-block approach to realize the programming. Just as the other scripting languages, JavaScript is also an interpreted language; it offers a convenient development environment.In this system, we take advantage of JavaScript scripting language to realize the key functions such as loading maps, zooming maps, geographic location, and other related auxiliary functions, i.e. map icon display, ranging, eagle eye, tags. Oracle database meets the need of the data which is used in backstage management, and together with the JSP, XML and HTML to realize the user's authentication as well as adding, deleting, revising and inquiring information’s, etc.The main function of the system is to realize the three dimensional electronic map displayed in the browser through WEBGIS technology. Owing to the combination of JavaScript technology and WEBGIS development model, we can reduce the cost of the system, and at the same time improve the interoperability and system performance. Thanks to the application of AJAX technology, we can make further improvement on loading dynamical map. All the technologies we use will reduce the reaction time, which will leave a quick and efficient impression on users.V. THE IMPLEMENTATION OF THE SYSTEMA. The fabrication of the three-dimensional scene and scene rendering for map.The three-dimensional electronic map of campus based on WEBGIS, is an electronic map system which takes the Northeast Petroleum University as the prototype. To realize this system, we should complete the fabrication of three dimensional scene and scene rendering for map, so we select 3DMAX whose operation is simple and flexible to model. Given the later needs of electronic map, the three-dimension model should be delicate as much as possible. The three dimensional model's construction would take up a great deal of time, due to so many complicated buildings of Northeast Petroleum University.To complete the three-dimensional scene we should first prepare to render the scene well. Actually the grid picture which three dimensional electronic map used is the fixed angle of view swivel eye grid map. After modeling of three dimensional spatial entities, select the appropriate rendering method and make a fixed camera angle positioning in the render (Normally at 45-degree angle ), and then set the render output parameters to render them into the camera from the perspective of fixed size picture[4].B. Loading MapIn the WEB, the maps are mainly shown through the Div layer which has three layers. One layer is used as a window the carrier of the map. The size of the layer is as large as the map which we usually see through the browser (referred to as the window layer). Another layer is the moving layer used to follow the drag of the mouse (referred to as the moving layer).The other is the covering layer which lies between the window layer and the moving layer. The map window operated by users is constituted by the three layers mentioned above. Basic operations of the map are realized through setting features in different layers [5].When loading map, we use the raster data which we usually call image data. Raster data includes image data, two dimensional map, and three-dimensional simulated electronic map. The raster data in this system is three-dimensional simulated electronic map. The abstract two-dimensional map makes some ordinary users difficult to learn the information they need, but the three-dimensional simulated map simulate the real world's information exactly, so users can easily see the real world. This system mainly displays themap picture, when you view or drag the map, it just like a complete map picture of the current window, but in fact patchwork of small pictures. These small cards are cut from complete map by the specific cutting diagram program; all the picture cards are the same size and have fixed naming rules, so the map is faster and easier to load. There are many methods to complete the map carving, the system use square slab method to cut the map to 256 pixels * 256 pixels. Then write the script which based on the naming rules to complete the picture load.C. The Basic Function of MapDragging, zooming and translation are the basic functions of the map, and they are also important features of the map that differ from a simple picture. The following is a brief description of the implementation method. To realize dragging, the first thing is to set the mouse event functions. The events include mouse down and mouse up. So the two functions combined can complete the map navigation. The mouse down event is mainly used to record the drag state as well as the present location, while the mouse up function will capture the dragging completion status, then use show map function to reload maps. Process of realizing zooming function as follows:•Gain ratio value before amplification and the proper ratio value needed to enlarge.•Calculate the coordinates of the center of the map after amplification. The formula: (point.x / oldpercent) * newpercent.•Modify icon data in the icon layer (Icon layer logical operation-Cmap _ Base.js).•Remove the current map layer, and force the memory recycling.•Load required map file.With these basic functions, the user can observe the entire campus buildings concisely and clearly. The map is divided into five zoom levels, users can zoom out to view more buildings, also can zoom in to examine the architectural details.D. Other Utility Functions1)Highlight and pop-up boxesFor some hot-query buildings, we use JSON data to create a div layer, filled with color, and then set to translucent, when the mouse moved to the layer, this area will behighlight selected. When Mouse clicks on the highlighted area, a small window will pop up showing the architectural details. Take the stadium as an example, when the mouse is not over the stadium, the building has no change, but when moving the mouse over the stadium, the outline of the building shows. When click the highlight of the stadium, the stadium will pop up some basic information’s, such as the stadium office phone, address details, the basic profile.2)RangeAs a result of mutual conversion between longitude and latitude and the campus electronic map coordinate, we can first transform campus electronic map coordinate to the latitude and longitude coordinate, then calculate the distances between two spots through their latitude and longitude coordinates, this way is simple and precise.3)Label display and hideIn order to prompt some key places in the map (such as public transportation station, street sign ), using the new layer in its label tagging, it is convenient to the user for recognize specific location, but the tagging information will affect the whole scene showing, so the user can choose displaying labels when in needed.4)Real-time coordinate and eagle-eyedThrough the eagle eye map which located on the bottom right comer of the electronic map, users can understand roughly where they are in the campus. Drag the green box in the eagle eye map can quickly locate to the site you want to. The left bottom area displays real-time coordinate value of the mouse cursor in the system.5)Inquiry and localization functionThe final designed system is easy to operate .It provides quick navigation to the home page. If you select certain types of buildings, it will list all the similar constructions on the right. Click on a building name can be fast locating the corresponding position and display information’s related to the building. The inquiry data save d in the oracle relational database, while the positioning coordinate values picked up from the JSON files. The inquiry and localization is connected through the same field name realizing the localization inquiry integration. When come to fuzzy queries, enter the keywords in the query box, all relevant information’s will be displayed. You can also enter the exact name for precise query to find the corresponding building to know more about it.VI. CONCLUSIONThe three-dimensional electronic map of campus based on WEBGIS combines the advantages of macroscopically quality, integrity, and simplicity of 2d electronic map with reality, richness and intuitive of 3D virtual scene [6]. The map system using the JavaScript technology, the XML technology, the Oracle database and other technologies realizes the information transmission and interactive operation. The system itself is cross-platform, page-friendly, security, and easy to maintain, and B/S model allows a broader user to access dynamically and operate simply.From: YiZhi-An,Yin Liang-Qun.The Design and Implementation of 3D Electronic Map of Campus Based on WEBGIS.IEEE Conference Publications .2012:577-580基于WebGIS的校园三维电子地图的设计与实现一.导言如今,数字化和信息化是当今时代的主题。

相关文档
最新文档