【免费下载】SCSI硬盘坏道检测说明
SCSI硬盘坏道检测说明
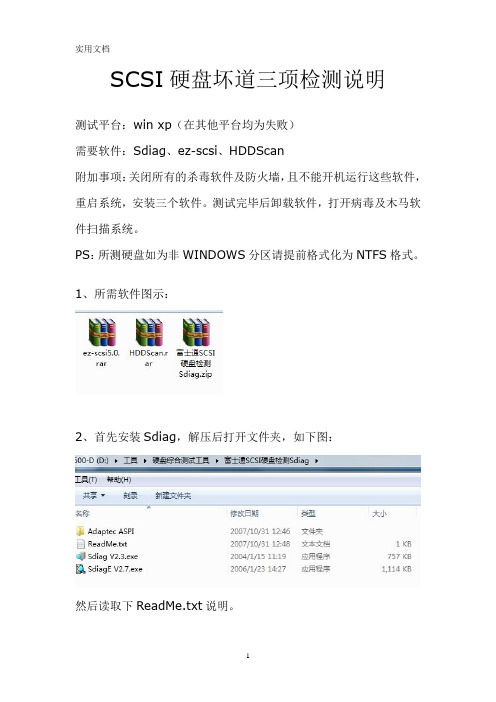
SCSI硬盘坏道三项检测说明测试平台:win xp(在其他平台均为失败)需要软件:Sdiag、ez-scsi、HDDScan附加事项:关闭所有的杀毒软件及防火墙,且不能开机运行这些软件,重启系统,安装三个软件。
测试完毕后卸载软件,打开病毒及木马软件扫描系统。
PS:所测硬盘如为非WINDOWS分区请提前格式化为NTFS格式。
1、所需软件图示:2、首先安装Sdiag,解压后打开文件夹,如下图:然后读取下ReadMe.txt说明。
打开Adaptec.ASPI文件夹,双击执行aspiinst.exe文件。
如果提示重启(reboot),请先重启系统一次,然后再打开SdiagE v2.7.exe,如下图:如果没有硬盘显示,说明硬盘挂载系统失败,请检查硬盘格式是否为windows识别格式,如果不是请用PQ一类的软件进行分区格式化为NTFS格式。
如果可以识别,如上图,点击RUN如果硬盘存在问题,会显示红色的FAIL(一般为存在物理或成长坏道),如果没问题,会显示PASS,如上图即存在问题,如存在问题,后面执行ez-scsi和HDDScan会检测出。
第二步安装ez-scsi后重启系统,然后在开始菜单找到Adaptec EZ-SCSI 5.0项目,打开里面的SCSI Explorer,打开后如下图,如果Grown Defect List为No…表面没有成长坏道。
前面的P项目为出厂坏道,任何SCSI盘,均或多或少存在出厂坏道。
需要注意的是,开启缓存,特别是某些SAS硬盘,必须是XP系统。
第三步安装HDDScan,进行物理坏道检测,如果出现红块[>500ms]或者蓝块[Bads]表明存在物理坏道。
这个扫描时间比较长,一块147G的硬盘扫描(校验方式)时间大约是1小时30分至50分。
Verify校验、Read读取、Erase擦除用校验时间比较久。
擦除的效果未试,不明是否能达到MHDD的效果。
最后提下SLI21320这个卡,我测试了很多卡,这个卡挂盘的兼容性不错,而且启动时扫描硬盘,如果硬盘存在坏道,均会卡住,如下图状态:必须要按下任意键才行,如下图:需要说明是,SCSI如果有橙色块,是很难像MHDD那样尝试擦除的,因此尽量选没有橙色块的,红色的基本没实际使用价值了,当测试盘或临时盘可以,有Bads的基本更是没啥价值可言了。
硬盘坏道检查
硬盘坏道检查概述硬盘坏道是指硬盘磁盘上的一部分区域无法正常读取或写入数据的问题。
这种问题可能导致数据丢失或文件损坏。
为了及时发现和修复硬盘上的坏道问题,进行硬盘坏道检查非常重要。
本文将介绍硬盘坏道的原因、检测方法以及如何修复坏道问题。
一、硬盘坏道的原因1. 磁盘表面损伤:硬盘上的磁盘表面可能会因为外部物理冲击、划伤或磁头异常等原因而损坏,导致数据无法正常读取或写入。
2. 软件问题:除了硬件原因外,软件问题也可能导致硬盘坏道。
例如,断电或非正常关机时,硬盘上的文件系统可能会受到损坏,导致数据丢失或出现坏道。
3. 长期使用和磁盘老化:硬盘作为计算机的重要组成部分,长时间运行、频繁读写数据会导致硬盘自身磁性材料的老化,以及磁头的磨损,从而引发坏道问题。
二、硬盘坏道检测方法1. 操作系统自带的磁盘检测工具:大多数操作系统都内置了一些简单的磁盘检测工具,例如Windows系统自带的磁盘检查工具和Linux系统的fsck命令。
这些工具可以检测磁盘表面的损坏和文件系统的错误,并尝试修复它们。
2. 第三方硬盘坏道检测工具:除了操作系统自带的工具,还有一些专业的第三方软件可以进行更为全面和深入的硬盘坏道检测。
例如,HD Tune、CrystalDiskInfo等工具可以提供更多磁盘健康状态的信息,包括温度、SMART数据等。
3. 使用磁盘测试仪器:对于专业维修人员来说,他们通常会使用磁盘测试仪器来检测硬盘坏道。
这些仪器能够更加精确地检测硬盘表面的损伤,并提供详细的报告。
三、如何修复硬盘坏道问题1. 使用操作系统自带的工具:当操作系统的磁盘检查工具检测到坏道时,它们通常会尝试自动修复坏道或将无法读取的数据移动到其他可用区域。
因此,如果检测到硬盘上的坏道,可以尝试使用操作系统自带工具修复问题。
2. 使用专业的修复软件:如果操作系统自带的工具无法修复硬盘坏道,可以尝试使用一些专业的修复软件。
这些软件通常具有更为强大的修复功能,能够尝试恢复丢失或损坏的数据。
MHDD(硬盘坏道检测软件)中文使用说明

扫描过程可随时按ESC键终止;
方块从上到下依次表示从正常到异常,读写速度由快到慢。正常情况下,应该只出现第一个和第二个灰色方块;
如果出现浅灰色方块(第三个方块),则代表该处读取耗时较多;
如果出现绿色和褐色方块(第三个和第四个方块),则代表此处读取异常,但还未产生坏道;
[Scan in: CHS/LBA]:以CHS或LBA模式扫描。CHS只对500M以下的老硬盘有效。
[Starting CYL]:设定开始扫描的柱面。
[Starting LBA]:设定开始扫描的LBA值。
[Log: On/Off]:是否写入日志文件。
[Remap: On/Off](重新映像):是否修复坏扇区。
[Loop the test/repair]:循环检测和修复,主要用于反复地修复顽固型坏道。
[Erase WAITs](删除等待):此项主要用于修复坏道,而且修复效果要比REMAP更为理想,尤其对IBM硬盘的坏道最为奏效,但要注意被修复的地方的数据是要被破坏的(因为Erase WAITS的每个删除单位是255个扇区)。Erase WAITS的时间默认为250毫秒,数值可设置范围从10到10000。要想设置默认时间,可以打开/CFG目录下的MHDD.CFG文件,修改相应项目即可更改Erase WAITS数值。此数值主要用来设定MHDD确定坏道的读取时间值(即读取某扇区块时如果读取时间达到或超过该数值,就认为该块为坏道,并开始试图修复),一般情况下,不必更改此数值,否则会影响坏道的界定和修复效果。
屏幕第一行的左半部分为为状态寄存器,右半部分为错误寄存器;在屏幕第一行的中间(在BUSY和AMNF之间)有一段空白区域,如果硬盘被加了密码,此处会显示PWD;如果硬盘用HPA做了剪切,此处会显示HPA;
硬盘坏道检测及修复方法

硬盘坏道检测及修复方法硬盘坏道检测及修复方法现在电脑越来越多,问题也随之多起来,在维护过程中,由于硬盘出问题是较多的, 尤其是出坏道的情况更是令人头疼。
一旦硬盘出现错误,有时数据的损失会比整个电脑报废的损失还要大。
其实硬盘坏道,几乎可以称为硬盘的致命伤。
店铺见识过许多因为延误时机,自己乱用各种软件修理,最后把偌大个硬盘整成一块废铁的例子。
修复硬盘坏道对于逻辑坏道,我们可以修复,对于物理坏道,我们应采用隔离的办法,以最大程度减少损失,防止坏道进一步扩散为目标。
我见过有些人在报纸上吹说用某个特殊软件能修理物理坏道,最要命的是许多人对低格硬盘的迷信,实在是误人之语。
所谓低级格式化,指的是将空白的磁盘划分出柱面和磁道,然后再将磁道划分为若干个扇区,每个扇区又划分出标识部分ID、间隔区GAP和数据区DATA等。
低级格式化只能在DOS环境下完成,而且只能针对—块硬盘而不能支持单独的某一个分区。
有些坏磁道和坏扇区能够通过低级格式化来修复,但对于真正的硬盘磁盘表面物理划伤则无法进行修复,这只有通过各种办法标出坏扇区的位置,以便让操作系统不去使用,以防止扩大坏道进而延长硬盘使用。
特别想强调,低级格式化是一种损耗性操作,对硬盘的寿命有一定的负面影响,所以,如无必要,用户们尽量不要低级格式化硬盘。
对于逻辑坏道,一般情况下我们用操作系统自带的工具和一些专门的硬盘检查工具就能发现并修复。
如:Windows自带的Scandisk 磁盘扫描程序就是发现硬盘逻辑坏道最常用的工具,而我们常见的Format命令不能对任何硬盘坏道起到修补作用,这点大家要明白。
我们可在Windows系统环境下,在“我的电脑”中选中要处理的硬盘盘符,选择其“属性”,在出现的“工具”按钮中选择“查错状态”,再在“扫描类型”中选“全面检查”,并将“自动修复错误”打上“勾”,然后“开始”即可。
如果系统在启动时不进行磁盘扫描或已不能进入Windows系统,我们也可用软盘或光盘启动盘启动电脑后,在相应的盘符下,如“A:”下运行Scandisk *:(注:*为要扫描的硬盘盘符),回车后来对相应需要扫描修复的硬盘分区进行修理。
快速检测硬盘坏道方法
快速检测硬盘坏道方法
检测硬盘坏道是一项重要的任务,因为坏道可能导致数据丢失或系统性能下降。
以下是一些快速检测硬盘坏道的方法:
一、使用Windows自带的硬盘检查工具
1. 打开“我的电脑”或“计算机”,右键点击要检查的硬盘,选择“属性”。
2. 在打开的窗口中,点击“工具”选项卡。
3. 在工具选项卡中,点击“错误检查”按钮。
4. 在弹出的窗口中,选择“扫描并尝试恢复坏扇区”选项,然后点击“开始”按钮。
二、使用第三方硬盘检测工具
1. 下载并安装一个可靠的第三方硬盘检测工具,例如HDDScan 或CrystalDiskInfo。
2. 打开软件,选择要检查的硬盘,然后点击“开始扫描”按钮。
3. 软件将扫描硬盘并显示坏道列表。
根据软件的提示修复坏道。
三、使用命令提示符检测硬盘坏道
1. 打开命令提示符(以管理员身份运行)。
2. 输入“chkdsk /f”命令,按下回车键。
3. 系统将提示您是否要计划磁盘检查,输入“Y”并按回车键。
4. 等待检查完成。
如果存在坏道,系统将自动尝试修复它们。
这些方法都可以帮助您快速检测硬盘坏道。
请注意,使用第三方
软件时,请确保从可信赖的来源下载软件,并仔细阅读软件的说明和警告信息。
检测硬盘坏道的方法

检测硬盘坏道的方法在硬盘可能出现的诸多问题中,硬盘坏道是比较棘手也很难解决的一种。
很多人不能在第一时间判断硬盘是否产生了坏道,以为只是普通的硬盘故障,因此反复使用硬盘或者采用第三方工具来修复硬盘,最后却发现硬盘故障加重了,数据损坏得更多了。
那么我们可以根据什么来检测硬盘是否出现了坏道呢?1、声音。
硬盘工作时,突然由原来正常的摩擦声变成了怪声,或明显听到硬盘“嗒嗒”响,并且硬盘在运行时速度明显变慢,有时Windows还会提示无法读写文件。
2、每次开机都自动进行磁盘扫描,这表明硬盘有需要修复的错误。
如果该程序不能顺利通过,就表明硬盘有坏道了;或者扫描虽可通过,但在某些位置标记为红色的“B”。
3、点开始-运行-cmd,然后进入dos,然后分别进入各个盘符,输入chkdsk命令,就会检测硬盘,如果有坏道的话会有提示。
4、硬盘无法引导,用软盘或光盘启动后根本看不到盘符;或者可以看见硬盘盘符,但无法对其进行操作。
格式化硬盘时,到某一进度停止不前,最后报错,无法完成。
5、利用第三方工具检测硬盘坏道。
硬盘坏道可分为逻辑坏道和物理坏道。
现在网上也有很多针对硬盘坏道的修复工具和教程,大家可以自行搜索查看。
不过关于硬盘坏道的修复,大多数人都是门外汉,如果自己对这些修复软件拿捏不清楚的话,最好不要随意去操作。
因为硬盘中保存了大量数据,一旦操作失误,就容易引起坏道扩散,最直接的后果,就是导致硬盘数据受损。
特别是硬盘出现物理坏道时,更要慎重对待。
物理坏道过多时,最好的办法就是寻找专业的数据恢复公司进行人工修复,若想获得迷你兔的人工修复服务,大家可在迷你兔官方网站获取相关联系方式。
硬盘坏道检测和修复方法

硬盘坏道检测和修复方法
硬盘坏道是指硬盘上出现的物理损坏或故障区域,可能导致数据丢失或硬盘无法正常工作。
以下是一些常见的硬盘坏道检测和修复方法:
1. 使用硬盘检测工具:有许多硬盘检测工具可用于检测硬盘坏道。
这些工具通常可以在计算机上运行,通过读取硬盘的SMART 数据或进行表面扫描来检测坏道。
一些常用的硬盘检测工具包括HDDScan、MHDD、CrystalDiskInfo 等。
这些工具可以提供有关硬盘健康状况和坏道位置的信息。
2. CHKDSK 命令:CHKDSK 是Windows 操作系统自带的磁盘检查工具。
你可以通过命令提示符或Windows 资源管理器右键菜单来运行CHKDSK 命令。
CHKDSK 可以检测和修复文件系统中的逻辑坏道。
3. 低格格式化:低格格式化是一种将硬盘彻底格式化的方法,它会重新标记坏道并将其从可用区域中排除。
请注意,低格格式化会删除硬盘上的所有数据,因此在进行之前请确保已备份重要数据。
4. 使用硬盘修复工具:有些硬盘制造商提供了专门的硬盘修复工具,可以修复一些类型的坏道。
这些工具通常可以在硬盘制造商的官方网站上找到。
5. 替换硬盘:如果硬盘坏道严重且无法修复,最后的解决方案可能是替换硬盘。
在这种情况下,建议尽快备份重要数据,并将硬盘送修或更换为新的硬盘。
需要注意的是,硬盘坏道的修复并不能保证完全修复所有问题,特别是对于物理损坏较为严重的坏道。
因此,定期备份重要数据是保护数据安全的重要措施。
在处理硬盘坏道时,请谨慎操作,并确保你对数据的备份和风险有充分的了解。
硬盘坏道检测原理
硬盘坏道检测原理
硬盘坏道检测的原理是通过读取硬盘上的数据并分析其特征,来判断硬盘是否存在坏道。
硬盘坏道主要分为物理坏道和逻辑坏道两种类型。
物理坏道是指硬盘磁盘表面上的物理损伤,例如划痕、磁盘变形等,这些坏道会导致硬盘无法正常读取数据。
逻辑坏道则是由于硬盘文件系统的错误或其他软件问题导致的,这些坏道并不会导致硬盘物理损坏,但会影响数据的完整性和可用性。
硬盘坏道检测的具体原理如下:
1. 读取硬盘数据:硬盘坏道检测工具会读取硬盘上的数据,并记录每个扇区的读取时间和错误信息。
2. 分析数据特征:根据读取到的数据特征,硬盘坏道检测工具可以判断扇区是否存在坏道。
例如,如果某个扇区的读取时间比其他扇区长很多,或者读取过程中出现了大量的错误,那么就可能存在坏道。
3. 标记坏道:一旦检测到坏道,硬盘坏道检测工具会将其标记出来,以便用户进行修复或替换。
4. 报告坏道信息:硬盘坏道检测工具会生成一份报告,其中包含了检测到的坏道信息,例如坏道的位置、类型、数量等。
需要注意的是,硬盘坏道检测工具并不能完全保证检测出所有的坏道,尤其是对于一些轻微的坏道可能无法检测出来。
因此,在进行硬盘坏道检测时,建议使用多种工具进行检测,并结合其他硬盘维护措施,如定期备份数据、避免硬盘受到剧烈震动等,以保障数据的安全和完整性。
硬盘坏道检测工具中文版下载硬盘坏道检测工具中文版(victoria)v4.46f绿色版
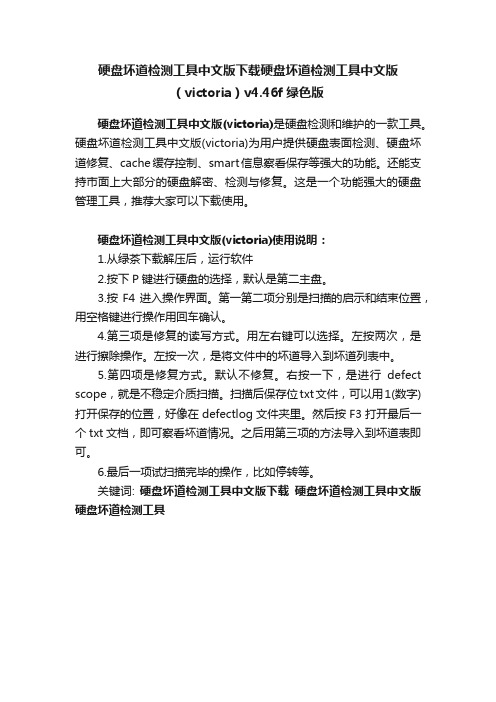
硬盘坏道检测工具中文版下载硬盘坏道检测工具中文版
(victoria)v4.46f绿色版
硬盘坏道检测工具中文版(victoria)是硬盘检测和维护的一款工具。
硬盘坏道检测工具中文版(victoria)为用户提供硬盘表面检测、硬盘坏道修复、cache缓存控制、smart信息察看保存等强大的功能。
还能支持市面上大部分的硬盘解密、检测与修复。
这是一个功能强大的硬盘管理工具,推荐大家可以下载使用。
硬盘坏道检测工具中文版(victoria)使用说明:
1.从绿茶下载解压后,运行软件
2.按下P键进行硬盘的选择,默认是第二主盘。
3.按F4进入操作界面。
第一第二项分别是扫描的启示和结束位置,用空格键进行操作用回车确认。
4.第三项是修复的读写方式。
用左右键可以选择。
左按两次,是进行擦除操作。
左按一次,是将文件中的坏道导入到坏道列表中。
5.第四项是修复方式。
默认不修复。
右按一下,是进行defect scope,就是不稳定介质扫描。
扫描后保存位txt文件,可以用1(数字)打开保存的位置,好像在defectlog文件夹里。
然后按F3打开最后一个txt文档,即可察看坏道情况。
之后用第三项的方法导入到坏道表即可。
6.最后一项试扫描完毕的操作,比如停转等。
关键词: 硬盘坏道检测工具中文版下载硬盘坏道检测工具中文版硬盘坏道检测工具。
硬盘坏道检测原理 -回复
硬盘坏道检测原理-回复硬盘坏道是指硬盘表面的磁道上出现了无法正常存取数据的小块区域。
这些坏道可能是由于硬盘长期使用、频繁读写、电力波动等原因造成的。
检测硬盘坏道的目的是为了及时发现并修复这些坏道,以保证硬盘的正常工作和数据完整性。
本文将一步一步介绍硬盘坏道检测的原理及其实施方法。
第一步:读写操作硬盘坏道检测的基本原理是通过对硬盘进行读写操作来检测坏道。
在进行检测之前,我们需要先了解硬盘的物理结构。
硬盘由一个或多个磁盘组成,每个磁盘上分布着许多磁道,磁道又被划分为若干个扇区。
扇区是硬盘读写数据的最小单位,通常为512字节或4096字节。
在硬盘坏道检测过程中,系统会对硬盘进行读操作,通过读取数据来查找坏道。
读取操作可以直接通过操作系统提供的磁盘工具或第三方软件进行,也可以使用命令行工具进行。
读取数据时,系统会从磁盘上读取所有的扇区,如果有坏道存在,读取操作会失败或出现错误。
第二步:校验数据为了确定磁盘上的每个扇区是否正常,我们需要对读取到的数据进行校验。
一般情况下,硬盘会通过使用ECC(Error Correcting Code)来纠正或检测错误,ECC是一种能够提高数据可靠性的技术。
当硬盘读取到一些错误的数据时,ECC机制会尽可能将这些错误的数据纠正。
如果ECC 纠正失败,说明这个扇区有可能是坏道。
第三步:标记坏道当确认某个扇区是坏道后,我们需要将其标记起来,以便后续的操作可以直接跳过这个坏道。
硬盘上专门有一个区域用于记录坏道信息,这个区域被称为G-List或P-List。
G-List用于记录当前硬盘上所有发现的坏道,P-List用于记录生产时已经确定的坏道。
第四步:修复坏道在检测到坏道后,我们可以尝试一些修复方法来恢复坏道。
目前,坏道修复的方法主要有两种:物理修复和逻辑修复。
物理修复是指通过专业的硬盘修复设备或服务来修复坏道。
这种方法通常需要打开硬盘,对受损的磁道或扇区进行处理,以恢复数据的读写功能。
简单检测电脑硬盘是否有坏道及修复方法
简单检测电脑硬盘是否有坏道及修复方法
展开全文
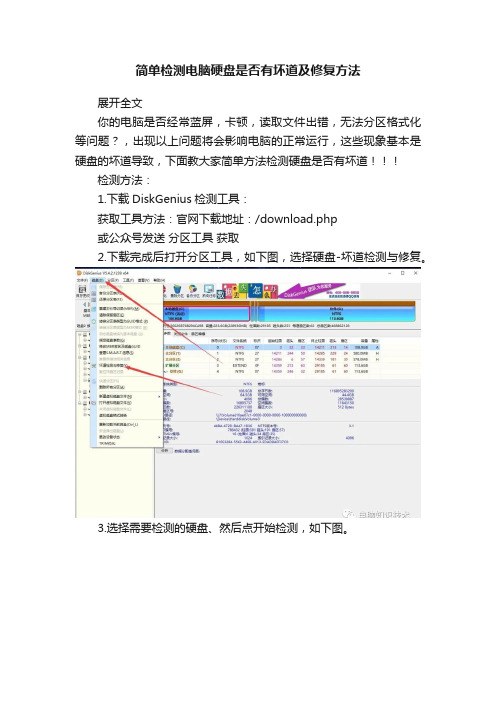
你的电脑是否经常蓝屏,卡顿,读取文件出错,无法分区格式化等问题?,出现以上问题将会影响电脑的正常运行,这些现象基本是硬盘的坏道导致,下面教大家简单方法检测硬盘是否有坏道检测方法:
1.下载DiskGenius检测工具:
获取工具方法:官网下载地址:/download.php
或公众号发送分区工具获取
2.下载完成后打开分区工具,如下图,选择硬盘-坏道检测与修复。
3.选择需要检测的硬盘、然后点开始检测,如下图。
4.扫描到坏道会显示出来,如下图,
5.检测完成后如果发现坏道可以点击尝试修复,即可修复硬盘坏道。
重要提示:硬盘的坏道分两种,物理坏道和逻辑坏道
物理坏道:物理坏道为硬盘本身坏道,如盘片损伤等,软件基本不能修复,这种只能通过改变扇区和分区改善。
逻辑坏道:逻辑坏道大多数由于操作不当或者软件问题导致,用软件修复即可改善。
▶▶▶如果检测坏道过多,建议换硬盘◀◀◀。
坏道检测与修复使用方法

坏道检测与修复使用方法我折腾了好久坏道检测与修复,总算找到点门道。
先说坏道检测吧。
我一开始真的是瞎摸索。
最开始我用的是系统自带的一些工具,像Windows系统自带的磁盘检查工具。
这个操作其实还挺简单的,就右键点击你要检测的磁盘分区,然后选择属性,在工具那一项里面有个查错,点击开始检查,这里就可以选择是否自动修复文件系统错误和扫描并尝试恢复坏扇区。
不过这个方法检测起来特别慢,有一次我检测我的一个大容量硬盘,感觉等了好久好久,我都以为电脑死机了,但其实它还在慢慢检测。
后来我试过用一些专门的软件,像HD Tune这个软件。
打开这个软件,找到你要检测的硬盘,然后选择健康状态这个选项,就能看到关于硬盘各个指标的情况,这里面就能看到有没有可能存在坏道的提示,算是一种比较直观的检测方法。
我有次检测一个老硬盘的时候,看到那些红红的数据就知道可能有坏道了,当时可紧张了,毕竟硬盘里还有我的好多重要文件呢。
再说说坏道修复。
如果是小问题的话,上面说的系统自带磁盘检查工具那个修复功能有时候还真能起点作用。
但是如果坏道比较严重,这个就不太行了。
我试过用MHDD这个软件来修复。
这个软件有点复杂,就像是在一个很黑暗的迷宫里面摸索。
你要用命令提示符那种方式去操作。
我一开始的时候老是输错命令,搞得我头大。
后来慢慢摸索才搞懂。
这个软件检测到坏道之后,可以尝试用remap这个命令来对坏道进行重映射,让电脑把这块坏的地方映射到其他好的地方去。
不过这个过程也不是百分百成功的,有时候坏道太多了,这个软件也搞不定。
我有个旧硬盘,有好多坏道,我用这个软件试了好几次,虽然修复了一些,但是最后硬盘还是有些问题,读取数据的时候还是会偶尔出错。
我觉得对于坏道检测与修复,还有一点很重要的就是备份数据。
在你做检测或者修复之前,一定要先把重要数据备份出来。
就像你要去修房子,要先把房子里的宝贝都拿出来一样。
我有次忘记备份数据就直接修复了,结果差点把重要数据都搞丢了,还好最后找回来了一部分,那时候真的是吓出一身冷汗。
硬盘组件(硬盘和滑块)的划痕测试应用说明说明书

Scratch Testing of Hard Drive Components(Hard Disks and Sliders)Application NoteIntroductionA common failure of a hard drive occurs when a computer is moved or dropped and the read heads come into contact with the hard disk platters. If permanent deformation is caused from this contact you may get the infamous blue screen. To protect the disks and sliders, a diamond-like-carbon (DLC) coating is applied to each component. The coatings on the hard disks are usually 4nm to 30nm of thickness and the coatings on the sliders are typically 2nm to 4nm of thickness. Manufacturing conditions greatly affect the mechanicalproperties and the durability of the DLC coatings. Typically, instrumented indentation testing (nanoindentation) is used to determine the mechanical properties of thin fi lms; however, due to overwhelming substrate infl uence,nanoindentation will not providesubstrate independent mechanical properties of the ultra-thin DLC fi lms.In the situation where substrate infl uences overwhelm quantitative results of indentation, a nanoindenter can be used to perform scratch testing to obtain qualitative results through mimicking product failure in a controlled test. For testing hard disk and sliders, a scratch test can be used to evaluate the DLC fi lm failure. In this application note, the results from scratch testing—using the Agilent G200 Nano Indenter ® and the stage of the Nano Vision ® option —four hard disk samples and a slider from a hard drive are compared showing clear and statistical differences in the response of the different coatings on the hard disks and positional variation of the coating on the slider.Bryan CrawfordFigure 1. Cross-sectional diagram of the hard disk samples showing the 30nm coating of DLC.100 to 400nm Layer of Magnetic Material100 to 400nm Layer of Magnetic Material500µm Substrate Material30nm Carbon Layer10nm Bonding LayerAxis of SymmetryFigure 2. The slider removed from the gimbal device of a hard drive. Sliders typically have a2nm to 4nm coating.SamplesThe Hard Disks:Four new hard disk platters, each processed using different parameters, were provided by a manufacturer and were described as having the axisymetric cross-sectional geometry shown in Figure 1. These platters did not have lubricants applied to the surfaces.The Slider:A slider and read head assembly was removed from a used, but still working, hard drive that was produced inJune 2000. A microscope view of theslider is shown in Figure 2.Test MethodologyTo mimic the contact of a head crash, a ramp load scratch test was chosen to test all of the hard disk platters and slider. In a scratch test, a tip is brought into contact with the sample; then, the tip is loaded at a constant loading rate while simultaneously translating the sample. Prior to and following the scratch test, a single-line-scan of the surface morphology is completed for comparing the original surface to the deformation caused by the scratch test. Therefore, each scratch test consists of three steps: a single-line pre-scan of the area to be scratched, the ramp load scratch test, and a fi nal scan to evaluate the residual deformation. Before and after each step, a pre-scan and a post-scan, usually equal to 10% of the scratch length, is performed so that the software can automatically align the data in the three steps. The original and residual single-line scans allow for the evaluation of deformation mechanisms and the quantifi cation of deformation. The scratch process is diagramed in Figure 3.When performing scratch testing on any sample set, it is critical that all test parameters and tip geometries remain consistent throughout thesamples being compared. This ensures that qualitative comparisons can be made using the resulting data. The test parameters used in testing the hard disk samples and the slider positions are listed in Table 1 and Table 2, respectively.The tip chosen for conducting thescratch tests was a cube corner tip with a tip radius that was less then 20nm. A cube corner tip creates a triangular projected contact with the sample; this tip geometry creates high levels of stress in the material during the scratch. Scratches can be performed either faceforward or edge forward when using a pyramid shaped indenter. Scratching face forward with the cube corner tip acts like a snow plow and pushes the material out of the way, while edge forward cuts the material like a knife. A diagram of a cube corner tip is shown in Figure 4.While Figure 3 depicts the tip moving across the sample, in application, the tip is held stationary while the sample is translated underneath the tip. A nanopositioning stage was chosen for translating the sample during these scratch tests. Usually, the standard motion table on the Nano Indenter G200 is used for completing scratch tests. However, a high precision positioning stage with a superior fl atness of travel was required due to the dimensions of the fi lms being tested. Thenanopositioning stage chosen for this application was the same stage that is used for the Nano Vision option on the Nano Indenter G200; this stage has a fl atness of travel of 2nm over a 100µm range of lateral travel.Results and DiscussionHard Disk Platters Samples with DLC fi lms usually exhibit excessive sink in during testing. Frequently, the fi lm will defl ect far greater than its thickness prior to failure. This is usually due to thecompliance of the underlying materials that the fi lm is designed to protect. These underlying materials are often much softer than the fi lm allowingdeformation of the underlying materials prior to fi lm deformation or failure. Hard drive components, such as the platters and sliders, usually fall into this category of materials. Figure 5 shows a diagram of the sink-in that occurs during testing of the DLC fi lms on top of softer underlying materials.Figure 3. Diagram of the three-step ramp load scratch test. Red lines show the areas of pre and post profi le scans used to perform leveling of the 3 steps.Step 1: Original Surface ScanStep 2: Ramp Load Scratch SegmentStep 3: Residual Deformation ScanSampleSampleSampleFigure 4. Diagram of a cube corner tip.Indent ShapeSide View35.3°35.3°Normal ForceTipSubstrate MaterialDLC FilmSoft Material (i.e. Al, Cu, magnetic material, etc.)Figure 5. Diagram of the deformation that occurs during testing of a DLC fi lm on soft material. Notice that the fi lm material elasti-cally deforms while the underlying soft material accommodates the bulk of the deformation.Table 2. Testing Parameters for the Slider Positions.Table 1. Testing Parameters for the Hard Disk Samples.Scratch Length 80µm Scratch Velocity 8µm/s M aximum Scratch Load 0.8mN Scratch Direction Face ForwardScratch Length 80µm Scratch Velocity 8µm/s M aximum Scratch Load 2.0mN Scratch Direction Face ForwardTypical displacement curves for the scratch tests on each hard disk platter are shown in fi gures 6 through 9. Each fi gure contains the original surface scan (blue trace), the ramp loadscratch (green trace), and the residual deformation (orange trace). Each fi gure has the position of critical load (point of permanent failure) marked. The critical load was chosen based on excursions in the scratch displacement curves (signifying fracture) and the amount of residual deformation. It is apparent from the displacement curves that the carbon fi lms fractured at approximately 30nm of penetration, with the exception of Sample 2 which fractured at adisplacement that was less then 20nm of penetration. With close examination of the curves, it is also apparent that Sample 3 (Figure 8) showed signifi cantly less residual deformation then the other hard disk samples subjected to the same scratch loads and also showed less deformation during the scratch testwith a maximum penetration of only approximately 40nm – all of the other samples had a maximum penetration of over 45nm.Due to the differences examined in the progression of the scratch tests on each platter and the desire toquantify the amount of deformation Figure 6. Typical displacement curves for the scratch test performed on hard disk Sample 1.Figure 7. Typical displacement curves for the scratch test performed on hard disk Sample 2.Figure 8. Typical displacement curves for the scratch test performed on hard disk Sample 3.Figure 9. Typical displacement curves for the scratch test performed on hard disk Sample 4.that occurred during the scratch test, the residual scratch deformation was defi ned as the area of material that was permanently deformed from the scratch test. This was calculated as the area of deformation between the original surface scan and the residual deformation scan. Figure 10 shows thearea of residual deformation colored inFigure 10. The Residual Deformation was calculated by determining the area between the original surface scan and the residual deformation scan. The area of deformation is shown in red.red. In practice, the Agilent NanoSuite 5.0 software has a built-in function for calculating the areas under curves; this function was used in the calculation of these areas.Table 3 lists the results of the scratch tests on the hard disk samples while Figure 11 graphically displays the Critical Load and the Residual Scratch Deformation for the samples. Notice that Sample 2 has a combination of undesirable results; this sample has both a low critical load and high residual scratch deformation. In application, Hard Disk 2 will scratch easier and have higher permanent damage than the other disks. Sample 3 and Sample 4 were the best performers because they possessed a higher resistance to permanent deformation, even though these samples had critical loads that were comparable to Sample 1. The differentiator between samples 3 and4 was the penetration depth during the scratch segment of the test. Sample 3 exhibited a maximum penetration of approximately 42nm, while Sample 4 exhibited maximum penetration of approximately 47nm. A larger volumeof material was affected by the scratch tests performed on Sample 4, leaving Sample 3 as the sample with the most desirable scratch resistant properties.Penetration atCritical LoadResidual ScratchµN nmµm471.3 ± 9.5 (1σ)26.3 ± 0.6 (1σ)0.318 ± 0.030 (1σ)343.7 ± 36.618.7 ± 2.50.414 ± 0.044478.0 ± 9.528.0 ± 1.00.246 ± 0.029483.0 ± 5.228.0 ± 2.60.265 ± 0.057Critical Load Penetration atDeformation2 Sample Number1234Table 3. Scratch test results for the hard disk samples.Figure 11. Scratch test results for the hard disk samples. The error bars representone standard deviation.AverageCriticalLoad(µN)AverageResidualScratchDeformation(µm^2)Slider PositionsThe slider was tested in 4 positions to determine positional variation of the carbon coating; the scratch positions are shown in Figure 12. Each position was tested three times and fi gures 13 through 16 display typical scratch results from each position. The results show defi nite positional variation in the scratch resistant properties ofthe slider. Figure 17 graphically displays the results of the scratch tests at each position.All of the positions on the slider exhibited failure of the coating or underlying material. The critical loads were determined using the scratch curve and the original surface scan as a guide. For these types of coatings, it is critical that all three parts of theFigure 12. Slider test positions for determining positional variation.Figure 13. Typical scratch result from Position 1 on the upper slider arm.Figure 14. Typical scratch result from Position 2 on the slider shoulder.Figure 15. Typical scratch result from Position 3 on the middle slider arm.Figure 16. Typical scratch result from Position 4 on the lower slider arm.scratch test be displayed for analyzing the point of critical load for the test.It is easy to confuse the shearing of surface asperities with fracture of the fi lm; therefore, the original surface scan and the residual deformation scan provide a measure of failure and fracture. Commonly, surface roughness or surface asperities will cause a large drop in displacement or a spike in lateral force; the critical load shouldnot be chosen when a surface asperity is sheared, due to external infl uencesin the results. The critical loads were chosen for each of these positions by locating the position where continued failure occurred. The critical load could have been chosen at the location where fi rst chipping or fracture appears, but this also causes a larger variation in the results on DLC fi lms and it was decided to defi ne the critical load as the point of obvious continued failure of the sample. Position 1 showed the best scratch response by having the highestcritical load and the least amount of deformation during the scratch test. This means that, during an impact, Position 1 will have the most protection from permanent damage. Position 4 exhibited the most undesirable response by having the lowest resistance to failure and the highest amount of deformation in the material during the scratch test. ConclusionsThe Nano Indenter G200 andnanopositioning stage, supplied withthe Nano Vision option, was used tomeasure the scratch response of thinDLC fi lms. The results on the harddisk platters showed clear statisticaldifferences in the scratch responsesthat were due to the differentprocessing parameters. Results fromthe scratch tests on the slider alsoshowed clear statistical differencesin the scratch responses that wereattributed to positional variation of thefi lm properties across the slider.These results show the critical needfor having pre-scans and post-scans ofthe sample’s surface for nanotribologyapplications. In this application, thesurface scans allowed the quantifi cationof damage to be assessed. Withoutthese scans, very few or incorrectconclusions could have been draw forthese data sets.Figure 17. Scratch test results for the four slider positions. The error barsrepresent one standard deviation.AverageCriticalLoadAverageScratchDeformationNano Mechanical Systems from Agilent TechnologiesAgilent Technologies, the premier measurement company, offers high-precision, modular nano-measurement solutions for research, industry, and education. Exceptional worldwide support is provided by experienced application scientists and technical service personnel. Agilent’s leading-edge R&D laboratories ensure the continued, timely introduction and optimization of innovative, easy-to-use nanomechanical system technologies. /find/nanoindenter AmericasCanada (877) 894 4414 Latin America 305 269 7500 United States (800) 829 4444Asia Pacifi cAustralia 1 800 629 485 China 800 810 0189Hong Kong 800 938 693India 1 800 112 929 Japan 0120 (421) 345 Korea 080 769 0800 Malaysia 1 800 888 848 Singapore 180****8100T aiwan 0800 047 866 Thailand 1 800 226 008 Europe & Middle EastAustria 43(0)136****1571 Belgium 32 (0) 2 404 93 40 Denmark 45 70 13 15 15 Finland 358 (0) 10 855 2100 France 0825 010 700**0.125 €/minute Germany 49 (0) 7031 464 6333 Ireland 1890 924 204Israel 972-3-9288-504/544 Italy 39 02 92 60 8484 Netherlands 31 (0) 20 547 2111 Spain 34 (91) 631 3300 Sweden 0200-88 22 55 Switzerland 0800 80 53 53 United Kingdom 44 (0) 118 9276201 Other European Countries:/fi nd/contactus Product specifi cations and descriptions in this document subject to change without notice.© Agilent Technologies, Inc. 2009 Printed in USA, December 16, 20095990-5159EN。
硬盘坏道要怎么检测

硬盘坏道要怎么检测
我们的电脑在使用久了之后难免会出现硬盘坏道,如果硬盘有坏道就会影响电脑的运行甚至会导致数据丢失,那么适时检测硬盘坏道并对其进行修复是很有必要的。
下面是店铺为大家介绍检测硬盘坏道的方法,欢迎大家阅读。
检测硬盘坏道的方法
1、打开鲁大师主菜单界面之后,注意右下角部分,如箭头位置
2、打开硬盘检测菜单,注意选择需要测试的分区或者硬盘(这里为了节省时间,我只测试了C分区)点击开始扫描
3、接着鲁大师对您选择的分区或硬盘进行测试,注意查看右侧的状态。
颜色越深问题越严重,下面有一个大概的完成时间
4、为了测试的准确性,请测试之前尽量关闭电脑的应用。
同时由于测试需要消耗大量硬盘资源,请不要随意终端鲁大师以免影响硬盘
5、测试的结果根据测试的硬盘大小和读写花费的时间也不一样,查看如果严重和损坏的分区比较多。
那您的硬盘可能就有坏道或者问题要注意了
6、除此之外,对于硬盘测试的效果。
旁边有一个smart信息是根据测试的结果和您硬盘的参数的正常水平进行对比,状态显示正常就是一个正常水平
7、为了测试的准确性,请关闭所有运行的大型软件或程序。
同时多测试几次避免偶然性,如果显示硬盘有坏道严重的分区,尽量不要保存重要数据。
硬盘坏道怎么检测
硬盘坏道怎么检测有时候在开启电脑的时候,由于无法硬盘无法引导系统启动,导致系统启动失败,这很多时候都是因为硬盘坏道引起的。
硬盘坏道常常表现为“无法删除文件”、“打开文件失败”、“无法读取或写入该文件”等等,下面来看看硬盘坏道的具体表现。
硬盘坏道的分类硬盘坏道分为逻辑坏道和物理坏道两种。
前者为软坏道,通常为软件*作或使用不当造成的,可用软件修复;后者为物理*坏道,表明你的硬盘磁道上产生了物理损伤,它只能通过更改硬盘分区或扇区的使用情况来解决。
硬盘坏道早知道1、在打开、运行或拷贝某个文件时,硬盘出现*作速度变慢,且有可能长时间*作还不成功或表现为长时间死“啃”某一区域,或同时出现硬盘读盘异响,或干脆WINDOWS系统提示“无法读取或写入该文件”。
这些都可表明你硬盘的某部分出现了坏道。
2、每次开机时,SCANDISK磁盘扫描程序都会自动运行。
这肯定表明硬盘上有需要修复的重要错误,比如坏道。
在运行该程序时如不能顺利通过,表明硬盘肯定有坏道,或扫描虽然也可通过,但出现红*的“B”标记,表明硬盘也有坏道。
3、电脑启动时硬盘无法引导,用软盘或光盘启动后可看见硬盘盘符但无法对该区进行*作或*作有误或干脆就看不见盘符,都表明硬盘上可能出现了坏道。
具体表现如开机自检过程中,屏幕提示“Harddiskdrivefailure”、“Harddrivecontrollerfailure”或类似信息,则可以判断硬盘驱动器或硬盘控制器有硬件故障;读写硬盘时提示“Sectornotfound”或“GeneralerrorinreadingdriveC”等类似错误信息,则表明硬盘磁道出现了物理损伤。
4、电脑在正常运行中出现死机或“该文件损坏”等问题,也可能和硬盘坏道有关。
当硬盘中出现了坏道的情况后,可以使用SCANDISK(磁盘扫描程序)来修复硬盘的坏道,还有磁盘医生及PCTOOLS等也是修复硬盘坏道的最常用的方法。
免费检测硬盘坏道

免费检测硬盘坏道
检测硬盘坏道的方法
这里借助一个比较简单的软件,就是鲁大师,我们可以直接上网搜索一下,然后下载下来就好了。
2下载了以后,我们就点击安装就可以了,安装好了以后,我们打开,就会在下面看到一个硬盘检测的,我们点击一下打开。
3打开以后,我们首先就是选择我们的硬盘,建议一般都有分盘的,一个个的检查就可以了。
4选择好了以后,我们会看到他们给我们检测,显示的分的是等级,好坏之类的,也方便我们查看的。
5不同的颜色说明硬盘在这个阶段的储存的情况,只要最后一个不出现太多的话,说明硬盘的坏道比较少的。
最后一项如果很多。
损坏和严重如果很多的,说明硬盘的寿命真的是很长了。
6然后我们点击上面的smart,就可以看到他们对硬盘的相关的一些功能的检测,只要后面显示的是正常,说明硬盘使用影响不大的。
感谢您的阅读,祝您生活愉快。
SCSI硬盘坏道检测说明-推荐下载

SCSI硬盘坏道三项检测说明测试平台:win xp(在其他平台均为失败)需要软件:Sdiag、ez-scsi、HDDScan附加事项:关闭所有的杀毒软件及防火墙,且不能开机运行这些软件,重启系统,安装三个软件。
测试完毕后卸载软件,打开病毒及木马软件扫描系统。
PS:所测硬盘如为非WINDOWS分区请提前格式化为NTFS格式。
1、所需软件图示:2、首先安装Sdiag,解压后打开文件夹,如下图:然后读取下ReadMe.txt说明。
打开Adaptec.ASPI文件夹,双击执行aspiinst.exe文件。
如果提示重启(reboot),请先重启系统一次,然后再打开SdiagE v2.7.exe,如下图:如果没有硬盘显示,说明硬盘挂载系统失败,请检查硬盘格式是否为windows识别格式,如果不是请用PQ一类的软件进行分区格式化为NTFS格式。
如果可以识别,如上图,点击RUN如果硬盘存在问题,会显示红色的FAIL(一般为存在物理或成长坏道),如果没问题,会显示PASS,如上图即存在问题,如存在问题,后面执行ez-scsi和HDDScan会检测出。
第二步安装ez-scsi后重启系统,然后在开始菜单找到Adaptec EZ-SCSI 5.0项目,打开里面的SCSI Explorer,打开后如下图,如果Grown Defect List为No…表面没有成长坏道。
前面的P项目为出厂坏道,任何SCSI盘,均或多或少存在出厂坏道。
需要注意的是,开启缓存,特别是某些SAS硬盘,必须是XP系统。
第三步安装HDDScan,进行物理坏道检测,如果出现红块[>500ms]或者蓝块[Bads]表明存在物理坏道。
这个扫描时间比较长,一块147G的硬盘扫描(校验方式)时间大约是1小时30分至50分。
Verify校验、Read读取、Erase擦除用校验时间比较久。
擦除的效果未试,不明是否能达到MHDD的效果。
最后提下SLI21320这个卡,我测试了很多卡,这个卡挂盘的兼容性不错,而且启动时扫描硬盘,如果硬盘存在坏道,均会卡住,如下图状态:必须要按下任意键才行,如下图:需要说明是,SCSI如果有橙色块,是很难像MHDD那样尝试擦除的,因此尽量选没有橙色块的,红色的基本没实际使用价值了,当测试盘或临时盘可以,有Bads的基本更是没啥价值可言了。
SCSI硬盘测试过程
SCSI硬盘测试过程1.准备工作在进行SCSI硬盘测试之前,需要进行一些准备工作,以确保测试的准确性和可靠性。
首先,确定测试环境,包括硬盘的计算机系统和相关配置。
确保计算机系统具备足够的性能来支持硬盘测试。
2.硬盘完整性测试硬盘完整性测试是确定硬盘是否存在物理损坏或故障的过程。
使用硬盘测试工具,如SMART(自监测、分析和报告技术)工具,对硬盘进行测试。
通过检查硬盘的S.M.A.R.T指标,包括温度、传输错误率、重新分配扇区等,可以确定硬盘的健康状况。
3.硬盘速度测试硬盘速度测试是确定硬盘传输速率的过程,包括读取和写入速度。
通过使用工具如CrystalDiskMark或HD Tune等进行测试,可以测量硬盘的顺序读取和随机读取速度。
这些测试可以提供硬盘的基本性能指标,如数据传输速率和访问时间。
4.硬盘性能测试硬盘性能测试是测量硬盘在特定工作负载下的性能。
这些测试可以模拟真实应用场景,如文件传输、数据库查询和多任务处理等。
使用测试工具如IOmeter、ATTO Disk Benchmark等进行测试,可以测量硬盘的IOPS (每秒输入/输出操作数)和吞吐量等关键指标。
5.硬盘稳定性测试硬盘稳定性测试是确定硬盘在长时间运行中的稳定性和可靠性的过程。
通过进行长时间的读写测试,可以评估硬盘在持续负载下的性能。
这些测试可以揭示硬盘的潜在故障和可靠性问题。
6.数据完整性测试数据完整性测试是通过在硬盘上执行数据校验和修复的过程,确保硬盘存储的数据是完整和正确的。
通过使用工具如Checksum或MD5验证等,可以检测硬盘上的数据是否存在错误或损坏,并进行修复。
7.测试报告和分析在完成硬盘测试后,需要生成一个测试报告,包括测试过程、测试结果和分析。
测试报告可以提供硬盘性能和可靠性的详细评估,并帮助用户了解硬盘的优缺点和适用性。
总结:SCSI硬盘测试是一项重要的过程,可以评估硬盘的性能和可靠性。
通过硬盘完整性测试、硬盘速度测试、硬盘性能测试、硬盘稳定性测试和数据完整性测试等步骤的组合,可以全面评估硬盘的性能。
- 1、下载文档前请自行甄别文档内容的完整性,平台不提供额外的编辑、内容补充、找答案等附加服务。
- 2、"仅部分预览"的文档,不可在线预览部分如存在完整性等问题,可反馈申请退款(可完整预览的文档不适用该条件!)。
- 3、如文档侵犯您的权益,请联系客服反馈,我们会尽快为您处理(人工客服工作时间:9:00-18:30)。
SCSI硬盘坏道三项检测说明
测试平台:win xp(在其他平台均为失败)
需要软件:Sdiag、ez-scsi、HDDScan
附加事项:关闭所有的杀毒软件及防火墙,且不能开机运行这些软件,重启系统,安装三个软件。
测试完毕后卸载软件,打开病毒及
木马软件扫描系统。
PS:所测硬盘如为非WINDOWS分区请提前格式化为NTFS格式。
1、所需软件图示:
2、首先安装Sdiag,解压后打开文件夹,如下图:
然后读取下ReadMe.txt说明。
打开Adaptec.ASPI文件夹,双击执行aspiinst.exe文件。
如果提示重启(reboot),请先重启系统一次,然后再打开SdiagE v2.7.exe,如下图:
如果没有硬盘显示,说明硬盘挂载系统失败,请检查硬盘格式是否为windows识别格式,如果不是请用PQ一类的软件进行分区格式化为NTFS格式。
如果可以识别,如上图,点击RUN
如果硬盘存在问题,会显示红色的FAIL(一般为存在物理或成长坏道),如果没问题,会显示PASS,如上图即存在问题,如存在问题,后面执行ez-scsi和HDDScan会检测出。
第二步安装ez-scsi后重启系统,然后在开始菜单找到Adaptec EZ-SCSI 5.0项目,打开里面的SCSI Explorer,打开后如下图,如果Grown Defect List为No…表面没有成长坏道。
前面的P项目为出厂坏道,任何SCSI盘,均或多或少存在出厂坏道。
需要注意的是,开启缓存,特别是某些SAS硬盘,必须是XP系统。
第三步安装HDDScan,进行物理坏道检测,如果出现红块
[>500ms]或者蓝块[Bads]表明存在物理坏道。
这个扫描时间比较长,一块147G的硬盘扫描(校验方式)时间大约是1小时30分至50分。
Verify校验、Read读取、Erase擦除
用校验时间比较久。
擦除的效果未试,不明是否能达到MHDD的效果。
最后提下SLI21320这个卡,我测试了很多卡,这个卡挂盘的兼容性不错,而且启动时扫描硬盘,如果硬盘存在坏道,均会卡住,如
下图状态:
必须要按下任意键才行,如下图:
需要说明是,SCSI如果有橙色块,是很难像MHDD那样尝试擦除的,因此尽量选没有橙色块的,红色的基本没实际使用价值了,当测试盘或临时盘可以,有Bads的基本更是没啥价值可言了。
另外要使用MHDD测试SCSI要选没有阵列功能的卡,而且比较挑卡。
By waiai@2013/3/28。
