IRSA_Land-Atm_lecture_Ch2_RadiationBudget_2012_JiaLi
Landmarkr5000_培训笔记_PART2

LandmarkR5000培训笔记(模块部分)一.合成记录的制作:Applications- Seismic Interpretation- SynTool- File- new 和R2003几乎是一样的,请参照R2003的学习资料进行学习!合成记录背景颜色的更改:1.找到syn_tool目录下的mirarc文件2.更改文件中screenforeClr和screenbackClr后的值,1取0,0取1。
这里只是给出了杨鹏飞师兄和白姐给出的常规方法:选择好数据,然后结合section剖面,利用datum info 将标准层对应起来,再进行调整。
没有涉及校验点checkshot和波形拉伸的学习,更没有将合成记录分解,分析各个反射层的影响。
这些都需要在实际工作中使用起来。
二.Seiswork的学习本模块类似于R2003,参照以前的教程进行学习。
三.PowerView本模块的用途是进行构造解释,时深转换,制作连井剖面,成图和可视化操作。
1.启动Applications-PowerView启动选择加载的数据体加载所有的数据都在这树状显示更改参数调背景颜色常用模块去除地震剖面转折线断层选择显示调整井参数大小以在图上合理显示不可编辑状态2.各种小功能井名显示格式边框和隔线点到点剖面去掉黑折线不选即可背景颜色选择井列表进一步选择井加入备注备注以文件形式显示(选择加入的文件及打开方式)3.Polygen选择将层位去掉一部分(内外包含)4.连井剖面在底图上拉连井剖面,在section上显示(左),再File-correlation,就会出现连井剖面(右)。
调整井参数,使显示方式更合理。
5.时深转换左为时间域,右为深度域只需将Z调成TVD即可6. 层位网格化,成等值线图及打印:tools- Grid and contours 网格成等值线;File- Printpreview 打印网格化成等值线成图加附注四.属性的提取1.Applications- Seismic Processing- PostStack/PAL/ESPR5000与R2003没有什么改变,操作请参照R2003相关资料。
英语
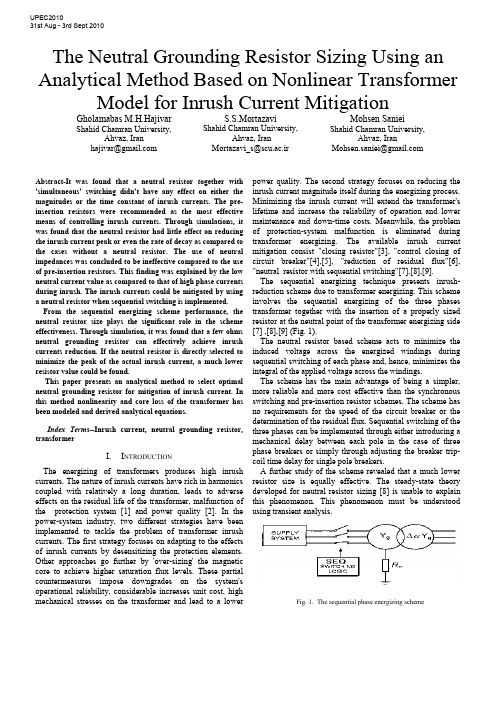
The Neutral Grounding Resistor Sizing Using an Analytical Method Based on Nonlinear Transformer Model for Inrush Current MitigationGholamabas M.H.Hajivar Shahid Chamran University,Ahvaz, Iranhajivar@S.S.MortazaviShahid Chamran University,Ahvaz, IranMortazavi_s@scu.ac.irMohsen SanieiShahid Chamran University,Ahvaz, IranMohsen.saniei@Abstract-It was found that a neutral resistor together with 'simultaneous' switching didn't have any effect on either the magnitudes or the time constant of inrush currents. The pre-insertion resistors were recommended as the most effective means of controlling inrush currents. Through simulations, it was found that the neutral resistor had little effect on reducing the inrush current peak or even the rate of decay as compared to the cases without a neutral resistor. The use of neutral impedances was concluded to be ineffective compared to the use of pre-insertion resistors. This finding was explained by the low neutral current value as compared to that of high phase currents during inrush. The inrush currents could be mitigated by using a neutral resistor when sequential switching is implemented. From the sequential energizing scheme performance, the neutral resistor size plays the significant role in the scheme effectiveness. Through simulation, it was found that a few ohms neutral grounding resistor can effectively achieve inrush currents reduction. If the neutral resistor is directly selected to minimize the peak of the actual inrush current, a much lower resistor value could be found.This paper presents an analytical method to select optimal neutral grounding resistor for mitigation of inrush current. In this method nonlinearity and core loss of the transformer has been modeled and derived analytical equations.Index Terms--Inrush current, neutral grounding resistor, transformerI.I NTRODUCTIONThe energizing of transformers produces high inrush currents. The nature of inrush currents have rich in harmonics coupled with relatively a long duration, leads to adverse effects on the residual life of the transformer, malfunction of the protection system [1] and power quality [2]. In the power-system industry, two different strategies have been implemented to tackle the problem of transformer inrush currents. The first strategy focuses on adapting to the effects of inrush currents by desensitizing the protection elements. Other approaches go further by 'over-sizing' the magnetic core to achieve higher saturation flux levels. These partial countermeasures impose downgrades on the system's operational reliability, considerable increases unit cost, high mechanical stresses on the transformer and lead to a lower power quality. The second strategy focuses on reducing the inrush current magnitude itself during the energizing process. Minimizing the inrush current will extend the transformer's lifetime and increase the reliability of operation and lower maintenance and down-time costs. Meanwhile, the problem of protection-system malfunction is eliminated during transformer energizing. The available inrush current mitigation consist "closing resistor"[3], "control closing of circuit breaker"[4],[5], "reduction of residual flux"[6], "neutral resistor with sequential switching"[7],[8],[9].The sequential energizing technique presents inrush-reduction scheme due to transformer energizing. This scheme involves the sequential energizing of the three phases transformer together with the insertion of a properly sized resistor at the neutral point of the transformer energizing side [7] ,[8],[9] (Fig. 1).The neutral resistor based scheme acts to minimize the induced voltage across the energized windings during sequential switching of each phase and, hence, minimizes the integral of the applied voltage across the windings.The scheme has the main advantage of being a simpler, more reliable and more cost effective than the synchronous switching and pre-insertion resistor schemes. The scheme has no requirements for the speed of the circuit breaker or the determination of the residual flux. Sequential switching of the three phases can be implemented through either introducing a mechanical delay between each pole in the case of three phase breakers or simply through adjusting the breaker trip-coil time delay for single pole breakers.A further study of the scheme revealed that a much lower resistor size is equally effective. The steady-state theory developed for neutral resistor sizing [8] is unable to explain this phenomenon. This phenomenon must be understood using transient analysis.Fig. 1. The sequential phase energizing schemeUPEC201031st Aug - 3rd Sept 2010The rise of neutral voltage is the main limitation of the scheme. Two methods present to control the neutral voltage rise: the use of surge arrestors and saturated reactors connected to the neutral point. The use of surge arresters was found to be more effective in overcoming the neutral voltage rise limitation [9].The main objective of this paper is to derive an analytical relationship between the peak of the inrush current and the size of the resistor. This paper presents a robust analytical study of the transformer energizing phenomenon. The results reveal a good deal of information on inrush currents and the characteristics of the sequential energizing scheme.II. SCHEME PERFORMANCESince the scheme adopts sequential switching, each switching stage can be investigated separately. For first-phase switching, the scheme's performance is straightforward. The neutral resistor is in series with the energized phase and this resistor's effect is similar to a pre-insertion resistor.The second- phase energizing is one of the most difficult to analyze. Fortunately, from simulation studies, it was found that the inrush current due to second-phase energizing is lower than that due to first-phase energizing for the same value of n R [9]. This result is true for the region where the inrush current of the first-phase is decreasing rapidly as n R increases. As a result, when developing a neutral-resistor-sizing criterion, the focus should be directed towards the analysis of the first-phase energizing.III. A NALYSIS OF F IRST -P HASE E NERGIZING The following analysis focuses on deriving an inrush current waveform expression covering both the unsaturatedand saturated modes of operation respectively. The presented analysis is based on a single saturated core element, but is suitable for analytical modelling of the single-phase transformers and for the single-phase switching of three-phase transformers. As shown in Fig. 2, the transformer's energized phase was modeled as a two segmented saturated magnetizing inductance in series with the transformer's winding resistance, leakage inductance and neutral resistance. The iron core non-l inear inductance as function of the operating flux linkages is represented as a linear inductor inunsaturated ‘‘m l ’’ and saturated ‘‘s l ’’ modes of operation respectively. (a)(b)Fig. 2. (a) Transformer electrical equivalent circuit (per-phase) referred to the primary side. (b) Simplified, two slope saturation curve.For the first-phase switching stage, the equivalent circuit represented in Fig. 2(a) can accurately represent behaviour of the transformer for any connection or core type by using only the positive sequence Flux-Current characteristics. Based on the transformer connection and core structure type, the phases are coupled either through the electrical circuit (3 single phase units in Yg-D connection) or through the Magnetic circuit (Core type transformers with Yg-Y connection) or through both, (the condition of Yg-D connection in an E-Core or a multi limb transformer). The coupling introduced between the windings will result in flux flowing through the limbs or magnetic circuits of un-energized phases. For the sequential switching application, the magnetic coupling will result in an increased reluctance (decreased reactance) for zero sequence flux path if present. The approach presented here is based on deriving an analytical expression relating the amount of inrush current reduction directly to the neutral resistor size. Investigation in this field has been done and some formulas were given to predict the general wave shape or the maximum peak current.A. Expression for magnitude of inrush currentIn Fig. 2(a), p r and p l present the total primary side resistance and leakage reactance. c R shows the total transformer core loss. Secondary side resistance sp r and leakage reactance sp l as referred to primary side are also shown. P V and s V represent the primary and secondary phase to ground terminal voltages, respectively.During first phase energizing, the differential equation describing behaviour of the transformer with saturated ironcore can be written as follows:()())sin((2) (1)φω+⋅⋅=⋅+⋅+⋅+=+⋅+⋅+=t V (t)V dtdi di d λdt di l (t)i R r (t)V dt d λdt di l (t)i R r (t)V m P ll p pp n p P p p p n p PAs the rate of change of the flux linkages with magnetizing current dt d /λcan be represented as an inductance equal to the slope of the i −λcurve, (2) can be re-written as follows;()(3) )()()(dtdi L dt di l t i R r t V lcore p p P n p P ⋅+⋅+⋅+=λ (4) )()(L core l p c l i i R dtdi−⋅=⋅λ⎩⎨⎧==sml core L L di d L λλ)(s s λλλλ>≤The general solution of the differential equations (3),(4) has the following form;⎪⎩⎪⎨⎧>−⋅⋅+−⋅+−−⋅+≤−⋅⋅+−⋅+−⋅=(5) )sin(//)()( )sin(//)(s s 22222221211112121111λλψωττλλψωττt B t e A t t e i A t B t e A t e A t i s s pSubscripts 11,12 and 21,22 denote un-saturated and saturated operation respectively. The parameters given in the equation (5) are given by;() )(/12221σ⋅++⎟⎟⎠⎞⎜⎜⎝⎛⋅−++⋅=m p c p m n p c m m x x R x x R r R x V B()2222)(/1σ⋅++⎟⎟⎠⎞⎜⎜⎝⎛⋅−++⋅=s p c p s n p c s m x x R x x R r R x V B⎟⎟⎟⎟⎟⎠⎞⎜⎜⎜⎜⎜⎝⎛⋅−+++=⋅−−⎟⎟⎟⎠⎞⎜⎜⎜⎝⎛−c p m n p m p c m R x x R r x x R x σφψ111tan tan ⎟⎟⎟⎟⎟⎠⎞⎜⎜⎜⎜⎜⎝⎛⋅−+++=⋅−−⎟⎟⎟⎠⎞⎜⎜⎜⎝⎛−c p s n p s p c m R R r x x R x σφψ112tan tan )sin(111211ψ⋅=+B A A )sin(222221s t B A A ⋅−⋅=+ωψ mp n p m p m p m p c xx R r x x x x x x R ⋅⋅+⋅−⋅+−⋅+⋅⋅⋅=)(4)()(21211σστm p n p m p m p m p c xx R r x x x x x x R ⋅⋅+⋅−⋅++⋅+⋅⋅⋅=)(4)()(21212σστ s p n p s p s p s p xx R r x x x x x x c R ⋅⋅+⋅−⋅+−⋅+⋅⋅⋅=)(4)()(21221σστ sp n p s p s p sp c xx R r x x x x x x R ⋅⋅+⋅−⋅++⋅+⋅⋅⋅=)(4)()(21222σστ ⎟⎟⎠⎞⎜⎜⎝⎛−⋅==s rs s ri i λλλ10 cnp R R r ++=1σ21221112 , ττττ>>>>⇒>>c R , 012≈A , 022≈A According to equation (5), the required inrush waveform assuming two-part segmented i −λcurve can be calculated for two separate un-saturated and saturated regions. For thefirst unsaturated mode, the current can be directly calculated from the first equation for all flux linkage values below the saturation level. After saturation is reached, the current waveform will follow the second given expression for fluxlinkage values above the saturation level. The saturation time s t can be found at the time when the current reaches the saturation current level s i .Where m λ,r λ,m V and ωare the nominal peak flux linkage, residual flux linkage, peak supply voltage and angular frequency, respectivelyThe inrush current waveform peak will essentially exist during saturation mode of operation. The focus should be concentrated on the second current waveform equation describing saturated operation mode, equation (5). The expression of inrush current peak could be directly evaluated when both saturation time s t and peak time of the inrush current waveform peak t t =are known [9].(10))( (9) )(2/)(222222121//)()(2B eA t e i A peak peak t s t s n peak n n peak R I R R t +−⋅+−−⋅+=+=ττωψπThe peak time peak t at which the inrush current will reachits peak can be numerically found through setting the derivative of equation (10) with respect to time equal to zero at peak t t =.()(11) )sin(/)(022222221212221/ψωωττττ−⋅⋅⋅−−−⋅+−=+−⋅peak t s t B A t te A i peak s peakeThe inrush waveform consists of exponentially decaying'DC' term and a sinusoidal 'AC' term. Both DC and AC amplitudes are significantly reduced with the increase of the available series impedance. The inrush waveform, neglecting the relatively small saturating current s i ,12A and 22A when extremely high could be normalized with respect to theamplitude of the sinusoidal term as follows; (12) )sin(/)()(2221221⎥⎦⎤⎢⎣⎡−⋅+−−⋅⋅=ψωτt t t e B A B t i s p(13) )sin(/)()sin()( 22221⎥⎦⎤⎢⎣⎡−⋅+−−⋅⋅−⋅=ψωτωψt t t e t B t i s s p ))(sin()( 2s n n t R R K ⋅−=ωψ (14) ωλλλφλφωλλφωmm m r s s t r m s mV t dt t V dtd t V V s=⎪⎭⎪⎬⎫⎪⎩⎪⎨⎧⎥⎥⎦⎤⎢⎢⎣⎡⎟⎟⎠⎞⎜⎜⎝⎛−−+−⋅=+⋅+⋅⋅==+⋅⋅=−∫(8) 1cos 1(7))sin((6))sin(10The factor )(n R K depends on transformer saturation characteristics (s λand r λ) and other parameters during saturation.Typical saturation and residual flux magnitudes for power transformers are in the range[9]; .).(35.1.).(2.1u p u p s <<λ and .).(9.0.).(7.0u p r u p <<λIt can be easily shown that with increased damping 'resistance' in the circuit, where the circuit phase angle 2ψhas lower values than the saturation angle s t ⋅ω, the exponential term is negative resulting in an inrush magnitude that is lowerthan the sinusoidal term amplitude.B. Neutral Grounding Resistor SizingBased on (10), the inrush current peak expression, it is now possible to select a neutral resistor size that can achieve a specific inrush current reduction ratio )(n R α given by:(15) )0(/)()(==n peak n peak n R I R I R α For the maximum inrush current condition (0=n R ), the total energized phase system impedance ratio X/R is high and accordingly, the damping of the exponential term in equation (10) during the first cycle can be neglected; [][](16))0(1)0()0(2212=⋅++⎥⎦⎤⎢⎣⎡⋅−+===⎟⎟⎠⎞⎜⎜⎝⎛+⋅⋅n s p c p s pR x n m n peak R x x R x x r R K V R I c s σ High n R values leading to considerable inrush current reduction will result in low X / R ratios. It is clear from (14) that X / R ratios equal to or less than 1 ensure negative DC component factor ')(n R K ' and hence the exponential term shown in (10) can be conservatively neglected. Accordingly, (10) can be re-written as follows;()[](17) )()(22122n s p c p s n p R x m n n peak R x x R x x R r V R B R I c s σ⋅++⎥⎦⎤⎢⎣⎡⋅−+=≈⎟⎟⎠⎞⎜⎜⎝⎛+⋅Using (16) and (17) to evaluate (15), the neutral resistorsize which corresponds to a specific reduction ratio can be given by;[][][](18) )0()(1)0( 12222=⋅++⋅−⋅++⋅−+⋅+=⎥⎥⎦⎤⎢⎢⎣⎡⎥⎥⎦⎤⎢⎢⎣⎡=n s p c p s p n s p c p s n p n R x x R x x r R x x R x x R r R K σσα Very high c R values leading to low transformer core loss, it can be re-written equation (18) as follows [9]; [][][][](19) 1)0(12222s p p s p n p n x x r x x R r R K +++++⋅+==α Equations (18) and (19) reveal that transformers require higher neutral resistor value to achieve the desired inrush current reduction rate. IV. A NALYSIS OF SECOND-P HASE E NERGIZING It is obvious that the analysis of the electric and magnetic circuit behavior during second phase switching will be sufficiently more complex than that for first phase switching.Transformer behaviour during second phase switching was served to vary with respect to connection and core structure type. However, a general behaviour trend exists within lowneutral resistor values where the scheme can effectively limitinrush current magnitude. For cases with delta winding or multi-limb core structure, the second phase inrush current is lower than that during first phase switching. Single phase units connected in star/star have a different performance as both first and second stage inrush currents has almost the same magnitude until a maximum reduction rate of about80% is achieved. V. NEUTRAL VOLTAGE RISEThe peak neutral voltage will reach values up to peak phasevoltage where the neutral resistor value is increased. Typicalneutral voltage peak profile against neutral resistor size is shown in Fig. 6- Fig. 8, for the 225 KVA transformer during 1st and 2nd phase switching. A del ay of 40 (ms) between each switching stage has been considered. VI. S IMULATION A 225 KVA, 2400V/600V, 50 Hz three phase transformer connected in star-star are used for the simulation study. The number of turns per phase primary (2400V) winding is 128=P N and )(01.0pu R R s P ==, )(05.0pu X X s P ==,active power losses in iron core=4.5 KW, average length and section of core limbs (L1=1.3462(m), A1=0.01155192)(2m ), average length and section of yokes (L2=0.5334(m),A2=0.01155192)(2m ), average length and section of air pathfor zero sequence flux return (L0=0.0127(m),A0=0.01155192)(2m ), three phase voltage for fluxinitialization=1 (pu) and B-H characteristic of iron core is inaccordance with Fig.3. A MATLAB program was prepared for the simulation study. Simulation results are shown in Fig.4-Fig.8.Fig. 3.B-H characteristic iron coreFig.4. Inrush current )(0Ω=n RFig.5. Inrush current )(5Ω=n RFig.6. Inrush current )(50Ω=n RFig.7. Maximum neutral voltage )(50Ω=n RFig.8. Maximum neutral voltage ).(5Ω=n RFig.9. Maximum inrush current in (pu), Maximum neutral voltage in (pu), Duration of the inrush current in (s)VII. ConclusionsIn this paper, Based on the sequential switching, presents an analytical method to select optimal neutral grounding resistor for transformer inrush current mitigation. In this method, complete transformer model, including core loss and nonlinearity core specification, has been used. It was shown that high reduction in inrush currents among the three phases can be achieved by using a neutral resistor .Other work presented in this paper also addressed the scheme's main practical limitation: the permissible rise of neutral voltage.VIII.R EFERENCES[1] Hanli Weng, Xiangning Lin "Studies on the UnusualMaloperation of Transformer Differential Protection During the Nonlinear Load Switch-In",IEEE Transaction on Power Delivery, vol. 24, no.4, october 2009.[2] Westinghouse Electric Corporation, Electric Transmissionand Distribution Reference Book, 4th ed. East Pittsburgh, PA, 1964.[3] K.P.Basu, Stella Morris"Reduction of Magnetizing inrushcurrent in traction transformer", DRPT2008 6-9 April 2008 Nanjing China.[4] J.H.Brunke, K.J.Frohlich “Elimination of TransformerInrush Currents by Controlled Switching-Part I: Theoretical Considerations” IEEE Trans. On Power Delivery, Vol.16,No.2,2001. [5] R. Apolonio,J.C.de Oliveira,H.S.Bronzeado,A.B.deVasconcellos,"Transformer Controlled Switching:a strategy proposal and laboratory validation",IEEE 2004, 11th International Conference on Harmonics and Quality of Power.[6] E. Andersen, S. Bereneryd and S. Lindahl, "SynchronousEnergizing of Shunt Reactors and Shunt Capacitors," OGRE paper 13-12, pp 1-6, September 1988.[7] Y. Cui, S. G. Abdulsalam, S. Chen, and W. Xu, “Asequential phase energizing method for transformer inrush current reduction—part I: Simulation and experimental results,” IEEE Trans. Power Del., vol. 20, no. 2, pt. 1, pp. 943–949, Apr. 2005.[8] W. Xu, S. G. Abdulsalam, Y. Cui, S. Liu, and X. Liu, “Asequential phase energizing method for transformer inrush current reduction—part II: Theoretical analysis and design guide,” IEEE Trans. Power Del., vol. 20, no. 2, pt. 1, pp. 950–957, Apr. 2005.[9] S.G. Abdulsalam and W. Xu "A Sequential PhaseEnergization Method for Transformer Inrush current Reduction-Transient Performance and Practical considerations", IEEE Transactions on Power Delivery,vol. 22, No.1, pp. 208-216,Jan. 2007.。
Simultaneous localization and mapping (SLAM) part II

S
long excursion, the so-called loop-closure problem. The data association section surveys current data association methods used in SLAM. These include batch-validation methods that exploit constraints inherent in the SLAM formulation, appearance-based methods, and multihypothesis techniques. The third development discussed in this tutorial is the trend towards richer appearance-based models of landmarks and maps. While initially motivated by problems in data association and loop closure, these methods have resulted in qualitatively different methods of describing the SLAM problem, focusing on trajectory estimation rather than landmark estimation. The environment representation section surveys current developments in this area along a number of lines, including delayed mapping, the use of nongeometric landmarks, and trajectory estimation methods. SLAM methods have now reached a state of considerable maturity. Future challenges will center on methods enabling large-scale implementations in increasingly unstructured environments and especially in situations where GPS-like solutions are unavailable or unreliable: in urban canyons, under foliage, under water, or on remote planets.
MODIS_LP_QA_Tutorial-3

MODIS Land Products Quality Assurance Tutorial (Land Surface Reflectance): Part-3
1
Platform Terra Terra Terra Terra Terra Aqua** Aqua Aqua Aqua Aqua
Short Name MOD09GA MOD09GQ MOD09CMG MOD09A1 MOD09Q1 MYD09GA MYD09GQ MYD09CMG MYD09A1 MYD09Q1
Product LSR Bands 1–7 LSR Bands 1–2 LSR Bands 1–7 LSR Bands 1–7 LSR Bands 1–2 LSR Bands 1–7 LSR Bands 1–2 LSR Bands 1–7 LSR Bands 1–7 LSR Bands 1–2
Introduction This third part of the MODIS Land Products QA Tutorial provides the knowledge base to interpret and understand the QA information in the MODIS land surface reflectance (LSR) product suite. It contains QA sources specific to the LSR product collection, interpretation examples, and a demonstration of how one of the LDOPE tools helps deconstruct the QA information. As described in Part-1 of the QA tutorial, file-level metadata broadly summarizes data quality at the file-level, and is only intended to help in the search and discovery process. Users should not solely depend on file-level metadata as they evaluate data for their application needs. The primary focus of this tutorial is pixel-level metadata in the MODIS Land Surface Reflectance product suite.
第八讲_AMTI

MTI滤波器输出功率为:
这里: 为杂波输入功率谱。
§2
P对k微分,令
速度自适应MTI系统
,可以找到 , 经计算得:
P将取得最小值。 另外,注意到一次对消的表达式为:
§2
而 从而,
速度自适应MTI系统
可写成:
该式的物理解释为:
可在-2到+2间变化,使凹口频率可在一定范围内变化。
自适应延时 输入 T
速度自适应MTI系统
由于惯导系统给出的v和θ有较大误差,所以上面估计的 fd也有较大误差,必须用其他方法进行精估. 采用质量中心法进行精估,公式为:
pc为由粗估计所得到的杂波区中的杂波总能量
§2
速度自适应MTI系统
这里M为粗估计得到的杂波多普勒中心频率所对应的FFT通 道号;2L为粗估计所得杂波谱宽所占有的FFT通道数(实际估计 时,可适当向两边延伸n个通道),这里假设了杂波谱为对称的。
第八讲
§ 1、 引言
自适应MTI系统
由于雷达杂波常常表现为时变杂波,其杂波谱的中 心频率和谱宽会随时间而变化.因此固定凹口的MIT 滤波器在这种情况下不能有效抑制杂波。 引起杂波产生时变特性的因素有: 1 气象条件变化时(如风力变化),使云雨杂波、海 浪杂波和地杂波的谱中心和谱宽发生变化。
§ 1、 引言
§2
速度自适应MTI系统
并在这一粗略估计谱宽内进行杂波谱中心和谱宽 的精确估计。 最后,剔除所估计的杂波谱宽内所有杂波(相应的 FFT通道屏蔽)通道;其余通道输出即为抑制杂波後 的目标输出。
§2
速度自适应MTI系统
(一). 杂波中心和杂波谱宽的粗估计 杂波谱中心频率:
其中v为载机航速, λ为雷达波长,ϕ为某距离单元相对 载机的俯仰角,θ为天线相对载机飞行方向的方位角,这 里:
Coupling an Advanced Land Surface-Hydrology Model with the Penn State-NCAR MM5 Modeling System1
MONTHLY WEATHER REVIEW
APRIL 2001
Coupling an Advanced Land Surface–Hydrology Model with the Penn State–NCAR MM5 Modeling System. Part I: Model Implementation and Sensitivity
1. Introduction For more than a decade, it has been widely accepted that land surface processes and their modeling play an important role, not only in large-scale atmospheric models including general circulation models (GCMs) (e.g., Mintz 1981; Rowntree 1983, etc.), but also in regional and mesoscale atmospheric models (Rowntree and Bolton 1983; Ookouchi et al. 1984; Mahfouf et al. 1987; Avissar and Pielke 1989; Chen and Avissar 1994a,b, etc.). Mesoscale models that resolve wavelengths from 1 to 100 km (i.e., from meso-␥ to meso- scales) are often used for three applications: 1) regional climate simulations, 2) numerical weather prediction, and 3) air quality monitoring. Therefore, during the last few years, we have witnessed rapid progress in developing and testing land surface models in mesoscale atmospheric models (e.g., Bougeault et al. 1991; Giorgi et al. 1993; Bringfelt 1996; Smirnova et al. 1996; F. Chen et al. 1997; Pielke et al. 1997).
翻译_利用机载四极化合成孔径雷达配合高程及光学遥感数据对盐沼植被栖息地进行随机森林分类

利用机载四极化合成孔径雷达配合高程及光学遥感数据对盐沼植被栖息地进行随机森林分类摘要本文调查了多源遥感数据在展示自然沿海盐沼植被栖息地的利用情况。
沿海地区情况十分复杂,并存在大量重要的生态系统,在洪水退去之后更为显著,但我们发现这一现象通过遥感方法很难观测。
本研究结合了S波段和X波段机载四极化合成孔径雷达数据,高程数据以及光学遥感数据,对共计30个变量进行了分析。
SAR的输入数据包括后向散射强度和Cloude-Pottier分解、Freeman-Durden分解及Van Zyl分解的SAR描述符。
分类结果通过随机森林分类器对盐沼植被影像及盐沼植被栖息地高分数据两个分辨率的数据影像获得。
分类结果表明,随机森林模型能够处理多元数据,并生成高精度分类结果。
单独基于SAR或光学遥感变量的模型精确度不如结合多源变量的模型。
研究结果表明,X波段的SAR数据能提供良好的数据来映射植被覆盖程度,S波段的SAR数据能更好的区别不同植被的栖息地。
本文所提及的分析及方法会将之前的研究扩展至对沿海地带进行动态监测,同时阐述了通过结合雷达及光学遥感数据分析自然沿海领域的发展前景。
引言沿海区域,即与海接触的土地,具体包括悬崖、海滩以及低洼盐沼地区的红树林。
收到潮汐作用及沉积效果的影响,沿海区域的形态总是不断变化。
沿海地区是世界上人口最密集的地区之一,尽管海拔10米以下的沿海区域只覆盖了全球2%的土地,但他们却包含了世界人口的10%。
他们被预测将会经历人口增长及经济发展的绝大部分过程。
例如,在欧洲,人造海洋在1990年至2000年之间扩增了7.5%。
频繁的形态变化给沿海地区长期和可持续化管理带来了艰巨的挑战。
最近,基于生态系统的沿海管理政策得到广泛关注,例如90年代首先提出的沿海地区统一管理(ICZM),许多研究都在探寻该政策的基本理念。
其中一种对ICZM的阐述认为ICZM是通过将生态服务系统与依靠良好沿海植被监管支持的洪水安全防护体系相关联,以此来提供更自然,更灵活以及更经济的海岸政策。
Motorola 无线手机产品说明书

MAINTENANCE MANUAL GPS TIMING MODULE ROA 117 2260/1, 2ericssonzSPECIFICATIONSInput V oltage +5 Vdc 10%Current Drain 67 Milliamps (Typical)Operating Temperature -30ºC to +60ºCDimensions 8.0 inches long x 4.0 inches wideConnector P1+5 Vdc A30, A31, B30, B31GroundA1, B1, C1, C12, A32, B32, C32Ericsson Inc.Private Radio Systems Mountain View RoadLynchburg, Virginia 24502AE/LZB 119 1875 R1A1-800-528-7711 (Outside USA, 804-528-7711)Printed in U.S.A.DESCRIPTIONG lobal P ositioning S atellite (GPS) Timing Module ROA 117 2260 is used in the GPS Simulcast Synch Shelf. There are multiple Synch Shelves in the GPS Simulcast System, one at the Control Point and one at each Transmit Site. Each Synch Shelf has two GPS Timing modules, A and B. Each of these are fully redundant.The Timing Module plugs into slots 9 & 10 of the Synch Shelf located at both the Control Point and the Transmit Site.At the Control Point, the Timing Module is an ROA 117 2260/1 and the module at the Transmit Site is an ROA 117 2260/2. One difference is that there is a different PROM in socket XU1 with different programming used between the two locations. Also, front panel LED’s and labels differ: CPTM for C ontrol P oint T iming M odule (Figure 1) and TXTM for T ransmit(X)T iming M odule (Figure 2).The Timing Module has three functions. Each function, though related, is performed differently at each location, control point or transmit site. At the Control Point, these functions:•Generate 300 Hz FSL (Frame Sync Line)•Generate Composite References•Select 9600 Hz ClocksAt the Transmit site, these functions:•Select 9600 Hz clocks•Recover references from composites•Control T1 delayRefer to Figures 1 and 2. The following is a description of the LED indicators found on the front panel of the modules.•PWR - Green LED indicates when power is applied to the module.•ACTV - Green LED indicates when this is the active module.•MAJ - Red LED indicates when a major alarm condition exists.•MIN - Yellow LED indicates when a minor alarm condition exist.•GPS - Yellow LED indicates that there is no signal coming from the GPS receivers. This is at the Con-trol Point.•LL - Yellow LED, at the transmit site, indicates that there is no signal coming from the GPS receivers andthe Land Line signals are being used.•FSL - Yellow LED indicates there is a loss of the Frame Synch Line at the Control Point.•REF 2 - Yellow LED indicates when there is a loss of composite reference 2 at the Transmit Site.•PROG- Switch resets PROM U1 and the Xilinx (FPGA) module U4 to the initial state.•TEST - Connector is an RJ12, 8-Pin connector used for test purposes (Refer to TEST AND TROU-BLESHOOTING). Connector P1 DefinitionCopyright © September 1996, Ericsson Inc.NOTERepairs to this equipment should be made only by an authorized service technician or facility designated the supplier. Any repairs,alterations or substitution of recommended parts made by the user to this equipment not approved by the manufacturer could voidthe user’s authority to operate the equipment in addition to the manufacturer’s warranty.This manual is published by Ericsson Inc., without any warranty. Improvements and changes to this manual necessitated by typographical errors, inaccuraciesof current information, or improvements to programs and/or equipment, may be made by Ericsson Inc., at any time and without notice. Such changes will be in-corporated into new editions of this manual. No part of this manual may be reproduced or transmitted in any form or by any means, electronic or mechanical, in-cluding photocopying and recording, for any purpose, without the express written permission of Ericsson Inc.AE/LZB 117 1875 R1A1Figure 1 - Control Point Timing Module Front PanelFigure 2 - Transmit Site Timing ModuleAE/LZB 117 1875 R1A 2CIRCUIT ANALYSISFunctional circuitry is primarily contained in a Xilinx 3190A FPGA(F ield P rogrammable G ate A rray) integrated circuit (U4). This circuitry is programmed differently for con-trol and transmit applications.The GPS Timing module has hot standby capability. Cir-cuitry outside the FPGA provides this capability as well as I/O interfaces and a P hase-L ock-L oop (PLL). The PLL is used at the transmit site.Xilinx 3190A FPGA U4 is wired in master serial mode, which determines how programming is accomplished (Figures 4 & 5). These figures are included for those familiar with Xilinx technology and are not described within this document.At power up, following the release of the Reset/reprogram push-button switch S1, or following automatic detection of a Xilinx fault, data PROM U1 is read serially into U4. A watchdog function is performed by 555 timer, U5 in the Activity Detector circuit. This timer causes a reprogramming if the 9600 Hz selected clock is not provided by U4 (automatic Xilinx fault detection).Crystal B1 provides a 4.9152 MHz clock used internally by the Xilinx logic.This board operates from a single +5 volt supply. An on-board thermister fuse (F1) prevents module failure from causing this shelf supply to collapse.Input signals arrive as RS-422 levels and are converted to TTL logic levels by RS-485 receivers U9, U11, and U14. Input fault lines connect directly to U4, as they arrive at TTL logic levels. The outputs driving the GPS ReSync modules (located in the same shelf) are buffered with tri-state line drivers U7, U13 and U15. The RS-422 level outputs are generated using RS-485 drivers U16-U20. The tri-state controls on all these drivers are used by the hot standby circuitry to turn the output to high impedance when the module is in hot standby. The circuitry attached to RC_IN and RC_OUT provides operational/hot-standby selection; these leads tie through the backplane to the companion module.PLL U3 provides a de-jitter filter with zero phase shift on the recovered landline 9600 clock. This PLL is used only at the transmit site.CONTROL POINTThe major functions performed at the Control Point areshown in Figure 3. The GPS signal selection block selects a9600 clock and 1 pps signal from either of the redundant GPSlocked clock sources. The Clock Generator block generates a19200 Hz clock for use by the other blocks. The 300 HzGenerator generates the 300 Hz required by the ReSync bydividing the selected 9600 Hz by 32. It also ensures that thephase of this 300 Hz is proper relative to the F rame S ync L ine(FSL) input. The Composite Reference Generator takes theselected 9600 Hz clock and inserts tags at the proper times tocreate reference signals that contain:•Composite Reference 1 contains 9600 Hz clock plustags for 300 Hz and pseudo FSL.•Composite Reference 2 contains 9600 Hz clock plustags for 1 pps.These Composite References are extracted at the transmit site.The 300 Hz generator and the Composite Reference Generatorare implemented as state machines.TRANSMIT SITEThe major functions performed at the transmit site are shownin Figure 4. There are similarities to the Control Point. The clockgenerator generates a 19,200 Hz clock for internal use; the GPSsignal selection block selects the 1 pps and 9600 Hz clock fromthe two redundant GPS locked clock sources. In addition it alsoprovides for selection of the landline 9600 Hz in the unlikelyevent that both GPS sources are failed. The Signal Recoveryblock is the corresponding function of the Composite ReferenceGenerator at the Control Point. It extracts the 9600, 300 1 ppsand pseudo FSL from the reference signals. The 9600 Hzlandline is routed off the Xilinx IC (U4) to be filtered by thePLL and returned for use by the T1 delay module. The T1 delaymodule examines the selected GPS signals (1 pps and 9600) andcompares their phase to the corresponding landline signals. Ifcertain “hysterisis hurdles” are exceeded the number of T1cycles of delay desired are serially sent to the Intraplex MUXwhere the actual delay is accomplished. This Delay Controlblock and Signal Recovery block are implemented with statemachines.SELECTORC L O C KTO CPTC(RS-422)9.6 DATA ANDCLOCK TO MUX(RS-422)TO MUX(RS-422)(RS-422)GPS BGPS A9.6Figure 3 - Functions at the Control Point (CPTM)AE/LZB 117 1875 R1A3GPS AGPS BTO RESYNC MODULESTO MUX F R O M G P SA L A R M Figure 4 - Functions at the Transmit Site (TXTM)1U U 00 H zS L *d r i v eS L *t e s to m p R e f 1o m p R e f 2Figure 5 - Xilinx 3190A FPGA at the Control PointAE/LZB 117 1875 R1A4TEST AND TROUBLESHOOTINGThe GPS Timing operates in two functionally different applications. Some of the functionally is the same for both applications and some is complementary to the other applica-tion. The module contains a PROM which holds the configu-ration information for the application.The functions to be tested are described previously for the control point and transmit site application.Signal on test connector P2:Control PointPin 1 - Composite Ref. 1Pin 2 - 1pps GPS Pin 3 - nc Pin 4 - FSL*Pin 5 - Selected 9600 (ReSync)Pin 6 - 300 outPin 7 - Composite Ref. 2Pin 8 - nc Transmit SitePin 1 - T1 Delay Data Pin 2 - 1pps GPS Pin 3 - 1pps landline Pin 4 - FSL*Pin 5 - Selected 9600 (ReSync)Pin 6 - 300 out Pin 7 - ncPin 8 - 9600 PLL * Pseudo FSL.To test as a Control Point module:The module must be powered up and supplied with GPS signals (9600 Hz, 1pps and an FSL). The presence of the “selected” signals at all the proper outputs and of the gener-ated signals (300, Comp Ref. 1 and Comp Ref. 2) must be verified. This is done for GPS “A” and “B”. The generated Comp Ref. 1 and Comp Ref. 2 need to be checked to verify the “tag” is placed consistently following the corresponding event.With no signals present, the MINOR alarm goes active;the green activity (ACTV ) LED goes out and the red MAJOR alarm LED comes on.To test the Transmit Site:It is desirable to have an operational module in the Control Point mode to provide the Comp Ref. 1 and Comp Ref. 2signals. Signal selection is checked similar to that done at the Control Point with the additional fault mode of reverting to landline 9600 if neither GPS source is present. A second GPS source allows a precise time difference between the landline 1pps and the “direct” 1pps to test the T1 delay portion of the module. A known time difference is programmed onto the local GPS and the T1 delay output is examined to verify that a new delay value is sent. As there is no MUX (& T1 delay module) the correction will successively add to itself.U TS 2S 01p p s L LS E L 300T 1_C L O C A S M _C L C O M P _R E F 1Figure 6 - Xilinx 3190A FPGA at the Transmit SiteAE/LZB 117 1875 R1A5*COMPONENTS ADDED, DELETED OR CHANGED BY PRODUCTION CHANGESDATACLKRESET/OE(OE/RESET)CE G N DC E OVppVccU1PROMRON 107 786 CPTM (XC1765D)RON 107 787 TXTM(XC1765D)U2DUAL D FLIP/FLOPRYT 306 2003/C (74HC74)á = Transition from low to high levelQ0 = The level of Q after the previous clock pulse* = Nonstable, don’t preset when PR and CLR are set highX = Any input, including transition18916U3PHASE-LOCK-LOOPRYT 306 6075/C (74HCT4046)CONNECTIONS PARTS LIST IC DATAAE/LZB 117 1875 R1A 6Positive Logic: Y=A • BPositive Logic: Y=A+B26U4XILINXRYT 139 003/5C(3190A)V DSCHTHRESCONTGNDTRIG OUTU5555 TIMER RYT 108 6003/CG N DVcc 4B 4A 4Y 3B 3A 3Y2Y 2B2A 1Y1B1A U6QUAD NAND GATERYT 306 2001/C (74HC00)G NDVcc C4A4Y4C3A3Y3Y2A2C2Y1A1C1U7, U13, U15TRI-STATE BUFFER RYT 3066029/C (74HC125)Vcc 4Y 4B 4A 3Y 3B 3AG N D 2B2A 2Y 1B 1A 1Y U8QUAD NORGATERYT 306 2006/C (74HC020)IC DATAAE/LZB 117 1875 R1A7VccB4A4R 04E N 34R 03A3B3G N D B2A2R 02E N 12R 01A1B1U9, U11, U14RS-485 QUAD RECEIVER RYT 109 6079/2C (LTC489)Vcc DI 4DOA 4D O B 4E\DOB 3DOA 3DI 3G N DDI 2DOA 2DOB 2E DOB 1DOA 1DI 1U16 - U20RS-485 QUAD DRIVERRYT 109 6078/1C (LTC486)E EDOA1DOB1DOA2DOB2DOA3DOB3DOA4DOB4CONNECTIONSH: High Level L: Low Level X: Irrelevant Z:HighImpedance (Off)FUNCTION TABLEIC DATAAE/LZB 117 1875 R1A8OUTLINE DIAGRAM AE/LZB 117 1875 R1AOUTLINE DIAGRAM(1078 ROA 117 2260, Rev. B)9AE/LZB 117 1875 R1ASCHEMATIC DIAGRAMSCHEMATIC DIAGRAM(1911 ROA 117 2260, Sh. 1, Rev. B)SCHEMATIC DIAGRAM AE/LZB 117 1875 R1ASCHEMATIC DIAGRAM(1911 ROA 117 2260, Sh. 2, Rev. B)AE/LZB 117 1875 R1ASCHEMATIC DIAGRAMSCHEMATIC DIAGRAM(1911 ROA 117 2260, Sh. 3, Rev. B)AE/LZB 117 1875 R1A This page left blank intentionally。
基于相关系数的海底大地电磁阻抗Robust估算方法
关键词
相关归一 &’()*+ 阻抗估算
海底大地电磁
模拟 收稿日期 1##" / #3 / 1$, 1##1 / #3 / 1#收修定稿
文章编号 ###" / .0%% (1##%) #1 / #1!" / #.
中图分类号 20%$
!’()*+ ,*+-./+-’0 .,+1’2 ’3 *,/ ./40,+’+,55)!-6 -.7,2/06, (/*,2 ’0 6’!!,5/+-8, 6’,33-6-,0+
基于相关系数的海底大地电磁阻抗 !"#$%& 估算方法
柳建新 严家斌 何继善 刘春明
!"##$% 中南大学信息物理工程学院, 长沙
摘
要
对于海洋的特殊环境, 常规的阻抗估算方法往往不能很好地估算海底大地电磁的阻抗张量, 本文提出了
基于相关归一 &’()*+ 方法 , 以相关系数为参数对阻抗张量元素进行归一, 据相关系数值的变化修正 &’()*+ 的权系 数 , 模拟和实测数据的计算表明, 相关归一 &’()*+ 法比其他常规方法更能有效地抑制干扰 , 噪声强度小于 %#- 时 常规方法和新方法都能有效地估算阻抗张量; 噪声强度大于 .#-该方法有较强抗干扰的能力 ,
,
数值模拟
为了验证相关归一法的正确性及先进性, 进行
图! 567- !
利用最小二乘法、 常规 %&’()* 和相关归一 %&’()* ( 4)及噪声为 "#2 的时间序列 ( ’) 的计算结果对比图 8&094:6)&1 &; :<)(=*) ;&: :<)6)*6>6*? ’? *:4@6*6&14= AB, *:4@6*6&14= %&’()*, 1&:04=6/4*6C4= %&’()* ( 4)41@ *60< )<:64=( ’) ( ’ )1 E ! F G) 0<*D&@
HECRAS中文使用手册

_Develop computerapplications for thehydraulics, hydrology,groundwater, and
environmentalengineering areas
研发了用于水力学,水文学,地下水和环境工程学区域的电脑软件
_Don’t be afraid to get off the beaten path不要担心不符合惯例
_Basic tutorial sessions (HEC-RAS tutorials)
基础指南部分(港口进入管制-随机存取存储器指南)
_Advanced tutorial sessions先进的指南部分
模拟带有内河堰和泄ຫໍສະໝຸດ 口的洪水控制建筑物_Models levees and overtopping levees模拟防洪堤和高防洪堤
_Models storage areas (ponds)模拟储存地区(池塘)
_Models multiple river networks and looped networks
1
Technical Support技术支持
_
_On-line forums网上论坛
_E-mailing lists邮件
_Email
_Telephone608-258-9910电话608-258-9910
_Fax 608-258-9943传真608-258-9943
On-Line Forums网上论坛
_Learn how to review analysis results学会回顾分析结果
_Learn advanced modeling techniques学会先进的建模技术
GPRMAX2D知识点汇总

GprMax是爱丁堡大学的Antonis Giannopoulos于1996年推出来的一种基于时域有限差分(FDTD)算法和理想匹配层(PML)边界吸收条件的探地雷达正演数值模拟软件,用于探地雷达成像研究。
其中,GprMax2D是二维正演,GprMax3D为三维正演。
该软件可以在Windows、Linux和MacOS三个平台上使用。
本文主要针对Windows平台进行说明。
一、软件获得该软件为免费软件,可以去GprMax官网下载。
也可点此直接下载。
二、准备工作软件无需安装,下载后用解压工具解压,找到Windows文件夹,直接双击GprMax2D.exe 即可运行。
但是为了方便批量模拟,建议把Windows文件夹下的文件(cygwin1.dll、GprMax2D.exe 和GprMax3D.exe)全部复制到系统盘系统搜索路径下,例如:C:\Windows。
如果只进行二维正演,只复制cygwin1.dll和GprMax2D.exe即可。
当然也可放在任意路径下,只要使用时包含所在路径就OK了。
笔者习惯放在系统要目录下,即C:\。
另外,最好建立一个输入文件和模拟结果存放的专用文件夹,并且把tools文件夹下的文件(gprmax.m、gprmax2g.m、gprmax3g.m、gprmaxde.m和gprmaxso.m)全部复制到该专用文件夹下,注意文件夹名最好使用英文。
如果只进行二维正演,只复制gprmax.m和gprmax2g.m即可。
笔者习惯使用D:\GPR。
正演结果需要用MA TLAB进行绘图,因此需要安装有MA TLAB软件。
软件下载地址和安装方法此处不再说明,以后使用将假设读者已经成功安装MA TLAB软件。
三、软件使用一般进行数值模拟时通常都是若干个对比模型进行模拟,因此本文只介绍批量模拟的方法。
如此一来,笔者将认为读者的软件和笔者一样放在C:\,输入文件和gprmax.m、gprmax2g.m文件已经放在D:\GPR。
基于深度自编码网络的舰船辐射噪声分类识别
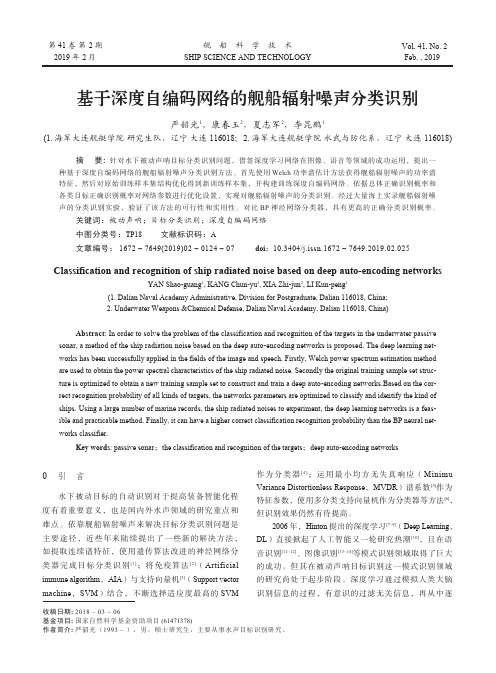
基于深度自编码网络的舰船辐射噪声分类识别严韶光1,康春玉2,夏志军2,李昆鹏1(1. 海军大连舰艇学院研究生队,辽宁大连 116018;2. 海军大连舰艇学院水武与防化系,辽宁大连 116018)摘要: 针对水下被动声呐目标分类识别问题,借签深度学习网络在图像、语音等领域的成功运用,提出一种基于深度自编码网络的舰船辐射噪声分类识别方法。
首先使用Welch功率谱估计方法获得舰船辐射噪声的功率谱特征,然后对原始训练样本集结构优化得到新训练样本集,并构建训练深度自编码网络。
依据总体正确识别概率和各类目标正确识别概率对网络参数进行优化设置,实现对舰船辐射噪声的分类识别。
经过大量海上实录舰船辐射噪声的分类识别实验,验证了该方法的可行性和实用性。
对比BP神经网络分类器,具有更高的正确分类识别概率。
关键词:被动声呐;目标分类识别;深度自编码网络中图分类号:TP18 文献标识码:A文章编号: 1672 – 7649(2019)02 – 0124 – 07 doi:10.3404/j.issn.1672 – 7649.2019.02.025Classification and recognition of ship radiated noise based on deep auto-encoding networksYAN Shao-guang1, KANG Chun-yu2, XIA Zhi-jun2, LI Kun-peng1(1. Dalian Naval Academy Administrative, Division for Postgraduate, Dalian 116018, China;2. Underwater Weapons &Chemical Defense, Dalian Naval Academy, Dalian 116018, China)Abstract: In order to solve the problem of the classification and recognition of the targets in the underwater passive sonar, a method of the ship radiation noise based on the deep auto-encoding networks is proposed. The deep learning net-works has been successfully applied in the fields of the image and speech. Firstly, Welch power spectrum estimation method are used to obtain the power spectral characteristics of the ship radiated noise. Secondly the original training sample set struc-ture is optimized to obtain a new training sample set to construct and train a deep auto-encoding networks.Based on the cor-rect recognition probability of all kinds of targets, the networks parameters are optimized to classify and identify the kind of ships. Using a large number of marine records, the ship radiated noises to experiment, the deep learning networks is a feas-ible and practicable method. Finally, it can have a higher correct classification recognition probability than the BP neural net-works classifier.Key words: passive sonar;the classification and recognition of the targets;deep auto-encoding networks0 引 言水下被动目标的自动识别对于提高装备智能化程度有着重要意义,也是国内外水声领域的研究重点和难点。
纽约州立大学石溪分校陈或博士来所交流

陈或 博 士在 报告 中 , 首先介绍 了深 震 的概念 和研 究意 义 ,分析 了 3种可 能存 在 的形成 机 制 ,概括 传 统地 震 学研 究深震 的主 要方 法及 其蜀 限性 ,进 而 给 m 了 种新 的 多源反演 方法 。 他 通过 把…‘ 个 大地震 分 为若干 个 小地 震 , 对地 震 豇达 P波 和近 地表 反射 p P波 进行 反 演 ,研 究 了地 震 的破裂 过 程 。利 用全 球 2 6个 7 级 以 深震 进行 多源 反演 的结 果 示 ,多数 的深 大 地震 并 只在 …’ 个 丽… } _ I 破裂 ,而 是 由 同震级 的子地 震组 成 。陈博 士认 为这 些地 震
可以用一个统一的物理机制来解释 源自印热失稳效应导致在已经存在的薄弱带上发生地震 ,
这些 地 震产 生 的应 力可 以触 发其他 区域 的热 火稳 效应 ,并形成 阶 梯型破 裂 ,该 机制 能够 比
较好地解释前人关于深震的一些研 究结果 。报告之后,陈或博士耐心地回答了现场提问,
并与 我所 的科研 人 员进 行 了热烈 的交 流 。
州地 球 化学研 究 所获得 构 造地 质学 硕 士学位 ,之 后赴 美在 纽约 州立 大学 ( 石 溪分 校 )攻读 地球 物 理学媾 士 学位 ,2 0 l 5 年 顺利 通过 博士 论文 答辩 。陈或 博士 主要 从事 f : 地 幔地 震速 度 结 构 与深源地 震 破裂 过程 的反 演研 究 , 已存 《 E P s L 》和 《 J GR 》 等世 界 一 流 的地 球 科学 刊
随后 ,陈或 博 士在 王成 虎研 究 员、许俊 闪副研 究 员等人 的 陪 同下 ,参 观 r我 所地 壳应 力研 究室 ,并 与青 年科研 人员针对 共 同感 兴趣 的学 术 问题开 展 了进 ‘ 步 讨论 。
地波雷达海况探测原理

武漢大學地波雷達海洋探測技術發展
Development of HFSWR Techniques in Wuhan University
大陸地波雷達在海洋監測中的應用
Application of HFSWR in Ocean Environment Monitoring in the Mainland of China
海面對入射的電磁波產生 後向散射(backscattering) 產生後向散射的海浪相速 度是固定的(fixed phase velocity),且要么接近雷達 (approaching),要么遠離 雷達(receding) 運動的物體會對入射的電 磁波產生 波產 Doppler pp Effect, 海浪也不例外
武漢大學空間物理系具備較強的設備研製能力 1987年開始HFSWR研究 跟蹤CODAR技術 技術,1993年完成國內第 年完成國內第一臺海態探測 臺海態探測 分析雷達(OSMAR-Ocean State Monitoring & Analyzing Radar),在廣西北海實現海流初步探測 1997年開始承擔大陸國家高科技發展計劃863重大課 題研究,與2000年研製出探測距離為200km的 HFSWR 掌握了HFSWR海洋探测全部软、硬件技术。 其後研發了系列HFSWR產品
OSMAR2000
天线 1 Antenna 1
TR1 TP
体结构示意图
天线 4 Antenna 4
TR4
天线 2 Antenna 2
TR2
天线 3 Antenna 3
TR3
天线 5 Antenna 5
TR5
天线 6 Antenna 6
TR6
天线 7 Antenna 7
arcGIS第二次作业

完成第五章和第六章的挑战性作业,写出详细步骤第5章,挑战性作业Emidalact是一个USGS DEM,其坐标投影系统为UTM。
而idtm.shp则是基于爱达荷横轴墨卡托(IDTM)坐标系统。
要求将emidata投影到IDTM坐标系统,并要求你获取有关emidalact的图层信息1.使用ArcCatalog中的Metadata栏,读取关于emidalat和idtm.shp的空间参照信息,包括大地基准(datum)。
1)首先选中emidalat.shp,并在右边的Metadata栏,选择Spatial,可见其空间参照信息为:Horizontal coordinate systemProjected coordinate system name: NAD_1927_UTM_Zone_11NGeographic coordinate system name: GCS_North_American_1927 大地基准为:Horizontal Datum Name: North American Datum of 19272)再选择idtm.shp,在右边的Metadata栏中选择Spatial,可见其空间参数为:Horizontal coordinate systemProjected coordinate system name: idtmGeographic coordinate system name: GCS_North_American_1983 大地基准为:Horizontal Datum Name: North American Datum of 19832.在Data Management Tools/ Projections 和Transformations/ Raster工具集中使用Project Raster工具,将emidalat投影到IDTM坐标系统中。
使用默认的重采样方法,并将像元大小设置为30m。
- 1、下载文档前请自行甄别文档内容的完整性,平台不提供额外的编辑、内容补充、找答案等附加服务。
- 2、"仅部分预览"的文档,不可在线预览部分如存在完整性等问题,可反馈申请退款(可完整预览的文档不适用该条件!)。
- 3、如文档侵犯您的权益,请联系客服反馈,我们会尽快为您处理(人工客服工作时间:9:00-18:30)。
陆表陆表--大气能量与物质交换的遥感原理与应用贾立研究员jiali@20122012年年1111月月0909日日中国科学院遥感应用研究所博士生遥感系列课程陆表陆表--大气能量与物质交换的遥感原理与应用贾立研究员jiali@20122012年年1111月月0909日日第二第二章章地表辐射收支及地表辐射通量的遥感参数表辐射收支及地表辐射通量的遥感参数化化陆表--大气能量与物质交换的遥感原理与应用陆表第二章:地表辐射收支及地表辐射通量的遥感参数化2.1 地表辐射平衡2.2 地表太阳短波辐射2.3 地表反射短波辐射2.4 大气下行热辐射2.5 地表发射热辐射2.6 植被冠层中的辐射过程太阳辐射是大气运动的驱动因子太阳辐射是大气运动的驱动因子,,辐射过程是地辐射过程是地--气系统中能量交换的主要形式太阳辐射太阳辐射((也称短波辐射也称短波辐射)):是指太阳所发射的能量到达地球-大气系统的部分。
97%的能量在0.3-3微米波段内,辐射最强的波长在0.5微米附近。
太阳辐射分配太阳辐射分配:•被大气吸收•被大气反射•透过大气到达地表面•被地球表面反射长波辐射长波辐射:是地球表面地球表面地球表面及大气大气发射发射的红外辐射。
绝大部分能量在4-80微米波段内,辐射最强波长在10微米附近2.1 地表辐射平衡太阳辐射是大气运动的驱动因子太阳辐射是大气运动的驱动因子,,辐射过程是地辐射过程是地--气系统中能量交换的主要形式到达地表的太阳辐射被地表反射的太阳辐射地表发射的红外辐射2.2 到达地表的太阳短波辐射Rsi到达地表水平面上的太阳辐射有2种方式:•太阳直接辐射(direct solar radiation :Rsi_dr)•散射辐射(diffuse radiation :Rsi_df )直接辐射散射辐射Rsi = Rsi_dr + Rsi_df (W m Ĉ2)地表接收的太阳直接辐射Rsi_dr :太阳辐射进入地球大气之后,不同气体分子及大气气溶胶粒子会吸收和散射太阳辐射,使得到达地表的太阳直接辐射被衰减,衰减程度可由衰减系数、或者大气透过率、或者大气浑浊度来描述地表接收的散射辐射Rsi_df :太阳辐射进入大气后,一部分辐射能被分子散射到达地表。
分一次和多次散射。
2.2 到达地表的太阳短波辐到达地表的太阳短波辐射射Rsi直接辐射地表接收的地表接收的太阳直接辐射太阳直接辐射Rsi_dr :太阳辐射进入地球大气之后,不同气体分子及大气气溶胶粒子会吸收和散射太阳辐射,使得到达地表的太阳直接辐射被衰减,衰减程度可由衰减系数、或者大气透过率、或者大气浑浊度来描述气体分子气溶胶臭氧水汽O 2,CO 2等衰减系数在大气路径上积分得到大气光学厚度大气光学厚度((这里为单色光学厚度这里为单色光学厚度))(δλ=∫ k λdl ):δλ= δλ,R + δλ,a + δλ,O3+ δλ,w + δλ,xλ表示单色光学厚度(分光光学厚度)根据Beer 定律(辐射能随着光学质量的加大呈指数衰减),地表太阳直接辐射地表太阳直接辐射地表太阳直接辐射与大大气上界水平面上的太阳辐射(R0λ表示在波长λ处的大气上界水平面上分光辐射)之间的关系为:Rsi_dr λ= R0λ* exp (-δλ) = R0λ* exp (δλ,R + δλ,a + δλ,O3+ δλ,w + δλ,x )这些吸收和散射过程相互独立,大气总的衰减为他们的和,用k k λ表示总的衰减系数(这里为单色这里为单色衰减系数衰减系数衰减系数)):k λ=k λ,R + k λ,a + k λ,O3+ k λ,w + k λ,x + …直接辐射引入大气透过率大气透过率((这里为单色透过率这里为单色透过率)):τλ= exp (-δλ)Rsi_dr λ= R0λ* τλ= R0λ* (τλ,R τλ,a τλ,O3τλ,w τλ,x )宽波段大气透过率:τ= exp (-δ)宽波段辐射通量:Rsi_dr = R0 * τ= R0* (τ,R τ,a τ,O3τ,w τ,x )R0大气上界水平面上的宽波段太阳辐射根据Beer 定律(辐射能随着光学质量的加大呈指数衰减),地表太阳直接辐射地表太阳直接辐射地表太阳直接辐射与大大气上界水平面上的太阳辐射(R0λ表示在波长λ处的大气上界水平面上分光辐射)之间的关系为:Rsi_dr λ= R0λ* exp (-δλ) = R0λ* exp (δλ,R + δλ,a + δλ,O3+ δλ,w + δλ,x )2.2 到达地表的太阳短波辐到达地表的太阳短波辐射射Rsi直接辐射大气中中水分的吸收光谱吸收大气对太阳辐射吸收及大气透过率吸收太阳辐射的物质主要是O2,O3, 及水汽,且随波长变化:水汽吸收:水汽是吸收太阳能的主要成分。
吸收光谱覆盖大,主要在红外区。
O2吸收:在< 0.25µm 的紫外区,吸收作用强O3吸收:CO2: 在> 2µm的红外区气溶胶散射:随气溶胶粒子的大小遵循米散射或者分子散射(粒子半径越小越趋紧分子散射)。
2.2 到达地表的太阳短波辐到达地表的太阳短波辐射射Rsi直接辐射大气中中水分的吸收光谱吸收大气光学厚度计算的简化模式氧气和二氧化碳CO 2:均匀混合气体,知道地面气压即可计算其光学厚度水汽和臭氧:时空分布不均一,需要知道他们在大气中的含量。
小结小结:利用遥感观测估算到达地表的太阳辐射的关键是计算各种成分的光学厚度,进而计算总的光学厚度(或透过率transmittance)。
有云覆盖时透过率的计算尤其困难。
2.2 到达地表的太阳短波辐到达地表的太阳短波辐射射Rsi直接辐射太阳直接辐射与太阳入射角的关系大气上界水平面上的水平面上的水平面上的太阳辐射(R0) = So AB/AC = So sin (SA)地表水平面上的水平面上的水平面上的太阳直接辐射Rsi_dr = 大气上界水平面上的水平面上的水平面上的太阳辐射(R0)* 大气透过率τsin (SA) = sin φsin δ+cos φcos δcos ωφ:地理纬度δ :太阳赤纬ω :时角SA = 太阳高度角Rsi’太阳高度角SASo Roτsw大气上界水平面地表水平面太阳直接太阳直接((平行平行))辐射大气上界水平面上的水平面上的水平面上的太阳辐射ACB太阳高度角SASo R02.2 到达地表的太阳短波辐到达地表的太阳短波辐射射Rsi直接辐射太阳直接辐射与地形的关系地形影响地形影响::到达表面的太阳辐射受局地坡度、坡向的影响只有投影到地形表面上的辐射才会被地表获取到,地形表面与太阳辐射来向的相对角度决定了地表获取太阳辐射的大小。
利用DEM 数据(坡向和坡度)可以计算太阳辐射平行直线与真实地表表面的相对角度。
RsiRsiRsiRsi太阳高度角SASoRoτ大气上界水平面地表水平面太阳直接太阳直接((平行平行))辐射大气上界水平面上的水平面上的水平面上的太阳辐射真实地表太阳直接太阳直接((平行平行))辐射2.2 到达地表的太阳短波辐到达地表的太阳短波辐射射Rsi)青藏高原)(青藏高原2.3 地表反射短波辐射Rso地表反射的太阳辐射量Rso 由地表反照率alebdo 决定:Rso = (1-albedo )Rsi各种地表平各种地表平均均反照率(0 –100% 100% 之间之间之间):):水面阔叶林草地/沼泽水田灌木田野草原沙漠冰雪6-8 138 13--15 1015 10--18 1218 12--18 1618 16--18 1518 15--20 2020 20--25 2525 25--35 >50地表反射的太阳辐射量Rso 由地表反照率alebdo 决定:Rso =(1-albedo)Rsi这里的地表反照率alebdo是指全波段半全波段半球反照率地表为朗伯体时,反照率与入射和出射无关真实地表为非朗伯体(受土壤属性、植被类型、地形以及这些因素在传感器视域中贡献大小等因素影响),反射率值与入射和出射有关,称为二向性反照率。
实际卫星观测是在一定通道(波长)、一定入射和反射角获得的,需通过一定的反演方法获得与实际地表反照率接近的值,即全波段半球反照率。
二向反射半球积分2.3 地表反射短波辐射Rso2.5 地表发射热辐射Rlo地表地表向向上长波辐射Rlo地表发射得长波辐射通量密度= εg σT g 4εg : 地表比辐射率T g :地表温度(K )地表向上长波辐射通量密度Rlo= 地面发射长波辐射+ 地面反射大气热辐射= 地面发射长波辐射+ (1-εg )X 到达地表的大气长波辐射Rli地表比辐射率εg :是地表结构是地表结构、、组分比辐射率及观测方位角等的函数地表温度及地表比辐射率地表温度及地表比辐射率((即地表发射率即地表发射率))是计算地表发射长波辐射的关键2.6 植被冠层中的辐射过程叶片辐射平衡2.6 植被冠层中的辐射过程叶片叶片光光谱响应函数2.6 植被冠层中的辐射过程:观测事实层中元素的辐射相互作用:冠层中元素的辐射相互作用观测:指数递减模拟:Beer定律2.6 植被冠层中的辐射过程:观测事实冠层中元素的辐射相互作用层中元素的辐射相互作用:2.6 植被冠层中的辐射过程叶片的辐射通量截取冠层中层中叶bandzenith天顶角θsector2.6 植被冠层中的辐射过程叶片的辐射通量截取冠层中层中叶2.6 植被冠层中的辐射过程冠层中层中叶叶片形状因子2.6 植被冠层中的辐射过程冠层中层中叶叶片形状因子2.6 植被冠层中的辐射过程冠层中辐射通量的分布2.6 植被冠层中的辐射过程冠层辐射传输模型简化的几何光学模型Note:-Canopy is represented by a solid regular rectangular shape -Only single reflection is taken into account-Do not account for temperature gradient and radiative HDWModel’s InputGeometrical parameters: H , L, and D Component temperatures:sunlit/shadow soils and foliages Component emissivitiesDownwelling atmospheric radiance Illumination and observation angles: Model’s OutputDirectional surface temperature at BOA2.6 植被冠层中的辐射过程冠层辐射传输模型混合介质模型To describe statistically the system using biome characteristics.Model is applied to horizontally homogeneous canopyModels availableSAIL extension to TIR (Qiang LIU 2001; Verhoef & Jiaet al 2007)-Ts, Tf and T(z) within the canopy are knownCUPID-1D: comprehensive soil-plant-atmospheremodel.-Ts, Tf and T(z) within the canopy arecalculated on basis of the energy balance-more input parameters2.6 植被冠层中的辐射过程冠层辐射传输模型To describe statistically the system using biome characteristics.Model is applied to heterogeneous canopyExisting Models in the literatureTDART (Thermal Discrete Anisotropic Radiative Transfer (P. Guillevic 1999)) (not available in LSIIT)SHDOM (Spherical Harmonic Discrete Ordinate Method for 3 D radiative transfer (K.F. Evans 1998))Extinction, single scattering albedo, Legendre coefficients of the scattering phase function, and temperature have to be specified at each input grid points Bare soilRow cropsforestDense canopyCUPID in 3 D: Extension of CUPID 1D to 3D(JIA, 2004)三位辐射传输模型谢谢!。