MobilePerformanceVelocity2011_DavidWei
低压驱动Ⅴ形直线超声电机的设计

第29卷第1期2021年1月Vol.29No.1Jan.2021光学精密工程Optics and Precision Engineering低压驱动V形直线超声电机的设计黄卫清,杨成龙,沈兆琛,薛昊东,安大伟*(广州大学机械与电气工程学院,广东广州510006)摘要:针对传统V形直线超声电机驱动电压较大、驱动电路复杂,在配合变压器驱动时不利于结构微型化的问题,提出了一种利用叠层压电陶瓷驱动的低压V形直线超声电机。
在对V形直线超声电机的运行机理进行理论分析的基础上,设计了基于叠层压电陶瓷的V形振子并进行了夹持装置的结构设计,进一步制作样机并开展了阻抗实验,测试了样机的外输出特性。
实验结果表明:电机的驱动频率位于36~38kHz,在37kHz,50Vpp的驱动电压激励下,其最大输出力为25.8N,最高空载速度为1.221m/s,可在低压驱动下输出大推力,直线超声电机的驱动性能得到了提高。
关键词:超声电机;直线电机;V形结构;低压驱动;振子设计中图分类号:TM359.4文献标识码:A doi:10.37188/OPE.20212901.0091Design of V-shaped linear ultrasonic motor driven with low-voltage HUANG Wei-qing,YANG Cheng-long,SHEN Zhao-chen,XUE Hao-dong,AN Da-wei*(School of Mechanical and Electrical Engineering,Guangzhou University,Guangzhou510006,China)*Corresponding author,E-mail:andavy@Abstract:To solve the problem of the high driving voltage of traditional V-shaped linear ultrasonic mo⁃tors,which results in a complex driving circuit and the disadvantage of structure miniaturization when matching with transformer driving,a low voltage driving V-shaped linear ultrasonic motor based on lami⁃nated piezoelectric ceramics was proposed.Based on the analysis of the working principle of the V-shaped linear ultrasonic motor,a V-shaped oscillator with laminated piezoelectric ceramics and a clamping device were designed.Finally,a prototype of the motor was fabricated,and the impedance and performance were measured.The experimental results show that the operating frequency of the motor is between36and38 kHz while under a driving voltage of50Vpp and37kHz,the maximum output force of the motor reaches 25.8N,and the maximum no-load velocity reaches1.221m/s.Key words:ultrasonic motor;linear motor;V-shaped structure;low voltage drive;vibrator design1引言压电直线电机具有定位和速度控制精度高、结构设计灵活,易实现装置的小型化和轻量化等特点,广泛应用于精密驱动等相关领域[1-3]。
宝马V10发动机

2011年08月15日 02:00 来源:汽车之家类型:原创编辑:冯景毅[技术设计技术讲堂]在汽车工业一百多年的历史长河中,有诸多经典的设计被人们津津乐道,而发动机作为一个具有很高技术含量和科技水平的工业产品在一定程度上反映了一个厂商,甚至一个国家的工业技术水平,同时也代表了一款车的实力。
今天起我们将开启一个新的系列文章,全面回顾和剖析历史上的经典发动机,带您去了解每款发动机的设计亮点以及隐藏在其背后的技术秘密。
BMW的M系列车型可以说是BMW汽车设计理念的极至体现,每一款M车在驾驶乐趣方面都毫不妥协,然而专门为M系车型开发的发动机更是展现了BMW的技术实力,而且深深吸引着众多性能狂热者。
而专为M系车型开发和调教,且曾经搭载于M5和M6上代号为S85B50A 的V10发动机则堪称经典。
因为它是迄今为止,BMW唯一量产的V10发动机,其整体结构和电控系统都源自F1赛车的设计,同时最高转速超过了8000rpm。
所以说很大程度上,它的面世在发动机工业具有里程碑式的意义。
虽然它已经被动力性更为出色的双涡轮增压发动机所取代,但是不可否认这款发动机上众多的设计亮点和很高的科技含量,接下来我就全面剖析一下这款史无前例的经典发动机。
『被公认为当时F1赛场中的动力之王——BMW P84』在上个世纪90年代中后期,F1进入了V10发动机的时代,这种形式的发动机无论在升功率、扭矩,还是在功率重量比、平顺性上,可以说都达到了内燃发动机的最高技术水准。
作为发动机供应商,BMW凭借自身强大的技术实力打造的P84,被公认为是当时赛场中的动力之王,而搭载于M系上的这台V10发动机的很多设计恰好也源于此。
『S85 V10发动机』S85发动机采用了V型90度夹角的设计,这对抑制发动机的振动以及在发动机运转的平顺性上都能取得很好的效果。
在如何提高发动机的动力性上,BMW的工程师选择了提高发动机转速的解决方案,因此这款发动机的最高转速达到了令人痴狂的8250rpm,虽然相比普通发动机只多出了2000转左右的最高转速,但就是增加的这2000转转速会对发动机的正常运转产生一系列不良的影响。
HYPERLINK

电子发烧友网> 测量仪表 > 虚拟仪器 > 正文虚拟仪器技术在汽车上的应用来源:本站整理作者:秩名2012年03月29日 11:28分享[导读]测试仪器作为科学技术发展中必不可少的组成部分,对科学水平的提高和发展起到了很大的推动作用。
随着科学技术的发展,特别是电子技术水平的不断提高,极大地推动了测试技术的关键词:液力变矩器虚拟仪器1 引言测试仪器作为科学技术发展中必不可少的组成部分,对科学水平的提高和发展起到了很大的推动作用。
随着科学技术的发展,特别是电子技术水平的不断提高,极大地推动了测试技术的进步。
在这种背景下,八十年代末美国研制成功虚拟仪器(VisualInstruments,简称VI)。
在国外,虚拟仪器技术在汽车和发动机行业得到了蓬勃发展。
国外的很多大学特别是一些企业已经开发出了很多相关产品,如 SanDiego State University(美国圣地亚哥大学)开发出了用于混合动力汽车燃油消耗和排放的模拟和优化系统。
在国内,虚拟仪器技术对很多人来说还比较陌生,还没有得到大面积的普及,但现在逐渐有很多公司和高校开始把虚拟技术运用到生产和科研中。
国内有些大学已经把虚拟仪器技术,特别是LabVIEW和科研试验接合起来,在发动机试验监控、发动机振动的分析、汽油发动机综合测试等方面取得了一定的成果。
2 虚拟仪器技术所谓虚拟仪器就是利用现有的计算机,加上特殊设计的仪器硬件和专用软件,形成既有普通仪器的基本功能,又有一般仪器所没有的具有特殊功能的高档低价的新型仪器。
虚拟仪器代替了传统仪器,改变了传统仪器的使用方式,提高了仪器的功能和使用效率,大幅度地降低了仪器的价格。
用户可使用相同的硬件系统,通过不同的软件编程就可以充分发挥自己的才能、想象力,按自己的意愿随心所欲地设计自己的仪器系统,实现功能完全不同的各种测量。
可见,软件系统是虚拟仪器的核心,软件可以定义各种仪器,因此可以说“软件就是仪器”。
英菲尼迪.新M系_试车报告篇

操控高手海外试驾2011款英菲尼迪M系列2009年12月08日 01:00 来源:汽车之家类型:编译编辑:胡正暘[汽车之家编译] 紧随雷克萨斯新GS和奔驰第八代E级的上市,英菲尼迪已经为旗下2011款M 系列——也是第三代M产品——的发布做好了准备,据称这款轿车将能与前面两位对手媲美,至少也是势均力敌。
和GS一样,新M系列有V6、V8以及V6混合动力版三种动力系统可选择,很精准的对应了奔驰的V6、V8和即将到来的BlueTEC柴油发动机。
新M系列比老款更长更宽,外观更时尚,娇柔线条的钣金配合更大的车轮,整体感觉就像一辆大一号的G级。
在发动机盖下面,M37配备的是一台327马力3.7升V6发动机,峰值扭矩364牛米,而M56搭载的是420马力5.6升V8发动机,峰值扭矩542牛米,当然你也可以选择混合动力版本,它安装了锂离子电池组以及一台3.5升V6发动机。
英菲尼迪表示混合动力版本将在2011年以2012款的名义发布,它将是公司历史上最清洁最省油的产品。
M37和M56都将标配七速自动变速箱,用户还可以选装运动套件,包括四驱系统、20英寸轮毂、双活塞减震、四轮主动转向、四活塞制动卡钳、换挡拨片,以及运动风格的座椅、方向盘、排挡杆。
在高档车之间的竞争中,科学技术是关键,新的M系列不会让你失望。
驾驶模式包含标准、经济、运动、雪地四种选择,全球首创的盲点干预系统能在车辆偏离行驶车道时对转向系统进行干预,将车辆以稳定的姿态拉回车道,有效防止了因为偏离车道而引起的意外情况,另外这套系统还能实现车辆安全间距控制以及高速巡航的智能化。
车内的乘客还能享受到湿度调节功能,而补风系统能最大程度模拟自然风的感觉,空气过滤系统还能自动检测室内空气的灰尘量以及监控空气新鲜程度。
我们最近拿到了M37四驱版和M56 S版的样车,发现上一代的V6机敏迅速,而现款V8的动力似乎下降了,而且少了一些个性。
英菲尼迪表示他们仍然在继续开发燃油直喷系统,并且坚信M56在2010年春天上市时,它的发动机能在隆隆声响下输出至少420马力功率,考虑到2010款M45的4.5升V8发动机“只有”325马力功率,那么2011款95马力的飞跃确实会是非常惊人的表现,我们试目以待。
无所不能 福特2011款Super Duty

气 更何 效率,意味精 驾蛳 有 疆障 雠 啪 吐 油 ]日 即 甩 更 可使用 B0生 质柴 油怍为燃 { 此发 动机 采用 C ! 2 k G 铸铁 艟 l时打造 缸体.其结构 强度 与耐 度优于 传统普 通铸 铁材 质,重量 也更 轻。这款 发动 机经 过 原厂的 耐I 度测 试, { j 在 正常 臃 的状况 摹少研 I 2 _英 里不会故 障。 驶 5 丘 最后 委说 黾 逮—款采 用手排 系 以及 P w [ tk q 统 o e s ̄ e 柴油 发功 机的新 车弛可 能耍比 采用 自 挡的同 娄车型 俚蝴 动 E5 O 金 O 姜 1 这样 的战本 节约是所 有 赞 者都 无法忽 命 天. u P t的 低 染 糊 或 s简 u 7
孔尺, , 育肝减叽 车门 . 新增了 一个 Pw r t ̄ o e r e的特 涡 轮桃 油 机.透过 业再 酋创的 火 / 腿 轮增压 系 So 柴 猫 小
别 L g ,D ' 款 S l; I 系刑的挂 犬亮席 膈内的 oo J , Os  ̄ te DJ i 铁 . 术棚 贾 } 仿 回l 控向上. 体风格 依然 充满羹 整 国式碰 坐在其 居商 临 E 感受 ‘ 不 , } , 崖
Sp e 主要 由货斗 型皮 k(-5 、 5 、 I5) ue D 12o F30 F4 0
以 醴底 盘拖 头 (-5 - 5、F S ) F30 F4 0 - O 组成 两款 新型 超 S
经 拉 机}} 供货单 中 : 动 ± 现在 一台是 的 6 v 柴油 涡轮 增 7 8 匿 动机 另一台是 6 £ 2升 v 发 动札 它也自 日 {. 8 75 8 酒精 ,
深圳代维考试模拟题1(答案)
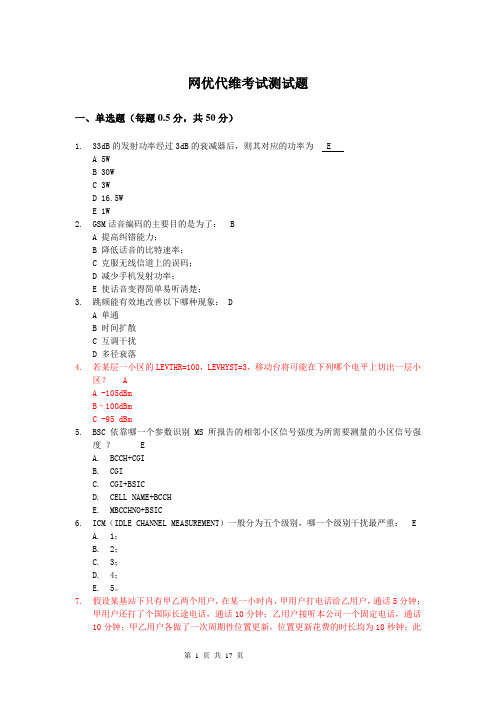
网优代维考试测试题一、单选题(每题0.5分,共50分)1.33dB的发射功率经过3dB的衰减器后,则其对应的功率为 EA 5WB 30WC 3WD 16.5WE 1W2.GSM话音编码的主要目的是为了: BA 提高纠错能力;B 降低话音的比特速率;C 克服无线信道上的误码;D 减少手机发射功率;E 使话音变得简单易听清楚;3.跳频能有效地改善以下哪种现象: DA 单通B 时间扩散C 互调干扰D 多径衰落4.若某层一小区的LEVTHR=100,LEVHYST=3,移动台将可能在下列哪个电平上切出一层小区? AA -105dBmB–100dBmC -95 dBm5.BSC依靠哪一个参数识别MS所报告的相邻小区信号强度为所需要测量的小区信号强度? EA.BCCH+CGIB.CGIC.CGI+BSICD.CELL NAME+BCCHE.MBCCHNO+BSIC6.ICM(IDLE CHANNEL MEASUREMENT)一般分为五个级别,哪一个级别干扰最严重: EA.1;B.2;C.3;D.4;E.5。
7.假设某基站下只有甲乙两个用户,在某一小时内,甲用户打电话给乙用户,通话5分钟;甲用户还打了个国际长途电话,通话10分钟;乙用户接听本公司一个固定电话,通话10分钟;甲乙用户各做了一次周期性位置更新,位置更新花费的时长均为10秒钟;此外,甲乙用户还共发送了20条短信,每个短信平均费时5秒,那么,此基站在这一小时内产生了多少话务? BA.0.42爱尔兰B.0.50爱尔兰C.0.53爱尔兰D.0.64 爱尔兰8.CME20系统规定了只有接收电平高于某阀值的移动台才能接入网络,该阀值由哪个参数给出?_B_A.NCCPERMB.ACCMINC.TALIMD.CCHPWR9.接收到的信号强度是 -100 dBm,同时其同频干扰信号的强度是-90 dBm ,则C/I是多少? DA.0.9dBB.-0.9dBC.10dBD.-10dB10.下列关于天线的描述不正确的是: DA.前后比是衡量定向天线性能的一个重要指标B.无线直放站重发与接收天线隔离度不足会引起直放站自激C.天线是双向器件,既可以把电信号转换成电磁波,又可以把电磁波转换为电信号D.因为天线有增益,所以天线发射端的信号功率比天线输入端的信号功率大11.一个小区的参数: CRO=4,PT=31,TO=2,accmin=88,在IDLE MODE下的C1为12,那么C2值为? (A)A. 4B.16C.10D.812.GSM系统中时间提前量(TA)的一个单位对应空间传播的距离接近 C 米A.150B.300C.500D.100013.自动选网模式下,当MS开机或回到服务区时,要选择一个PLMN,其选择的顺序为:A A.④②③⑤① B. ②④③⑤① C. ②④③⑤① D.④②⑤①③①其他的PLMN以信号强度递减的顺序选择②归属的PLMN③SIM卡中存储其它PLMN的优先次序④上次登记的PLMN⑤其他PLMN的接收电平在-85dbm以上的以随机顺序选择14.14.方案一:ACCMIN=-101dbm,CRO=0,CRH=3,PT=0,TO=0 方案二:ACCMIN=-91dbm,CRO=3,CRH=3,PT=31,TO=0 对于这两种参数设置方案,相比而言,PHASE 2的移动台要比方案一大于多少db下才会选择方案二?_D_A:3B:10C:13D:1615.15.在一个没有开通GPRS功能小区cellA的信号强度大于周围所有开通GPRS功能小区的信号强度,有一手机处在该区域,且驻留在cellA上,那么以下哪种说法正确?_A_ A:手机不能登陆GPRS网络B:手机能够登陆GPRS网络C:手机不传数据时能登陆GPRS网络D:手机传数据时能登陆GPRS网络16.用频谱分析仪测量GSM信号的带宽,频谱分析仪RBW通常设置为_C_A:恰好等于信号宽度B:远大于信号宽度C:选择1.5倍的信号宽度17.为使小区的locating算法为上行K算法,下面哪组参数设置正确_C_A:MSRXSUFF=0,BSRXSUFF=150B:MSRXSUFF=150,BSRXSUFF=150C:MSRXSUFF=150,BSRXSUFF=0D:MSRXSUFF=0,BSRXSUFF=018.对于EDGE的LQC(链路质量控制)方式是: CA:和GPRS一样采用LA方式B:和GPRS不同,采用的是IR方式C:既采用LA,也采用IR方式,优先选择IR方式D:既采用LA,也采用IR方式,优先选择LA方式19.下面是某次测试的截图,已知系统采用BB调频,服务小区使用2206,CDUD。
常用的一些测试英语缩写
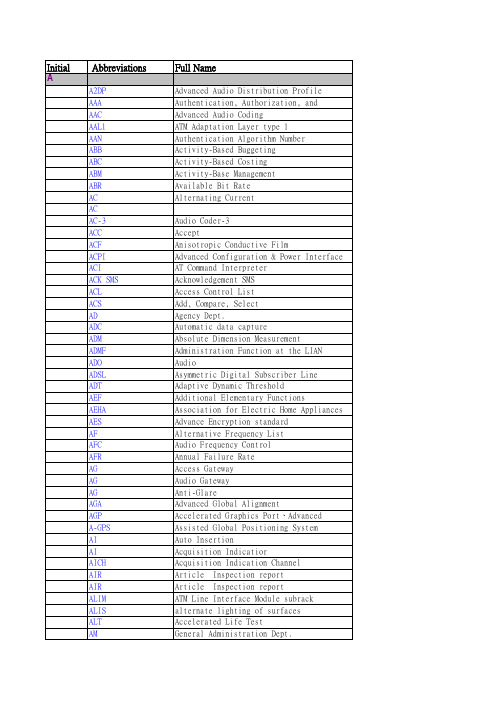
Full Name
Advanced Audio Distribution Profile Authentication, Authorization, and Accounting Advanced Audio Coding ATM Adaptation Layer type 1 Authentication Algorithm Number Activity-Based Buggeting Activity-Based Costing Activity-Base Management Available Bit Rate Alternating Current Audio Coder-3 Accept Anisotropic Conductive Film Advanced Configuration & Power Interface AT Command Interpreter Acknowledgement SMS Access Control List Add, Compare, Select Agency Dept. Automatic data capture Absolute Dimension Measurement Administration Function at the LIAN Audio Asymmetric Digital Subscriber Line Adaptive Dynamic Threshold Additional Elementary Functions Association for Electric Home Appliances Advance Encryption standard Alternative Frequency List Audio Frequency Control Annual Failure Rate Access Gateway Audio Gateway Anti-Glare Advanced Global Alignment Accelerated Graphics Port、Advanced Graphics Port Assisted Global Positioning System Auto Insertion Acquisition Indicatior Acquisition Indication Channel Article Inspection report Article Inspection report ATM Line Interface Module subrack alternate lighting of surfaces Accelerated Life Test General Administration Dept.
沃尔沃英文缩写含义清单-20150604

第 1 页,共 76 页
AME AMEC AMK AMP AMPPE AMS AMTD ANC ANOM ANOVA ANS ANSI ANX AO AOC AOS AP APD APEAL APEL APG API APP APQP APR APS AQL AQS AR ARB ARL ARM ARO ARP ARPA ARS AS ASA ASAP ASC ASDM ASESO ASIC ASIL ASM ASN ASP ASR ASSY ASTA ASTM AT ATACQ ATC ATEO ATI ATM ATP
Advanced Manufacturing Engineering After Market Executive Committee W ork Environment Committee After Market Program After Market Pre-Program Engineering Application Management Services Advanced Manufacturing Technology and Development Active Noise Cancellation Analysis Of Means Analysis Of Variation Alarm Notification System American National Standards Institute Automotive Network Exchange Application Owner Active On-demand Coupling A.Attribute utomotivePrototype Occupancy Sensor Process 3. Accelerator 1 2. Annual Pedal Availability Performance Data Automotive Performance Execution & Layout Study Assessment for Prior Experience & Learning Arizona Proving Ground Application Program Interface Availability Performance Program Advanced Product Quality Planning Annual Percentage Rate Affordable Personel Structure Accepted Quality Level Air Quality Sensor Application Ready Architecture Review Board Analytical Road Loads Accelerated Revitalization Management Assembly Receive Order 1. Application Recovery Plan 2. Abrasive Resistant Paint Advanced Research Projects Agency 1. Active Rear Steering 2. Active Roll Stabilization 1. Automatic Synchronizer 2. Automatic System After Sales Analysis As Soon As Possible 1.Adaptive Steering Column 2. Active Short Cut Air Bag System Diagnostic Module Automotive Safety Engineering Standards Office Application Specified Integrated Circuit A Safety Integrity Level 1.utomotive Automative Strategy Meeting 2. Active Safety Management Advanced Shipping Notice Active Server Pages Attribute Status Report Assembly Active Safety Test Arena American Society for Testing And Material Automatic Transmission Answers To All Car Questions Automatic Temperature Control Automatic Transmission Engineering Office Advanced Technical Information 1.Antenna Module 2. Antenna Tuner Module Affordable Target Process
3M Novec Engineered Fluids 产品介绍.pdf_1701735150.111

Aerosol formulations using3M™ Novec™ Engineered FluidsAerosol formulation is a challenging science, especially when you factor in the need for non-flammability, low toxicity, high solubility, environmental sustainability and much more. At 3M, we've made challenging sciences our business and developed a comprehensive line of low environmental impact carrier solvents for aerosols –3M™Novec™ Engineered Fluids. With the use of high global warming potential (GWP) solvents becoming increasingly regulated and restricted, it’s time to make the switch to Novec fluids, with all the performance, safety and sustainability benefits you need.Properties Unit3M™ Novec™ Engineered Fluids7100 /7100DL a7200 /7200DL a7500 7700 71D90bBoiling Point °C (F) 61 (142) 76 (169) 128 (262) 167 (332) 43 (109) Pour Point °C (F) -135 (-211) -138 (-216) -100 (-148) -50 (-58) -45 (-49) Molecular Weight g/mol 250 264 414 528 97 / 250c Maximum Use Temperature °C (F) <150 (302) <150 (302) <200 (392) <200 (392) <150 (302) Flash Point d°C (F) None None None None None Vapor Pressure kPa 27 16 2.1 <0.1 54 Heat of Vaporization kJ/kg 112 119 89 83 268 Liquid Density g/cm3 1.51 1.42 1.61 1.80 1.26 Coefficient of Expansion K-10.0018 0.0016 0.0013 0.0011 - Absolute Viscosity cP 0.58 0.58 1.24 4.54 0.40 Specific Heat J/kg-K 1183 1220 1128 1040 - Surface Tension mN/m 13.6 13.6 16.2 18 21.1Solubility of Water in Fluid ppm byweight95 92 45 14 -Solubility of Fluid in Waterbyweight12ppm<5ppm<4ppb<1ppb<6300ppm eDielectric Strength Range, 0.1"gapkV > 25 > 25 > 25 > 25 - Worker Exposure Guideline f ppm 750 200 100 TBD g200 / 750hOzone Depletion Potential ODP 0 0 0 0 0Global Warming Potential i GWP 297 57 100 436 32Not for specification purposes. All values @ 25°C unless otherwise specified.a Novec Engineered Fluids with a DL designation are higher purity versions of that product number for deposition applications when high purity materials are needed.b 90% by weight trans-1,2-dichloroethylene; 10% by weight of Novec 7100 fluidc 97 g/mol= trans-1,2-dichloroethylene molecular weight; 250 g/mol = Novec 7100 fluid molecular weightd Per closed cup flash point, tested in accordance with ASTM D3278 test method.e <6300 ppm, reference tDCE solubilty in water from "Industrial Solvents Handbook", Flick, E.W. (ed.) 1985f Recommended parts per million (ppm) for eight-hour average worker exposure per day as established by 90-day inhalation study. Study methodology based on American Industrial Hygiene Association exposure guidelines.g Novec 7700 fluid is low in acute toxicity and most applications have very low inhalation exposure. It is for these reasons that occupational exposure limits (OELs) have not yet been determined for this product.h trans-1,2-dichloroethylene has an 8-hour. time-weighted average (TWA) exposure guideline (EG) of 200 / EG for Novec 7100 fluid is 750.i GWP-100 year ITH, CO2 = 1.0, per IPCC 2013, with the exception of Novec 7100 and 7100DL fluids and blends containing Novec 7100 fluid, which note IPCC 2007.Aerosol formulations using3M™ Novec™ Engineered FluidsBelow are some recommendations to help with your formulations. 3M technical representatives are also available to help determine which 3M™ Novec™ Engineered Fluid is best for your specific needs and to help you with customizing your aerosol solution.Properties3M™ Novec™ Engineered Fluids7100 /7100DL7200 /7200DL 7500 7700 71D90Fluorocarbon solubility High High High High LowHydrocarbon solubility Medium Medium Low Low Very HighPlastic/elastomer compatibility High High Very High Very High LowApplicationsAerosol cleaners ●●●Aerosol coatings ●●●Dry lubricant aerosols /polytetrafluoroethylene (PTFE)●●●●Dissolving fluorochemicals ●●●●Dissolving hydrocarbons ●●●Reducing aerosol formulationflammability●Improving aerosol CARB VOCcompliance1●Extending dry time ●●Replacement forChlorofluorocarbons (CFCs) ●●●Hydrochlorofluorocarbons (HCFCs) ●●●Hydrofluorocarbons (HFCs) ●●Perfluorinated chemicals (PFCs) ●●●●Perfluoropolyethers (PFPEs) ●●n-propyl bromide (nPB)●1 Does not exceed the volatile organic compound (VOC) limits set by the California Environmental Protection Agency Air Resources Board for aerosol formulations. It is essential that the user evaluate the 3M product to determine whether it is fit for a particular purpose and that the end formulation meets the environmental and regulatory requirements of your area.Have questions? Need technical assistance? Contact your 3M technical service representative.We’re here to help.IMPORTANT NOTICE: The technical information, recommendations and other statements contained in this document are based upon tests or experience that 3M believes are reliable, but the accuracy or completeness of such information is not guaranteed. Contact your local 3M representative or visit /Novec for more information. Warranty and Limitation of Liability: if there is a defect in this product, your exclusive remedy shall be product replacement or refund of the purchase price. 3M MAKES NO OTHER WARRANTIES OR CONDITIONS, INCLUDING ANY IMPLIED WARRANTY OR CONDITION OF MERCHANTABILITY OR FITNESS FOR A PARTICULAR PURPOSE. 3M will not be liable for any direct, indirect, special, incidental or consequential damage related to the use of this product.Electronics Materials Solutions Division 3M Center, Building 224-3N-11St. Paul, MN 55144-10001-800-810-8513/novec©2016 3M. All rights reserved.3M and Novec are trademarks of 3M Company.60-5002-0824-89/2018 ●●。
博格华纳第五代AWD扭矩管理器提升驾驶体验
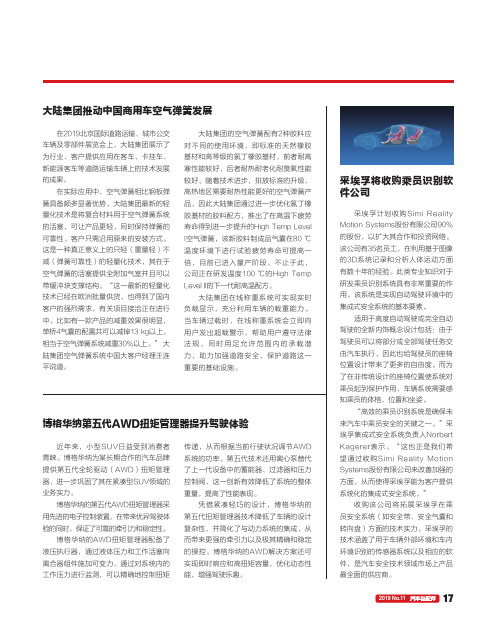
172019 No.11在2019北京国际道路运输、城市公交车辆及零部件展览会上,大陆集团展示了为行业、客户提供应用在客车、卡挂车、新能源客车等道路运输车辆上的技术发展的成果。
在实际应用中,空气弹簧相比钢板弹簧具备颇多显著优势。
大陆集团最新的轻量化技术是将复合材料用于空气弹簧系统的活塞,可让产品更轻,同时保持弹簧的可靠性。
客户只需沿用原来的安装方式。
这是一种真正意义上的只轻(重量轻)不减(弹簧可靠性)的轻量化技术,其在于空气弹簧的活塞提供全附加气室并且可以带缓冲块支撑结构。
“这一最新的轻量化技术已经在欧洲批量供货,也得到了国内客户的强烈需求,有关项目接洽正在进行中。
比如有一款产品的减重效果很明显,单桥4气囊的配置共可以减掉13 kg以上,相当于空气弹簧系统减重30%以上。
” 大陆集团空气弹簧系统中国大客户经理王连平说道。
大陆集团的空气弹簧配有2种胶料应对不同的使用环境,即标准的天然橡胶基材和高等级的氯丁橡胶基材,前者耐高寒性能较好,后者耐热耐老化耐臭氧性能较好。
随着技术进步,排放标准的升级、高热地区需要耐热性能更好的空气弹簧产品,因此大陆集团通过进一步优化氯丁橡胶基材的胶料配方,推出了在高温下疲劳寿命得到进一步提升的High Temp Level I空气弹簧,该新胶料制成品气囊在80 ℃温度环境下进行试验疲劳寿命可提高一倍,目前已进入量产阶段。
不止于此,公司正在研发温度100 ℃的High Temp Level II的下一代耐高温配方。
大陆集团在线称重系统可实现实时负载显示,充分利用车辆的载重能力。
当车辆过载时,在线称重系统会立即向用户发出超载警示,帮助用户遵守法律法规,同时用足允许范围内的承载潜力,助力加强道路安全,保护道路这一重要的基础设施。
大陆集团推动中国商用车空气弹簧发展近年来,小型SUV日益受到消费者青睐。
博格华纳为某长期合作的汽车品牌提供第五代全轮驱动(AWD)扭矩管理器,进一步巩固了其在紧凑型SUV领域的业务实力。
用于无人机导航的光流测速优化方法
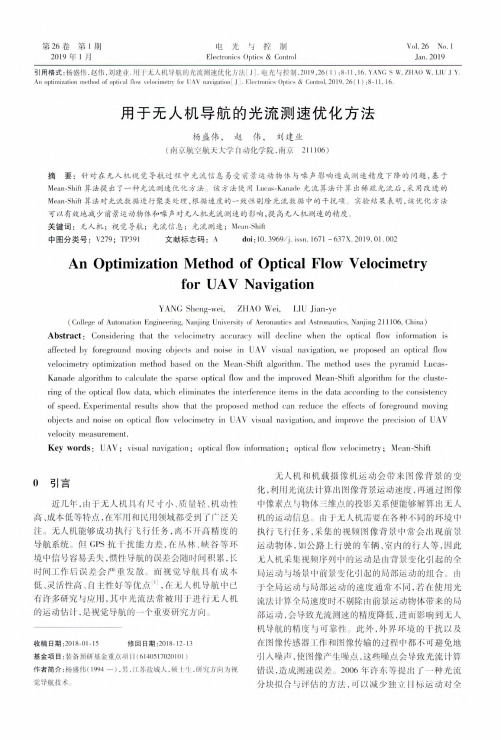
Vol. 26 No. 1Jan. 2019第26卷第1期2019年1月电光与控制Electronics Optics & Control 引用格式:杨盛伟,赵伟,刘建业•用于无人机导航的光流测速优化方法[J]•电光与控制,2019,26(1):8-11,16. YANG S W, ZHAO W, LIU J Y.An optimization method of optical flow velocimetry for L'AV navigation J . Electronics Optics & Control, 2019. 26( 1 ) ;8-11. 16.用于无人机导航的光流测速优化方法杨盛伟,赵伟,刘建业(南京航空航天大学自动化学院,南京211106)摘 要:针对在无人机视觉导航过程中光流信息易受前景运动物体与噪声影响造成测速精度下降的问题,基于Mean-Shift 算法提出了 一种光流测速优化方法 该方法使用Lucas-Kanade 光流算法计算出稀疏光流后,采用改进的 Mean-Shift 算法对光流数据进行聚类处理,根据速度的一致性剔除光流数据中的干扰项 实验结果表明,该优化方法可以有效地减少前景运动物体和噪声对无人机光流测速的影响,提高无人机测速的精度关键词:无人机;视觉导航;光流信息;光流测速;Mean-Shift中图分类号:V279; TP391 文献标志码:A doi : 10. 3969/j. issn. 1671 -637X. 2019.01.002An Optimization Method of Optical Flow Velocimetryfor UAV NavigationYANG Sheng-wei, ZHAO Wei, LIU Jian-ye(College of Automation Engineering, Nanjing University of Aeronautics and Astronautics, Nanjing 211106, China)Abstract : Considering that the velocimetiy accuracy will decline when the optical flow information isaffected by foreground moving objects and noise in UAV visual navigation, we proposed an optical flowvelocimetry optimization method based on the Mean-Shift algorithm. Ihe method uses the pyramid Lucas-Kanade algorithm to calculate the sparse optical flow and the improved Mean-Shift algorithm for the cluste ring of the optical flow data, which eliminates the interference items in the data according to the consistencyof speed. Experimental results show that the proposed method can reduce the effects of foreground movingobjects and noise on optical flow velocimetry in UAV visual navigation, and improve the precision of UAVvelocity measurement.Key words : UAV ; visual navigation ; optical flow information ; optical flow velocimetiy ; Mean-Shifto 引言近几年,由于无人机具有尺寸小、质量轻、机动性高、成本低等特点,在军用和民用领域都受到了广泛关 注。
N型高频功分器产品规格说明书

Type N (M/F) 0.92 to 12.4 GHz (Maximally Flat Calibrated)Features▪High Power Capability▪Low Loss, Superior Directivity ▪+/- 0.25 dB Frequency Sensitivity ▪Permanent Nameplate Calibrations Models▪3042B-10, 3042B-20, 3042B-30, 3043B-10,3043B-20, 3043B-30, 3045C-10, 3045C-20,3045C-30Model3042B-103042B-203042B-303043B-103043B-20Low Frequency (GHz)0.90.90.91.71.7High Frequency (GHz) 2.2 2.2 2.2 4.2 4.2Nominal Coupling (dB)1020301020Minimum Directivity (dB)2020202020Insertion Loss, Coupled PowerExcluded (dB)0.200.200.200.200.20True Insertion Loss (dB)0.700.200.200.750.75VSWR Maximum for Primary Line 1.10 1.10 1.10 1.15 1.15VSWR Maximum for SecondaryLine 1.20 1.20 1.20 1.20 1.20Frequency Sensitivity dB +/- 0.25+/- 0.25+/- 0.25+/- 0.25+/- 0.25Maximum Deviation from Nominal(dB)+/- 0.5+/- 0.5+/- 0.5+/-0.5+/- 0.5Calibration (Freq GHz)0.92, 1.24, 1.50,1.88,2.20.92, 1.24, 1.50,1.88,2.20.92, 1.24, 1.50,1.88,2.21.7,2.325, 2.95,3.575,4.21.7,2.325, 2.95,3.575,4.2Absolute Calibration Accuracy dB(per 10 dB step)+/- 0.1+/- 0.1+/- 0.1+/- 0.1+/-0.1Power Incident (Watts)200200200200200Pwr Reflected (Watts)5020020050200Peak Power (kW)1010101010Maximum Weight (kg)0.60.60.60.50.5Maximum Weight (lbs)1.25 1.25 1.25 1.0 1.0Special Notes:AAAAASpecial Notes:A:Frequency Sensitivity included in coupling value.Adapters Attenuators CouplersDC BlocksDetectorsIsolators &CirculatorsPhase ShiftersPower Dividers andHybridsTerminations (50 OhmLoads)WaveguideType N (M/F) 0.92 to 12.4 GHz (Maximally Flat Calibrated)Model3043B-303045C-103045C-203045C-30Low Frequency (GHz) 1.77.07.07.0High Frequency (GHz) 4.212.412.412.4Nominal Coupling (dB)30102030Minimum Directivity (dB)20151515Insertion Loss, Coupled PowerExcluded (dB)0.200.350.350.35True Insertion Loss (dB)0.70 1.00.400.20VSWR Maximum for Primary Line 1.15 1.25 1.25 1.25VSWR Maximum for Secondary Line1.20 1.30 1.30 1.30Frequency Sensitivity dB+/- 0.25+/- 0.25+/- 0.25+/- 0.25Maximum Deviation from Nominal (dB)+/-0.5+/-0.5+/-0.5+/- 0.5Calibration (Freq GHz)1.7,2.325, 2.95,3.575,4.27.0, 8.0, 9.0, 10.0,11.0, 12.07.0, 8.0, 9.0, 10.0,11.0, 12.07.0, 8.0, 9.0, 10.0,11.0, 12.0Absolute Calibration Accuracy dB (per10 dB step)+/- 0.1+/- 0.1+/- 0.1+/- 0.1Power Incident (Watts)200100100100Pwr Reflected (Watts)2001010010Peak Power (kW)10222Maximum Weight (kg)0.50.40.40.4Maximum Weight (lbs)1.00.80.80.8Special Notes:AAAASpecial Notes:A:Frequency Sensitivity included in coupling value.Adapters Attenuators CouplersDC BlocksDetectorsIsolators &CirculatorsPhase ShiftersPower Dividers andHybridsTerminations (50 OhmLoads)WaveguideType N (M/F) 0.92 to 12.4 GHz (Maximally Flat Calibrated)Outline Drawings For Models :3042B-10, 3042B-20, 3042B-30, 3043B-10, 3043B-20, 3043B-30Units A B C D E F G H K L M (Dia.)N 3042B-10 , 3042B-20, 3042B-30, 3043B-20in. 6.12 2.120.88 3.00 1.500.190.750.50 1.260.44 1.688mm 155.4553.8522.3576.2038.10 4.8319.0512.7032.0011.18Tap-142.8753043B-10 , 3043B-30in. 4.09 2.120.88 1.09 1.500.190.750.50 1.260.44 1.688mm103.8953.8522.3527.6938.104.8319.0512.7032.0011.18Tap-142.875Notes:Dimensions are maximum unless otherwise noted and allow for 0.020" paint buildup per surface.Dimension:D: +/-0.015"N: +/-0.015"Tap-1: #8-32NC by 0.400 Deep Farside.Adapters Attenuators CouplersDC BlocksDetectorsIsolators &CirculatorsPhase ShiftersPower Dividers andHybridsTerminations (50 OhmLoads)WaveguideType N (M/F) 0.92 to 12.4 GHz (Maximally Flat Calibrated)Outline Drawings For Models :3045C-10, 3045C-20, 3045C-30Units A B C D E F G H K L M (Dia.)N 3045C-10 , 3045C-20, 3045C-30in. 2.50 1.470.88 1.125 1.1250.190.75 1.900.870.44 1.093mm63.5037.3422.3528.57528.5754.8319.0548.2622.1011.18Tap-127.762Notes:Dimensions are maximum unless otherwise noted and allow for 0.020" paint buildup per surface.Dimension:D: +/-0.015"N: +/-0.015"Tap 1: #8-32 NC-2B .40 DP Tapped (2 Holes) Farside.Adapters Attenuators CouplersDC BlocksDetectorsIsolators &CirculatorsPhase ShiftersPower Dividers andHybridsTerminations (50 OhmLoads)Waveguide。
伟迪捷为解决喷嘴问题而推出的New46m.微字符喷码机——访伟迪捷市场部产品规划经理王琦

位于在虹桥开发区中 那里还有联合利华等国际公司的总部
在这里可以使伟迪捷在产生研发 出来后第- a间安装在本地 l , 客户的车 间开始 试用 从而大大加快了技术转化 为生产力的 速度 。 近几年推 出的新产品见证了伟迪捷的创新能力 伟迪捷 11/, 0J 6 ' 字符连 续喷码机 , 不但喷印速度极快 , 运行 时间也大为 延长, 该喷码 行数多达5 在保证高分辩率的情况下 行 喷印速
依 然是 一 个 问题 统计 , 们 维 修 的 喷码 机有 8 % 都 是 喷 嘴 据 我 O
保证 打 印质 量 。
Nw 6 e 4 m微字符持续式喷墨喷码机在添加墨水和溶剂时
都可以 在不停机的情况下完成. 机器墨水 的添加是根据墨水的
液位 自动 进行 添 加 当墨水 的 液位 低 于正 常液位 时就 会 自动添
上第一部 商业 用墨水喷码机诞 生于美国伟迪
,
码机 , 诘介 绍这款 产品的特点是什 么7 能够为客户带 来了哪 些便利7
王琦: 我们知道喷嘴是喷码 机的关键 , 而且是最容易出现 问题的部分。 目前很多国产的喷码机稳定性 还不够 主要是 喷
并由此开创喷码机 历史 。 之后 经过不 断的技
不停 机 的情 况下 进行 的 。 同时 。 新后 产 品 在 清 洗方 面还 拥 有 如 下优 点 : 改 对于 长 时 间 的停 机 , 用清 洗 整 个 墨水 系 统 . 机 1天 以 上都 能快 速 开 不 停 0
软件上也做了升级, 使它更适合现在的喷嘴和 墨路系统。 机 该
型 拥 有全 新 的喷 嘴 设 计 , 稳 定性 大 大提 升, 使 同时可 以 提供 更 稳 定 的喷 印质 量 故 障 率更 使 这 款 N w 6 拥 有 全 新 设计 的喷 嘴 模 块 , 客户 带 来 打 e 4 m 给 印质 量 的 全 面提 升 . 小 字体 可 以 达 到 08 m, 最 r 这也 是 为什 么 a 我 们 称 之 为 微 字 符 。 因为一 般 的持 续 式 墨 水喷 码 机 的最 小 字体高度在2 mm, 们 的 N w 6 可 以 # E在 体 积 更 小 的 物 我 e 4 m Tr ] 体 上 此次 N w 6 系列 传 承 伟迪 捷 对 喷 码机 啊一贯 的 高 e 4 m 品质 追 求 以满 足客 户对 微 字 符 喷 码 的 需求 , 过长 达 半 年 可 经 时间 的设 计验 证 , 国 1 家大 客户历 时两 个月 的现 场 测 试 , 全 0 拥
csr8670c手册

_äìÉ`çêÉ∆=`poUSTM=_d^Preliminary InformationPerformance SpecificationIssue 1To accelerate the product development process, CSR are offering early access to this preliminary design data. This advance information has not been through CSR’s internal qualification sign-off procedure.CSR has yet to complete its testing of this design and offers no guarantee with respect to the performance. The design data may change without notice.CSRChurchill HouseCambridge Business ParkCowley RoadCambridge CB4 0WZUnited KingdomRegistered in England 3665875Tel.: +44 (0)1223 692000Fax.: +44 (0)1223 692001CS-203853-SPP1Preliminary Information© Cambridge Silicon Radio 2011Document StatusThe status of this document is Preliminary. To accelerate the product development process, CSR is offering earlyaccess to information.CSR offers no guarantee with respect to the performance of CSR8670 BGA. All detailed specifications may bechanged by CSR without notice.`poUSTM=_d^Performance SpecificationDocument HistoryRevision Date Change Reason125 JAN 11Original publication of document.If you have any comments about this document, email comments@ givingthe number, title and section with your feedback.`poUSTM=_d^Performance SpecificationTrademarks, Patents and LicencesUnless otherwise stated, words and logos marked with ™ or ® are trademarks registered or owned by CSR plc or its affiliates. Bluetooth ® and the Bluetooth logos are trademarks owned by Bluetooth SIG, Inc. and licensed to CSR.Other products, services and names used in this document may have been trademarked by their respective owners.The publication of this information does not imply that any licence is granted under any patent or other rights owned by CSR plc and its affiliates.CSR reserves the right to make technical changes to its products as part of its development programme.While every care has been taken to ensure the accuracy of the contents of this document, CSR cannot accept responsibility for any errors.CSR’s products are not authorised for use in life-support or safety-critical applications.No statements or representations in this document are to be construed as advertising, marketing, or offering for sale in the United States imported covered products subject to the Cease and Desist Order issued by the U.S.International Trade Commission in its Investigation No. 337-TA-602. Such products include SiRFstarIII™ chips that operate with SiRF software that supports SiRFInstantFix™, and/or SiRFLoc ® servers, or contains SyncFreeNav functionality.Refer to for compliance and conformance to standards information.Trademarks, Patents and Licences`poUSTM=_d^ Performance SpecificationContentsDocument Status (2)1Introduction (7)2Radio Characteristics: Basic Data Rate (8)2.1Transmitter Performance (8)2.1.1Temperature 20°C (8)2.1.2Temperature -30°C (10)2.1.3Temperature 85°C (11)2.2Receiver Performance (12)2.2.1Temperature 20°C (12)2.2.2Temperature -30°C (13)2.2.3Temperature 85°C (13)3Radio Characteristics: Enhanced Data Rate (14)3.1Transmitter Performance (14)3.1.1Temperature 20°C (14)3.1.2Temperature -30°C (16)3.1.3Temperature 85°C (17)3.2Receiver Performance (18)3.2.1Temperature 20°C (18)3.2.2Temperature -30°C (19)3.2.3Temperature 85°C (19)4Typical Radio Performance: Basic Data Rate (20)4.1Transmitter Performance (20)4.2Receiver Performance (29)5Typical Radio Performance: Enhanced Data Rate (30)5.1Transmitter Performance (30)5.2Receiver Performance (38)6Document References (40)Terms and Definitions ............................................................................................................................................ 41List of FiguresFigure 4.1Maximum Transmit Power vs Temperature (20 DH5 Packets) (20)Figure 4.2Firmware Controlled Transmit Power vs Temperature (20 DH5 Packets) (21)Figure 4.3Transmit Power Variation and Mean vs Channel (20 DH5 Packets) (21)Figure 4.4-20dB Bandwidth vs Temperature (DH5 Packets) (22)Figure 4.5Adjacent Channel Transmit Power Variation and Mean vs Channel (DH1 Packets) at -30°C (22)Figure 4.6Adjacent Channel Transmit Power Variation and Mean vs Channel (DH1 Packets) at 20°C (23)Figure 4.7Adjacent Channel Transmit Power Variation and Mean vs Channel (DH1 Packets) at 85°C ......... 23Figure 4.8Frequency Deviation Δf 1avg vs Temperature (10 DH5 Packets) ..................................................... 24Figure 4.9Frequency Deviation Δf 2max vs Temperature (10 DH5 Packets) ..................................................... 24Figure 4.10Modulation Ratio (Δf 2avg /Δf 1avg ) vs Temperature (20 DH5 Packets) .. (25)Figure 4.11ICFT vs Temperature (25)Figure 4.12Carrier Frequency Drift for 10 DH1 Packets vs Temperature (26)Figure 4.13Carrier Frequency Drift for 10 DH3 Packets vs Temperature (26)Figure 4.14Carrier Frequency Drift for 10 DH5 Packets vs Temperature (27)Figure 4.15Carrier Frequency Drift Rate vs Temperature (10 Packets, All Packet types) (27)Figure 4.16Spectrum (Loopback DH1 Packets with TPN9 Payload) (28)Figure 4.17DH5 Burst Power vs Time (28)Figure 4.18Receive Sensitivity vs Temperature (595 DH5 Packets, Dirty Tx. ON, Hopping OFF) (29)Figure 4.19Receive Sensitivity Variation and Mean vs Channel ....................................................................... 29`poUSTM=_d^ Performance SpecificationFigure 5.1π/4DQPSK Relative Transmit Power vs Temperature (10 2-DH5 Packets) (30)Figure 5.28DPSK Relative Transmit Power vs Temperature (10 3-DH5 Packets) (30)Figure 5.3π/4DQPSK Absolute Block Frequency Error, ωo vs Temperature (200 2-DH5 Blocks) (31)Figure 5.4π/4DQPSK Absolute Initial Frequency Error, ωi vs Temperature (200 2-DH5 Blocks) (31)Figure 5.5π/4DQPSK Absolute Total Frequency Error, (ωo+ωi) vs Temperature (200 2-DH5 Blocks) (32)Figure 5.68DPSK Absolute Block Frequency Error, ωo vs Temperature (200 3-DH5 Blocks) (32)Figure 5.78DPSK Absolute Initial Frequency Error, ωi vs Temperature (200 3-DH5 Blocks) (33)Figure 5.88DPSK Absolute Total Frequency Error, (ωo+ωi) vs Temperature (200 3-DH5 Blocks) (33)Figure 5.9π/4DQPSK RMS DEVM vs Temperature (200 2-DH5 Blocks) (34)Figure 5.10π/4DQPSK Peak DEVM vs Temperature (200 2-DH5 Blocks) (34)Figure 5.118DPSK RMS DEVM vs Temperature (200 2-DH5 Blocks) (35)Figure 5.128DPSK Peak DEVM vs Temperature (200 3-DH5 Blocks) (35)Figure 5.13Adjacent Channel Transmit Power Variation and Mean vs Channel (2-DH5 Packets) at 20°C (36)Figure 5.14Adjacent Channel Transmit Power Variation and Mean vs Channel (3-DH5 Packets) at 20°C (36)Figure 5.15Adjacent Channel Transmit Power Variation and Mean vs Channel (2-DH5 Packets) at -30°C (37)Figure 5.16Adjacent Channel Transmit Power Variation and Mean vs Channel (3-DH5 Packets) at -30°C (37)Figure 5.17π/4DQPSK Receive Sensitivity Variation vs Channel (2-DH5 Loopback, 16Mbits, Dirty Tx. ON, Hopping OFF) (38)Figure 5.18π/4DQPSK Receive Sensitivity vs Temperature (2-DH5 Loopback, 16Mbits, Dirty Tx. ON, Hopping OFF) (38)Figure 5.198DPSK Receive Sensitivity Variation vs Channel (3-DH5 Loopback, 16Mbits, Dirty Tx. ON, Hopping OFF) (39)Figure 5.208DPSK Receive Sensitivity vs Temperature (3-DH5 Loopback, 16Mbits, Dirty Tx. ON, HoppingOFF) ................................................................................................................................................ 39`poUSTM=_d^ Performance Specification1IntroductionThis document describes the preliminary performance specification for initial engineering samples of theBlueCore® CSR8670 BGA IC. Read this in conjunction with the CSR8670 BGA Data Sheet.This document includes:■RF characterisation for basic rate and EDR■RF typical performance graphs for basic rate and EDRImportant Note:The CSR8670 BGA is designed to meet the Bluetooth v3.0 specification when used in a suitable circuit between-30°C and 85°C. The transmitter output is designed to be unconditionally stable over a guaranteed temperature range.`poUSTM=_d^Performance Specification2Radio Characteristics: Basic Data RateImportant Note:Results shown are referenced to the output of the CSR8670 BGA.2.1Transmitter Performance2.1.1Temperature 20°C RF Characteristics, VDD = 1.5V Min Typ Max BluetoothSpecification UnitMaximum RF transmit power (a) (b)(c)59--6 to 4(d)dBm RF power variation over temperature rangewith compensation enabled (e)-±0.75--dB RF power variation over temperature rangewith compensation disabled (e)-±1.5--dB 20dB bandwidth for modulated carrier -9201000≤1000kHzACP (f) (g) F = F 0 ± 2MHz --25-20≤-20dBmF = F 0 ± 3MHz --32-28≤-40dBmF = F 0 ± > 3MHz -<-65-40≤-40dBmΔf 1avg maximum modulation 140165175140 < f 1avg < 175kHz Δf 2max minimum modulation 115135-≥115kHz Δf 2avg /Δf 1avg 0.80.9-≥0.80-ICFT (h)-751275±75kHz Drift rate -620≤20kHz/50μs Drift (single slot packet)-1225≤25kHz Drift (five slot packet)-1540≤40kHz 2nd harmonic content --TBD (i)-≤-30dBm 3rd harmonic content --TBD (i)-≤-30dBm(a)Results are referenced to the output of the CSR8670 BGA.(b)The firmware maintains the transmit power within Bluetooth v3.0 specification limits.(c)Measurements are made using appropriate PS Key settings.(d)Class 2 RF transmit power range, Bluetooth v3.0 specification.(e)Parameters depend on matching circuit used, and behaviour over temperature. These parameters may be beyond CSR's direct control.(f)Measured at F 0 = 2441MHz.(g)CSR8670 BGA guaranteed to meet ACP performance in Bluetooth v3.0 specification.(h)Ignores any frequency error in the reference.(i)Filter will attenuate the harmonics.`poUSTM=_d^ Performance SpecificationEmissions,VDD = 1.5V Frequency (GHz)Min Typ Max Cellular Band UnitEmitted power in cellular bandsmeasured at the output of theCSR8670 BGA.Output power ≤9dBm 0.746 - 0.764(a)--TBD -CDMA 2000dBm / Hz 0.869 - 0.894(b)--TBD -GSM 8500.869 - 0.894(a)--TBD -CDMA 8500.925 - 0.960(b)--TBD -GSM 9001.570 - 1.580(c)--TBD -GPS1.805 - 1.880(b)--TBD -GSM 1800 / DCS 18001.930 - 1.990(b)--TBD -GSM 19001.930 - 1.990(a)--TBD -CDMA 19002.110 - 2.170(a)--TBD -CDMA 20002.110 - 2.170(d)--TBD -W-CDMA 2100(a)Maximum of average burst power in 1.2MHz bandwidth is normalised to 1Hz. Hopping on.(b)Maximum of average burst power in 200kHz bandwidth is normalised to 1Hz. Hopping on.(c)Maximum of average burst power in 1MHz bandwidth is normalised to 1Hz. Hopping on.(d)Maximum of average burst power in 5MHz bandwidth is normalised to 1Hz. Hopping on.`poUSTM=_d^ Performance Specification2.1.2Temperature -30°C RF Characteristics, VDD = 1.5V Min Typ MaxBluetooth Specification UnitMaximum RF transmit power (a) (b)610--6 to 4(c)dBm 20dB bandwidth for modulated carrier -9201000≤1000kHzACP (d)F = F 0 ± 2MHz --23-20≤-20dBmF = F 0 ± 3MHz --30-27≤-40dBmΔf 1avg maximum modulation 140165175140 < f 1avg < 175kHz Δf 2max minimum modulation 115140-≥115kHz Δf 2avg /Δf 1avg 0.80.9-≥0.80-ICFT -751075±75kHz Drift rate -620≤20kHz/50μs Drift (single slot packet)-1125≤25kHz Drift (five slot packet)-1240≤40kHz(a)Results are referenced to the output of the CSR8670 BGA.(b)The firmware maintains the transmit power within Bluetooth v3.0 specification limits.(c)Class 2 RF transmit power range, Bluetooth v3.0 specification.(d)Measured at F 0 = 2441MHz.`poUSTM=_d^ Performance Specification2.1.3Temperature 85°C RF Characteristics, VDD = 1.5V Min Typ MaxBluetooth Specification UnitMaximum RF transmit power (a) (b)48--6 to 4(c)dBm 20dB bandwidth for modulated carrier -9201000≤1000kHzACP (d)F = F 0 ± 2MHz --30-20≤-20dBmF = F 0 ± 3MHz --35-33≤-40dBmΔf 1avg maximum modulation 140165175140 < f 1avg < 175kHz Δf 2max minimum modulation 115130-≥115kHz Δf 2avg /Δf 1avg 0.80.9-≥0.80-ICFT -751575±75kHz Drift rate -620≤20kHz/50μs Drift (single slot packet)-1125≤25kHz Drift (five slot packet)-1240≤40kHz(a)Results are referenced to the output of the CSR8670 BGA.(b)The firmware maintains the transmit power within Bluetooth v3.0 specification limits.(c)Class 2 RF transmit power range, Bluetooth v3.0 specification.(d)Measured at F 0 = 2441MHz.`poUSTM=_d^ Performance Specification2.2Receiver Performance2.2.1Temperature 20°C RF Characteristics (a),VDD = 1.5V Frequency (GHz)Min Typ Max BluetoothSpecification UnitSensitivity at 0.1% BER for allbasic rate packet types2.402--90-86≤-70dBm2.441--90-862.48--90-86Maximum received signal at 0.1% BER -20>-10-≥-20dBm Continuous power required to block Bluetooth reception(for input power of -67dBm with 0.1% BER) measured at the output of the CSR8670BGA 0.030 - 2.000-10>TBD --10dBm 2.000 - 2.400-27-TBD --272.500 -3.000-27-TBD --273.000 - 12.75-10>TBD --10C/I co-channel (b) (c) (d)-TBD 11≤11dBAdjacent channel selectivityC/I (b) (c) (d) F = F 0 + 1MHz --TBD 0≤0dBF = F 0 - 1MHz --TBD 0≤0dBF = F 0 + 2MHz --TBD -30≤-30dBF = F 0 - 2MHz --TBD -20≤-20dBF = F 0 + 3MHz --TBD -40≤-40dBF = F 0 - 5MHz --TBD -40≤-40dBF = F Image --TBD -9≤-9dBMaximum level of intermodulation interferers (e)-39-TBD -≥-39dBm Spurious output level (f)--TBD --dBm/Hz (a)Results are referenced to the output of the CSR8670 BGA.(b)CSR8670 BGA is guaranteed to meet the C/I performance as specified by the Bluetooth v3.0 specification.(c)Measured at F 0 = 2441MHz.(d)F Image = F 0 - 3MHz. However, depending on crystal frequency and channel number, the image may switch to the opposite side of the carrier.When this occurs, F Image = F 0 + 3MHz and the offsets in the table equations associated with C/I are also reversed.(e)Measured at f 1 - f 2 = 5MHz. Measurement is performed in accordance with Bluetooth RF test RCV/CA/05/c, i.e. wanted signal at -64dBm.(f)Measured at the output of the CSR8670 BGA. Integrated in 100kHz bandwidth and normalised to 1Hz. Actual figure is typically -TBDdBm/Hz except for peaks of -TBDdBm at 1600MHz, -TBDdBm in-band at 2.4GHz and -TBDdBm at 3.2GHz.`poUSTM=_d^ Performance Specification2.2.2Temperature -30°CRF Characteristics, VDD = 1.5V Frequency(GHz)Min Typ MaxBluetoothSpecificationUnitSensitivity at 0.1% BER for all basic rate packet types 2.402--92-88≤-70dBm 2.441--92-882.48--92-88Maximum received signal at 0.1% BER-20>-10-≥-20dBm 2.2.3Temperature 85°CRF Characteristics, VDD = 1.5V Frequency(GHz)Min Typ MaxBluetoothSpecificationUnitSensitivity at 0.1% BER for all basic rate packet types 2.402--88-84≤-70dBm 2.441--88-842.48--88-84Maximum received signal at 0.1% BER-20>-10-≥-20dBm `poUSTM=_d^ Performance Specification3Radio Characteristics: Enhanced Data RateNote:Results shown are referenced to the output of the CSR8670 BGA. Measurement methods are in accordance with the Bluetooth v3.0 RF Test specification.3.1Transmitter Performance3.1.1Temperature 20°C Radio Characteristics, VDD = 1.5VMin Typ Max Bluetooth Specification UnitRelative transmit power -4-11-4 to 1dBπ/4 DQPSK max carrier frequencystability | ωo |- 1.510≤10 for all blocks kHz| ωi |-575≤75 for all packets kHz| ωo + ωi |-575≤75 for all blocks kHz8DPSK max carrier frequencystability | ωo |- 1.510≤10 for all blocks kHz| ωi |-575≤75 for all packets kHz| ωo + ωi |-575≤75 for all blocks kHzπ/4 DQPSK modulationaccuracy (a)RMS DEVM -720≤20%99% DEVM -TBD 30≤30%Peak DEVM -2035≤35%8DPSK modulation accuracy (a)RMS DEVM -713≤13%99% DEVM -TBD 20≤20%Peak DEVM -1725≤25%`poUSTM=_d^ Performance SpecificationRadio Characteristics, VDD = 1.5V MinTyp Max BluetoothSpecification UnitIn-band spurious emissions (b)F > F 0 + 3MHz -<-60-40≤-40dBmF < F 0 - 3MHz -<-60-40≤-40dBmF = F 0 - 3MHz --28-25≤-40dBmF = F 0 - 2MHz --22-20≤-20dBmF = F 0 - 1MHz --28-26≤-26dBF = F 0 + 1MHz --28-26≤-26dBF = F 0 + 2MHz --26-20≤-20dBmF = F 0 + 3MHz --39-36≤-40dBmEDR differential phase encoding 99NoErrors -≥99%(a)Modulation accuracy utilises DEVM with tracking of the carrier frequency.(b)Bluetooth specification values are for 8DPSK.`poUSTM=_d^ Performance Specification3.1.2Temperature -30°C Radio Characteristics, VDD = 1.5V MinTyp Max BluetoothSpecification UnitRelative transmit power -4-11-4 to 1dBπ/4 DQPSK max carrier frequencystability | ωo |- 1.510≤10 for all blocks kHz| ωi |-575≤75 for all packets kHz| ωo + ωi |-575≤75 for all blocks kHz8DPSK max carrier frequencystability | ωo |- 1.510≤10 for all blocks kHz| ωi |-575≤75 for all packets kHz| ωo + ωi |-575≤75 for all blocks kHzπ/4 DQPSK modulationaccuracy (a)RMS DEVM -720≤20%99% DEVM -TBD 30≤30%Peak DEVM -1735≤35%8DPSK modulation accuracy (a)RMS DEVM -713≤13%99% DEVM -TBD 20≤20%Peak DEVM -1625≤25%In-band spurious emissions (b)F > F 0 + 3MHz -<-60-40≤-40dBmF < F 0 - 3MHz -<-60-40≤-40dBmF = F 0 - 3MHz --27-24≤-40dBmF = F 0 - 2MHz --23-20≤-20dBmF = F 0 - 1MHz --31-26≤-26dBF = F 0 + 1MHz --31-26≤-26dBF = F 0 + 2MHz --28-20≤-20dBmF = F 0 + 3MHz --39-40≤-40dBmEDR differential phase encoding 99NoErrors -≥99%(a)Modulation accuracy utilises DEVM with tracking of the carrier frequency.(b)Bluetooth specification values are for 8DPSK.`poUSTM=_d^ Performance Specification3.1.3Temperature 85°C Radio Characteristics, VDD = 1.5V MinTyp Max BluetoothSpecification UnitRelative transmit power -4-11-4 to 1dBπ/4 DQPSK max carrier frequencystability | ωo |- 1.510≤10 for all blocks kHz| ωi |-1575≤75 for all packets kHz| ωo + ωi |-1575≤75 for all blocks kHz8DPSK max carrier frequencystability | ωo |- 1.510≤10 for all blocks kHz| ωi |-1575≤75 for all packets kHz| ωo + ωi |-1575≤75 for all blocks kHzπ/4 DQPSK modulationaccuracy (a)RMS DEVM -720≤20%99% DEVM -TBD 30≤30%Peak DEVM -1735≤35%8DPSK modulation accuracy (a)RMS DEVM -713≤13%99% DEVM -TBD 20≤20%Peak DEVM -1625≤25%In-band spurious emissions (b)F > F 0 + 3MHz -<-60-40≤-40dBmF < F 0 - 3MHz -<-60-40≤-40dBmF = F 0 - 3MHz --35-32≤-40dBmF = F 0 - 2MHz --26-20≤-20dBmF = F 0 - 1MHz --TBD -26≤-26dBF = F 0 + 1MHz --TBD -26≤-26dBF = F 0 + 2MHz --30-20≤-20dBmF = F 0 + 3MHz --43-40≤-40dBmEDR differential phase encoding 99NoErrors -≥99%(a)Modulation accuracy utilises DEVM with tracking of the carrier frequency.(b)Bluetooth specification values are for 8DPSK.`poUSTM=_d^ Performance Specification3.2Receiver Performance3.2.1Temperature 20°C Radio Characteristics, VDD = 1.5V Modulation Min TypMax Bluetooth Specification UnitSensitivity at 0.01% BER (a)Ch 0π/4 DQPSK --92-70≤-70dBmCh 39π/4 DQPSK --93-70Ch 78π/4 DQPSK --93-70Ch 08DPSK --84-70≤-70dBmCh 398DPSK --84-70Ch 788DPSK --84-70Maximum received signal at 0.1%BER π/4 DQPSK -20>-8-≥-20dBm 8DPSK -20>-10-≥-20dBmC/I co-channel at 0.1% BER (b) (c)π/4 DQPSK --TBD 13≤13dB8DPSK --TBD 21≤21dBAdjacentchannel selectivity C/I (b)(c) F = F 0 + 1MHzπ/4 DQPSK --TBD 0≤0dB8DPSK --TBD 5≤5dBF = F 0 - 1MHzπ/4 DQPSK --TBD 0≤0dB8DPSK --TBD 5≤5dBF = F 0 + 2MHzπ/4 DQPSK --TBD -30≤-30dB8DPSK --TBD -25≤-25dBF = F 0 - 2MHzπ/4 DQPSK --TBD -20≤-20dB 8DPSK --TBD -13≤-13dBF = F 0 + 3MHzπ/4 DQPSK --TBD -40≤-40dB8DPSK --TBD -33≤-33dBF = F 0 - 5MHzπ/4 DQPSK --TBD -40≤-40dB8DPSK --TBD -33≤-33dBF = F Imageπ/4 DQPSK --TBD -7≤-7dB8DPSK --TBD 0≤0dB(a)Dirty transmitter is used.(b)CSR8670 BGA is guaranteed to meet the C/I performance specified by the Bluetooth v3.0 RF Test Specification.(c)Measured at F 0 = 2441MHz, F Image = F 0 - 3MHz.`poUSTM=_d^ Performance Specification3.2.2Temperature -30°C Radio Characteristics, VDD = 1.5V Modulation Min Typ Max BluetoothSpecification UnitSensitivity at 0.01% BER (a)Ch 0π/4 DQPSK --93-70≤-70dBmCh 39π/4 DQPSK --94-70Ch 78π/4 DQPSK --94-70Ch 08DPSK --85-70≤-70dBmCh 398DPSK --85-70Ch 788DPSK --85-70Maximum received signal at 0.1%BER (a)π/4 DQPSK -20>-8-≥-20dBm 8DPSK -20>-10-≥-20dBm(a)Dirty transmitter is used.Note:CSR does not guarantee the 8DPSK sensitivity performance below -20ºC. A temporary state of -65dBm is observed.3.2.3Temperature 85°C Radio Characteristics, VDD = 1.5VModulation Min Typ Max BluetoothSpecification UnitSensitivity at 0.01% BER (a)Ch 0π/4 DQPSK --90-70≤-70dBmCh 39π/4 DQPSK --92-70Ch 78π/4 DQPSK --92-70Ch 08DPSK --80-70≤-70dBmCh 398DPSK --83-70Ch 788DPSK --83-70Maximum received signal at 0.1%BER (a)π/4 DQPSK -20>-8-≥-20dBm 8DPSK -20>-10-≥-20dBm(a)Dirty transmitter is used.`poUSTM=_d^ Performance Specification4Typical Radio Performance: Basic Data RateImportant Note:Results were obtained using CSR's evaluation circuit.4.1Transmitter PerformanceFigure 4.1: Maximum Transmit Power vs Temperature (20 DH5 Packets)Note:Output power temperature compensation was disabled. Performance measured at single-ended port of the CSR8670 BGA.Typical Radio Performance: Basic Data Rate`poUSTM=_d^ Performance SpecificationFigure 4.2: Firmware Controlled Transmit Power vs Temperature (20 DH5 Packets) Note:Output power temperature compensation was enabled.Figure 4.3: Transmit Power Variation and Mean vs Channel (20 DH5 Packets)`poUSTM=_d^ Performance SpecificationFigure 4.4: -20dB Bandwidth vs Temperature (DH5 Packets)Figure 4.5: Adjacent Channel Transmit Power Variation and Mean vs Channel (DH1 Packets) at -30°C `poUSTM=_d^ Performance SpecificationFigure 4.6: Adjacent Channel Transmit Power Variation and Mean vs Channel (DH1 Packets) at 20°CFigure 4.7: Adjacent Channel Transmit Power Variation and Mean vs Channel (DH1 Packets) at 85°C`poUSTM=_d^ Performance SpecificationFigure 4.8: Frequency Deviation Δf1avg vs Temperature (10 DH5 Packets)Figure 4.9: Frequency Deviation Δf2max vs Temperature (10 DH5 Packets)`poUSTM=_d^ Performance SpecificationFigure 4.10: Modulation Ratio (Δf2avg/Δf1avg) vs Temperature (20 DH5 Packets)Figure 4.11: ICFT vs Temperature `poUSTM=_d^ Performance SpecificationFigure 4.12: Carrier Frequency Drift for 10 DH1 Packets vs TemperatureFigure 4.13: Carrier Frequency Drift for 10 DH3 Packets vs Temperature`poUSTM=_d^ Performance SpecificationFigure 4.14: Carrier Frequency Drift for 10 DH5 Packets vs TemperatureFigure 4.15: Carrier Frequency Drift Rate vs Temperature (10 Packets, All Packet types)`poUSTM=_d^ Performance SpecificationFigure 4.16: Spectrum (Loopback DH1 Packets with TPN9 Payload)Figure 4.17: DH5 Burst Power vs Time`poUSTM=_d^ Performance Specification4.2Receiver PerformanceFigure 4.18: Receive Sensitivity vs Temperature (595 DH5 Packets, Dirty Tx. ON, Hopping OFF)Figure 4.19: Receive Sensitivity Variation and Mean vs Channel `poUSTM=_d^ Performance Specification5Typical Radio Performance: Enhanced Data Rate5.1Transmitter PerformanceFigure 5.1: π/4DQPSK Relative Transmit Power vs Temperature (10 2-DH5 Packets)Figure 5.2: 8DPSK Relative Transmit Power vs Temperature (10 3-DH5 Packets)Typical Radio Performance: Enhanced Data Rate`poUSTM=_d^ Performance SpecificationFigure 5.3: π/4DQPSK Absolute Block Frequency Error, ωovs Temperature (200 2-DH5 Blocks)Figure 5.4: π/4DQPSK Absolute Initial Frequency Error, ωi vs Temperature (200 2-DH5 Blocks)`poUSTM=_d^ Performance SpecificationFigure 5.5: π/4DQPSK Absolute Total Frequency Error, (ωo+ωi) vs Temperature (200 2-DH5 Blocks)Figure 5.6: 8DPSK Absolute Block Frequency Error, ωo vs Temperature (200 3-DH5 Blocks)`poUSTM=_d^ Performance SpecificationFigure 5.7: 8DPSK Absolute Initial Frequency Error, ωi vs Temperature (200 3-DH5 Blocks)Figure 5.8: 8DPSK Absolute Total Frequency Error, (ωo+ωi) vs Temperature (200 3-DH5 Blocks)`poUSTM=_d^ Performance SpecificationFigure 5.9: π/4DQPSK RMS DEVM vs Temperature (200 2-DH5 Blocks)Figure 5.10: π/4DQPSK Peak DEVM vs Temperature (200 2-DH5 Blocks)`poUSTM=_d^ Performance SpecificationFigure 5.11: 8DPSK RMS DEVM vs Temperature (200 2-DH5 Blocks)Figure 5.12: 8DPSK Peak DEVM vs Temperature (200 3-DH5 Blocks)`poUSTM=_d^ Performance SpecificationFigure 5.13: Adjacent Channel Transmit Power Variation and Mean vs Channel (2-DH5 Packets) at 20°CFigure 5.14: Adjacent Channel Transmit Power Variation and Mean vs Channel (3-DH5 Packets) at 20°C `poUSTM=_d^ Performance SpecificationFigure 5.15: Adjacent Channel Transmit Power Variation and Mean vs Channel (2-DH5 Packets) at -30°CFigure 5.16: Adjacent Channel Transmit Power Variation and Mean vs Channel (3-DH5 Packets) at -30°C `poUSTM=_d^ Performance Specification5.2Receiver PerformanceFigure 5.17: π/4DQPSK Receive Sensitivity Variation vs Channel (2-DH5 Loopback, 16Mbits, Dirty Tx. ON, HoppingOFF)Figure 5.18: π/4DQPSK Receive Sensitivity vs Temperature (2-DH5 Loopback, 16Mbits, Dirty Tx. ON, Hopping OFF)`poUSTM=_d^ Performance SpecificationFigure 5.19: 8DPSK Receive Sensitivity Variation vs Channel (3-DH5 Loopback, 16Mbits, Dirty Tx. ON, HoppingOFF)Figure 5.20: 8DPSK Receive Sensitivity vs Temperature (3-DH5 Loopback, 16Mbits, Dirty Tx. ON, Hopping OFF)`poUSTM=_d^ Performance Specification6Document ReferencesDocumentReference, Date CSR8670 BGA Data SheetCS-127997-DSBluetooth Specification Version 3.0 + HSVersion 3.0 + HS [Vol 0 to Vol 5], 21 April 2009Test Suite Structure (TSS) and Test Purposes (TP)System Specification 1.2/2.0/2.0 + EDR/ 2.1/2.1 + EDR/3.0/3.0 + HSRF.TS/3.0.H.1, 06 August 2009Document References`poUSTM=_d^ Performance SpecificationTerms and DefinitionsTerm Definition8DPSK8-phase Differential Phase Shift Keyingπ/4 DQPSKπ/4 rotated Differential Quaternary Phase Shift KeyingACP Adjacent Channel PowerBER Bit Error RateBlueCore®Group term for CSR’s range of Bluetooth wireless technology ICsBluetooth®Set of technologies providing audio and data transfer over short-range radio connectionsC/I Carrier over InterfererCDMA Code Division Multiple AccessCSR Cambridge Silicon RadiodBm Decibels relative to 1mWDCS Digital Communications SystemDEVM Differential Error Vector MagnitudeEDR Enhanced Data RateGPS Global Positioning SystemGSM Global System for Mobile communicationsIC Integrated CircuitICFT Initial Carrier Frequency ToleranceQFN Quad-Flat No-leadRF Radio FrequencyW-CDMA Wideband Code Division Multiple AccessTerms and DefinitionsCS-203853-SPP1Preliminary Information© Cambridge Silicon Radio 2011This Material is Subject to CSR's Non-Disclosure AgreementPage 41 of 41`poUSTM=_d^Performance Specification。
“神龙一号”直线感应加速器物理设计

第15卷 第5期强激光与粒子束Vol.15,No.5 2003年5月HIGH POWER LASER AND PAR TICL E B EAMS May,2003 文章编号: 100124322(2003)0520502203“神龙一号”直线感应加速器物理设计Ξ邓建军1,2, 丁伯南2, 王华岑2, 戴光森2, 程念安2, 章林文2, 张开志2, 戴志勇2, 石金水2(1.清华大学工程物理系,北京100084; 2.中国工程物理研究院流体物理研究所,四川绵阳621900) 摘 要: 介绍了“神龙一号”直线感应加速器物理设计的主要考虑。
“神龙一号”加速器是一台电子直线感应加速器,由3.6MeV感应迭加型注入器、72个感应加速腔、脉冲功率系统、束流输运和聚焦系统、控制系统和真空、绝缘油、绝缘气体以及去离子水系统组成。
能产生20MeV、束流大于2.5kA,脉冲宽度为60ns的强流脉冲电子束,X光焦斑均方根直径为1.5mm。
关键词: 直线感应加速器; 脉冲功率; 束流输运和聚焦; 物理设计 中图分类号: TL53 文献标识码: A 近年来随着闪光照相对分辨率的要求不断提高,为获得更小的焦斑,对电子束品质的要求也越来越高,促进了直线感应加速器(L IA)技术的快速发展;1999年底法国和美国相继建成了直线感应加速器A IRIX[1]和双轴流体动力学试验设备的第一轴DARHT2I[2],美国还正在建造能进行四幅照相的第二轴DARHT2II,预计2004年完成,届时DARHT2II能在2μs内进行四个时刻的闪光照相实验[3]。
英国原子武器研究中心(AWE)也计划建造能进行五个方向照相的五台感应叠加器,并正在建造其中的一台[4]。
本文主要介绍正在中国工程物理研究院流体物理研究所研制的“神龙一号”直线感应加速器的物理设计。
1 “神龙一号”直线感应加速器主要技术指标 “神龙一号”(Dragon2I)L IA是一台能量为20MeV,束流大于2.5kA,脉冲宽度为60ns,焦斑均方根直径为1.5mm的强流脉冲电子直线感应加速器,它利用的是电磁感应原理[5],由一台3.6MeV注入器、72个加速腔组成的加速段、脉冲功率系统、束流输运系统、控制系统及辅助系统组成,表1给出了其总体设计指标及与国内外同类装置指标的对比,括号内为实际达到的束流。
基于半实物仿真平台的通用无人机系统模拟器设计
软件工程 SOFTWARE ENGINEERING 第24卷第6期2021年6月V ol.24 No.6Jun. 2021文章编号:2096-1472(2021)-06-57-05DOI:10.19644/ki.issn2096-1472.2021.06.014基于半实物仿真平台的通用无人机系统模拟器设计倪怡涛1,李俊杰2,李晓明1(1.浙江理工大学机械与自动控制学院,浙江 杭州 310018;2.北京航天测控技术有限公司,北京 100043)****************;********************;****************.cn摘 要:无人机本身是一个复杂的机电系统,是机械、电子、通讯、控制、信息等技术的高度融合体,如何模拟无人机单元是这些系统开发的一个重要课题。
本文提出了基于通用半实物仿真平台的无人机模拟方案,与传统的数学模型或数据驱动模型方案相比,该模拟方案更接近真实系统,更容易模拟各种故障,同时也更容易与真实系统进行替换,方便系统整体的开发、测试与运行。
提出的模拟器方案基于单元模拟,通过对无人机系统内各个单元的数据交互和通讯协议进行抽象,以真实的接口实现单元之间的数据交互,将无人机飞行模型仿真单元嵌入系统中,实现最大程度接近真机的模拟。
测试表明,该模拟方案不但可以用于总体系统的开发和调试,而且对无人机自身的研制、测试等起到了关键作用。
关键词:无人机系统;组件;仿真;通讯中图分类号:TP311.5 文献标识码:ADesign of Universal UA V System Simulator based onSemi-physical Simulation PlatformNI Yitao 1, LI Junjie 2, LI Xiaoming 1(1.Faculty of Mechanical Engineering and Automation , Zhejiang Sci -Tech University , Hangzhou 310018, China ;2.Beijing Aerospace T&C Technology Co . LTD ., Beijing 100043, China )****************;********************;****************.cnAbstract: Unmanned Aerial Vehicle (UA V), a complex electromechanical system, is a high integration of machinery, electronics, communication, control, information and other technologies. How to simulate the UA V unit is an important topic in developing these systems. This paper proposes a UA V simulation solution based on semi-physical simulation platform. Compared with traditional mathematical model or data-driven model program, the simulation solution is closer to the real system, easier to simulate various faults, and easier to match the real system. The system facilitates the overall development, testing and operation of the system. The unit-based simulator solution proposed realizes data interaction between units by abstracting data interaction and communication protocol of each unit in the UA V system with a real interface. UA V flight model simulation unit is embedded in the system to realize the simulation as close as possible to the real machine. Tests show that the simulation solution proposed can not only be used for development and debugging of the overall system, but also play a key role in the development and testing of the UA V itself.Keywords: UA V system; component; simulation; communication1 引言(Introduction)无人机已广泛应用于航空、航天、测控和勘探等领域,其开发测试技术和流程越来越精细和复杂,无人机系统的仿真模拟技术应运而生。
布雷维尼BRevini流体 样本资料 之 萨姆SAM SH11C马达 类A2FM马达

Case drain pressure: Maximum permissible case drain pressure is 10 bar [145 psi]. A higher pressure can damage the main shaft seal or reduce its life.
Temperature ranges: The operating temperature of the oil must be within -25ºC÷ 115ºC [-13ºF ÷ 239ºF]. For applications with lower temperatures please contact S.A.M. Hydraulik S.p.A.
Filtering: A correct filtering is essential for long and satisfactory life of axial piston units. In order to ensure a correct functioning of the unit, the max. permissible contamination class is 21/19/16 according to ISO 4406:1999.
Le unità della serie SH11C sono una famiglia di pompe e motori a pistoni assiali, a corpo inclinato, a cilindrata fissa, progettati per operare sia in circuito chiuso che in circuito aperto. Il distributore a superficie sferica, l'accurata lavorazione e l'alta qualità dei materiali e dei componenti usati, consentono alle unità della serie SH11C di lavorare fino a 430 bar in continuo e di sopportare picchi di 480 bar. Provati in laboratorio e sperimentati sul campo queste unità hanno dimostrato una lunga durata di esercizio con elevati rendimenti. Il supporto dell'albero, realizzato mediante cuscinetti a rotolamento, è dimensionato in modo da sopportare elevati carichi assiali e radiali. La versatilità delle serie SH11C, comprendente vari coperchi, alberi di uscita e valvole flangiabili, consente a queste unità di essere idonee alle diverse tipologie di impianto, sia nel settore mobile che in quello industriale. Le unità a pistoni SH11C sono disponibili in versione ISO e in versione SAE.
捷达车实测排放因子和MOBILE6预测值的对比分析
捷达车实测排放因子和MOBILE6预测值的对比分析A Comparitive Analysis of Real-World Emission Factors and MOBILE 6for Jieda万涛,于雷,裴文文,宋国华(北京交通大学运输学院,北京100044)WAN Tao ,YU Lei ,PEI Wen-wen ,SONG Guo-hua (Schooi of Traffic and Transportation ,Beijing Jiaotong University ,Beijing 100044,China )摘要:OEM 是最新的基于车辆实际行驶路况的车载尾气检测系统,文中利用OEM 在实际道路上对不同捷达车的实时尾气排放进行测量,得到10天测试车辆每秒的尾气排放数据,并利用数据库统计、排放数据匹配行驶周期等方法,计算出每天的平均尾气排放因子。
同时使用了美国的MOBILE6软件,确定相对应的输入参数,得到相应排放因子。
最终将两者进行比较分析,探讨MOBILE6在中国的适用性。
关键词:排放因子;OEM ;MOBILE 中图分类号:X831.03文献标识码:A文章编号:1006-4281(2005)02-0011-04Abstract :OEM is a new on-board emission measurement system based on reai-worid driving and traffic conditions.This paper presents OEM ’s appiications to measuring emissions of Jieda vehicies in 10days.It used database statistics technigues and emission matching to driving cycies to derive average emission factors of each day.Then ,MOBILE6is used to derive corresponding emission factors by adjusting necessary input parameters.Finaiiy ,the resuits from MOBILE6and reai-worid OEM testing are compared and anaiyzed and the appiicabiiity of MOBILE6in China is discussed.Key words :Emission factor ;OEM ;MOBILE收稿日期:2005-01-14基金项目:国家自然科学基金(50378003);教育部博士点基金(20020004010);北京市科委项目(*************);北京交通大学校科技基金资助(2002SM016)作者简介:万涛(1979-),男,江苏人,在读硕士生。
利用神经网络估算汽车风阻系数
038
AUTO DRIVING & SERVICE 2021 . 08-09
学术 | 制造研究
ACADEMIC
图 1 神经网络算法流程
2 网络计算参数设置
由式(1)可知,要求解风阻系数 Cd,主要跟迎风面积 A、 汽车测试质量 m、滚动阻力系数 f、行驶阻力 F 和加速度阻力等 变量有关。本文研究方法中,暂不考虑滚动阻力系数的差异 ;而 且由于实际行驶阻力通过自由滑行法测得,故也不考虑加速阻力。 因此采用滑行法得出的基本行驶阻力为 :
1 神经网络算法
神经网络是指用大量的计算单元(类比为神经元)构成的非 线性系统,一定程度上模仿了人脑神经系统的信息处理、存储和 检索功能,是对人脑神经网络的某种简化、抽象和模拟 [2]。该算 法特点主要是可以根据输入与输出的数据,按照其网络学习规则, 通过学习训练可以解决一些传统方法难以解决的问题。但如果要 保证其计算精度,需要依赖一定的数据量。在企业中,具有丰富 的开发经验和数据累计,故该方法是具备在企业中使用条件的。 神经网络算法计算流程如图 1 所示。
with Neural Network
Chen Wen、Wei Zuwu、Wei Liuquan
(SAIC GM Wuling Automobile Co.,Ltd.,Liuzhou 545000,China)
Absrtact :Automobile wind resistance is one of the important indicators of the vehicle,its direct impact on vehicle driving resistance,for the industry energy conservation and emissions reduction,target setting of automobile wind resistance coefficient has been one of the important indexes in the early stage. At the beginning of the development,understanding of the related design index,setting a directed target of the designed car,engineering obtains the wind resistance coefficient by CFD simulation with modelling,and provide optimization scheme according to the designed target,but the standard car wind resistance often obtain by wind tunnel test which needs certain time and even high cost. This paper suggests a method to estimate the drag coefficient of automobile based on neural network which is a fast and easy method to realize. Key words :wind resistance coefficient ;neural network ;driving resistance
ESD5500E,美国GAC电子调速器,说明书
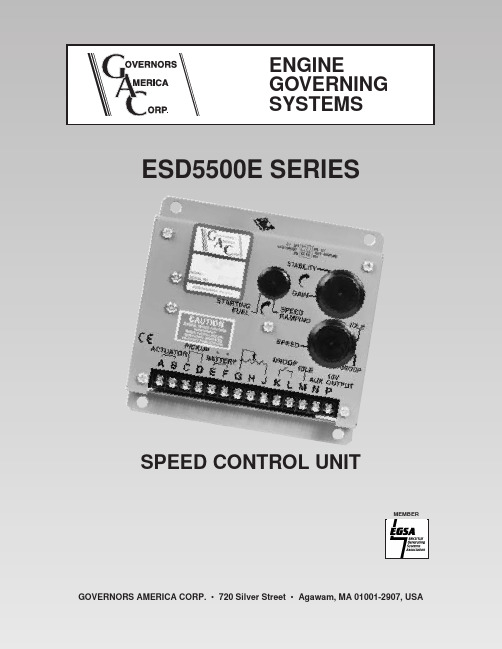
MEMBERJUNE 2000MPCPRODUCT TECHNICAL INFORMATIONESD5500E SERIES SPEED CONTROL UNITPTI 1002EINTRODUCTIONThe ESD5500E Series speed control unit is an all electronic device designed to control engine speed with fast and precise response to transient load changes. This closed loop control,when connected to a proportional electric actuator and sup-plied with a magnetic speed sensor signal, will control a wide variety of engines in an isochronous or droop mode. It is designed for high reliability and built ruggedly to withstand the engine environment.Simplicity of installation and adjustment was foremost in the design. Non-interacting performance controls allow near opti-mum response to be easily obtained.The primary features of the ESD5500E Series speed control unit are the engine STARTING FUEL and SPEED RAMPING adjustments. The use of these features will minimize engine exhaust smoke experienced prior to attaining engine operat-ing speed.Other features include adjustable droop and idle operation,inputs for accessories used in multi-engine or special applica-tions, protection against reverse battery voltage, transient voltages, accidental short circuit of the actuator and fail safe design in the event of loss of speed sensor signal or battery supply.The ESD5500E Series speed control unit is compatible with all GAC proportional actuators except the ACB2000 electric actuator. When the ESD5500E Series speed control unit is used with a ADC100 Series electric actuator, the DROOP adjustment range will be less due to this actuator's low current demand.DESCRIPTIONEngine speed information for the speed control unit is usually received from a magnetic speed sensor. Any other signal generating device may be used provided the generated fre-quency is proportional to engine speed and meets the voltage input and frequency range specification. The speed sensor is typically mounted in close proximity to an engine driven ferrous gear, usually the engine ring gear. As the teeth of the gear pass the magnetic sensor, a signal is generated which is propor-tional to engine speed.Signal strength must be within the range of the input amplifier.An amplitude of 0.5 to 120 volts RMS is required to allow the unit to function within its design specifications. The speed signal is applied to Terminals C and D of the speed control unit.Between these terminals there is an input impedance of over 33,000 ohms. Terminal D is internally connected to Terminal E, battery negative. Only one end of the shielded cable should be connected.When a speed sensor signal is received by the controller, the signal is amplified and shaped by an internal circuit to provide an analog speed signal. If the speed sensor monitor does not detect a speed sensor signal, the output circuit of the speed control unit will turn off all current to the actuator.A summing circuit receives the speed sensor signal along with the speed adjust set point input. The speed range has a ratio of 8:1 and is adjusted with a 25 turn potentiometer. The output from the summing circuit is the input to the dynamic control section of the speed control unit. The dynamic control circuit,of which the gain and stability adjustments are part, has a control function that will provide isochronous and stable per-formance for most engine types and fuel systems.The speed control unit circuit is influenced by the gain and stability performance adjustments. The governor system sen-sitivity is increased with clockwise rotation of the gain adjust-ment. The gain adjustment has a range of 33:1. The stability adjustment, when advanced clockwise, increases the time rate of response of the governor system to match the various time constants of a wide variety of engines. The speed control unit is a P I D device, the “D”, derivative portion can be varied when required. (See Instability section.)During the engine cranking cycle, STARTING FUEL can be adjusted from an almost closed, to a nearly full fuel position.Once the engine has started, the speed control point is determined, first by the IDLE speed set point and the SPEED RAMPING circuit. After engine speed ramping has been completed, the engine will be at its governed operating speed.At the desired governed engine speed, the actuator will be energized with sufficient current to maintain the desired en-gine speed, independent of load (isochronous operation).The output circuit provides switching current at a frequency of about 500 Hz. to drive the actuator. Since the switching frequency is well beyond the natural frequency of the actuator,there is no visible motion of the actuator output shaft. Switch-ing the output transistors reduces its internal power dissipation for efficient power control. The output circuit can provide current of up to 10 amps continuous at 25˚C for 12 and 24 VDC battery systems. The actuator responds to the average current to position the engine fuel control lever.In standard operation, the speed control unit performance is isochronous. Droop governing can be selected by connecting terminals K and L and the percent of droop governing can be varied with the droop adjustment control. The droop range can be decreased by connecting Terminals G and H.The speed control unit has several performance and protec-tion features which enhance the governor system. A speed anticipation circuit minimizes speed overshoot on engine start-up or when large increments of load are applied to the engine.Engine idle speed can be remotely selected and is adjustable.Accessory inputs to achieve variable speed operation and multi-engine control can be accepted by the ESD5500E Series speed control unit from GAC load sharing modules, automatic synchronizers, ramp generators and other accessory engine control modules. Protection against reverse battery voltage and transient voltages is provided. The design is fail-safe in the event of loss of speed sensor signal or battery supply.ESD 5500E SERIES SPEED CONTROL UNITSESD 5500E..........................................Standard Unit ESD 5520E................Suitable for low inertia actuatorsSPECIFICATIONSPERFORMANCEIsochronous Operation/Steady State Stability ........................................................................................ ± 0.25% or better Speed Range/Governor ............................................................................................................... 1K–7.5K Hz continuous Speed Drift with Temperature .................................................................................................................... ± 1% Maximum Idle Adjust CW ....................................................................................................................................... 60% of set speed Idle Adjust CCW ................................................................................................................................. Less than 1200 Hz.Droop Range ...................................................................................................................................... 1 – 5% regulation* Droop Adj. Max. (K-L Jumpered) ............................................................................. 400 Hz., ± 75 Hz. per 1.0 A change Droop Adj. Min. (K-L Jumpered) .................................................................................. 15 Hz., ± 6 Hz. per 1.0 A change Speed Trim Range .............................................................................................................................................. ± 200 Hz.Remote Variable Speed Range ..................................................................................... 500 – 7.5 Hz. or any part thereof Terminal SensitivityJ .................................................................................................... 100 Hz., ± 15 Hz / Volt @ 5.0 K ImpedanceL ..................................................................................................... 735 Hz., ± 60 Hz / Volt @ 65 K ImpedanceN ................................................................................................ 148 Hz., ± 10 Hz / Volt @ 1 Meg. ImpedanceP ....................................................................................................................... 10 VDC Supply @ 20 ma Max.ENVIRONMENTALAmbient Operating Temperature Range ......................................................................... -40˚ to +180˚F (-40˚ to +85˚C) Relative Humidity ............................................................................................................................................. up to 95% All Surface Finishes ............................................................................................. Fungus Proof and Corrosion Resistant INPUT POWERSupply ..................................................... 12 or 24 VDC Battery Systems (Transient and Reverse Voltage Protected)** Polarity ........................................................................................................................ Negative Ground (Case Isolated) Power Consumption .......................................................................................... 50 ma continuous plus actuator current Actuator Current Range @ 77°F (25°C) - (Inductive Load) ....................... Min. 2.5 Amps ...... Max. 10 Amps continuous*** Speed Sensor Signal ........................................................................................................................... 0.5–120 Volts RMSRELIABILITYVibration ................................................................................................................................................ 1G @ 20–100 Hz.Testing ...................................................................................................................................... 100% Functionally TestedPHYSICALDimensions ................................................................................................................................. See Outline (FIGURE 1) Weight ............................................................................................................................................... 1.2 lbs (545 grams) Mounting ........................................................................................................................ Any Position, Vertical Preferred*Droop is based on a speed sensor frequency of 4000 Hz. and an actuator current change of 1 amp from no loadto full load. Applications with higher speed sensor signals will experience less percentage of droop. Applicationswith more actuator current change will experience higher percentages of droop. See droop description for specificdetails on operation of droop ranges. When used with the ADC100 actuator the droop percentage will be less dueto the actuators low current consumption.**Protected against reverse voltage by a series diode. A 15 amp fuse must be installed in the positive battery lead.***Protected against short circuit to actuator (shuts off current to actuator), unit automatically turns back on whenshort is removed.DIAGRAM 1. ESD5500E Series Wiring Diagram and OutlineWARNINGAn overspeed shutdown device, independent of the governor system, should be provided to prevent loss of engine control which may cause personal injury or equipment damage. Do not rely exclusively on the governor system electric actuator to prevent overspeed.A secondary shutoff device, such as a fuel solenoid must be used.APPLICATION AND INSTALLATIONINFORMATIONThe speed control unit is rugged enough to be placed in a control cabinet or engine mounted enclosure with other dedi-cated control equipment. If water, mist, or condensation may come in contact with the controller, it should be mounted vertically. This will allow the fluid to drain away from the speed control unit.Extreme heat should be avoided.B. Rotate the STABILITY adjustment clockwise until instabil-ity develops. Gradually move the adjustment counterclock-wise until stability returns. Move the adjustment one division further to insure stable performance.C. Gain and stability adjustments may require minor changes after engine load is applied. Normally, adjustments made at no load achieve satisfactory performance. A strip chart recorder can be used to further optimize the adjustments.If instability cannot be corrected or further performance im-provements are required, refer to the section on SYSTEM TROUBLESHOOTING .Starting Fuel AdjustmentThe engine’s exhaust smoke at start-up can be minimized by completing the following adjustments.1. Place the engine in idle by connecting Terminals M & G.2. Adjust the IDLE speed for as low a speed setting as the application allows.3. Adjust the STARTING FUEL CCW until the engine speed begins to fall. Increase the STARTING FUEL slightly so that the idle speed is returned to the desired level.4. Stop the engine.One of two methods of operation for the ESD5500E may now be selected.Method 1: Start the engine and accelerate directly to the operating speed (Gen Sets, etc.).orMethod 2: Start the engine and control at an idle speed for a period of time prior to accelerating to the operating speed. This method separates the starting process so that each may be optimized for the lowest smoke emissions.Method 1Remove the connection between Terminals M & G. Start the engine and adjust the SPEED RAMPING for the least smoke on acceleration from idle to rated speed. If the starting smoke is excessive, the STARTING FUEL may need to be adjusted slightly CCW. If the starting time is too long, the STARTING FUEL may need to be adjusted slightly CW.Method 2Replace the connection between Terminals M & G with a switch, usually an oil pressure switch. Start the engine. If the starting smoke is excessive, the STARTING FUEL may need to be adjusted slightly CCW. If the starting time is too long, the STARTING FUEL may need to be adjusted slightly CW.When the switch opens, adjust the SPEED RAMPING for the least amount of smoke when accelerating from idle speed to rated speed.WIRINGBasic electrical connections are illustrated in Diagram 1.Actuator and battery connections to Terminals A, B, E, and F should be #16 AWG (1.3 mm sq.) or larger. Long cables require an increased wire size to minimize voltage drops.The battery positive (+) input, Terminal F, should be fused for 15 amps as illustrated.Magnetic speed sensor connections to Terminals C and D MUST BE TWISTED AND/OR SHIELDED for their entire length. The speed sensor cable shield should be ideally connected to terminal D. The shield should be insulated to insure no other part of the shield comes in contact with engine ground, otherwise stray speed signals may be introduced to the speed control unit. With the engine stopped, adjust the gap between the magnetic speed sensor and the ring gear teeth.The gap should not be any smaller than 0.020 in. (0.45 mm).Usually, backing out the speed sensor 3/4 turn after touching the ring gear tooth will achieve a satisfactory air gap. The magnetic speed sensor voltage should be at least 1 VAC RMS during cranking.ADJUSTMENTSBefore Starting EngineCheck to insure the GAIN and STABILITY adjustments, and if applied, the external SPEED TRIM CONTROL are set to mid position.Preset the ESD5500E as follows:STARTING FUEL ................ FULL CW (Maximum Fuel) SPEED RAMPING .............. FULL CCW ( Fastest)Start EngineThe speed control unit governed speed setting is factory set at approximately engine idle speed. (1000 Hz., speed sensor signal)Crank the engine with DC power applied to the governor system. The actuator will energize to the maximum fuel position until the engine starts. The governor system should control the engine at a low idle speed. If the engine is unstable after starting, turn the GAIN and STABILITY adjustments counterclockwise until the engine is stable.Governor Speed SettingThe governed speed set point is increased by clockwise rotation of the SPEED adjustment control. Remote speed adjustment can be obtained with an optional 5K Speed Trim Control. (See Diagram 1.)Governor PerformanceOnce the engine is at operating speed and at no load, the following governor performance adjustment can be made.A. Rotate the GAIN adjustment clockwise until instability develops. Gradually move the adjustment counterclockwise until stability returns. Move the adjustment one division further counterclockwise to insure stable performance.Idle Speed SettingIf the IDLE speed setting was not adjusted as detailed in “Starting Fuel Adjustment” section, then place the optional external selector switch in the IDLE position. The idle speed set point is increased by clockwise rotation of the IDLE adjustment control. When the engine is at idle speed, the speed control unit applies droop to the governor system to insure stable operation.Speed Droop OperationDroop is typically used for the paralleling of engine driven generators.Place the optional external selector switch in the DROOP position, DROOP is increased by clockwise rotation of the DROOP adjustment control. When in droop operation, the engine speed will decrease as engine load increases. The percentage of droop is based on the actuator current change from engine no load to full load. A wide range of droop is available with the internal control. Droop level requirements above 10% are unusual.If droop levels experienced are higher or lower than those required, contact the factory for assistance.After the droop level has been adjusted, the rated engine speed setting may need to be reset. Check the engine speed and adjust the speed setting accordingly.Accessory InputThe AUX ilary Terminal N accepts input signals from load sharing units, auto synchronizers, and other governor system accessories, GAC accessories are directly connected to this terminal. It is recommended that this connection from acces-sories be shielded as it is a sensitive input terminal.If the auto synchronizer is used alone, not in conjunction with a load sharing module, a 3 M ohm resistor should be con-nected between Terminals N and P. This is required to match the voltage levels between the speed control unit and the synchronizer.When an accessory is connected to Terminal N, the speed will decrease and the speed adjustment must be reset.When operating in the upper end of the control unit frequency range, a jumper wire or frequency trim control may be required between Terminals G and J. This increases the frequency range of the speed control to over 7000 Hz.Accessory SupplyThe + 10 volt regulated supply, Terminal P, can be utilized to provide power to GAC governor system accessories. Up to 20 ma of current can be drawn from this supply. Ground reference is Terminal G. Caution: a short circuit on this terminal can damage the speed control unit.Wide Range Remote Variable Speed Operation Simple and effective remote variable speed can be obtained with the ESD5500E Series control unit.A single remote speed adjustment potentiometer can be used to adjust the engine speed continuously over a specific speed range. Select the desired speed range and the corresponding potentiometer value. (Refer to TABLE 1.) If the exact range cannot be found, select the next higher range potentiometer. An additional fixed resistor may be placed across the potenti-ometer to obtain the exact desired range. Connect the speed range potentiometer as shown in Diagram 2.To maintain engine stability at the minimum speed setting, a small amount of droop can be added using the DROOP adjustment. At the maximum speed setting the governor performance will be near isochronous, regardless of the droop adjustment setting.Contact the factory for assistance if difficulty is experienced in obtaining the desired variable speed governing performance.TABLE 1. Variable Speed Range Potentiometer Value Speed Range Potentiometer Value900 Hz. 1K2,400 Hz. 5K3,000 Hz.10K3,500 Hz.25K3,700 Hz.50KDIAGRAM 2.*Select Proper Potentiometer Value from Table 1.G J K LSYSTEM TROUBLESHOOTINGSYSTEM INOPERATIVEIf the engine governing system does not function, the fault may be determined by performing the voltage tests described in Steps 1, 2, 3, and 4. (+) and (-) refer to meter polarity. Should normal values be indicated as a result of following the trouble shooting steps, the fault may be with the actuator or the wiring to the actuator. See the actuator publication for testing details.STEPTERMINALSNORMAL READINGPROBABLE CAUSE OF ABNORMAL READING1F(+) & E(-)Battery Supply Voltage (12 or 24 VDC)1. DC battery power not connected. Check for blown fuse.2. Low battery voltage.3. Wiring error.2 C & D 1.0 VAC RMS min., while cranking1. Gap between speed sensor and gear teeth too great. Check gap.2. Improper or defective wiring to the speed sensor. Resistance between terminals C and D should be 30 to 1200ohms.3. Defective speed sensor.3P(+) & G(-)10 VDC, Internal Supply1. Short on terminal P. (This will cause a defective unit.)2. Defective Speed Control.4F(+) & A(-) 1.0 - 2.0 VDC while cranking1. SPEED adjustment set too low.2. Short/open in actuator wiring.3. Defective speed control.4. Defective actuator. See Actuator Troubleshooting.UNSATISFACTORY PERFORMANCEIf the governing system functions poorly, perform the following tests.TEST1. Do not crank. Apply DC power to the governor system2. Manually hold the engine at thedesired running speed. Measure the DC voltage between Terminals A (-) & F(+) on the speed control unit.1. Measure the voltage at the battery while cranking.2. Momentarily connect Terminals A and F. The actuator should move to the full fuel position.1. Measure the actuator output.Terminals A & B, while running under governor control.SYMPTOMEngine overspeedsActuator does not energize fully.Engine remains below desired governed speed.PROBABLE FAULT1. Actuator goes to full fuel. Then, disconnect speed sensor at Terminals C & D.If actuator still at full fuel – speed control unit defective. If actuator at minimum fuel position - erroneous speed signal. Check speed sensor data.1. If the voltage reading is 1.0 to2.0 VDC,a) SPEED adjustment set above desired speed. b) Defective speed control unit.2. If the voltage reading is above 2.0 VDC, a) Actuator or linkage binding.3. If the voltage reading is below 1.0 VDC, a) Defective speed control unit.4. Gain set too low.1. If the voltage is less than 7V for a 12V system, or 14V for a 24V system, replace the battery if it is weak or undersized.1. Actuator or battery wiring in error.2. Actuator or linkage binding.3. Defective actuator. See actuator troubleshooting.4. Fuse opens. Check for short in actuator or actuator wiring harness.1. If voltage measurement is within approximately 2 volts of the battery supply voltage, then fuel controlrestricted from reaching full fuel position. Possibly due to interference from the mechanical governor, carburetor spring or linkage alignment.2. Speed setting too low.SYSTEM TROUBLESHOOTINGInsufficient Magnetic Speed Sensor SignalA strong magnetic speed sensor signal will eliminate the possibility of missed or extra pulses. The speed control unit will govern well with 0.5 volts RMS speed sensor signal. A speed sensor signal of 3 volts RMS or greater at governed speed is recommended. Measurement of the signal is made at Termi-nals C and D.The amplitude of the speed sensor signal can be raised by reducing the gap between the speed sensor tip and the engine rind gear. The gap should not be any smaller than 0.020 in (0.45 mm). When the engine is stopped, back the speed sensor out by 3/4 turn after touching the ring gear tooth to achieve a satisfactory air gap.Electromagnetic Compatibility (EMC)EMI SUSCEPTIBILITY – The governor system can be ad-versely affected by large interfering signals that are conducted through the cabling or through direct radiation into the control circuits.All GAC speed control units contain filters and shielding designed to protect the units sensitive circuits from moderate external interfering sources.Although it is difficult to predict levels of interference, applica-tions that include magnetos, solid state ignition systems, radio transmitters, voltage regulators or battery chargers should be considered suspect as possible interfering sources.If it is suspected that external fields, either those that are radiated or conducted, are or will affect the governor systems operation, it is recommended to use shielded cable for all external connections. Be sure that only one end of the shields, including the speed sensor shield, is connected to a single point on the case of the speed control unit. Mount the speed control unit to a grounded metal back plate or place it in a sealed metal box.Radiation is when the interfering signal is radiated directly through space to the governing system. To isolate the gover-nor system electronics from this type of interference source, a metal shield or a solid metal container is usually effective. Conduction is when the interfering signal is conducted through the interconnecting wiring to the governor system electronics. Shielded cables and installing filters are common remedies. As an aid to help reduce the levels of EMI of a conductive nature, a battery line filter and shielded cables are conve-niently supplied by GAC in KT130. To reduce the levels of EMI of a radiated nature, a shielded container P/N CA114 can be sourced from GAC and its distributors.In severe high energy interference locations such as when the governor system is directly in the field of a powerful transmit-ting source, the shielding may require to be a special EMI class shielding. For these conditions, contact GAC application engi-neering for specific recommendations.InstabilityInstability in a closed loop speed control system can be categorized into two general types. PERIODIC appears to be sinusoidal and at a regular rate. NON-PERIODIC is a random wandering or an occasional deviation from a steady state band for no apparent reason.Switch C1 controls the “Lead Circuit” found in the ESD5500. The normal position is “ON.” Move the switch to the “OFF”position if there is fast instability in the system.Switch C2 controls an additional circuit added in the ESD5500 that is designed to eliminate fast erratic governor behavior, caused by very soft or worn couplings in the drive train between the engine and generator. The normal position is “OFF.” Move to the “ON” position if fast erratic engine behavior due to a soft coupling is experienced.The PERIODIC type can be further classified as fast or slow instability. Fast instability is a 3 Hz. or faster irregularity of the speed and is usually a jitter. Slow periodic instability is below 3 Hz., can be very slow, and is sometimes violent.If fast instability occurs, this is typically the governor respond-ing to engine firings. Raising the engine speed increases the frequency of instability and vice versa. In this case, placing switch C1 in the “OFF” position will reduce the speed control unit’s sensitivity to high frequency signals. Readjust the GAIN and STABILITY for optimum control. Should instability still be present, the removal of E1 to E2 jumper may help stabilize the engine. Post locations are illustrated in Diagram 1. Again, readjust the GAIN and STABILITY for optimum control. Inter-ference from powerful electrical signals can also be the cause. Turn off the battery chargers or other electrical equipment to see if the system disappears.Slow instability can have many causes. Adjustment of the GAIN and STABILITY usually cures most situations by match-ing the speed control unit dynamics. If this is unsuccessful, the dead time compensation can be modified. Add a capacitor from posts E2 to E3 (negative on E2). Post locations are illustrated in Diagram 1. Start with 10 mfds. and increase until instability is eliminated. The control system can also be opti-mized for best performance by following this procedure.If slow instability is unaffected by this procedure, evaluate the fuel system and engine performance. Check the fuel system linkage for binding, high friction, or poor linkage. Be sure to check linkage during engine operation. Also look at the engine fuel system. Irregularities with carburetion or fuel injection systems can change engine power with a constant throttle setting. This can result in speed deviations beyond the control of the governor system. Adding a small amount of droop can help stabilize the system for troubleshooting.NON-PERIODIC instability should respond to the GAIN con-trol. If increasing the gain reduces the instability, then the problem is probably with the engine. Higher gain allows the governor to respond faster and correct for disturbance. Look for engine misfirings, an erratic fuel system, or load changes on the engine generator set voltage regulator. If the throttle is slightly erratic, but performance is fast, move switch C1 to the “OFF” position. This will tend to steady the system.If unsuccessful in solving instability, contact the factory forassistance.。
- 1、下载文档前请自行甄别文档内容的完整性,平台不提供额外的编辑、内容补充、找答案等附加服务。
- 2、"仅部分预览"的文档,不可在线预览部分如存在完整性等问题,可反馈申请退款(可完整预览的文档不适用该条件!)。
- 3、如文档侵犯您的权益,请联系客服反馈,我们会尽快为您处理(人工客服工作时间:9:00-18:30)。
Networks
Doppler:
▪ ▪
a <= <random number> /test_pixel?HTTP1.0&t=1&size=0k
t1 = DNS + New Connection + RTT
https:///note.php?note_id=10150212498738920
▪
/articles/featured_stories/2011_03/201102_Energy_efficient
Users: mobile connectivity
Expectation
▪ ▪
Connected anywhere Prefer WIFI (faster / cheaper)
Wire-tapper
Naïve user
Wire-tapper
Users: security VS speed
▪
Full HTTPS
▪ ▪
S E C U R I T Y
Recommended, esp in Apps 200~600ms slower
▪
HTTPS everything but images
Challata security Connection type changes
Wire-tapper
Naïve user
Wire-tapper
Naïve user
Wire-tapper
Naïve user
Wire-tapper
Naïve user
Networks: larger role in performance
Challenges
▪ ▪
Detailed network performance measurement in production TCP throughput
Networks: measurement
Doppler measures:
▪
Pipelining to handle long pages
▪ ▪
Minimum DOM changes or changes in idle for smoothness DOM recycle
▪
Use CSS key frames instead of iScroll *
▪
Tradeoff between memory and performance
▪ ▪ ▪ ▪
DNS resolution TCP connection setup (3way-handshake) Round trip time (RTT) TCP throughput
https:///note.php?note_id=10150212498738920
▪ ▪
protected from
ost attacks
can reveal certain usage pattern
S P E E D
▪
HTTPS on domains with cookies only
▪ ▪
protection against wiretapping vulnerable to man-in-the-middle attack
A call from the carrier…
Chat in action
/articles/featured_stories/2011_03/201102_Energy_efficient
Users: power consumption
Burst in transmission Prompt in ending connection
a <= <random number> /test_pixel?HTTP1.0&t=1&size=0k /test_pixel?HTTP1.1&t=2&size=0k /test_pixel?HTTP1.1&t=3&size=0k /test_pixel?HTTP1.1&t=4&size=10k
Users: Scrolling
Measurement
▪
TouchMove event firing frequency
▪ ▪
Rough approximation Values different or different browsers (iOS/Android)
Performance
▪
Full HTTP
▪
Vulnerable to all attacks
Users: Scrolling
Experience
▪ ▪ ▪
Paging Scrolling Infinite Scroll
Challenges
▪ ▪
Very very tall mobil pages Scrolling smoothness (Goal: 60 frames per second = 16msec per frame)
t2 = New Connection + RTT
https:///note.php?note_id=10150212498738920
Networks
Doppler:
▪ ▪ ▪ ▪
t1 = DNS + New Connection + RTT t2 = New Connection + RTT
a <= <random number> /test_pixel?HTTP1.0&t=1&size=0k /test_pixel?HTTP1.1&t=2&size=0k /test_pixel?HTTP1.1&t=3&size=0k /test_pixel?HTTP1.1&t=4&size=10k /test_pixel?HTTP1.1&t=5&size=40k
* /2011/10/05/fast-animation-with-ios-webkit
New challenges: networks
Networks: larger role in performance
▪ ▪ ▪
Larger portion of the total latency: 50%~90% DiffServ / zero-rating Link layer protocols: CDMA / GSM; connection timeout
t3 = RTT
https:///note.php?note_id=10150212498738920
Networks
Doppler:
▪ ▪ ▪ ▪ ▪
t1 = DNS + New Connection + RTT t2 = New Connection + RTT t3 = RTT
Mobile performance
Xiaoliang “David” Wei /DavidWei : 9
Velocity China, Dec 6th, 2011, Beijing
“Facebook is a mobile company”
Networks
Doppler:
▪ ▪ ▪
t1 = DNS + New Connection + RTT
a <= <random number> /test_pixel?HTTP1.0&t=1&size=0k /test_pixel?HTTP1.1&t=2&size=0k
a <= <random number> /test_pixel?HTTP1.0&t=1&size=0k /test_pixel?HTTP1.1&t=2&size=0k /test_pixel?HTTP1.1&t=3&size=0k
Players in web:
▪ ▪
Players in mobile:
▪ ▪ ▪ ▪
Users Browsers
Users Browsers Networks Devices
New challenges: users
New challenges: users
Different behavior and expectation:
350 M
https:///press/info.php
Agenda
1 2 3
New challenges in mobile Useful (old) tools Q&A
New challenges in mobile
New challenges in mobile
10k / (t4 – t3 ) ~ TCP bandwidth
https:///note.php?note_id=10150212498738920
Networks
Doppler:
▪ ▪ ▪ ▪ ▪ ▪
t1 = DNS + New Connection + RTT t2 = New Connection + RTT t3 = RTT 10k / (t4 – t3 ) ~ TCP bandwidth
(40k-10k) / (t5 – t4 ) ~ TCP bandwidth
https:///note.php?note_id=10150212498738920
Networks: Performance
TCP congestion control: