基于Python的城市空气PM2.5指数接口调用代码实例
基于python的空气质量分析系统的设计与实现

基于python的空气质量分析系统的设计与实现摘要:环境问题影响人们的生活质量,为了使人们方便了解一些城市的空气质量情况,本系统通过爬取各个地区的空气评分、温度、湿度、等级及空气中的PM2.5和PM10值,并以此作为数据源,对大量的数据进行分析,最终以柱形图折线图的形式,进行不同城市空气质量的对比,并使用K-means算法,依据城市的空气评分、PM2.5、PM10、温度为指标对城市进行分类。
分析出该城市的空气质量存在的问题,为改善这些地区的环境、解决空气质量问题提供依据。
该项目具有积极的社会价值和应用价值。
关键字:空气质量;python;K-means算法;聚类算法The Design and Implementation of an Air Quality Analysis System Based on PythonHuang YongliSchool of Journalism and Communication, Shanghai International Studies University, Shanghai,200160Environment affects people's quality of life. In order to help people to know the air quality situation in some cities is known, the data such as air scores, temperature, humidity, levels, and PM2.5 and PM10 values in the various regions is crawled. The data are used as data sources to analyze. Finally, in the form of column chart and line chart, the air quality of different cities is compared. The K-means algorithm is used to classify cities based on their air rating, PM2.5, PM10, and temperature. It can provide a basis for analyzing airquality and improving the environment and solving air quality problems in these areas. This project has positive social and application valueKey words: Air Quality; Python; K-means Algorithm;Clustering Algorithm1、引言我国工业化程度越来越高,人们生活变得越来越好,环境问题也日益严重。
不同城市pm2.5开放api示例

不同城市pm2.5开放api示例PM2.5是现在人都非常关注的空气质量的重要指标之一,此pm2.5开放api支持不同城市PM2.5指数查询、空气质量、一氧化碳等空气情况。
接口名称:pm2.5数据调用接口平台:聚合数据接口地址::8080/environment/air/pmCities支持格式:JSON请求方式:GET请求示例::8080/environment/air/pmCities?key=您申请的APPKEY值接口备注:提供城市空气PM2.5指数的城市列表数据pm2.5开放api接口JSON返回示例:{"resultcode": "200","reason": "SUCCESSED!","result": [{"city": "苏州", /*城市*/"PM2.5": "73", /*PM2.5指数*/"AQI": "98", /*空气质量指数*/"quality": "良", /*空气质量*/"PM10": "50",/*PM10*/"CO": "0.79", /*一氧化碳*/"NO2": "65", /*二氧化氮*/"O3": "28", /*臭氧*/"SO2": "41", /*二氧化硫*/"time": "2014-12-26 11:48:40"/*更新时间*/}],"error_code": 0}pm2.5开放api城市列表JSON返回示例:{"resultCode": "200","reason": "SUCCESSED!","error_code": 0,"result": [{"name": "泰州",/*城市名*/"pinyin": "taizhoushi"/*城市拼音*/ },{"name": "淮安","pinyin": "huaian"},{"name": "邢台","pinyin": "xingtai"},{"name": "南平","pinyin": "nanping"},{"name": "舟山","pinyin": "zhoushan"},...]}。
北京市城区PM2.5的源解析

北京市城区大气PM2.5的源解析摘要:来源分析是解决PM2.5污染的基础,通过国内外文献和研究成果分析认为北京市城区PM2.5主要来源于燃煤及工业过程、二次转化、地面扬尘、机动车排放和生物质燃烧。
PM2.5的分布特征为夜间浓度高于白天,主要来源随季节更替变化明显,其浓度与高度和区域位置有关。
关键词:北京市;城区,;PM2.5;源解析Source Apportionment of PM2.5 in the urban area of Beijing Abstract: Source apportionment is the foundation of the solution to PM2.5. According to consulting domestic and foreign literature materials, the main sources of PM2.5 in the urban area of Beijing are coal burning, industrial process, secondary formation,, namely soil, vehicle emissions and biomass burning. The distribution characteristics of PM2.5are as follows: the concentration of PM2.5in night time is higher than daytime; the main sources are changing significantly with the changing seasons; the concentration is connected with the height and regional location.Key Words: Beijing; urban area; PM2.5; source apportionment0引言城市大气细颗粒物PM2.5是危害人体健康和环境(如大气能见度降低、干沉降)的最主要的空气污染物之一,目前已经成为世界各国研究的重点。
adafruit pm2.5空气质量传感器使用指南说明书
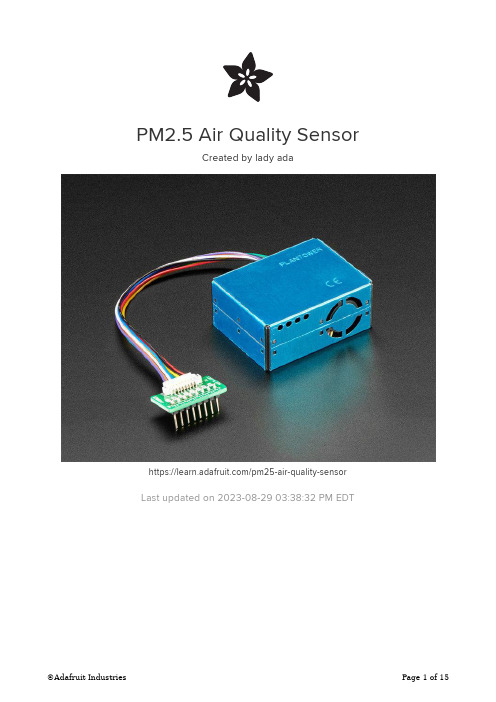
PM2.5 Air Quality SensorCreated by lady adahttps:///pm25-air-quality-sensor Last updated on 2023-08-29 03:38:32 PM EDT3471215Table of ContentsOverviewArduino Code• Wiring Python & CircuitPython• CircuitPython Microcontroller Wiring• Python Computer Wiring• CircuitPython & Python Usage• CircuitPython Microcontroller• Linux/Computer/Raspberry Pi with PythonUsage Notes• Standard vs. Environmental Concentration• Analysis Report of Using PM2.5Downloads• Files:OverviewBreathe easy, knowing that you can track and sense the quality of the air around you with the PM2.5 Air Quality Sensor with Breadboard Adapter particulate sensor. Mad Max & Furiosa definitely should have hooked up one of these in their truck while scavenging the dusty desert wilderness of post-apocalyptic Australia (). And for those of us not living in an Outback dystopia, this sensor + adapter kit is great for monitoring air quality, and super easy to use!WITNESS real-time, reliable measurement of PM2.5 dust concentrations! (PM2.5 refers to particles that are 2.5 microns or smaller in diameter.) This sensor uses laser scattering to radiate suspending particles in the air, then collects scattering light to obtain the curve of scattering light change with time. The microprocessor calculates equivalent particle diameter and the number of particles with different diameter per unit volume.You'll need to hook this up to a microcontroller with UART input (or you could theoretically wire it up to a USB-Serial converter and parse the data on a computer ())- we have code for both Arduino and CircuitPython. 9600 baud data streams out once per second, you'll get:PM1.0, PM2.5 and PM10.0 concentration in both standard & enviromental units Particulate matter per 0.1L air, categorized into 0.3um, 0.5um, 1.0um, 2.5um,5.0um and 10um size binsAs well as checksum, in binary format (its fairly easy to parse the binary format, but it doesn't come out as pure readable ascii text)We give you the sensor box as well as the cable and a 0.1" / 2.54mm breakout board so you can wire it easily. You only need power plus one data pin (for the UART TX).Power is 5V, logic is 3.3V Arduino CodeUsing the PM2.5 with Arduino is a simple matter of wiring up it to your Arduino-compatible microcontroller, installing the Adafruit PM25AQI () library we've written,and running the provided example code.This code will get you started with any Arduino compatible (e.g. Arduino UNO,Adafruit Metro, ESP8266, Teensy, etc. As long as you have either a hardware serial or software serial port that can run at 9600 baud.• •WiringWiring is simple! Power the sensor with +5V and GND and then connect the data out pin (3.3V logic) to the serial input pin you'll use. Whether or not you are using hardware or software UART/serial may affect the pin, so adjust that as necessary. This wiring works for ATMega328P-based boards for sure, with Digital #2 as the data pin:To use this example with the PM2.5 sensor, you'll need to make some changes./* Test sketch for Adafruit PM2.5 sensor with UART or I2C */#include "Adafruit_PM25AQI.h"// If your PM2.5 is UART only, for UNO and others (without hardware serial)// we must use software serial...// pin #2 is IN from sensor (TX pin on sensor), leave pin #3 disconnected// comment these two lines if using hardware serial//#include <SoftwareSerial.h>//SoftwareSerial pmSerial(2, 3);Adafruit_PM25AQI aqi = Adafruit_PM25AQI();void setup() {// Wait for serial monitor to openSerial.begin(115200);while (!Serial) delay(10);Serial.println("Adafruit PMSA003I Air Quality Sensor");// Wait one second for sensor to boot up!delay(1000);// If using serial, initialize it and set baudrate before starting!// Uncomment one of the following//Serial1.begin(9600);//pmSerial.begin(9600);// There are 3 options for connectivity!if (! aqi.begin_I2C()) { // connect to the sensor over I2C//if (! aqi.begin_UART(&Serial1)) { // connect to the sensor over hardware serial //if (! aqi.begin_UART(&pmSerial)) { // connect to the sensor over softwareserialSerial.println("Could not find PM 2.5 sensor!");while (1) delay(10);}Serial.println("PM25 found!");}void loop() {PM25_AQI_Data data;if (! aqi.read(&data)) {Serial.println("Could not read from AQI");delay(500); // try again in a bit!return;}Serial.println("AQI reading success");Serial.println();Serial.println(F("---------------------------------------"));Serial.println(F("Concentration Units (standard)"));Serial.println(F("---------------------------------------"));Serial.print(F("PM 1.0: ")); Serial.print(data.pm10_standard);Serial.print(F("\t\tPM 2.5: ")); Serial.print(data.pm25_standard);Serial.print(F("\t\tPM 10: ")); Serial.println(data.pm100_standard);Serial.println(F("Concentration Units (environmental)"));Serial.println(F("---------------------------------------"));Serial.print(F("PM 1.0: ")); Serial.print(data.pm10_env);Serial.print(F("\t\tPM 2.5: ")); Serial.print(data.pm25_env);Serial.print(F("\t\tPM 10: ")); Serial.println(data.pm100_env);Serial.println(F("---------------------------------------"));Serial.print(F("Particles > 0.3um / 0.1L air:"));Serial.println(data.particles_03um);Serial.print(F("Particles > 0.5um / 0.1L air:"));Serial.println(data.particles_05um);Serial.print(F("Particles > 1.0um / 0.1L air:"));Serial.println(data.particles_10um);Serial.print(F("Particles > 2.5um / 0.1L air:"));Serial.println(data.particles_25um);Serial.print(F("Particles > 5.0um / 0.1L air:"));Serial.println(data.particles_50um);Serial.print(F("Particles > 10 um / 0.1L air:"));Serial.println(data.particles_100um);Serial.println(F("---------------------------------------"));delay(1000);}Comment out the following line by adding "//" before it:if (! aqi.begin_I2C()) { // connect to the sensor over I2CUncomment the following lines by removing the "//" from the beginning://#include <SoftwareSerial.h>//SoftwareSerial pmSerial(2, 3);//pmSerial.begin(9600);//if (! aqi.begin_UART(&pmSerial)) { // connect to the sensor over software serialOnce the changes are made, upload this code to your board, and open up the serial console at 115200 baud. You'll see data printed out once a second, with all the measurements. For a clean-air indoor room you'll see something like this:If you hold up a smoking soldering iron or something else that creates a lot of dust,you'll see much higher numbers!Note that the numbers are very precise looking but we don't believe that they're going to be perfectly accurate, calibration may be necessary!Python & CircuitPythonIt's easy to use the PM2.5 and the Adafruit CircuitPython PM25 ()module. This libraryallows you to easily write Python code that reads particle concentrations, and particle diameter and the number of particles with different diameters per unit volume.You can use this sensor with any CircuitPython microcontroller board or with acomputer that has GPIO and Python thanks to Adafruit_Blinka, our CircuitPython-for-Python compatibility library ().CircuitPython Microcontroller WiringFirst, connect the sensor to your microcontroller board using UART (a serial port).Here is an example of it connected to a Feather M0 using UART:Sensor VCC to board 5VSensor GND to board GNDSensor TX to board RXRemember: RX does not connect to RX!Python Computer WiringSince there's dozens of Linux computers/boards you can use we will show wiring for Raspberry Pi. For other platforms, please visit the guide for CircuitPython on Linux to see whether your platform is supported ().Here you have two options: An external USB-to-serial converter, or the built-in UART on the Pi's RX pin. Here's an example of wiring up the USB-to-serial converter ():Sensor VCC to USB 5VSensor GND to USB GNDSensor TX to USB RX (white wire)Remember: RX does not connect to RX!Here's an example using the Pi's built-in UART:Sensor VCC to Pi 5VSensor GND to Pi GNDSensor TX to Pi RXRemember: RX does not connect to RX!If you want to use the built-in UART, you'll need to disable the serial console and enable the serial port hardware in raspi-config. See the UART/Serial section of the CircuitPython on Raspberry Pi guide () for detailed instructions on how to do this.CircuitPython & Python UsageTo demonstrate the PM2.5 in CircuitPython and Python, let's look at a complete program example.CircuitPython MicrocontrollerWith a CircuitPython microcontroller, save this file as code.py on your board. Then comment out the following lines by inserting a '#' before each one:i2c = busio.I2C(board.SCL, board.SDA, frequency=100000)pm25 = adafruit_pm25.i2c.PM25_I2C(i2c, reset_pin)And uncomment the following lines by removing the '# ' (hash and space both!)before each one:For single board computers other than the Raspberry Pi, the serial port may be tied to the console or not be available to the user. Please see the boarddocumentation to see how the serial port may be usedTo use the pm25_simpletest.py with the PM2.5 sensor, you'll have to make some changes.# uart = busio.UART(board.TX, board.RX, baudrate=9600)# pm25 = adafruit_pm25.uart.PM25_UART(uart, reset_pin)Then, open up the serial console () to see its output.Linux/Computer/Raspberry Pi with PythonWhen using a USB to serial cable or a Raspberry Pi, comment out the following lines by inserting a '#' before each one:i2c = busio.I2C(board.SCL, board.SDA, frequency=100000)pm25 = adafruit_pm25.i2c.PM25_I2C(i2c, reset_pin)For Raspberry Pi, uncomment the following lines by removing the '# ' (hash and space both!) before each one:# import serial# uart = serial.Serial("/dev/ttyS0", baudrate=9600, timeout=0.25)For a USB to serial cable, uncomment the following lines by removing the '# ' (hash and space both!) before each one:# import serial# uart = serial.Serial("/dev/ttyUSB0", baudrate=9600, timeout=0.25)Install the python serial with library withpip3 install pyserialNow you're ready to run the program with the following command:python3 pm25_simpletest.py# SPDX-FileCopyrightText: 2021 ladyada for Adafruit Industries# SPDX-License-Identifier: MIT"""Example sketch to connect to PM2.5 sensor with either I2C or UART."""# pylint: disable=unused-importimport timeimport boardimport busiofrom digitalio import DigitalInOut, Direction, Pullfrom adafruit_pm25.i2c import PM25_I2Creset_pin = None# If you have a GPIO, its not a bad idea to connect it to the RESET pin# reset_pin = DigitalInOut(board.G0)# reset_pin.direction = Direction.OUTPUT# reset_pin.value = False# For use with a computer running Windows:# import serial# uart = serial.Serial("COM30", baudrate=9600, timeout=1)# For use with microcontroller board:# (Connect the sensor TX pin to the board/computer RX pin)# uart = busio.UART(board.TX, board.RX, baudrate=9600)# For use with Raspberry Pi/Linux:# import serial# uart = serial.Serial("/dev/ttyS0", baudrate=9600, timeout=0.25)# For use with USB-to-serial cable:# import serial# uart = serial.Serial("/dev/ttyUSB0", baudrate=9600, timeout=0.25)# Connect to a PM2.5 sensor over UART# from adafruit_pm25.uart import PM25_UART# pm25 = PM25_UART(uart, reset_pin)# Create library object, use 'slow' 100KHz frequency!i2c = busio.I2C(board.SCL, board.SDA, frequency=100000)# Connect to a PM2.5 sensor over I2Cpm25 = PM25_I2C(i2c, reset_pin)print("Found PM2.5 sensor, reading data...")while True:time.sleep(1)try:aqdata = pm25.read()# print(aqdata)except RuntimeError:print("Unable to read from sensor, retrying...")continueprint()print("Concentration Units (standard)")print("---------------------------------------")print("PM 1.0: %d\tPM2.5: %d\tPM10: %d"% (aqdata["pm10 standard"], aqdata["pm25 standard"], aqdata["pm100 standard"]))print("Concentration Units (environmental)")print("---------------------------------------")print("PM 1.0: %d\tPM2.5: %d\tPM10: %d"% (aqdata["pm10 env"], aqdata["pm25 env"], aqdata["pm100 env"]))print("---------------------------------------")print("Particles > 0.3um / 0.1L air:", aqdata["particles 03um"])print("Particles > 0.5um / 0.1L air:", aqdata["particles 05um"])print("Particles > 1.0um / 0.1L air:", aqdata["particles 10um"])print("Particles > 2.5um / 0.1L air:", aqdata["particles 25um"])print("Particles > 5.0um / 0.1L air:", aqdata["particles 50um"])print("Particles > 10 um / 0.1L air:", aqdata["particles 100um"])print("---------------------------------------")You should see output looking something like the following:That's all there is to using the PM2.5 air quality sensor with CircuitPython! Usage NotesStandard vs. Environmental ConcentrationThe PM2.5 returns two sets of concentrations: standard and environmental. Standard refers to the concentration at standard pressure (i.e. sea level). Environmental refers to the concentration that depends on ambient pressure.Analysis Report of Using PM2.5StanJ wrote up an amazing analysis report of using the PM2.5 sensor in their lab (), and we think its helpful for others to understand what and how the sensor works and what to expect from it! We've duplicated it here as well:I've read quite a lot on the PlanTower sensors, although I'm nothing like anexpert :-). The CF readings are 'Calibration Factory' and aren't useful; the'Environmental' or 'Ambient' concentration readings are the data you wantfor air quality measurements. I'm using the PMS5003 for a continuouscheck on cleanroom quality, so I only use the raw Particle Counts as that'sthe measurement specified in ISO 14644-1 .As Solaria123 noted in viewtopic.php?f=19&t=135496 (), the sensor estimates particles > 2.5um and doesn't (or can't) measure them. The article atResearchGate showed that a concentration composed solely of largerparticles wasn't seen by the sensor. For our cleanroom use that's OK as theHEPA filters are more efficient as the particle size increases. For non-filtered air it's a bit more of concern as the different particle sizes arecomposed of different pollutants, so you might be missing a pollutant if it's composed primarily of larger particles like pollen.One amusing note in the translated PlanTower datasheet is "Only the consistency among the PM sensors of PLANTOWER is promised and ensured. And the sensor should not be checked with any third party equipment." Several groups including have done exactly that, and we have as well. The PlanTower sensor compares favorably with the readings from our calibrated Beckman Particle Counter, although the30-50% uncertainty on the PlanTower 0.3 and 0.5 um bins means you can't get an exact comparison. We're only using the sensor for a rough check on current air quality, not to verify compliance with ISO 14644.A frustrating artifact of the PlanTower sensor is the sampling rate versus data output. With small change between readings the sensor only updates the counts every 2.3 seconds, although it outputs data every second. That means it may duplicate over half of the data, with no way to verify whether any reading is a duplicate. For a normal home or outdoor setting you could simply discard any reading when the checksum is identical to the previous data, as you're highly unlikely to have two successive samples with the same values. In a cleanroom we're looking at very low particle counts, and two successive samples might well be identical. The only way I could get around that is by throwing away 2 of every 3 data packets to insure I'm getting real counts, which increases the total sample time. I add the results from 100 unique 0.1 liter samples to get a reading of particles in 10 liters ofair for my measurement, which means 300 samples with 2/3rds of the data thrown away.amb=[003a 005c 0061] raw=[386a 1160 0325 004c 000b 0001] csum=0542amb=[003b 005d 0063] raw=[38cd 1175 033c 0054 000e 0004] csum=05eaamb=[003c 0060 0065] raw=[398a 11ba 033c 0054 000a 0003] csum=05f4amb=[003c 0060 0066] raw=[3a8c 120f 0340 0050 000d 0003] csum=0555amb=[003d 0060 0066] raw=[3b04 122e 0333 0050 000d 0003] csum=04e1amb=[003c 005e 0064] raw=[3b04 122a 0339 0056 000b 0003] csum=04dcamb=[003c 005e 0064] raw=[3b04 122a 0339 0056 000b 0003] csum=04dc duplicate amb=[003c 005e 0064] raw=[3b04 122a 0339 0056 000b 0003] csum=04dc duplicate amb=[003c 005c 0062] raw=[3b22 1232 0330 004b 000a 0003] csum=04e2amb=[003c 005c 0062] raw=[3b22 1232 0330 004b 000a 0003] csum=04e2 duplicate amb=[003c 005c 0062] raw=[3b22 1232 0330 004b 000a 0003] csum=04e2 duplicate amb=[003b 0059 005f] raw=[3a7a 1211 030e 0043 000a 0003] csum=04deamb=[003a 0058 005e] raw=[3a7a 1211 030e 0043 000a 0003] csum=04d8amb=[003a 0058 005e] raw=[3a7a 1211 030e 0043 000a 0003] csum=04d8 duplicate amb=[003a 0058 005e] raw=[3a35 11fa 030c 003b 0009 0003] csum=056e What you're seeing above is the 1 second data window sliding along the(typical) 2.3 second sampling window. When the data changes significantly between samples the sensor shortens the sample window to 200-800ms,which may be why the first 6 data points show unique numbers (fastersampling rate).The readings above are in my home, and I smoke so the particle countsvary wildly about 1000:1 over time with a decent quality air filter. When I'mhome I run the air handler fan continuously to level out the temperatureover the house, and when I'm away I let the fan cycle with the AC or heat.You can see the difference below in how rapidly the particle counts fall off with continuous filtering. The rapid fall off continuous curve is [sleeping],and the slow fall off is cycling [away from home]. Data points are every 30minutes.Downloads Files:•PMS5003 Datasheet / Manual ()。
《基于并行随机森林的城市PM2.5浓度预测》范文

《基于并行随机森林的城市PM2.5浓度预测》篇一一、引言随着工业化的进程加速,环境污染问题愈发严峻,特别是空气中的颗粒物(PM2.5)污染问题已引发全球的广泛关注。
PM2.5作为一种严重的空气污染物,其浓度的准确预测对于环境保护、城市规划以及公众健康具有重要意义。
本文旨在探讨基于并行随机森林算法的PM2.5浓度预测方法,以期为相关领域的研究提供参考。
二、研究背景与意义PM2.5是指空气中直径小于或等于2.5微米的颗粒物,其来源广泛,包括工业排放、交通尾气、生活污染等。
PM2.5的浓度直接影响空气质量,对人类健康产生严重影响。
因此,准确预测PM2.5浓度对于制定有效的空气污染控制策略具有重要意义。
传统的PM2.5浓度预测方法主要依赖于统计模型和物理模型。
然而,这些方法往往难以充分考虑复杂的气象因素、污染物来源及扩散机制等因素。
近年来,机器学习方法在PM2.5浓度预测方面展现出强大的能力,尤其是并行随机森林算法,具有高准确率、易于实现等优点。
三、方法与数据本研究采用并行随机森林算法进行PM2.5浓度预测。
该算法基于决策树理论,通过构建多个决策树并对结果进行集成,以提高预测的准确性和稳定性。
在数据方面,我们收集了包括气象数据、交通流量数据、污染物排放数据等在内的多种数据源。
四、模型构建与训练在模型构建过程中,我们首先对数据进行预处理,包括数据清洗、缺失值填充、标准化等操作。
然后,我们将数据集划分为训练集和测试集,利用训练集训练并行随机森林模型,并利用测试集对模型进行评估。
在模型训练过程中,我们通过调整参数、优化模型结构等方式提高模型的预测性能。
五、实验结果与分析实验结果表明,基于并行随机森林的PM2.5浓度预测模型具有较高的准确性和稳定性。
在测试集上,该模型的预测结果与实际观测值之间的误差较小,且具有较高的预测能力。
此外,我们还对模型进行了交叉验证和敏感性分析,以进一步评估模型的性能和可靠性。
六、讨论与展望本研究表明,基于并行随机森林的PM2.5浓度预测方法具有较高的准确性和实用性。
基于php的pm2.5实时查询api调用代码实例
基于php的pm2.5实时查询api调用代码实例代码描述:基于php的pm2.5实时查询api调用代码实例关联数据:空气质量接口地址:/docs/api/id/33<!--?php// +----------------------------------------------------------------------// | JuhePHP [ NO ZUO NO DIE ]// +----------------------------------------------------------------------// | Copyright (c) 2010-2015 All rights reserved.// +----------------------------------------------------------------------//|Author:Juhedata<**************>// +----------------------------------------------------------------------//----------------------------------// 空气质量调用示例代码-聚合数据// 在线接口文档:/docs/33//----------------------------------header('Content-type:text/html;charset=utf-8');//配置您申请的appkey$appkey= "*********************";//************1.城市空气质量************$url= ":8080/environment/air/cityair";$params= array("city"=> "",//城市名称的中文名称或拼音,如:上海或 shanghai"key"=> $appkey,//APP Key);$paramstring= http_build_query($params);$content= juhecurl($url,$paramstring);$result= json_decode($content,true);if($result){if($result['error_code']=='0'){print_r($result);}else{echo$result['error_code'].":".$result['reason'];}}else{echo"请求失败";}//**************************************************//************2.城市空气PM2.5指数************$url= ":8080/environment/air/pm";$params= array("city"=> "",//城市名称的中文名称或拼音,如:上海或 shanghai "key"=> $appkey,//APP Key);$paramstring= http_build_query($params);$content= juhecurl($url,$paramstring);$result= json_decode($content,true);if($result){if($result['error_code']=='0'){print_r($result);}else{echo$result['error_code'].":".$result['reason'];}}else{echo"请求失败";}//**************************************************//************3.城市空气质量-城市列表************$url= ":8080/environment/air/airCities"; $params= array("key"=> $appkey,//APP Key);$paramstring= http_build_query($params);$content= juhecurl($url,$paramstring);$result= json_decode($content,true);if($result){if($result['error_code']=='0'){print_r($result);}else{echo$result['error_code'].":".$result['reason'];}}else{echo"请求失败";}//**************************************************//************4.城市空气PM2.5指数-城市列表************$url= ":8080/environment/air/pmCities"; $params= array("key"=> $appkey,//APP Key);$paramstring= http_build_query($params);$content= juhecurl($url,$paramstring);$result= json_decode($content,true);if($result){if($result['error_code']=='0'){print_r($result);}else{echo$result['error_code'].":".$result['reason'];}}else{echo"请求失败";}//**************************************************//************5.城市辐射指数************$url= ":8080/environment/air/radia";$params= array("city"=> "",//城市名称的中文拼音,查询城市为“上海”,则输入:上海"num"=> "",//查询页码数,不写默认为第一页。
空气污染指数aqipython计算

空气污染指数aqipython计算空气污染指数(AQI)是用于衡量空气质量的一项重要指标。
Python 作为一种强大的编程语言,可以用来计算AQI,帮助人们更好地了解和应对空气污染问题。
本文将探讨如何使用Python计算空气污染指数(AQI)。
一、引言空气污染是当今社会面临的一个严重问题。
为了解决这个问题,人们需要准确地了解空气质量情况。
AQI是一个常用的指标,它可以帮助我们判断空气质量的健康程度。
通过使用Python,我们可以很容易地计算出空气污染指数。
二、数据收集在计算AQI之前,我们需要收集一些与空气质量相关的数据。
这些数据通常包括颗粒物浓度(PM2.5和PM10)、臭氧(O3)、二氧化氮(NO2)和二氧化硫(SO2)等。
三、AQI计算公式AQI的计算是基于不同空气污染物的浓度值。
常见的AQI计算公式如下所示:1. PM2.5污染物的AQI计算公式:AQI = (IAQI_H - IAQI_L) * (Cp - Bp) / (Ip - Bp) + IAQI_L其中,IAQI_H是上限AQI值,IAQI_L是下限AQI值,Cp是实际浓度值,Bp是实际浓度值对应的IAQI下限,Ip是实际浓度值对应的IAQI上限。
2. PM10、O3、NO2和SO2等其他污染物的AQI计算公式类似。
四、Python代码实现以下是使用Python实现空气污染指数(AQI)计算的示例代码:```pythondef calculate_aqi(Cp, IAQI_H, IAQI_L, Bp, Ip):AQI = (IAQI_H - IAQI_L) * (Cp - Bp) / (Ip - Bp) + IAQI_Lreturn AQI# 示例数据Cp = 70.5IAQI_H = 100IAQI_L = 0Bp = 50Ip = 100# 调用计算函数aqi = calculate_aqi(Cp, IAQI_H, IAQI_L, Bp, Ip)print("空气污染指数(AQI)为:", aqi)```五、实际应用案例通过以上代码,我们可以根据不同污染物的浓度值来计算AQI。
python天津空气质量可视化的案例
一、概述随着人们对环境质量关注日益增加,空气污染已成为全球性的问题。
作为一种重要的数据分析和可视化工具,Python在空气质量监测和可视化方面具有很大的优势。
本文将介绍Python在天津空气质量监测和可视化方面的应用案例,以及该案例的数据分析过程和可视化效果。
二、案例数据源1. 数据来源:本案例的数据来源于国家环境保护部门发布的天津市空气质量监测数据。
2. 数据内容:监测数据包括空气污染物浓度、空气质量指数(AQI)、PM2.5、PM10、二氧化硫、一氧化碳、臭氧等。
三、数据分析与可视化1. 数据清洗:首先对原始数据进行清洗,包括处理缺失值、异常值和重复值等。
2. 数据处理:根据监测数据计算空气质量指数(AQI)并进行分类。
3. 可视化展示:利用Python的数据分析和可视化库,如Pandas、Matplotlib和Seaborn等,对整理后的数据进行可视化展示。
包括空气质量趋势图、污染物浓度分布图等。
四、可视化效果展示1. 空气质量趋势图:通过折线图展示天津市不同时间段内的空气质量趋势,可以直观地了解空气质量的变化规律。
2. 污染物浓度分布图:利用热力图或散点图展示不同区域内各种污染物的浓度分布情况,帮助人们了解不同地区的污染状况。
五、案例意义和启示1. 数据分析和可视化可以帮助人们更直观地了解空气质量的变化趋势和空气污染情况,有助于政府部门和公众采取相应的措施。
2. Python作为一种高效、灵活的数据分析和可视化工具,具有很大的应用潜力,在环境监测和保护领域有着广阔的发展前景。
六、结论本文介绍了Python在天津空气质量监测和可视化方面的应用案例,包括数据获取、清洗、处理和可视化展示等步骤。
通过对监测数据的分析和可视化,可以更直观地了解天津市的空气质量状况,为相关部门和个人提供决策依据和参考。
Python作为一种强大的数据分析和可视化工具,为环境保护和监测工作提供了重要的支持和帮助。
希望本文对读者在相关领域的研究和实践提供一定的借鉴和启发。
基于R语言的城市PM2.5影响因素分析

基于R语言的城市PM2.5影响因素分析一、PM2.5的影响因素PM2.5是指大气中空气动力学直径小于等于2.5微米的可吸入颗粒物,它的主要来源包括工业排放、机动车尾气、生物质燃烧和扬尘等。
在城市中,PM2.5的浓度受到许多因素的影响,包括气象条件、工业排放、交通状况等。
需要对这些影响因素进行分析,以便更好地理解PM2.5的污染特征和形成机制。
二、R语言在PM2.5影响因素分析中的应用R语言是一种开源的数据分析和统计建模工具,拥有丰富的数据处理函数和可视化工具,因此在环境科学研究中得到了广泛的应用。
基于R语言的城市PM2.5影响因素分析通常包括以下几个步骤:1. 数据收集:首先需要从空气质量监测站点或相关部门获取PM2.5浓度数据,以及气象条件、工业排放和交通流量等相关数据。
2. 数据清洗:将收集到的原始数据进行清洗和处理,包括缺失值处理、异常值处理、数据转换等。
3. 相关性分析:使用R语言中的相关性分析函数,对PM2.5浓度和各影响因素之间的相关性进行探究,找出可能存在的相关性较强的变量。
4. 建立模型:基于收集到的数据,可以使用R语言中的回归分析函数建立PM2.5浓度与影响因素之间的数学模型,以便定量地分析各因素对PM2.5浓度的影响程度。
5. 结果可视化:利用R语言中的可视化函数,将分析得到的结果以图表形式直观展示,为研究人员和决策者提供直观的数据支持。
三、案例分析以某大型城市为例,我们通过R语言对其PM2.5影响因素进行分析。
我们从该城市的空气质量监测站点获取了一年的PM2.5浓度数据,以及气象条件、工业排放和交通流量等相关数据。
经过数据清洗和处理后,我们得到了一份完整的数据集,包括PM2.5浓度、温度、湿度、风速、工业排放量、交通流量等多个变量。
接下来,我们使用R语言中的相关性分析函数,对这些变量进行相关性分析。
结果显示,PM2.5浓度与温度、风速、工业排放量之间存在一定的相关性,而与湿度、交通流量等变量之间的相关性较弱。
基于R语言的城市PM2.5影响因素分析

基于R语言的城市PM2.5影响因素分析随着城市化进程的加速,大多数城市面临着空气污染的严重问题。
PM2.5(细颗粒物)是城市空气污染的主要成分之一,对人体健康和环境质量都具有重要影响。
研究和分析城市PM2.5的影响因素对于改善环境质量和人居环境至关重要。
在R语言中,我们可以使用各种统计方法和机器学习模型来进行城市PM2.5的影响因素分析。
下面将介绍一种基于R语言的分析方法。
我们需要收集城市PM2.5的相关数据。
这些数据可以从环境监测站点、气象站点和人口普查数据等渠道获取。
利用R语言的数据操作和清洗功能,我们可以对数据进行处理和整理,准备用于后续分析的数据集。
接下来,我们可以通过可视化工具(如ggplot2包)对数据进行初步的探索性分析。
通过绘制散点图、箱线图和直方图等图表,我们可以观察到数据的分布和相关关系。
我们可以绘制城市PM2.5与气温、湿度、风速等指标之间的散点图,来初步了解它们之间的相关程度。
在进一步的分析中,我们可以使用统计模型(如线性回归模型)来研究城市PM2.5的影响因素。
R语言提供了多种线性回归模型的实现,例如lm()函数。
通过建立合适的线性回归模型,并进行模型诊断和评估,我们可以确定哪些指标对城市PM2.5的影响最为显著。
除了线性回归模型,我们还可以尝试其他的机器学习模型来进行影响因素分析,例如决策树、随机森林和支持向量机等。
R语言提供了多个包(如rpart、randomForest和e1071包)来实现这些模型。
通过比较不同模型的预测效果,我们可以选择最优的模型来解释城市PM2.5的影响因素。
我们可以利用R语言的统计模型和模型预测功能,来进行影响因素的解释和预测。
通过对模型参数的解读和解释,我们可以了解各个指标对城市PM2.5的贡献度。
我们也可以通过输入不同的指标值,使用模型进行PM2.5的预测,从而评估不同因素对PM2.5变化的影响程度。
基于R语言的城市PM2.5影响因素分析可以帮助我们更好地理解和评估城市空气污染问题。
基于R语言的城市PM2.5影响因素分析

基于R语言的城市PM2.5影响因素分析
PM2.5是指空气中直径小于或等于2.5微米的颗粒物,也被称为细颗粒物。
它是空气污染中的主要成分之一,对人体健康和环境都有很大的影响。
研究城市PM2.5的影响因素非常重要,可以帮助我们制定相应的控制策略和政策。
为了分析城市PM2.5的影响因素,我们可以使用R语言进行数据处理和分析。
我们需要收集城市的PM2.5数据和可能影响因素的数据,如气象因素、交通因素、工业排放等。
这些数据可以从政府机构、气象部门、环境监测站等地方获取。
然后,我们可以使用R语言进行数据的预处理,包括数据清洗、数据合并等。
数据清洗可以去除缺失值、异常值等不符合要求的数据。
数据合并可以将不同来源的数据按照相同的时间和地点进行整合,以便后续的分析。
接下来,我们可以使用统计方法和机器学习方法来分析城市PM2.5的影响因素。
统计方法包括相关分析、回归分析等,可以帮助我们判断不同因素与PM2.5的相关性和影响程度。
机器学习方法包括决策树、随机森林等,可以帮助我们发现隐藏在数据中的模式和规律。
我们可以使用R语言进行结果的可视化和解释。
可视化可以将分析结果以图表的形式展示出来,更加直观地理解结果。
解释可以对结果进行说明和总结,得出相应的结论。
基于R语言进行城市PM2.5影响因素的分析可以帮助我们深入了解PM2.5的来源和影响机制,为解决城市空气污染问题提供有效的参考和指导。
R语言的数据处理和分析功能也极大地方便了我们对大量数据进行处理和分析。
基于R语言的城市PM2.5影响因素分析

基于R语言的城市PM2.5影响因素分析随着城市化进程的加速,我国城市PM2.5污染已经成为人们关注的焦点问题之一。
PM2.5是指大气中直径小于或等于2.5微米的颗粒物,其危害性较大,对人体健康和环境造成严重影响。
研究城市PM2.5的影响因素,可以为政府制定有效的对策提供科学依据。
本文将以R语言为工具,对城市PM2.5的影响因素进行分析,以期为城市环境治理提供一定的参考。
1.研究背景PM2.5是大气污染中的主要组成部分,其主要来源包括工业排放、交通尾气、燃煤和生物质燃烧等。
与此PM2.5的污染形式也多样,包括颗粒物物理和化学特性、气象条件和环境地理等因素。
为了更好地了解城市PM2.5的影响因素,本文将以R语言为工具,通过对城市PM2.5数据的分析,识别出影响PM2.5的关键因素。
2.数据处理为了开展城市PM2.5的影响因素分析,首先需要准备相关的城市PM2.5数据。
在本文中,我们选择了某市2019年的PM2.5监测数据作为研究对象。
数据包括PM2.5的浓度值以及其他可能影响PM2.5情况的相关数据,如气象条件、交通量、工业排放等。
在数据处理方面,我们使用R语言进行数据清洗、变量选择和缺失值处理,以确保数据的质量和完整性。
3.变量选择在城市PM2.5的影响因素分析中,需要选择合适的变量作为分析对象。
常见的影响PM2.5的变量包括大气污染物浓度、气象因素、交通量、工业排放等。
在变量选择上,我们将以PM2.5浓度作为因变量,气象因素(例如风速、湿度)、交通情况(例如交通量、道路密度)和工业排放等作为自变量,通过相关性分析和多元线性回归等方法,识别出对PM2.5影响显著的变量。
4.相关性分析相关性分析是一种常用的统计方法,用于检验变量之间的相关关系。
在本文中,我们将使用R语言进行相关性分析,以探究城市PM2.5与其他变量之间的关联程度。
通过相关性分析,我们将识别出与PM2.5浓度显著相关的因素,并对相关性较强的变量进行进一步的多元线性回归分析。
python分析:中国五大城市PM2.5数据分析
python分析:中国五⼤城市PM2.5数据分析```codeimport csvimport osimport numpy as npimport configdef load_data(data_file, usecols):"""参数:- data_file: ⽂件路径- usecols: 所使⽤的列返回:- data_arr: 数据的多维数组表⽰"""data = []with open(data_file, 'r') as csvfile:data_reader = csv.DictReader(csvfile)print(data_reader)# === Step 2. 数据处理 ===for row in data_reader:# 取出每⾏数据,组合为⼀个列表放⼊数据列表中row_data = []# 注意csv模块读⼊的数据全部为字符串类型for col in usecols:str_val = row[col]# 数据类型转换为float,如果是'NA',则返回nanrow_data.append(float(str_val) if str_val != 'NA' else np.nan)# 如果⾏数据中不包含nan才保存该⾏记录if not any(np.isnan(row_data)):data.append(row_data)# 将data转换为ndarraydata_arr = np.array(data)return data_arrdef get_polluted_perc(data_arr):""" 获取污染占⽐的⼩时数规则:重度污染(heavy) PM2.5 > 150中度污染(medium) 75 < PM2.5 <= 150轻度污染(light) 35 < PM2.5 <= 75优良空⽓(good) PM2.5 <= 35参数:- data_arr: 数据的多维数组表⽰返回:- polluted_perc_list: 污染⼩时数百分⽐列表"""# 将每个区的PM值平均后作为该城市⼩时的PM值# 按⾏取平均值hour_val = np.mean(data_arr[:, 2:], axis=1)# 总⼩时数n_hours = hour_val.shape[0]# 重度污染⼩时数n_heavy_hours = hour_val[hour_val > 150].shape[0]# 中度污染⼩时数n_medium_hours = hour_val[(hour_val > 75) & (hour_val <= 150)].shape[0]# 轻度污染⼩时数n_light_hours = hour_val[(hour_val > 35) & (hour_val <= 75)].shape[0]# 优良空⽓⼩时数n_good_hours = hour_val[hour_val <= 35].shape[0]polluted_perc_list = [n_heavy_hours / n_hours, n_medium_hours / n_hours,n_light_hours / n_hours, n_good_hours / n_hours]return polluted_perc_listdef get_avg_pm_per_month(data_arr):"""获取每个区每⽉的平均PM值参数:- data_arr: 数据的多维数组表⽰返回:- results_arr: 多维数组结果"""results = []# 获取年份years = np.unique(data_arr[:, 0])for year in years:# 获取当前年份数据year_data_arr = data_arr[data_arr[:, 0] == year]# 获取数据的⽉份month_list = np.unique(year_data_arr[:, 1])for month in month_list:# 获取⽉份的所有数据month_data_arr = year_data_arr[year_data_arr[:, 1] == month]# 计算当前⽉份PM的均值mean_vals = np.mean(month_data_arr[:, 2:], axis=0).tolist()# 格式化字符串row_data = ['{:.0f}-{:02.0f}'.format(year, month)] + mean_valsresults.append(row_data)results_arr = np.array(results)return results_arrdef save_stats_to_csv(results_arr, save_file, headers):"""将统计结果保存⾄csv⽂件中参数:- results_arr: 多维数组结果- save_file: ⽂件保存路径- headers: csv表头"""with open(save_file, 'w', newline='') as csvfile:writer = csv.writer(csvfile)writer.writerow(headers)for row in results_arr.tolist():writer.writerow(row)def main():"""主函数"""polluted_state_list = []for city_name, (filename, cols) in config.data_config_dict.items():# === Step 1+2. 数据获取 + 数据处理 ===data_file = os.path.join(config.dataset_path, filename)usecols = mon_cols + ['PM_' + col for col in cols]data_arr = load_data(data_file, usecols)print('{}共有{}⾏有效数据'.format(city_name, data_arr.shape[0]))# 预览前10⾏数据print('{}的前10⾏数据:'.format(city_name))print(data_arr[:10])# === Step 3. 数据分析 ===# 五城市污染状态,统计污染⼩时数的占⽐polluted_perc_list = get_polluted_perc(data_arr)polluted_state_list.append([city_name] + polluted_perc_list)print('{}的污染⼩时数百分⽐{}'.format(city_name, polluted_perc_list))# 五城市每个区空⽓质量的⽉度差异,分析计算每个⽉,每个区的平均PM值results_arr = get_avg_pm_per_month(data_arr)print('{}的每⽉平均PM值预览:'.format(city_name))print(results_arr[:10])# === Step 4. 结果展⽰ ===# 4.1 保存⽉度统计结果⾄csv⽂件save_filename = city_name + '_month_stats.csv'save_file = os.path.join(config.output_path, save_filename)save_stats_to_csv(results_arr, save_file, headers=['month'] + cols) print('⽉度统计结果已保存⾄{}'.format(save_file))print()# 4.2 污染状态结果保存save_file = os.path.join(config.output_path, 'polluted_percentage.csv') with open(save_file, 'w', newline='') as csvfile:writer = csv.writer(csvfile)writer.writerow(['city', 'heavy', 'medium', 'light', 'good'])for row in polluted_state_list:writer.writerow(row)print('污染状态结果已保存⾄{}'.format(save_file))if __name__ == '__main__':main()```。
eoLinker-API_Shop_PM2.5空气质量指数_API接口_PHP调用示例代码
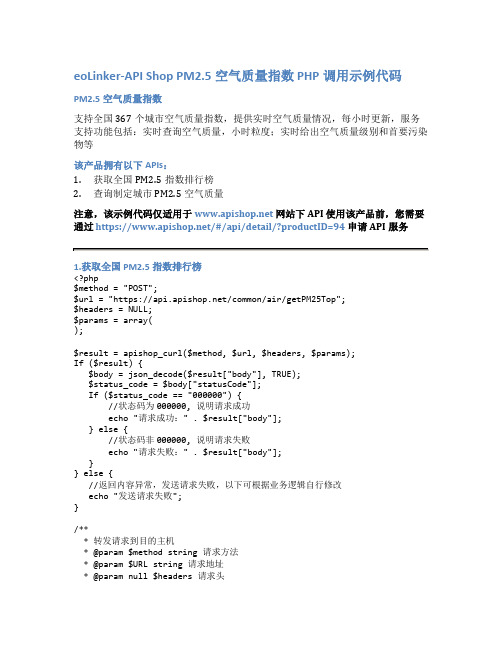
eoLinker-API Shop PM2.5空气质量指数 PHP调用示例代码PM2.5空气质量指数支持全国367个城市空气质量指数,提供实时空气质量情况,每小时更新,服务支持功能包括:实时查询空气质量,小时粒度;实时给出空气质量级别和首要污染物等该产品拥有以下APIs:1.获取全国PM2.5指数排行榜2.查询制定城市PM2.5空气质量注意,该示例代码仅适用于网站下API使用该产品前,您需要通过https:///#/api/detail/?productID=94申请API服务1.获取全国PM2.5指数排行榜<?php$method = "POST";$url = "https:///common/air/getPM25Top";$headers = NULL;$params = array();$result = apishop_curl($method, $url, $headers, $params);If ($result) {$body = json_decode($result["body"], TRUE);$status_code = $body["statusCode"];If ($status_code == "000000") {//状态码为000000, 说明请求成功echo "请求成功:" . $result["body"];} else {//状态码非000000, 说明请求失败echo "请求失败:" . $result["body"];}} else {//返回内容异常,发送请求失败,以下可根据业务逻辑自行修改echo "发送请求失败";}/*** 转发请求到目的主机* @param $method string 请求方法* @param $URL string 请求地址* @param null $headers 请求头* @param null $param 请求参数* @return array|bool*/function apishop_curl(&$method, &$URL, &$headers = NULL, &$param = NULL) {// 初始化请求$require = curl_init($URL);// 判断是否HTTPS$isHttps = substr($URL, 0, 8) == "https://" ? TRUE : FALSE;// 设置请求方式switch ($method) {case "GET":curl_setopt($require, CURLOPT_CUSTOMREQUEST, "GET");break;case "POST":curl_setopt($require, CURLOPT_CUSTOMREQUEST, "POST");break;default:return FALSE;}if ($param) {curl_setopt($require, CURLOPT_POSTFIELDS, $param);}if ($isHttps) {// 跳过证书检查curl_setopt($require, CURLOPT_SSL_VERIFYPEER, FALSE);// 检查证书中是否设置域名curl_setopt($require, CURLOPT_SSL_VERIFYHOST, 2);}if ($headers) {// 设置请求头curl_setopt($require, CURLOPT_HTTPHEADER, $headers);}// 返回结果不直接输出curl_setopt($require, CURLOPT_RETURNTRANSFER, TRUE);// 重定向curl_setopt($require, CURLOPT_FOLLOWLOCATION, TRUE);// 把返回头包含再输出中curl_setopt($require, CURLOPT_HEADER, TRUE);// 发送请求$response = curl_exec($require);// 获取头部长度$headerSize = curl_getinfo($require, CURLINFO_HEADER_SIZE);// 关闭请求curl_close($require);if ($response) {// 返回头部字符串$header = substr($response, 0, $headerSize);// 返回体$body = substr($response, $headerSize);// 过滤隐藏非法字符$bodyTemp = json_encode(array(0 => $body));$bodyTemp = str_replace("", "", $bodyTemp);$bodyTemp = json_decode($bodyTemp, TRUE);$body = trim($bodyTemp[0]);// 将返回结果头部转成数组$respondHeaders = array();$header_rows = array_filter(explode(PHP_EOL, $header), "trim"); foreach ($header_rows as $row) {$keylen = strpos($row, ":");if ($keylen) {$respondHeaders[] = array("key" => substr($row, 0, $keylen),"value" => trim(substr($row, $keylen + 1)));}}return array("headers" => $respondHeaders,"body" => $body);} else {return FALSE;}}2.查询制定城市PM2.5空气质量<?php$method = "POST";$url = "https:///common/air/getCityPM25Detail"; $headers = NULL;$params = array("city"=>"" //城市,如“广州市”);$result = apishop_curl($method, $url, $headers, $params);If ($result) {$body = json_decode($result["body"], TRUE);$status_code = $body["statusCode"];If ($status_code == "000000") {//状态码为000000, 说明请求成功echo "请求成功:" . $result["body"];} else {//状态码非000000, 说明请求失败echo "请求失败:" . $result["body"];}} else {//返回内容异常,发送请求失败,以下可根据业务逻辑自行修改echo "发送请求失败";}/*** 转发请求到目的主机* @param $method string 请求方法* @param $URL string 请求地址* @param null $headers 请求头* @param null $param 请求参数* @return array|bool*/function apishop_curl(&$method, &$URL, &$headers = NULL, &$param = NULL) {// 初始化请求$require = curl_init($URL);// 判断是否HTTPS$isHttps = substr($URL, 0, 8) == "https://" ? TRUE : FALSE;// 设置请求方式switch ($method) {case "GET":curl_setopt($require, CURLOPT_CUSTOMREQUEST, "GET");break;case "POST":curl_setopt($require, CURLOPT_CUSTOMREQUEST, "POST");break;default:return FALSE;}if ($param) {curl_setopt($require, CURLOPT_POSTFIELDS, $param);}if ($isHttps) {// 跳过证书检查curl_setopt($require, CURLOPT_SSL_VERIFYPEER, FALSE);// 检查证书中是否设置域名curl_setopt($require, CURLOPT_SSL_VERIFYHOST, 2);}if ($headers) {// 设置请求头curl_setopt($require, CURLOPT_HTTPHEADER, $headers);}// 返回结果不直接输出curl_setopt($require, CURLOPT_RETURNTRANSFER, TRUE);// 重定向curl_setopt($require, CURLOPT_FOLLOWLOCATION, TRUE);// 把返回头包含再输出中curl_setopt($require, CURLOPT_HEADER, TRUE);// 发送请求$response = curl_exec($require);// 获取头部长度$headerSize = curl_getinfo($require, CURLINFO_HEADER_SIZE);// 关闭请求curl_close($require);if ($response) {// 返回头部字符串$header = substr($response, 0, $headerSize);// 返回体$body = substr($response, $headerSize);// 过滤隐藏非法字符$bodyTemp = json_encode(array(0 => $body));$bodyTemp = str_replace("", "", $bodyTemp);$bodyTemp = json_decode($bodyTemp, TRUE);$body = trim($bodyTemp[0]);// 将返回结果头部转成数组$respondHeaders = array();$header_rows = array_filter(explode(PHP_EOL, $header), "trim"); foreach ($header_rows as $row) {$keylen = strpos($row, ":");if ($keylen) {$respondHeaders[] = array("key" => substr($row, 0, $keylen),"value" => trim(substr($row, $keylen + 1)));}}return array("headers" => $respondHeaders,"body" => $body);} else {return FALSE;}}。
生活指数api接口实现及代码示例

生活指数 api 接口实现及代码示例查询生活指数 api,管理好天气和生活,下面将和大家分享的是生活指数 api,它支持不同的城市的天 气预报查询未来 7 天、生活指数、PM2.5 等。
接口地址:/onebox/weather/query 支持格式:JSON/XML 请求方式:HTTP GET/POST 请求示例: /onebox/weather/query?cityname=%E6%B8%A9%E5%B7%9E&key= 您申请的 KEY 接口备注:根据城市查询天气,未来 7 天、生活指数、PM2.5 请求参数: 名称 类型 必填 说明cityname key dtypestring string string是 是 否要查询的城市,如:温州、上海、北京 应用 APPKEY(应用详细页查询) 返回数据的格式,xml 或 json,默认 json调用样例及调试工具: API 测试工具 返回字段: 名称 error_code reason result 类型 int string string 说明 返回码 返回说明 返回结果集生活指数 api JSON 返回示例: { "reason": "查询成功", "result": { "data": { "realtime": { "city_code": "101210701","city_name": "温州", "date": "2014-10-15", "time": "09:00:00", "week": 3, "moon": "九月廿二", "dataUptime": 1413337811, "weather": {/*城市*/ /*日期*/ /*更新时间*//*当前实况天气*/ /*温度*/ /*湿度*/"temperature": "19", "humidity": "54", "info": "雾", "img": "18" }, "wind": { "direct": "北风", "power": "1 级", "offset": null, "windspeed": null } }, "life": { "info": { "chuanyi": [ "较舒适", /*生活指数*/ "date": "2014-10-15",/*穿衣指数*/"建议着薄外套或牛仔衫裤等服装。
基于R语言的城市PM2.5影响因素分析
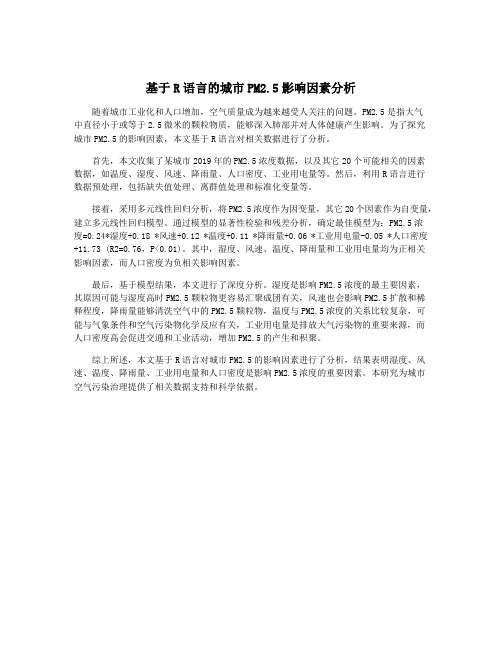
基于R语言的城市PM2.5影响因素分析随着城市工业化和人口增加,空气质量成为越来越受人关注的问题。
PM2.5是指大气中直径小于或等于2.5微米的颗粒物质,能够深入肺部并对人体健康产生影响。
为了探究城市PM2.5的影响因素,本文基于R语言对相关数据进行了分析。
首先,本文收集了某城市2019年的PM2.5浓度数据,以及其它20个可能相关的因素数据,如温度、湿度、风速、降雨量、人口密度、工业用电量等。
然后,利用R语言进行数据预处理,包括缺失值处理、离群值处理和标准化变量等。
接着,采用多元线性回归分析,将PM2.5浓度作为因变量,其它20个因素作为自变量,建立多元线性回归模型。
通过模型的显著性检验和残差分析,确定最佳模型为:PM2.5浓度=0.24*湿度+0.18 *风速+0.12 *温度+0.11 *降雨量+0.06 *工业用电量-0.05 *人口密度+11.73 (R2=0.76,P<0.01)。
其中,湿度、风速、温度、降雨量和工业用电量均为正相关影响因素,而人口密度为负相关影响因素。
最后,基于模型结果,本文进行了深度分析。
湿度是影响PM2.5浓度的最主要因素,其原因可能与湿度高时PM2.5颗粒物更容易汇聚成团有关,风速也会影响PM2.5扩散和稀释程度,降雨量能够清洗空气中的PM2.5颗粒物,温度与PM2.5浓度的关系比较复杂,可能与气象条件和空气污染物化学反应有关,工业用电量是排放大气污染物的重要来源,而人口密度高会促进交通和工业活动,增加PM2.5的产生和积聚。
综上所述,本文基于R语言对城市PM2.5的影响因素进行了分析,结果表明湿度、风速、温度、降雨量、工业用电量和人口密度是影响PM2.5浓度的重要因素。
本研究为城市空气污染治理提供了相关数据支持和科学依据。
基于OpenAPI的Python空气质量监测数据程序设计

基于OpenAPI的Python空气质量监测数据程序设计
陈琳;任芳
【期刊名称】《贵州气象》
【年(卷),期】2016(040)003
【摘要】环境气象预报是政府和环保部门应对空气重污染时的重要决策支撑.只有实时快捷地获取当前空气质量监测数据,气象部门才能正常开展环境气象预报业务.为了快速、准确地获取西南区域空气质量监测产品,并生成Micaps格式产品,开发了基于一个OpenAPI的Python多线程程序.程序可直接调用API底层连接的数据库,获取数据效率高,具有较高的实时性和准确性,已投入四川省气象台天气预报业务运行.
【总页数】4页(P78-81)
【作者】陈琳;任芳
【作者单位】四川省气象台,四川成都610072;陕西省气象服务中心,陕西西安710014
【正文语种】中文
【中图分类】TP311
【相关文献】
1.基于动态Web的Python多线程空气质量数据程序设计 [J], 陈琳;李容
2.基于环境监测数据的 APEC 会议空气质量保障环境改善效果评估 [J], 孙峰;张大伟;董欣;孙瑞雯;刘保献;徐文帅;程念亮;王占山
3.基于“天地图”的江苏省城市空气质量 PM2.5监测数据平台的设计与实现 [J], 陈年松
4.基于动态Web的Python多线程空气质量数据程序设计 [J], 陈琳;李容;
5.基于某市空气质量监测数据的处理方法研究 [J], 邓琴
因版权原因,仅展示原文概要,查看原文内容请购买。
- 1、下载文档前请自行甄别文档内容的完整性,平台不提供额外的编辑、内容补充、找答案等附加服务。
- 2、"仅部分预览"的文档,不可在线预览部分如存在完整性等问题,可反馈申请退款(可完整预览的文档不适用该条件!)。
- 3、如文档侵犯您的权益,请联系客服反馈,我们会尽快为您处理(人工客服工作时间:9:00-18:30)。
基于Python的城市空气PM2.5指数接口调用代码实例
#!/usr/bin/python
# -*- coding: utf-8 -*-
import json, urllib
from urllib import urlencode
#----------------------------------
# 空气质量调用示例代码-聚合数据
# 在线接口文档:/docs/33
#----------------------------------
def main():
#配置您申请的APPKey
appkey ="*********************"
#1.城市空气质量
request1(appkey,"GET")
#2.城市空气PM2.5指数
request2(appkey,"GET")
#3.城市空气质量-城市列表
request3(appkey,"GET")
#4.城市空气PM2.5指数-城市列表
request4(appkey,"GET")
#5.城市辐射指数
request5(appkey,"GET")
#城市空气质量
def request1(appkey, m="GET"):
url =":8080/environment/air/cityair"
params ={
"city": "", #城市名称的中文名称或拼音,如:上海或 shanghai
"key": appkey, #APP Key
}
params =urlencode(params)
if m =="GET":
f =urllib.urlopen("%s?%s"%(url, params))
else:
f =urllib.urlopen(url, params)
content =f.read()
res =json.loads(content)
if res:
error_code =res["error_code"]
if error_code ==0:
#成功请求
print res["result"]
else:
print"%s:%s"%(res["error_code"],res["reason"]) else:
print"request api error"
#城市空气PM2.5指数
def request2(appkey, m="GET"):
url =":8080/environment/air/pm"
params ={
"city": "", #城市名称的中文名称或拼音,如:上海或 shanghai
"key": appkey, #APP Key
}
params =urlencode(params)
if m =="GET":
f =urllib.urlopen("%s?%s"%(url, params))
else:
f =urllib.urlopen(url, params)
content =f.read()
res =json.loads(content)
if res:
error_code =res["error_code"]
if error_code ==0:
#成功请求
print res["result"]
else:
print"%s:%s"%(res["error_code"],res["reason"]) else:
print"request api error"
#城市空气质量-城市列表
def request3(appkey, m="GET"):
url =":8080/environment/air/airCities"
params ={
"key": appkey, #APP Key
}
params =urlencode(params)
if m =="GET":
f =urllib.urlopen("%s?%s"%(url, params))
else:
f =urllib.urlopen(url, params)
content =f.read()
res =json.loads(content)
if res:
error_code =res["error_code"]
if error_code ==0:
#成功请求
print res["result"]
else:
print"%s:%s"%(res["error_code"],res["reason"]) else:
print"request api error"
#城市空气PM2.5指数-城市列表
def request4(appkey, m="GET"):
url =":8080/environment/air/pmCities"
params ={
"key": appkey, #APP Key
}
params =urlencode(params)
if m =="GET":
f =urllib.urlopen("%s?%s"%(url, params))
else:
f =urllib.urlopen(url, params)
content =f.read()
res =json.loads(content)
if res:
error_code =res["error_code"]
if error_code ==0:
#成功请求
print res["result"]
else:
print"%s:%s"%(res["error_code"],res["reason"]) else:
print"request api error"
#城市辐射指数
def request5(appkey, m="GET"):
url =":8080/environment/air/radia"
params ={
"city": "", #城市名称的中文拼音,查询城市为“上海”,则输入:上海
"num": "", #查询页码数,不写默认为第一页。
"key": appkey, #APP Key
}
params =urlencode(params)
if m =="GET":
f =urllib.urlopen("%s?%s"%(url, params))
else:
f =urllib.urlopen(url, params)
content =f.read()
res =json.loads(content)
if res:
error_code =res["error_code"]
if error_code ==0:
#成功请求
print res["result"]
else:
print"%s:%s"%(res["error_code"],res["reason"]) else:
print"request api error"
if__name__ =='__main__':
main()。
