chap10_anomaly_detection
ABSTRACT Anomaly Detection of Web-based Attacks

Anomaly Detection of Web-based AttacksChristopher Kruegel chris@Giovanni Vignavigna@ Reliable Software GroupUniversity of California,Santa Barbara Santa Barbara,CA93106ABSTRACTWeb-based vulnerabilities represent a substantial portion of the security exposures of computer networks.In order to de-tect known web-based attacks,misuse detection systems are equipped with a large number of signatures.Unfortunately,it is difficult to keep up with the daily disclosure of web-related vulnerabilities,and,in addition,vulnerabilities may be intro-duced by installation-specific web-based applications.There-fore,misuse detection systems should be complemented with anomaly detection systems.This paper presents an intrusion detection system that uses a number of different anomaly de-tection techniques to detect attacks against web servers and web-based applications.The system correlates the server-side programs referenced by client queries with the parameters contained in these queries.The application-specific charac-teristics of the parameters allow the system to perform fo-cused analysis and produce a reduced number of false posi-tives.The system derives automatically the parameter pro-files associated with web applications(e.g.,length and struc-ture of parameters)from the analyzed data.Therefore,it can be deployed in very different application environments without having to perform time-consuming tuning and con-figuration.Categories and Subject DescriptorsD.4.6[Operating Systems]:Security and ProtectionGeneral TermsSecurityKeywordsAnomaly Detection,World-Wide Web,Network Security 1.INTRODUCTIONWeb servers and web-based applications are popular at-tack targets.Web servers are usually accessible through cor-poratefirewalls,and web-based applications are often devel-Permission to make digital or hard copies of all or part of this work for personal or classroom use is granted without fee provided that copies are not made or distributed for profit or commercial advantage and that copies bear this notice and the full citation on thefirst page.To copy otherwise,to republish,to post on servers or to redistribute to lists,requires prior specific permission and/or a fee.CCS’03,October27–31,2003,Washington,DC,USA.Copyright2003ACM1-58113-738-9/03/0010...$5.00.oped without following a sound security methodology.At-tacks that exploit web servers or server extensions(e.g.,pro-grams invoked through the Common Gateway Interface[7] and Active Server Pages[22])represent a substantial por-tion of the total number of vulnerabilities.For example,in the period between April2001and March2002,web-related vulnerabilities accounted for23%of the total number of vul-nerabilities disclosed[34].In addition,the large installation base makes both web applications and servers a privileged target for worm programs that exploit web-related vulnera-bilities to spread across networks[5].To detect web-based attacks,intrusion detection systems (IDSs)are configured with a number of signatures that sup-port the detection of known attacks.For example,at the time of writing,Snort2.0[28]devotes868of its1931signatures to detect web-related attacks.Unfortunately,it is hard to keep intrusion detection signature sets updated with respect to the large numbers of vulnerabilities discovered daily.In addition,vulnerabilities may be introduced by custom web-based applications developed in-house.Developing ad hoc signatures to detect attacks against these applications is a time-intensive and error-prone activity that requires substan-tial security expertise.To overcome these issues,misuse detection systems should be composed with anomaly detection systems,which sup-port the detection of new attacks.In addition,anomaly detection systems can be trained to detect attacks against custom-developed web-based applications.Unfortunately,to the best of our knowledge,there are no available anomaly de-tection systems tailored to detect attacks against web servers and web-based applications.This paper presents an anomaly detection system that de-tects web-based attacks using a number of different tech-niques.The anomaly detection system takes as input the web server logfiles which conform to the Common Log For-mat and produces an anomaly score for each web request. More precisely,the analysis techniques used by the tool take advantage of the particular structure of HTTP queries[11] that contain parameters.The parameters of the queries are compared with established profiles that are specific to the program or active document being referenced.This approach supports a more focused analysis with respect to generic anomaly detection techniques that do not take into account the specific program being invoked.This paper is structured as follows.Section2presents re-lated work on detection of web-based attacks and anomaly detection in general.Section3describes an abstract model for the data analyzed by our intrusion detection system.Sec-tion4presents the anomaly detection techniques used.Sec-tion5contains the experimental evaluation of the systemwith respect to real-world data and discusses the results ob-tained so far and the limitations of the approach.Finally, Section6draws conclusions and outlines future work.2.RELATED WORKAnomaly detection relies on models of the intended behav-ior of users and applications and interprets deviations from this‘normal’behavior as evidence of malicious activity[10, 17,13,19].This approach is complementary with respect to misuse detection,where a number of attack descriptions (usually in the form of signatures)are matched against the stream of audited events,looking for evidence that one of the modeled attacks is occurring[14,25,23].A basic assumption underlying anomaly detection is that attack patterns differ from normal behavior.In addition, anomaly detection assumes that this‘difference’can be ex-pressed quantitatively.Under these assumptions,many tech-niques have been proposed to analyze different data streams, such as data mining for network traffic[21],statistical analy-sis for audit records[16],and sequence analysis for operating system calls[12].Of particular relevance to the work described here are tech-niques that learn the detection parameters from the ana-lyzed data.For instance,the framework developed by Lee et al.[20]provides guidelines to extract features that are useful for building intrusion classification models.The approach uses labeled data to derive which is the best set of features to be used in intrusion detection.The approach described in this paper is similar to Lee’s because it relies on a set of selected features to perform both classification and link analysis on the data.On the other hand,the approach is different because it does not rely on the labeling of attacks in the training data in order to derive either the features or the threshold values used for detection. The learning process is purely based on past data,as,for example,in[18].3.DATA MODELOur anomaly detection approach analyzes HTTP requests as logged by most common web servers(for example,Apache [2]).More specifically,the analysis focuses on GET requests that use parameters to pass values to server-side programs or active documents.Neither header data of GET requests nor POST/HEAD requests are taken into account.Note,however, that it is straightforward to include the parameters of these requests.This is planned for future work.More formally,the input to the detection process consists of an ordered set U={u1,u2,...,u m}of URIs extracted from successful GET requests,that is,requests whose return code is greater or equal to200and less than300.A URI u i can be expressed as the composition of the path to the desired resource(path i),an optional path information component(pinfo i),and an optional query string(q).The query string is used to pass parameters to the referenced resource and it is identified by a leading‘?’character.A query string consists of an ordered list of n pairs of param-eters(or attributes)with their corresponding values.That is,q=(a1,v1),(a2,v2),...,(a n,v n)where a i∈A,the set of all attributes,and v i is a string.The set S q is defined as the subset{a j,...,a k}of attributes of query q.Figure1shows an example of an entry from a web server log and the cor-responding elements that are used in the analysis.For this example query q,S q={a1,a2}.The analysis process focuses on the association between programs,parameters,and their values.URIs that do not contain a query string are irrelevant,and,therefore,they are removed from U.In addition,the set of URIs U is partitioned into subsets U r according to the resource path.Therefore, each referred program r is assigned a set of corresponding queries U r.The anomaly detection algorithms are run on each set of queries U r,independently.This means that the modeling and the detection process are performed separately for each program r.In the following text,the term‘request’refers only to re-quests with queries.Also,the terms‘parameter’and‘at-tribute’of a query are used interchangeably.4.DETECTION MODELSThe anomaly detection process uses a number of different models to identify anomalous entries within a set of input requests U r associated with a program r.A model is a set of procedures used to evaluate a certain feature of a query attribute(e.g.,the string length of an attribute value)or a certain feature of the query as a whole(e.g.,the presence and absence of a particular attribute).Each model is associated with an attribute(or a set of attributes)of a program by means of a profile.Consider,for example,the string length model for the username attribute of a login program.In this case,the profile for the string length model captures the ‘normal’string length of the user name attribute of the login program.The task of a model is to assign a probability value to either a query or one of the query’s attributes.This proba-bility value reflects the probability of the occurrence of the given feature value with regards to an established profile. The assumption is that feature values with a sufficiently low probability(i.e.,abnormal values)indicate a potential at-tack.Based on the model outputs(i.e.,the probability values of the query and its individual attributes),a decision is made–that is,the query is either reported as a potential attack or as normal.This decision is reached by calculating an anomaly score individually for each query attribute and for the query as a whole.When one or more anomaly scores(either for the query or for one of its attributes)exceed the detection threshold determined during the training phase(see below), the whole query is marked as anomalous.This is necessary to prevent attackers from hiding a single malicious attribute in a query with many‘normal’attributes.The anomaly scores for a query and its attributes are de-rived from the probability values returned by the correspond-ing models that are associated with the query or one of the attributes.The anomaly score value is calculated using a weighted sum as shown in Equation1.In this equation,w m represents the weight associated with model m,while p m is its returned probability value.The probability p m is sub-tracted from1because a value close to zero indicates an anomalous event that should yield a high anomaly score.Anomaly Score=m∈Modelsw m∗(1−p m)(1)A model can operate in one of two modes,training or de-tection.The training phase is required to determine the char-acteristics of normal events(that is,the profile of a feature according to a specific model)and to establish anomaly score thresholds to distinguish between regular and anomalous in-169.229.60.105 − johndoe [6/Nov/2002:23:59:59 −0800 "GET /scripts/access.pl?user=johndoe&cred=admin" 200 2122path a = v a = v1122qFigure1:Sample Web Server Access Log Entryputs.This phase is divided into two steps.During thefirst step,the system creates profiles for each server-side program and its attributes.During the second step,suitable thresh-olds are established.This is done by evaluating queries and their attributes using the profiles created during the previ-ous step.For each program and its attributes,the highest anomaly score is stored and then,the threshold is set to a value that is a certain,adjustable percentage higher than this maximum.The default setting for this percentage(also used for our experiments)is10%.By modifying this value,the user can adjust the sensitivity of the system and perform a trade-offbetween the number of false positives and the ex-pected detection accuracy.The length of the training phase (i.e.,the number of queries and attributes that are utilized to establish the profiles and the thresholds)is determined by an adjustable parameter.Once the profiles have been created–that is,the models have learned the characteristics of normal events and suit-able thresholds have been derived–the system switches to detection mode.In this mode,anomaly scores are calculated and anomalous queries are reported.The following sections describe the algorithms that ana-lyze the features that are considered relevant for detecting malicious activity.For each algorithm,an explanation of the model creation process(i.e.,the learning phase)is included. In addition,the mechanism to derive a probability value p fora new input element(i.e.,the detection phase)is discussed.4.1Attribute LengthIn many cases,the length of a query attribute can be used to detect anomalous ually,parameters are either fixed-size tokens(such as session identifiers)or short strings derived from human input(such asfields in an HTML form). Therefore,the length of the parameter values does not vary much between requests associated with a certain program. The situation may look different when malicious input is passed to the program.For example,to overflow a buffer in a target application,it is necessary to ship the shell code and additional padding,depending on the length of the tar-get buffer.As a consequence,the attribute contains up to several hundred bytes.The goal of this model is to approximate the actual but unknown distribution of the parameter lengths and detect instances that significantly deviate from the observed normal behavior.Clearly,we cannot expect that the probability density function of the underlying real distribution will follow a smooth curve.We also have to assume that the distribution has a large variance.Nevertheless,the model should be able to identify significant deviations.4.1.1LearningWe approximate the mean˙µand the variance˙σ2of the real attribute length distribution by calculating the sample mean µand the sample varianceσ2for the lengths l1,l2,...,l n of the parameters processed during the learning phase(assum-ing that n queries with this attribute were processed).4.1.2DetectionGiven the estimated query attribute length distribution with parametersµandσ2as determined by the previous learning phase,it is the task of the detection phase to assess the regularity of a parameter with length l.The probability of l can be calculated using the Chebyshev inequality shown below.p(|x−µ|>t)<σ2t2(2) The Chebyshev inequality puts an upper bound on the probability that the difference between the value of a ran-dom variable x andµexceeds a certain threshold t,for an arbitrary distribution with varianceσ2and meanµ.This upper bound is strict and has the advantage that is does not assume a certain underlying distribution.We substitute the threshold t with the distance between the attribute length l and the meanµof the attribute length distribution(i.e., |l−µ|).This allows us to obtain an upper bound on the prob-ability that the length of the parameter deviates more from the mean than the current instance.The resulting probabil-ity value p(l)for an attribute with length l is calculated as shown below.p(|x−µ|>|l−µ|)<p(l)=σ2(l−µ)2(3)This is the value returned by the model when operating in detection mode.The Chebyshev inequality is independent of the underlying distribution and its computed bound is,in general,very weak.Applied to our model,this weak bound results in a high degree of tolerance to deviations of attribute lengths given an empirical mean and variance.Although such a property is undesirable in many situations,by using this technique only obvious outliers areflagged as suspicious, leading to a reduced number of false alarms.4.2Attribute Character DistributionThe attribute character distribution model captures the concept of a‘normal’or‘regular’query parameter by look-ing at its character distribution.The approach is based on the observation that attributes have a regular structure, are mostly human-readable,and almost always contain only printable characters.A large percentage of characters in such attributes are drawn from a small subset of the256possible8-bit values (mainly from letters,numbers,and a few special charac-ters).As in English text,the characters are not uniformly distributed,but occur with different frequencies.Obviously, it cannot be expected that the frequency distribution is iden-tical to a standard English text.Even the frequency of a cer-tain character(e.g.,the frequency of the letter‘e’)varies con-siderably between different attributes.Nevertheless,there are similarities between the character frequencies of query parameters.This becomes apparent when the relative fre-quencies of all possible256characters are sorted in descend-ing order.The algorithm is based only on the frequency values them-selves and does not rely on the distributions of particular characters.That is,it does not matter whether the character with the most occurrences is an‘a’or a‘/’.In the following, the sorted,relative character frequencies of an attribute are called its character distribution.For example,consider the parameter string‘passwd’with the corresponding ASCII values of‘11297115115119100’. The absolute frequency distribution is2for115and1for the four others.When these absolute counts are transformed into sorted,relative frequencies(i.e.,the character distribution), the resulting values are0.33,0.17,0.17,0.17,0.17followed by0occurring251times.For an attribute of a legitimate query,one can expect that the relative frequencies slowly decrease in value.In case of malicious input,however,the frequencies can drop extremely fast(because of a peak caused by a single character with a very high frequency)or nearly not at all(in case of random values).The character distribution of an attribute that is perfectly normal(i.e.,non-anomalous)is called the attribute’s ideal-ized character distribution(ICD).The idealized character distribution is a discrete distribution with:ICD:→with={n∈N|0≤n≤255},={p∈|0≤p≤1}and255i=0ICD(i)=1.0.The relative frequency of the character that occurs n-most often(0-most denoting the maximum)is given as ICD(n). When the character distribution of the sample parameter ‘passwd’is interpreted as the idealized character distribution, then ICD(0)=0.33and ICD(1)to ICD(4)are equal to0.17. In contrast to signature-based approaches,this model has the advantage that it cannot be evaded by some well-known attempts to hide malicious code inside a string.In fact, signature-based systems often contain rules that raise an alarm when long sequences of0x90bytes(the nop operation in Intel x86-based architectures)are detected in a packet. An intruder may substitute these sequences with instructions that have a similar behavior(e.g.,add rA,rA,0,which adds 0to the value in register A and stores the result back to A). By doing this,it is possible to prevent signature-based sys-tems from detecting the attack.Such sequences,nonetheless, cause a distortion of the attribute’s character distribution, and,therefore,the character distribution analysis still yields a high anomaly score.In addition,characters in malicious in-put are sometimes disguised by xor’ing them with constants or shifting them by afixed value(e.g.,using the ROT-13 code).In this case,the payload only contains a small rou-tine in clear text that has the task of decrypting and launch-ing the primary attack code.These evasion attempts do not change the resulting character distribution and the anomaly score of the analyzed query parameter is unaffected.4.2.1LearningThe idealized character distribution is determined during the training phase.For each observed query attribute,its character distribution is stored.The idealized character dis-tribution is then approximated by calculating the average of all stored character distributions.This is done by setting ICD(n)to the mean of the n th entry of the stored character distributions∀n:0≤n≤255.Because all individual char-acter distributions sum up to unity,their average will do so as well,and the idealized character distribution is well-defined.4.2.2DetectionGiven an idealized character distribution ICD,the task of the detection phase is to determine the probability that the character distribution of a query attribute is an actual sam-ple drawn from its ICD.This probability,or more precisely, the confidence in the hypothesis that the character distribu-tion is a sample from the idealized character distribution,is calculated by a statistical test.This test should yield a high confidence in the correctness of the hypothesis for normal(i.e.,non-anomalous)attributes while it should reject anomalous ones.The detection algo-rithm uses a variant of the Pearsonχ2-test as a‘goodness-of-fit’test[4].For the intended statistical calculations,it is not neces-sary to operate on all values of ICD directly.Instead,it is enough to consider a small number of intervals,or bins.For example,assume that the domain of ICD is divided into six segments as shown in Table1.Although the choice of six bins is somewhat arbitrary1,it has no significant impact on the results.Segment012345x-Values01-34-67-1112-1516-255Table1:Bins for theχ2-testThe expected relative frequency of characters in a segment can be easily determined by adding the values of ICD for the corresponding x-values.Because the relative frequencies are sorted in descending order,it can be expected that the values of ICD(x)are more significant for the anomaly score when x is small.This fact is clearly reflected in the division of ICD’s domain.When a new query attribute is analyzed,the number of occurrences of each character in the string is determined. Afterward,the values are sorted in descending order and combined according to Table1by aggregating values that belong to the same segment.Theχ2-test is then used to cal-culate the probability that the given sample has been drawn from the idealized character distribution.The standard test requires the following steps to be performed.1.Calculate the observed and expected frequencies-Theobserved values O i(one for each bin)are already given.The expected number of occurrences E i are calculated by multiplying the relative frequencies of each of the six bins as determined by the ICD times the length of the attribute(i.e.,the length of the string).pute theχ2-value asχ2=i<6i=0(O i−E i)2E i-note that i ranges over all six bins.3.Determine the degrees of freedom and obtain the sig-nificance-The degrees of freedom for theχ2-test are identical to the number of addends in the formula above minus one,which yieldsfive for the six bins used.The actual probability p that the sample is derived from the idealized character distribution(that is,its signif-icance)is read from a predefined table using theχ2-value as index.1The number six seems to have a particular relevance to the field of anomaly detection[32].The derived value p is used as the return value for this model.When the probability that the sample is drawn from the idealized character distribution increases,p increases as well.4.3Structural InferenceOften,the manifestation of an exploit is immediately vis-ible in query attributes as unusually long parameters or pa-rameters that contain repetitions of non-printable characters. Such anomalies are easily identifiable by the two mechanisms explained before.There are situations,however,when an attacker is able to craft her attack in a manner that makes its manifestation appear more regular.For example,non-printable characters can be replaced by groups of printable characters.In such situations,we need a more detailed model of the query at-tribute that contains the evidence of the attack.This model can be acquired by analyzing the parameter’s structure.For our purposes,the structure of a parameter is the regular grammar that describes all of its normal,legitimate values.4.3.1LearningWhen structural inference is applied to a query attribute, the resulting grammar must be able to produce at least all training examples.Unfortunately,there is no unique gram-mar that can be derived from a set of input elements.When no negative examples are given(i.e.,elements that should not be derivable from the grammar),it is always possible to create either a grammar that contains exactly the train-ing data or a grammar that allows production of arbitrary strings.Thefirst case is a form of over-simplification,as the resulting grammar is only able to derive the learned in-put without providing any level of abstraction.This means that no new information is deduced.The second case is a form of over-generalization because the grammar is capable of producing all possible strings,but there is no structural information left.The basic approach used for our structural inference is to generalize the grammar as long as it seems to be‘reasonable’and stop before too much structural information is lost.The notion of‘reasonable generalization’is specified with the help of Markov models and Bayesian probability.In afirst step,we consider the set of training items(i.e., query attributes stored during the training phase)as the out-put of a probabilistic grammar.A probabilistic grammar is a grammar that assigns probabilities to each of its productions. This means that some words are more likely to be produced than others,whichfits well with the evidence gathered from query parameters.Some values appear more often,and this is important information that should not be lost in the mod-eling step.A probabilistic regular grammar can be transformed into a non-deterministicfinite automaton(NF A).Each state S of the automaton has a set of n S possible output symbols o which are emitted with a probability of p S(o).Each transi-tion t is marked with a probability p(t)that characterizes the likelihood that the transition is taken.An automaton that has probabilities associated with its symbol emissions and its transitions can also be considered a Markov model.The output of the Markov model consists of all paths from its start state to its terminal state.A probability value can be assigned to each output word w(that is,a sequence of output symbols o1,o2,...,o k).This probability value(as shown in Equation4)is calculated as the sum of the probabilities of all distinct paths through the automaton that produce w.The probability of a single path is the product of the probabili-ties of the emitted symbols p Si(o i)and the taken transitions p(t i).The probabilities of all possible output words w sum up to1.p(w)=p(o1,o2,...,o k)=(4) (paths p f or w)(states∈p)p Si(o i)∗p(t i)Figure2:Markov Model ExampleFor example,consider the NF A in Figure2.To calculate the probability of the word‘ab’,one has to sum the probabil-ities of the two possible paths(one that follows the left arrow and one that follows the right one).The start state emits no symbol and has a probability of1.Following Equation4,the result isp(w)=(1.0∗0.3∗0.5∗0.2∗0.5∗0.4)+(1.0∗0.7∗1.0∗1.0∗1.0∗1.0)=0.706(5) The target of the structural inference process is tofind a NF A that has the highest likelihood for the given training elements.An excellent technique to derive a Markov model from empirical data is explained in[30].It uses the Bayesian theorem to state this goal asp(Model|T rainingData)=(6) p(T rainingData|Model)∗p(Model)p(T rainingData)The probability of the training data is considered a scal-ing factor in Equation6and it is subsequently ignored.As we are interested in maximizing the a posteriori probability (i.e.,the left-hand side of the equation),we have to maximize the product shown in the enumerator on the right-hand side of the equation.Thefirst term–the probability of the train-ing data given the model–can be calculated for a certain automaton(i.e.,for a certain model)by adding the probabil-ities calculated for each input training element as discussed above.The second term–the prior probability of the model –is not as straightforward.It has to reflect the fact that, in general,smaller models are preferred.The model proba-bility is calculated heuristically and takes into account the total number of states N as well as the number of transitions Strans and emissions S emit at each state S.This is。
AnomalyDetectionTutorial

1.Keep the Anomaly Detection Method at RXD and use the default RXDsettings.2.Change the Mean Calculation Method to Local from the drop-down list.Withthis method,the mean spectrum will be derived from a localized kernel around the pixel.3.Enable the Preview check box.A Preview Window appears.As you move thePreview Window around,areas that are identified as anomalies in the original image display as white areas.The current settings highlight the anomaly in the upper-right corner of the Image window,though there is a lot of visible noise in the Preview Window.4.Keep the Preview Window open and change the Anomaly Detection Methodsetting to UTD.UTD and RXD work identically,but instead of using a sample vector from the data,as with RXD,UTD uses the unit vector.UTD extractsbackground signatures as anomalies and provides a good estimate of the imagebackground.Check the result in the Preview Window.5.Continue to keep the Preview Window open.This time,change the AnomalyDetection Method setting to RXD-UTD,which is a hybrid of the previous two methods you tried.The best condition to use RXD-UTD in is when the anomalies have an energy level that is comparable to,or less than,that of thebackground.In those cases,using UTD by itself does not detect the anomalies, but using RXD-UTD enhances them.Check the result in the Preview Window.6.Keep the detection method at RXD-UTD,but change the Mean CalculationMethod to Global from the drop-down list.With this method setting,the mean spectrum will be derived from the entire dataset.Check the results in the Preview Window.7.Finally,return the Anomaly Detection Method to RXD and leave the MeanCalculation Method at Global from the drop-down list.Check the results in the Preview Window.8.The preview of these settings appears to highlight anomalous areas more whilefiltering out more of the noise.You will use these settings to proceed.9.Click Next to go to the Anomaly Thresholding panel,10.Enter0.15in the Anomaly Detection Threshold field and press the Enterkey.11.View the results in the Preview Window.3.In the Additional Export tab,enable the check boxes for the remaining exports:l Export Anomaly Detection Statistics saves statistics on the thresholding image.The output area units are in square meters.l Export Unthresholded Anomaly Detection Image saves the unthresholded anomaly detection image to an ENVI raster.e the default paths and filenames.5.Click Finish.ENVI creates the output,opens the layers in the Image window,and saves the files to the directory you specified.6.Finally,compare the original image to the anomaly detection image.In theLayer Manager,right-click on the Vector Layer and select Remove.7.Open a Portal and move the Portal to the upper-right in the Image window tothe area where an anomaly appears.8.Adjust the Transparency so you can see both images in the Portal.9.Select File>Exit to exit ENVI.Copyright Notice:ENVI is a registered trademark of Exelis Inc.。
Matlab中的异常检测技术

Matlab中的异常检测技术在现代技术快速发展的时代,我们面对的数据越来越庞大复杂。
一个问题是如何从这些数据中提取出有用的信息。
异常检测技术是其中一种重要的数据分析方法,它可以自动识别出与正常模式不符的观测值,帮助我们寻找问题或发现新的见解。
在Matlab中,有一系列强大的工具和算法可用于异常检测,本文将对其进行探讨和介绍。
1. 异常检测简介异常检测(Anomaly Detection)是指通过对数据进行分析和模式识别来检测出与正常模型或预期行为不符的观测值。
这些观测值通常被称为异常或离群点。
异常检测技术在各个领域都有广泛的应用,如金融领域的欺诈检测、工业领域的故障监测、网络安全领域的入侵检测等。
2. 常见的异常检测算法在Matlab中,有多种异常检测算法可供选择。
其中,基于统计学的方法是最常用的方法之一。
它们包括均值-方差方法、箱线图方法、异常因子法等。
另外,基于机器学习的方法也是热门选择,如支持向量机(SVM)、聚类算法等。
下面将对其中几种经典的异常检测算法进行介绍。
2.1 均值-方差方法均值-方差方法是最简单且常用的异常检测方法之一。
它基于假设数据服从正态分布的概率模型,通过计算观测值与均值的偏差(即标准差)来判断是否为异常。
在Matlab中,可以使用内置函数std来计算标准差,再通过设置阈值来判断是否为异常。
2.2 箱线图方法箱线图方法是一种基于统计学的非参数方法,它使用了四分位数(上四分位数和下四分位数)来判断数据是否含有异常值。
在Matlab中,可以使用箱线图函数boxplot来绘制箱线图,以便可视化数据的分布情况。
2.3 支持向量机(SVM)支持向量机是一种常用的机器学习算法,可以用于异常检测。
它通过找到最优超平面来将正常观测值与异常观测值分开。
在Matlab中,可以使用内置函数fitcsvm来训练SVM模型,再通过预测函数predict来判断新的观测值是否为异常。
2.4 聚类算法聚类算法是一种无监督学习算法,可用于异常检测。
第十三讲 异常检测(Anomaly detection)
CLEMENTINE 12----ANOMALYANOMALY异常检测一种探索性的方法,常用于发现资料中的离群值或其他异常现象不须包含异常现象的训练资料集做为起点,其目的主要在寻找实质上与其他物件不同的异常值,该技术本身不受异常值的影响通过判断离同组其他记录的距离远近来判断异常点,离组中点越远的记录越有可能是异常的异常检测主要寻找在实质与其他物件不同的异常值,该技术本身不受异常值来源的影响。
STEP-1 MODELING—使训练资料格式化;—若不处理缺失值,则在任意变数上有缺失值的样本将被剔除;—处理缺失值:连续变数以均值替代缺失值,分类变数把缺失值看成一个有效组;—two-step群集,用于确定每个样本所在的类,根据输入变数的相似性;—对于连续变数,计算每类的平均值和标准差;对于分类变数,计算每类的次数分布表。
STEP-2 SCORING对每个样本计算variable deviation index(VDI):度量每个样本点到其类标准(c l u s t e r n o r m)的距离.对连续变数则类标准为样本平均值,分类变数则为众数。
计算每个样本的Group Deviation Index (GDI),即对数似然对所有样本按异常指数排序,异常指数越大越有可能是异常点。
一般认为,异常指数小于1或小于1.5,则不是异常点;异常指数大于2,则为异常点。
对每个异常样本,按其V D I 降幂排序,对应的前k 个变数是该样本被视为异常值的主要原因。
STEP-3 REASONINGANOMALY NODE&ANOMALY FIELDSANOMALY FIELDSANOMALYNODEU s e c u s t o ms e t t i n g:I n p u t s:用以建模之变数训练资料集中异常点占的比例(P e r c e n t a g e o f m o s t a n o m a l o u s r e c o r d s i nt h e t r a i n i n g d a t a):注意这个比例是为了确定临界值,实际异常点比例可能未必与指定值相等,而是因数据而异训练集中异常点的数目(N u m b e r o f m o s ta n o m a l o u s r e c o r d s i nt h e t r a i n i n g d a t a);同样,指定的异常点数目也是为了确定临界值,实际的异常点个数因数据而异。
异常侦测集群AnomalyDetectionclustering

類神經網路分析 (Neural Network Analysis) : 利用類神經網路具有學習能力的特性, 經由適當入侵資料與正常資料的訓練 後,使其具有辨識異常行為發生的能 力,目前已廣泛使用在信用卡詐欺偵 測中。
Anomaly Detection的優點及缺點
異常偵測的優點:
異常偵測主要的優點是不需要針對每一個攻擊徵兆建立資料庫,並提出解 決方法,所以在資料庫的成長速度較慢,且在資料比對執行速度會比誤用 偵測速度要來的快。 異常偵測主要利用學習的技術來學習使用者行為,僅需要取出某個正常使 用者的資料模型便可以進行比對,所以節省了資料定義與輸入的時間。
異常偵測集群 Anomaly Detection clustering
Anomaly Detection的崛起
根據美國電腦網路危機處理暨協調中心報告指出,在過 去的幾年內攻擊事件正以指數方式增加,而目前最常用 於入侵偵測的方式是不當行為偵測(misuse detection), 但此方法是利用先前已知的事件建立各種攻擊模式,再 比對找出異於正常行為的行為模式。 然而缺點是必須時常更新特徵資料庫或偵測系統,倘若 現行攻擊行為不存在於攻擊模式資料中,將無法偵測此 行為。 因為如此的限制,使得近來結合Data Mining方法於異常 偵測(anomaly detection)受到廣大的矚目與研究。
資料集群演算與標稱概念圖
集群演算法本身是非監督式學習方法(unsupervised learning), 因此無法得知每一個集群得本身所含的資訊或其所代表的意義, 如下圖之資料集群演算與標稱概念圖所示,集群演算結果仍然 無法判斷測試資料的行為模式。 有鑑於此,系統的建立仍須利用標記技術(labeling technique), 標稱每一個集群為正常或攻擊模式,而這一組具標稱的集群變 成為我們實驗中異常偵測系統的核心,因此我們可以利用這些 具有標稱的集群作測試資料的比對並預測其行為模式。
异常检测(AnomalyDetection)

异常检测(AnomalyDetection)github:本⽂算法均使⽤python3实现1. 异常检测1.1 异常检测是什么? 异常检测即为发现与⼤部分样本点不同的样本点,也就是离群点。
我们可通过下⾯这个例⼦进⾏理解,在飞机引擎制造商对制造好的飞机引擎进⾏测试时,选择了对飞机引擎运转时产⽣的热量以及震动强度进⾏测试,测试后的结果如下: 很明显我们能够看出,存在⼀个点(绿⾊),其热量较低时震动强度却很⾼,它在坐标轴中的分布明显偏离了其它的样本点。
因此我们可以认为这个样本点就是异常点即离群点。
1.2 异常检测的⽅法 异常检测不同于监督学习,其正样本(异常点)容量明显远⼩于负样本(正常点)的容量,因此我们并不能使⽤监督学习的⽅法来进⾏异常检测的判断。
对于异常检测主要有以下⼏种⽅法: (1)基于模型的技术:许多异常检测技术⾸先建⽴⼀个数据模型,异常是那些同模型不能完美拟合的对象。
例如,数据分布的模型可以通过估计概率分布的参数来创建。
在假设⼀个对象服从该分布的情况下所计算的值⼩于某个阈值,那么可以认为他是⼀个异常对象。
(2)基于邻近度的技术:通常可以在对象之间定义邻近性度量,异常对象是那些远离⼤部分其他对象的对象。
当数据能够以⼆维或者三维散布图呈现时,可以从视觉上检测出基于距离的离群点。
(3)基于密度的技术:对象的密度估计可以相对直接计算,特别是当对象之间存在邻近性度量。
低密度区域中的对象相对远离近邻,可能被看做为异常。
本⽂主要讨论基于模型的异常检测⽅法1.3 基于模型的异常检测基本步骤 (1)对样本集进⾏建模:P(x) ,即对x的分布概率进⾏建模 (2)对于待检测样本x test,若P(x test)<ϵ则样本为异常,若P(x test)>ϵ则样本为正常。
2. ⾼斯分布2.1 什么是⾼斯分布? ⾼斯分布即为正态分布。
是指对于样本x∈R,假设其服从均值µ ,⽅差σ2的⾼斯分布,可记为x∼N(µ,σ2) 。
Anomaly Detection A Survey(综述)
A modified version of this technical report will appear in ACM Computing Surveys,September2009. Anomaly Detection:A SurveyVARUN CHANDOLAUniversity of MinnesotaARINDAM BANERJEEUniversity of MinnesotaandVIPIN KUMARUniversity of MinnesotaAnomaly detection is an important problem that has been researched within diverse research areas and application domains.Many anomaly detection techniques have been specifically developed for certain application domains,while others are more generic.This survey tries to provide a structured and comprehensive overview of the research on anomaly detection.We have grouped existing techniques into different categories based on the underlying approach adopted by each technique.For each category we have identified key assumptions,which are used by the techniques to differentiate between normal and anomalous behavior.When applying a given technique to a particular domain,these assumptions can be used as guidelines to assess the effectiveness of the technique in that domain.For each category,we provide a basic anomaly detection technique,and then show how the different existing techniques in that category are variants of the basic tech-nique.This template provides an easier and succinct understanding of the techniques belonging to each category.Further,for each category,we identify the advantages and disadvantages of the techniques in that category.We also provide a discussion on the computational complexity of the techniques since it is an important issue in real application domains.We hope that this survey will provide a better understanding of the different directions in which research has been done on this topic,and how techniques developed in one area can be applied in domains for which they were not intended to begin with.Categories and Subject Descriptors:H.2.8[Database Management]:Database Applications—Data MiningGeneral Terms:AlgorithmsAdditional Key Words and Phrases:Anomaly Detection,Outlier Detection1.INTRODUCTIONAnomaly detection refers to the problem offinding patterns in data that do not conform to expected behavior.These non-conforming patterns are often referred to as anomalies,outliers,discordant observations,exceptions,aberrations,surprises, peculiarities or contaminants in different application domains.Of these,anomalies and outliers are two terms used most commonly in the context of anomaly detection; sometimes interchangeably.Anomaly detectionfinds extensive use in a wide variety of applications such as fraud detection for credit cards,insurance or health care, intrusion detection for cyber-security,fault detection in safety critical systems,and military surveillance for enemy activities.The importance of anomaly detection is due to the fact that anomalies in data translate to significant(and often critical)actionable information in a wide variety of application domains.For example,an anomalous traffic pattern in a computerTo Appear in ACM Computing Surveys,092009,Pages1–72.2·Chandola,Banerjee and Kumarnetwork could mean that a hacked computer is sending out sensitive data to an unauthorized destination[Kumar2005].An anomalous MRI image may indicate presence of malignant tumors[Spence et al.2001].Anomalies in credit card trans-action data could indicate credit card or identity theft[Aleskerov et al.1997]or anomalous readings from a space craft sensor could signify a fault in some compo-nent of the space craft[Fujimaki et al.2005].Detecting outliers or anomalies in data has been studied in the statistics commu-nity as early as the19th century[Edgeworth1887].Over time,a variety of anomaly detection techniques have been developed in several research communities.Many of these techniques have been specifically developed for certain application domains, while others are more generic.This survey tries to provide a structured and comprehensive overview of the research on anomaly detection.We hope that it facilitates a better understanding of the different directions in which research has been done on this topic,and how techniques developed in one area can be applied in domains for which they were not intended to begin with.1.1What are anomalies?Anomalies are patterns in data that do not conform to a well defined notion of normal behavior.Figure1illustrates anomalies in a simple2-dimensional data set. The data has two normal regions,N1and N2,since most observations lie in these two regions.Points that are sufficiently far away from the regions,e.g.,points o1 and o2,and points in region O3,are anomalies.Fig.1.A simple example of anomalies in a2-dimensional data set. Anomalies might be induced in the data for a variety of reasons,such as malicious activity,e.g.,credit card fraud,cyber-intrusion,terrorist activity or breakdown of a system,but all of the reasons have a common characteristic that they are interesting to the analyst.The“interestingness”or real life relevance of anomalies is a key feature of anomaly detection.Anomaly detection is related to,but distinct from noise removal[Teng et al. 1990]and noise accommodation[Rousseeuw and Leroy1987],both of which deal To Appear in ACM Computing Surveys,092009.Anomaly Detection:A Survey·3 with unwanted noise in the data.Noise can be defined as a phenomenon in data which is not of interest to the analyst,but acts as a hindrance to data analysis. Noise removal is driven by the need to remove the unwanted objects before any data analysis is performed on the data.Noise accommodation refers to immunizing a statistical model estimation against anomalous observations[Huber1974]. Another topic related to anomaly detection is novelty detection[Markou and Singh2003a;2003b;Saunders and Gero2000]which aims at detecting previously unobserved(emergent,novel)patterns in the data,e.g.,a new topic of discussion in a news group.The distinction between novel patterns and anomalies is that the novel patterns are typically incorporated into the normal model after being detected.It should be noted that solutions for above mentioned related problems are often used for anomaly detection and vice-versa,and hence are discussed in this review as well.1.2ChallengesAt an abstract level,an anomaly is defined as a pattern that does not conform to expected normal behavior.A straightforward anomaly detection approach,there-fore,is to define a region representing normal behavior and declare any observation in the data which does not belong to this normal region as an anomaly.But several factors make this apparently simple approach very challenging:—Defining a normal region which encompasses every possible normal behavior is very difficult.In addition,the boundary between normal and anomalous behavior is often not precise.Thus an anomalous observation which lies close to the boundary can actually be normal,and vice-versa.—When anomalies are the result of malicious actions,the malicious adversaries often adapt themselves to make the anomalous observations appear like normal, thereby making the task of defining normal behavior more difficult.—In many domains normal behavior keeps evolving and a current notion of normal behavior might not be sufficiently representative in the future.—The exact notion of an anomaly is different for different application domains.For example,in the medical domain a small deviation from normal(e.g.,fluctuations in body temperature)might be an anomaly,while similar deviation in the stock market domain(e.g.,fluctuations in the value of a stock)might be considered as normal.Thus applying a technique developed in one domain to another is not straightforward.—Availability of labeled data for training/validation of models used by anomaly detection techniques is usually a major issue.—Often the data contains noise which tends to be similar to the actual anomalies and hence is difficult to distinguish and remove.Due to the above challenges,the anomaly detection problem,in its most general form,is not easy to solve.In fact,most of the existing anomaly detection techniques solve a specific formulation of the problem.The formulation is induced by various factors such as nature of the data,availability of labeled data,type of anomalies to be detected,etc.Often,these factors are determined by the application domain inTo Appear in ACM Computing Surveys,092009.4·Chandola,Banerjee and Kumarwhich the anomalies need to be detected.Researchers have adopted concepts from diverse disciplines such as statistics ,machine learning ,data mining ,information theory ,spectral theory ,and have applied them to specific problem formulations.Figure 2shows the above mentioned key components associated with any anomaly detection technique.Anomaly DetectionTechniqueApplication DomainsMedical InformaticsIntrusion Detection...Fault/Damage DetectionFraud DetectionResearch AreasInformation TheoryMachine LearningSpectral TheoryStatisticsData Mining...Problem CharacteristicsLabels Anomaly Type Nature of Data OutputFig.2.Key components associated with an anomaly detection technique.1.3Related WorkAnomaly detection has been the topic of a number of surveys and review articles,as well as books.Hodge and Austin [2004]provide an extensive survey of anomaly detection techniques developed in machine learning and statistical domains.A broad review of anomaly detection techniques for numeric as well as symbolic data is presented by Agyemang et al.[2006].An extensive review of novelty detection techniques using neural networks and statistical approaches has been presented in Markou and Singh [2003a]and Markou and Singh [2003b],respectively.Patcha and Park [2007]and Snyder [2001]present a survey of anomaly detection techniques To Appear in ACM Computing Surveys,092009.Anomaly Detection:A Survey·5 used specifically for cyber-intrusion detection.A substantial amount of research on outlier detection has been done in statistics and has been reviewed in several books [Rousseeuw and Leroy1987;Barnett and Lewis1994;Hawkins1980]as well as other survey articles[Beckman and Cook1983;Bakar et al.2006].Table I shows the set of techniques and application domains covered by our survey and the various related survey articles mentioned above.12345678TechniquesClassification Based√√√√√Clustering Based√√√√Nearest Neighbor Based√√√√√Statistical√√√√√√√Information Theoretic√Spectral√ApplicationsCyber-Intrusion Detection√√Fraud Detection√Medical Anomaly Detection√Industrial Damage Detection√Image Processing√Textual Anomaly Detection√Sensor Networks√Table parison of our survey to other related survey articles.1-Our survey2-Hodge and Austin[2004],3-Agyemang et al.[2006],4-Markou and Singh[2003a],5-Markou and Singh [2003b],6-Patcha and Park[2007],7-Beckman and Cook[1983],8-Bakar et al[2006]1.4Our ContributionsThis survey is an attempt to provide a structured and a broad overview of extensive research on anomaly detection techniques spanning multiple research areas and application domains.Most of the existing surveys on anomaly detection either focus on a particular application domain or on a single research area.[Agyemang et al.2006]and[Hodge and Austin2004]are two related works that group anomaly detection into multiple categories and discuss techniques under each category.This survey builds upon these two works by significantly expanding the discussion in several directions. We add two more categories of anomaly detection techniques,viz.,information theoretic and spectral techniques,to the four categories discussed in[Agyemang et al.2006]and[Hodge and Austin2004].For each of the six categories,we not only discuss the techniques,but also identify unique assumptions regarding the nature of anomalies made by the techniques in that category.These assumptions are critical for determining when the techniques in that category would be able to detect anomalies,and when they would fail.For each category,we provide a basic anomaly detection technique,and then show how the different existing techniques in that category are variants of the basic technique.This template provides an easier and succinct understanding of the techniques belonging to each category.Further, for each category we identify the advantages and disadvantages of the techniques in that category.We also provide a discussion on the computational complexity of the techniques since it is an important issue in real application domains.To Appear in ACM Computing Surveys,092009.6·Chandola,Banerjee and KumarWhile some of the existing surveys mention the different applications of anomaly detection,we provide a detailed discussion of the application domains where anomaly detection techniques have been used.For each domain we discuss the notion of an anomaly,the different aspects of the anomaly detection problem,and the challenges faced by the anomaly detection techniques.We also provide a list of techniques that have been applied in each application domain.The existing surveys discuss anomaly detection techniques that detect the sim-plest form of anomalies.We distinguish the simple anomalies from complex anoma-lies.The discussion of applications of anomaly detection reveals that for most ap-plication domains,the interesting anomalies are complex in nature,while most of the algorithmic research has focussed on simple anomalies.1.5OrganizationThis survey is organized into three parts and its structure closely follows Figure 2.In Section2we identify the various aspects that determine the formulation of the problem and highlight the richness and complexity associated with anomaly detection.We distinguish simple anomalies from complex anomalies and define two types of complex anomalies,viz.,contextual and collective anomalies.In Section 3we briefly describe the different application domains where anomaly detection has been applied.In subsequent sections we provide a categorization of anomaly detection techniques based on the research area which they belong to.Majority of the techniques can be categorized into classification based(Section4),nearest neighbor based(Section5),clustering based(Section6),and statistical techniques (Section7).Some techniques belong to research areas such as information theory (Section8),and spectral theory(Section9).For each category of techniques we also discuss their computational complexity for training and testing phases.In Section 10we discuss various contextual anomaly detection techniques.We discuss various collective anomaly detection techniques in Section11.We present some discussion on the limitations and relative performance of various existing techniques in Section 12.Section13contains concluding remarks.2.DIFFERENT ASPECTS OF AN ANOMALY DETECTION PROBLEMThis section identifies and discusses the different aspects of anomaly detection.As mentioned earlier,a specific formulation of the problem is determined by several different factors such as the nature of the input data,the availability(or unavailabil-ity)of labels as well as the constraints and requirements induced by the application domain.This section brings forth the richness in the problem domain and justifies the need for the broad spectrum of anomaly detection techniques.2.1Nature of Input DataA key aspect of any anomaly detection technique is the nature of the input data. Input is generally a collection of data instances(also referred as object,record,point, vector,pattern,event,case,sample,observation,entity)[Tan et al.2005,Chapter 2].Each data instance can be described using a set of attributes(also referred to as variable,characteristic,feature,field,dimension).The attributes can be of different types such as binary,categorical or continuous.Each data instance might consist of only one attribute(univariate)or multiple attributes(multivariate).In To Appear in ACM Computing Surveys,092009.Anomaly Detection:A Survey·7 the case of multivariate data instances,all attributes might be of same type or might be a mixture of different data types.The nature of attributes determine the applicability of anomaly detection tech-niques.For example,for statistical techniques different statistical models have to be used for continuous and categorical data.Similarly,for nearest neighbor based techniques,the nature of attributes would determine the distance measure to be used.Often,instead of the actual data,the pairwise distance between instances might be provided in the form of a distance(or similarity)matrix.In such cases, techniques that require original data instances are not applicable,e.g.,many sta-tistical and classification based techniques.Input data can also be categorized based on the relationship present among data instances[Tan et al.2005].Most of the existing anomaly detection techniques deal with record data(or point data),in which no relationship is assumed among the data instances.In general,data instances can be related to each other.Some examples are sequence data,spatial data,and graph data.In sequence data,the data instances are linearly ordered,e.g.,time-series data,genome sequences,protein sequences.In spatial data,each data instance is related to its neighboring instances,e.g.,vehicular traffic data,ecological data.When the spatial data has a temporal(sequential) component it is referred to as spatio-temporal data,e.g.,climate data.In graph data,data instances are represented as vertices in a graph and are connected to other vertices with ter in this section we will discuss situations where such relationship among data instances become relevant for anomaly detection. 2.2Type of AnomalyAn important aspect of an anomaly detection technique is the nature of the desired anomaly.Anomalies can be classified into following three categories:2.2.1Point Anomalies.If an individual data instance can be considered as anomalous with respect to the rest of data,then the instance is termed as a point anomaly.This is the simplest type of anomaly and is the focus of majority of research on anomaly detection.For example,in Figure1,points o1and o2as well as points in region O3lie outside the boundary of the normal regions,and hence are point anomalies since they are different from normal data points.As a real life example,consider credit card fraud detection.Let the data set correspond to an individual’s credit card transactions.For the sake of simplicity, let us assume that the data is defined using only one feature:amount spent.A transaction for which the amount spent is very high compared to the normal range of expenditure for that person will be a point anomaly.2.2.2Contextual Anomalies.If a data instance is anomalous in a specific con-text(but not otherwise),then it is termed as a contextual anomaly(also referred to as conditional anomaly[Song et al.2007]).The notion of a context is induced by the structure in the data set and has to be specified as a part of the problem formulation.Each data instance is defined using following two sets of attributes:To Appear in ACM Computing Surveys,092009.8·Chandola,Banerjee and Kumar(1)Contextual attributes.The contextual attributes are used to determine thecontext(or neighborhood)for that instance.For example,in spatial data sets, the longitude and latitude of a location are the contextual attributes.In time-series data,time is a contextual attribute which determines the position of an instance on the entire sequence.(2)Behavioral attributes.The behavioral attributes define the non-contextual char-acteristics of an instance.For example,in a spatial data set describing the average rainfall of the entire world,the amount of rainfall at any location is a behavioral attribute.The anomalous behavior is determined using the values for the behavioral attributes within a specific context.A data instance might be a contextual anomaly in a given context,but an identical data instance(in terms of behavioral attributes)could be considered normal in a different context.This property is key in identifying contextual and behavioral attributes for a contextual anomaly detection technique.TimeFig.3.Contextual anomaly t2in a temperature time series.Note that the temperature at time t1is same as that at time t2but occurs in a different context and hence is not considered as an anomaly.Contextual anomalies have been most commonly explored in time-series data [Weigend et al.1995;Salvador and Chan2003]and spatial data[Kou et al.2006; Shekhar et al.2001].Figure3shows one such example for a temperature time series which shows the monthly temperature of an area over last few years.A temperature of35F might be normal during the winter(at time t1)at that place,but the same value during summer(at time t2)would be an anomaly.A similar example can be found in the credit card fraud detection domain.A contextual attribute in credit card domain can be the time of purchase.Suppose an individual usually has a weekly shopping bill of$100except during the Christmas week,when it reaches$1000.A new purchase of$1000in a week in July will be considered a contextual anomaly,since it does not conform to the normal behavior of the individual in the context of time(even though the same amount spent during Christmas week will be considered normal).The choice of applying a contextual anomaly detection technique is determined by the meaningfulness of the contextual anomalies in the target application domain. To Appear in ACM Computing Surveys,092009.Anomaly Detection:A Survey·9 Another key factor is the availability of contextual attributes.In several cases defining a context is straightforward,and hence applying a contextual anomaly detection technique makes sense.In other cases,defining a context is not easy, making it difficult to apply such techniques.2.2.3Collective Anomalies.If a collection of related data instances is anomalous with respect to the entire data set,it is termed as a collective anomaly.The indi-vidual data instances in a collective anomaly may not be anomalies by themselves, but their occurrence together as a collection is anomalous.Figure4illustrates an example which shows a human electrocardiogram output[Goldberger et al.2000]. The highlighted region denotes an anomaly because the same low value exists for an abnormally long time(corresponding to an Atrial Premature Contraction).Note that that low value by itself is not an anomaly.Fig.4.Collective anomaly corresponding to an Atrial Premature Contraction in an human elec-trocardiogram output.As an another illustrative example,consider a sequence of actions occurring in a computer as shown below:...http-web,buffer-overflow,http-web,http-web,smtp-mail,ftp,http-web,ssh,smtp-mail,http-web,ssh,buffer-overflow,ftp,http-web,ftp,smtp-mail,http-web...The highlighted sequence of events(buffer-overflow,ssh,ftp)correspond to a typical web based attack by a remote machine followed by copying of data from the host computer to remote destination via ftp.It should be noted that this collection of events is an anomaly but the individual events are not anomalies when they occur in other locations in the sequence.Collective anomalies have been explored for sequence data[Forrest et al.1999; Sun et al.2006],graph data[Noble and Cook2003],and spatial data[Shekhar et al. 2001].To Appear in ACM Computing Surveys,092009.10·Chandola,Banerjee and KumarIt should be noted that while point anomalies can occur in any data set,collective anomalies can occur only in data sets in which data instances are related.In contrast,occurrence of contextual anomalies depends on the availability of context attributes in the data.A point anomaly or a collective anomaly can also be a contextual anomaly if analyzed with respect to a context.Thus a point anomaly detection problem or collective anomaly detection problem can be transformed toa contextual anomaly detection problem by incorporating the context information.2.3Data LabelsThe labels associated with a data instance denote if that instance is normal or anomalous1.It should be noted that obtaining labeled data which is accurate as well as representative of all types of behaviors,is often prohibitively expensive. Labeling is often done manually by a human expert and hence requires substantial effort to obtain the labeled training data set.Typically,getting a labeled set of anomalous data instances which cover all possible type of anomalous behavior is more difficult than getting labels for normal behavior.Moreover,the anomalous behavior is often dynamic in nature,e.g.,new types of anomalies might arise,for which there is no labeled training data.In certain cases,such as air traffic safety, anomalous instances would translate to catastrophic events,and hence will be very rare.Based on the extent to which the labels are available,anomaly detection tech-niques can operate in one of the following three modes:2.3.1Supervised anomaly detection.Techniques trained in supervised mode as-sume the availability of a training data set which has labeled instances for normal as well as anomaly class.Typical approach in such cases is to build a predictive model for normal vs.anomaly classes.Any unseen data instance is compared against the model to determine which class it belongs to.There are two major is-sues that arise in supervised anomaly detection.First,the anomalous instances are far fewer compared to the normal instances in the training data.Issues that arise due to imbalanced class distributions have been addressed in the data mining and machine learning literature[Joshi et al.2001;2002;Chawla et al.2004;Phua et al. 2004;Weiss and Hirsh1998;Vilalta and Ma2002].Second,obtaining accurate and representative labels,especially for the anomaly class is usually challenging.A number of techniques have been proposed that inject artificial anomalies in a normal data set to obtain a labeled training data set[Theiler and Cai2003;Abe et al.2006;Steinwart et al.2005].Other than these two issues,the supervised anomaly detection problem is similar to building predictive models.Hence we will not address this category of techniques in this survey.2.3.2Semi-Supervised anomaly detection.Techniques that operate in a semi-supervised mode,assume that the training data has labeled instances for only the normal class.Since they do not require labels for the anomaly class,they are more widely applicable than supervised techniques.For example,in space craft fault detection[Fujimaki et al.2005],an anomaly scenario would signify an accident, which is not easy to model.The typical approach used in such techniques is to 1Also referred to as normal and anomalous classes.To Appear in ACM Computing Surveys,092009.Anomaly Detection:A Survey·11 build a model for the class corresponding to normal behavior,and use the model to identify anomalies in the test data.A limited set of anomaly detection techniques exist that assume availability of only the anomaly instances for training[Dasgupta and Nino2000;Dasgupta and Majumdar2002;Forrest et al.1996].Such techniques are not commonly used, primarily because it is difficult to obtain a training data set which covers every possible anomalous behavior that can occur in the data.2.3.3Unsupervised anomaly detection.Techniques that operate in unsupervised mode do not require training data,and thus are most widely applicable.The techniques in this category make the implicit assumption that normal instances are far more frequent than anomalies in the test data.If this assumption is not true then such techniques suffer from high false alarm rate.Many semi-supervised techniques can be adapted to operate in an unsupervised mode by using a sample of the unlabeled data set as training data.Such adaptation assumes that the test data contains very few anomalies and the model learnt during training is robust to these few anomalies.2.4Output of Anomaly DetectionAn important aspect for any anomaly detection technique is the manner in which the anomalies are reported.Typically,the outputs produced by anomaly detection techniques are one of the following two types:2.4.1Scores.Scoring techniques assign an anomaly score to each instance in the test data depending on the degree to which that instance is considered an anomaly. Thus the output of such techniques is a ranked list of anomalies.An analyst may choose to either analyze top few anomalies or use a cut-offthreshold to select the anomalies.2.4.2Labels.Techniques in this category assign a label(normal or anomalous) to each test instance.Scoring based anomaly detection techniques allow the analyst to use a domain-specific threshold to select the most relevant anomalies.Techniques that provide binary labels to the test instances do not directly allow the analysts to make such a choice,though this can be controlled indirectly through parameter choices within each technique.3.APPLICATIONS OF ANOMALY DETECTIONIn this section we discuss several applications of anomaly detection.For each ap-plication domain we discuss the following four aspects:—The notion of anomaly.—Nature of the data.—Challenges associated with detecting anomalies.—Existing anomaly detection techniques.To Appear in ACM Computing Surveys,092009.。
An anomaly intrusion detection method by clustering normal user behavior

Sang Hyun Oh and Won Suk Lee
Department of Computer Science Yonsei University 134 Seodaemoon-gu, Shinchon-dong Seoul, 120-749, Korea e-mail:{osh,leewo}@ amadeus.yonsei.ac.kr
The methodology of intrusion detection is classified into a misuse detection model [11, 12, 13] and an anomaly detection model [1, 2, 3, 14, 15, 16, 17]. The misuse detection model utilizes the well-known weakness of a target domain. However, intrusion methods have been evolved into more sophisticated forms, and many new intrusion methods are being invented as well. As a result, handling the wellknown intrusion methods individually is not enough to preserve the security of a target domain any longer. To cope with this problem, the anomaly detection model has been studied. For anomaly detection, previous works are concentrated on statistical techniques [1, 2, 3]. To represent the characteristics of an activity in an audit data set, various features can be considered. For examples, they can be CPU usage, the frequency of a system call, the number of file accesses and so forth. Depending on the type of an activity, different features are related. The typical system of statistical analysis is NIDES [2] developed in SRI. In NIDES, a term “measure” is used to denote a feature and the abnormal rate of each measure is examined independently. NIDES models the historical behavior of a user in terms of various features and generates a long-term profile containing a statistical summary for each feature. For detecting an anomaly, the information of the on-line activities of the user is summarized into a short-term profile, and then it is compared with the long-term profile of the user. If the difference between two profiles is large enough, the on-line activities are considered as anomalous behavior. The strong point of statistical analysis is that it can generate a concise profile containing only a statistical
数据挖掘之异常检测
• Relationship among data instances
– Sequential
• Temporal – Spatial – Spatio-temporal – Graph
GGTTCCGCCTTCAGCCCCGCGCC CGCAGGGCCCGCCCCGCGCCGTC GAGAAGGGCCCGCCTGGCGGGCG GGGGGAGGCGGGGCCGCCCGAGC CCAACCGAGTCCGACCAGGTGCC CCCTCTGCTCGGCCTAGACCTGA GCTCATTAGGCGGCAGCGGACAG GCCAAGTAGAACACGCGAAGCGC TGGGCTGCCTGCTGCGACCAGGG
6 206.163.37.95 11:14:35 160.94.179.253 139 177 No
7 206.163.37.95 11:14:36 160.94.179.252 139 172 No
8 206.163.37.95 11:14:38 160.94.179.251 139 285 Yes
Y
N1
o1
O3
o2 N2
X
Contextual Anomalies
• An individual data instance is anomalous within a context • Requires a notion of context • Also referred to as conditional anomalies*
– What is the characteristic of input data
• Availability of supervision
– Number of label
halcon的dl_anomaly_detection_workflow详解
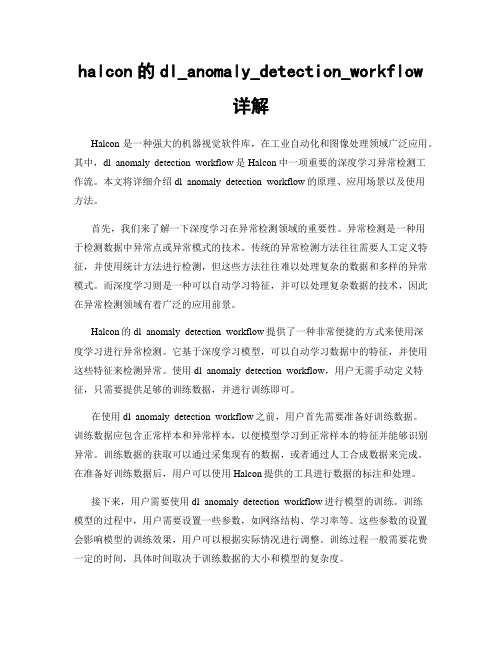
halcon的dl_anomaly_detection_workflow详解Halcon是一种强大的机器视觉软件库,在工业自动化和图像处理领域广泛应用。
其中,dl_anomaly_detection_workflow是Halcon中一项重要的深度学习异常检测工作流。
本文将详细介绍dl_anomaly_detection_workflow的原理、应用场景以及使用方法。
首先,我们来了解一下深度学习在异常检测领域的重要性。
异常检测是一种用于检测数据中异常点或异常模式的技术。
传统的异常检测方法往往需要人工定义特征,并使用统计方法进行检测,但这些方法往往难以处理复杂的数据和多样的异常模式。
而深度学习则是一种可以自动学习特征,并可以处理复杂数据的技术,因此在异常检测领域有着广泛的应用前景。
Halcon的dl_anomaly_detection_workflow提供了一种非常便捷的方式来使用深度学习进行异常检测。
它基于深度学习模型,可以自动学习数据中的特征,并使用这些特征来检测异常。
使用dl_anomaly_detection_workflow,用户无需手动定义特征,只需要提供足够的训练数据,并进行训练即可。
在使用dl_anomaly_detection_workflow之前,用户首先需要准备好训练数据。
训练数据应包含正常样本和异常样本,以便模型学习到正常样本的特征并能够识别异常。
训练数据的获取可以通过采集现有的数据,或者通过人工合成数据来完成。
在准备好训练数据后,用户可以使用Halcon提供的工具进行数据的标注和处理。
接下来,用户需要使用dl_anomaly_detection_workflow进行模型的训练。
训练模型的过程中,用户需要设置一些参数,如网络结构、学习率等。
这些参数的设置会影响模型的训练效果,用户可以根据实际情况进行调整。
训练过程一般需要花费一定的时间,具体时间取决于训练数据的大小和模型的复杂度。
数据挖掘之异常检测

• Cyber intrusions • Credit card fraud • Faults in mechanical systems
Collective Anomalies
• A collection of related data instances is anomalous • Requires a relationship among data instances
• Sequential Data • Spatial Data • Graph Data
What are Anomalies?
• Anomaly is a pattern in the data that does not conform to the expected behavior
• Anomaly is A data object that deviates significantly from the normal objects as if it were generated by a different mechanism
• Output of anomaly detection
• Score vs label
• Evaluation of anomaly detection techniques
• What kind of detection is good
Input Data
- 1、下载文档前请自行甄别文档内容的完整性,平台不提供额外的编辑、内容补充、找答案等附加服务。
- 2、"仅部分预览"的文档,不可在线预览部分如存在完整性等问题,可反馈申请退款(可完整预览的文档不适用该条件!)。
- 3、如文档侵犯您的权益,请联系客服反馈,我们会尽快为您处理(人工客服工作时间:9:00-18:30)。
O
Variants of Anomaly/Outlier Detection Problems
– Given a database D, find all the data points x ∈ D with anomaly scores greater than some threshold t – Given a database D, find all the data points x ∈ D having the topn largest anomaly scores f(x) – Given a database D, containing mostly normal (but unlabeled) data points, and a test point x, compute the anomaly score of x with respect to D
O
Applications:
– Credit card fraud detection, telecommunication fraud detection, network intrusion detection, fault detection
© Tan,Steinbach, Kumar
Introduction to Data Mining
4/18/2004
2
Importance of Anomaly Detection
Ozone Depletion History
O
In 1985 three researchers (Farman, Gardinar and Shanklin) were puzzled by data gathered by the British Antarctic Survey showing that ozone levels for Antarctica had dropped 10% below normal levels Why did the Nimbus 7 satellite, which had instruments aboard for recording ozone levels, not record similarly low ozone concentrations? The ozone concentrations recorded by the satellite were so low they were being treated as outliers by a computer program and discarded!
– Use the “normal” profile to detect anomalies
O
Types of anomaly detection schemes
– Graphical & Statistical-based – Distance-based – Model-based
© Tan,Steinbach, Kumar
4/18/2004
3
Anomaly Detection
O
Challenges
– How many outliers are there in the data? – Method is unsupervised
Validation can be quite challenging (just like for clustering)
4/18/2004
1
Anomaly/Outlier Detection
O
What are anomalies/outliers?
– The set of data points that are considerably different than the remainder of the data
– Finding needle in a haystack
O
Working assumption:
– There are considerably more “normal” observations than “abnormal” observations (outliers/anomalies) in the data
Introduction to Data Mining
4/18/2004
5
Graphical Approaches
O
Boxplot (1-D), Scatter plot (2-D), Spin plot (3-D) Limitations
– Time consuming – Subjective
Data Mining Anomaly Detection
Lecture Notes for Chapter 10 Introduction to Data Mining
by Tan, Steinbach, Kumar
© Tan,Steinbach, Kumar
Introduction to Data Mining
O
O
Sources: .au/ozone.html /ozone/science/hole/size.html
© Tan,Steinbach, Kumar
Байду номын сангаас
Introduction to Data Mining
© Tan,Steinbach, Kumar
Introduction to Data Mining
4/18/2004
4
Anomaly Detection Schemes
O
General Steps
– Build a profile of the “normal” behavior
Profile can be patterns or summary statistics for the overall population Anomalies are observations whose characteristics differ significantly from the normal profile