lab4
BOBeoLab4音响中的“高富帅”[权威资料]
![BOBeoLab4音响中的“高富帅”[权威资料]](https://img.taocdn.com/s3/m/2a09b7362e60ddccda38376baf1ffc4ffe47e23f.png)
B&O BeoLab 4音响中的“高富帅”作为一个标新立异的时尚音响品牌,BO很多时候给人的感觉就是华丽的外形和高不可攀的价格,而其华丽的造型和优质的声音也一直备受众多用户青睐。
要说到丹麦的BO,绝大部分人的第一反应就是贵。
的确,作为一个标新立异的时尚音响品牌,BO很多时候给人的感觉就是华丽的外形和高不可攀的价格,就拿今天的BeoLab 4来说,作为一款品牌中入门级的电脑音响,其价格就在万元,而且选配的支架价格都在几千元,如此高的定价也注定了这是一个小众的品牌,一个属于高富帅的品牌。
如果你是一个设计控,如果你要彰显你不凡的品味和财力,那么恭喜你,BO绝对适合你。
O的故事国际设计界BangOlufsen(简称BO)是一个非常响亮的名字,在每年的国际设计年鉴和其他设计刊物上,在世界各地的设计博物馆和设计展览中,BO公司的设计都以其新颖、独特而受到人们的关注。
在中国的设计师和音响发烧友中,BO已经有了相当的认知度。
BO是丹麦一家生产家用音像及通讯设备的公司。
多年来,该公司把设计视为生命线,一方面系统地研究新产品的技术开发,另一方面瞄准国际市场上的最高层次,并致力于使技术设施适合于家庭环境,设计出了众多质量优异、造型高雅、操作方便并富于公司一贯特色的产品,达到了世界一流的水准,享誉西方各国。
BO的设计成了丹麦设计的经典和象征。
1925午11月17日,两位年轻的丹麦工程师Peter Bang和Svend Olufsen在丹麦小镇Quistrup一间小小的阁楼里合伙创立了BangOlufsen公司,设计和生产收音机,揭开了BO公司辉煌历史的序幕。
到1927年,公司已有30余名员工,生产出了当时十分先进的七灯电子管收音机,能自然而逼真地重现电台播送的音乐和其他节目,为公司带来了良好的商誉。
1928年,公司正式启用BO商标,商标的字体设计明显受到包豪斯平面设计风格的影响,颇具现代感,被一直沿用至今。
不久,该商标就与公司的著名广告语“丹麦质量的标志”一并使用,成了丹麦最有影响、最有价值的品牌之一。
北邮电子院专业实验报告
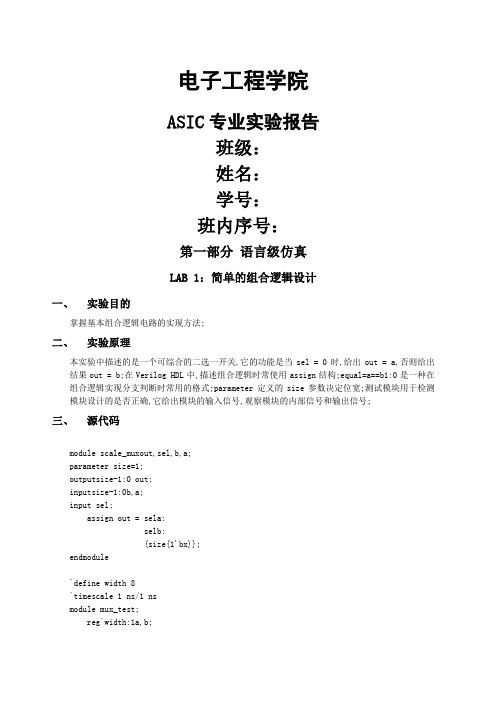
电子工程学院ASIC专业实验报告班级:姓名:学号:班内序号:第一部分语言级仿真LAB 1:简单的组合逻辑设计一、实验目的掌握基本组合逻辑电路的实现方法;二、实验原理本实验中描述的是一个可综合的二选一开关,它的功能是当sel = 0时,给出out = a,否则给出结果out = b;在Verilog HDL中,描述组合逻辑时常使用assign结构;equal=a==b1:0是一种在组合逻辑实现分支判断时常用的格式;parameter定义的size参数决定位宽;测试模块用于检测模块设计的是否正确,它给出模块的输入信号,观察模块的内部信号和输出信号;三、源代码module scale_muxout,sel,b,a;parameter size=1;outputsize-1:0 out;inputsize-1:0b,a;input sel;assign out = sela:selb:{size{1'bx}};endmodule`define width 8`timescale 1 ns/1 nsmodule mux_test;reg`width:1a,b;wire`width:1out;reg sel;scale_mux`widthm1.outout,.selsel,.bb,.aa;initialbegin$monitor$stime,,"sel=%b a=%b b=%b out=%b",sel,a,b,out;$dumpvars2,mux_test;sel=0;b={`width{1'b0}};a={`width{1'b1}};5sel=0;b={`width{1'b1}};a={`width{1'b0}};5sel=1;b={`width{1'b0}};a={`width{1'b1}};5sel=1;b={`width{1'b1}};a={`width{1'b0}};5 $finish;endendmodule四、仿真结果与波形LAB 2:简单时序逻辑电路的设计一、实验目的掌握基本时序逻辑电路的实现;二、实验原理在Verilog HDL中,相对于组合逻辑电路,时序逻辑电路也有规定的表述方式;在可综合的Verilog HDL模型中,我们常使用always块和posedge clk或negedge clk的结构来表述时序逻辑;在always块中,被赋值的信号都必须定义为reg型,这是由时序逻辑电路的特点所决定的对于reg 型数据,如果未对它进行赋值,仿真工具会认为它是不定态;为了正确地观察到仿真结果,在可综合的模块中我们通常定义一个复位信号rst-,当它为低电平时对电路中的寄存器进行复位;三、源代码`timescale 1 ns/100 psmodule countercnt,clk,data,rst_,load;output4:0cnt ;input 4:0data;input clk;input rst_;input load;reg 4:0cnt;alwaysposedge clk or negedge rst_ifrst_cnt<=0;elseifloadcnt<=3 data;elsecnt<=4 cnt + 1;endmodule`timescale 1 ns/1 nsmodule counter_test;wire4:0cnt;reg 4:0data;reg rst_;reg load;reg clk;counter c1t cnt,.clk clk,.datadata,.rst_rst_,.loadload;initial beginclk=0;forever begin10 clk=1'b1;10 clk=1'b0;endendinitialbegin$timeformat-9,1,"ns",9;$monitor"time=%t,data=%h,clk=%b,rst_=%b,load=%b,cnt=%b", $stime,data,clk,rst_,load,cnt;$dumpvars2,counter_test;endtask expect;input 4:0expects;ifcnt ==expectsbegin$display"At time %t cnt is %b and should be %b", $time,cnt,expects;$display"TEST FAILED";$finish;endendtaskinitialbeginnegedge clk{rst_,load,data}=7'b0_X_XXXXX;negedge clkexpect5'h00;{rst_,load,data}=7'b1_1_11101;negedge clkexpect5'h1D;{rst_,load,data}=7'b1_0_11101;repeat5negedge clk;expect5'h02;{rst_,load,data}=7'b1_1_11111;negedge clkexpect5'h1F;{rst_,load,data}=7'b0_X_XXXXX;negedge clkexpect5'h00;$display"TEST PASSED";$finish;endendmodule四、仿真结果与波形五、思考题该电路中,rst-是同步还是异步清零端在的always块中reset没有等时钟,而是直接清零;所以是异步清零端;LAB 3:简单时序逻辑电路的设计一、实验目的使用预定义的库元件来设计八位寄存器;二、实验原理八位寄存器中,每一位寄存器由一个二选一MUX和一个触发器dffr组成,当load=1,装载数据;当load=0,寄存器保持;对于处理重复的电路,可用数组条用的方式,使电路描述清晰、简洁; 三、源代码`timescale 1 ns /1 nsmodule clockclk;reg clk;output clk;initial beginclk=0;forever begin10 clk=1'b1;10 clk=1'b0;endendendmodulemux及dffr模块调用代码mux mux7.outn17,.selload,;dffr dffr7 .qout7, .dn17, .clkclk, .rst_rst_ ;mux mux6 .outn16, .selload, .bdata6, .aout6;dffr dffr6 .qout6, .dn16, .clkclk, .rst_rst_ ;mux mux5 .outn15, .selload, .bdata5, .aout5;dffr dffr5 .qout5, .dn15, .clkclk, .rst_rst_ ;mux mux4 .outn14, .selload, .bdata4, .aout4;dffr dffr4 .qout4, .dn14, .clkclk, .rst_rst_ ;.selload, .bdata3, .aout3;dffr dffr3 .qout3, .dn13, .clkclk, .rst_rst_ ;mux mux2 .outn12, .selload, .bdata2, .aout2;dffr dffr2 .qout2, .dn12, .clkclk, .rst_rst_ ;mux mux1 .outn11, .selload, .bdata1, .aout1;dffr dffr1 .qout1, .dn11, .clkclk, .rst_rst_ ;mux mux0 .outn10, .selload, .bdata0, .aout0;dffr dffr0 .qout0, .dn10,;例化寄存器register r1.datadata,.outout,.loadload,.clkclk,.rst_rst_;例化时钟clock c1.clkclk;添加检测信号initialbegin$timeformat-9,1,"ns",9;$monitor"time=%t,clk=%b,data=%h,load=%b,out=%h",$stime,clk,data,load,out;$dumpvars2,register_test;end四、仿真结果与波形LAB 4:用always块实现较复杂的组合逻辑电路一、实验目的掌握用always实现组合逻辑电路的方法;了解assign与always两种组合逻辑电路实现方法之间的区别;二、实验原理仅使用assign结构来实现组合逻辑电路,在设计中会发现很多地方显得冗长且效率低下;适当地使用always来设计组合逻辑,会更具实效;本实验描述的是一个简单的ALU指令译码电路的设计示例;它通过对指令的判断,对输入数据执行相应的操作,包括加、减、或和传数据,并且无论是指令作用的数据还是指令本身发生变化,结果都要做出及时的反应;示例中使用了电平敏感的always块,电平敏感的触发条件是指在后括号内电平列表的任何一个电平发生变化就能触发always块的动作,并且运用了case结构来进行分支判断;在always中适当运用default在case结构中和else子if…else结构中,通常可以综合为纯组合逻辑,尽管被赋值的变量一定要定义为reg型;如果不使用default或else对缺省项进行说明,易产生意想不到的锁存器;三、源代码电路描述alwaysopcode or data or accumbeginifaccum==8'b00000000zero=1;elsezero=0;caseopcodePASS0: out =accum;PASS1: out =accum;ADD: out = data + accum;AND: out =data&accum;XOR: out =data^accum;PASSD: out=data;PASS6: out=accum;PASS7: out=accum;default: out=8'bx;endcaseend四、仿真结果与波形LAB 5:存储器电路的设计一、实验目的设计和测试存储器电路;二、实验原理本实验中,设计一个模块名为mem的存储器仿真模型,该存储器具有双线数据总线及异步处理功能;由于数据是双向的,所以要注意,对memory的读写在时序上要错开;三、源代码自行添加的代码assign data= readmemoryaddr:8'hZ;always posedge writebeginmemoryaddr<=data7:0;end四、仿真结果与波形LAB 6:设计时序逻辑时采用阻塞赋值与非阻塞赋值的区别一、实验目的明确掌握阻塞赋值与非阻塞赋值的概念和区别;了解阻塞赋值的使用情况;二、实验原理在always块中,阻塞赋值可以理解为赋值语句是顺序执行的,而非阻塞赋值可以理解为并发执行的;实际时序逻辑设计中,一般情况下非阻塞赋值语句被更多的使用,有时为了在同一周期实现相互关联的操作,也使用阻塞赋值语句;三、源代码`timescale 1 ns/ 100 psmodule blockingclk,a,b,c;output3:0b,c;input 3:0a;input clk;reg 3:0b,c;alwaysposedge clkbeginb =a;c =b;$display"Blocking: a=%d,b=%d,c=%d.",a,b,c;endendmodule`timescale 1 ns/ 100 psmodule non_blockingclk,a,b,c;output3:0 b,c;input3:0 a;input clk;reg 3:0b,c;always posedge clkbeginb<=a;c<=b;$display"Non_blocking:a=%d,b=%d,c=%d",a,b,c;endendmodule`timescale 1 ns/ 100 psmodule compareTop;wire 3:0 b1,c1,b2,c2;reg3:0a;reg clk;initialbeginclk=0;forever 50 clk=~clk;endinitial$dumpvars 2,compareTop;initialbegina=4'h3;$display"_______________________________";100 a =4'h7;$display"_______________________________";100 a =4'hf;$display"_______________________________";100 a =4'ha;$display"_______________________________";100 a =4'h2;$display"_______________________________";100 $display"_______________________________";$finish;endnon_blocking nonblockingclk,a,b2,c2;blocking blockingclk,a,b1,c1;endmodule四、仿真结果与波形LAB 7:利用有限状态机进行复杂时序逻辑的设计一、实验目的掌握利用有限状态机FSM实现复杂时序逻辑的方法;二、实验原理控制器是CPU的控制核心,用于产生一系列的控制信号,启动或停止某些部件;CPU何时进行读指令,何时进行RAM和I/O端口的读写操作等,都由控制器来控制;三、源代码补充代码nexstate<=state+1'h01;casestate1:begin sel=1;rd=0;ld_ir=0;inc_pc=0;halt=0;ld_pc=0;data_e=0;ld_ac=0;wr=0;end2:begin sel=1;rd=1;ld_ir=0;inc_pc=0;halt=0;ld_pc=0;data_e=0;ld_ac=0;wr=0;end3:begin sel=1;rd=1;ld_ir=1;inc_pc=0;halt=0;ld_pc=0;data_e=0;ld_ac=0;wr=0;end4:begin sel=1;rd=1;ld_ir=1;inc_pc=0;halt=0;ld_pc=0;data_e=0;ld_ac=0;wr=0;end 5:begin sel=0;rd=0;ld_ir=0;inc_pc=1;ld_pc=0;data_e=0;ld_ac=0;wr=0;ifopcode==`HLThalt=1;end6:beginsel=0;rd=alu_op;ld_ir=0;inc_pc=0;halt=0;ld_pc=0;data_e=0;ld_ac=0;wr=0;end7:beginsel=0;rd=alu_op;ld_ir=0;halt=0;data_e=alu_op;ld_ac=0;wr=0;ifopcode==`SKZinc_pc<=zero;ifopcode==`JMPld_pc=1;end0:beginsel=0;rd=alu_op;ld_ir=0;halt=0;data_e=alu_op;ld_ac=alu_op;inc_pc=opcode==`SKZ&zero||opcode==`JMP;ifopcode==`JMPld_pc=1;ifopcode==`STOwr=1;endNo.00000000 No.00000000 No.00000101 No.00000001 // 1C TEMP: //1 temporary variable00000001 // 1D time: // 1 constant 144 - max value 00000110 // 1E LIMIT: // 6 constant 1一、仿真结果与波形第二部分电路综合一、实验目的掌握逻辑综合的概念和流程,熟悉采用Design Compiler进行逻辑综合的基本方法;二、实验内容采用SYNOPSYS公司的综合工具Design Compiler对实验7的做综合;三、源代码与实验指导书中相同;四、门级电路仿真结果与波形五、思考题1.文件是verilog语言及的描述还是结构化的描述是结构化的描述;2.文件中,对触发器的延迟包括哪些信息包括对逻辑单元和管脚的上升/下降时延的最大值、最小值和典型值;第三部分版图设计一、实验目的掌握版图设计的基本概念和流程,熟悉采用Sysnopsys ICC工具进行版图设计的方法;二、实验内容对电路综合输出的门级网表进行布局布线;三、源代码与实验指导书中相同;四、仿真结果与波形布局规划后结果未产生core ring和mesh前产生core ring和mesh后电源线和电影PAD连接后filler PAD填充后布局后结果时钟树综合后结果布线后结果寄生参数的导出和后仿五、思考题1.简述ICC在design setup阶段的主要工作;创建设计库,读取网表文件并创建设计单元,提供并检查时间约束,检查时钟;在对之前的数据与信息进行读取与检查后保存设计单元;2.为什么要填充filler padfiller pad把分散的pad单元连接起来,把pad I/O区域供电连成一个整体;使它们得到持续供电并提高ESD保护能力;3.derive_pg_connection的作用是什么描述有关电源连接的信息;4.简述floorplan的主要任务;对芯片大小、输入输出单元、宏模块进行规划,对电源网络进行设计;5.简述place阶段的主要任务;对电路中的延时进行估计与分析,模拟时钟树的影响,按照时序要求,对标准化单元进行布局;6.简述CTS的主要步骤;设置时钟树公共选项;综合时钟树;重新连接扫描链;使能传播时钟;Post-CTS布局优化;优化时钟偏移;优化时序;实验总结经过数周的ASIC专业实验,我对芯片设计流程、Verilog HDL语言、Linux基本指令和Vi文本编辑器有了基本的了解;虽然之前对芯片设计、VHDL一无所知,但通过实验初步熟悉了ASIC的体系结构和VHDL的基本语法,对电路中时钟、寄生参数、元件布局带来的影响也有了了解;我在实验中也遇到了许多问题,但我在老师、助教、同学的帮助下解决了这些问题,也有了更多收获;通过这次ASIC专业实验,我加深了对本专业的认识;我会继续努力成为合格的电子人;。
网络安全lab4-
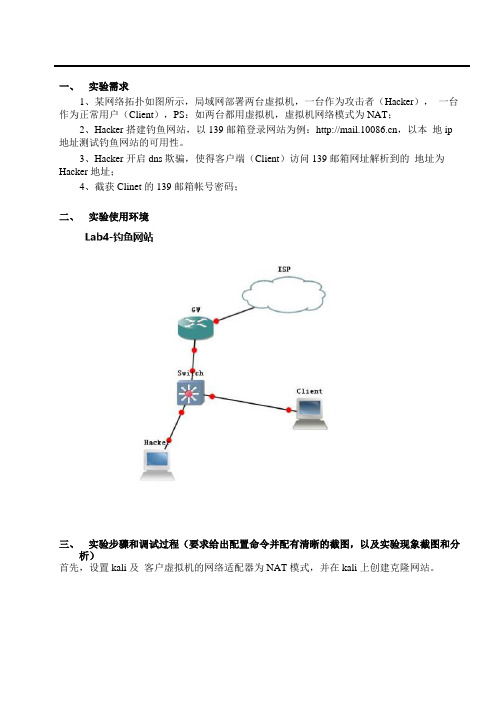
一、实验需求1、某网络拓扑如图所示,局域网部署两台虚拟机,一台作为攻击者(Hacker),一台作为正常用户(Client),PS:如两台都用虚拟机,虚拟机网络模式为NAT;2、Hacker搭建钓鱼网站,以139邮箱登录网站为例:,以本地ip 地址测试钓鱼网站的可用性。
3、Hacker开启dns欺骗,使得客户端(Client)访问139邮箱网址解析到的地址为Hacker地址;4、截获Clinet的139邮箱帐号密码;二、实验使用环境三、实验步骤和调试过程(要求给出配置命令并配有清晰的截图,以及实验现象截图和分析)首先,设置kali及客户虚拟机的网络适配器为NAT模式,并在kali上创建克隆网站。
创建克隆网站1,setoolkit 回车,如有以下提示选择Y。
2,选择1,社会工程学3,选择2,web攻击4,选择3,凭证信息收集5,选择2,网站克隆6,输入网站克隆存放的主机的IP地址,kali eth0的IP 地址7,输入要克隆的网站的链接, 验证克隆网站是否成功,kali浏览器输入127.0.0.1 或者正常用户访问kali的ip地址。
验证克隆网站是否成功,kali浏览器输入127.0.0.1 ,成功运行克隆网站,即表示克隆成功。
正常用户可访问kali的ip地址。
然后,DNS欺骗。
ettercap的使用,修改ettercap.dns中的A记录。
vi /etc/ettercap/etter.dnsettercap工具的使用1,ettercap –G打开工具。
2,选择嗅探接口eth03,先选择主机列表,再选择扫描主机。
4,添加攻击目标1,再添加攻击目标2,一个网关,一个用户。
5,选择中间人攻击,arp欺骗,嗅探远程主机。
6,选择工具,管理工具,双击点击dns_spoof,前面会出现带星号。
7,开始攻击最后,开始测试,xp客户端ping 回复的地址为kali地址。
证明欺骗成功。
xp用户通过浏览器正常访问,并用自己的学号和名字登陆验证。
饥荒海滩物品代码
birdtrap(鸟陷阱)
amulet(红色护身符)
blueamulet(蓝色护身符)
purpleamulet(紫色护身符)
yellowamulet(黄色护身符)
orangeamulet(橙色护身符)
greenamulet(绿色护身符)
pickaxe(镐)
goldenpickaxe(黄金镐)
purplegem(紫宝石)
greengem(绿宝石)
orangegem(橙宝石)
yellowgem(黄宝石)
houndstooth(犬牙)
pigskin(猪皮)
log(木头)
livinglog(活木头)
twigs(树枝)
cutgrass(草)
petals(花瓣)
seaweed 海藻
seaweed_dried 海带
limpets 帽贝
mussel 青口贝
fish_raw_small 爽口鱼
tropical_fish 热带鱼
shark_fin 鱼翅
sweet_potato 红薯
coral_brain 智慧果
clothsail 布帆
snakeskinsail 蛇鳞帆
feathersail 羽毛轻帆
boat_torch 航海火炬
boat_lantern 航海提灯
boatcannon 航海加农炮
seatrap 海洋陷阱
trawlnet 拖网
telescope 望远镜
swordfish 剑鱼
sharx 鲨鱼
stungray 浮游
whale_blue 蓝鲸
Lab4 介绍

3. 使用PDX(VPT)在页目录在查找,得到一个特殊的页
表(SPT)——页目录本身 (自映射的作用)
4. 使用PDX(addr)在SPT(也就是页目录)里找到一个特 殊的页(SPage)——实际上是页表
5. 使用PTX(addr)|00得到页表项
fork() vs dumb_fork()
dumb_fork
dumbfork
一个古老的fork,采用复制地址空间的内容的方法 创建子进程
user/dumbfork.c
fork
实现了copy‐on‐write的fork函数 lib/fork.c
dumbfork流程
1. sys_exofork
env_alloc eax (0) Status (ENV_NOT_RUNNABLE)
关键点
curenv全局变量
在运行第一个用户进程之前,curenv的值为NULL
调度过程
调度过程
envs[1]、envs[2]… envs[NENV‐1]形成一个逻辑 上的环状结构
如果curenv==NULL,就从envs[1]开始检查;否 则就从curenv指向的Env结构的下一个envs数 组元素开始检查。从环上寻找第一个状态为 ENV_RUNNABLE的进程
利用一些系统调用来实现一个用户空间的、写 时复制的库函数fork
用户创建进程相关的系统调用:
sys_exofork sys_env_set_status sys_page_alloc sys_page_map sys_page_unmap
fork()的流程
1. set_pgfault_handler 2. sys_exofork
LAB4-PF-029非配套检测系统的性能验证程序
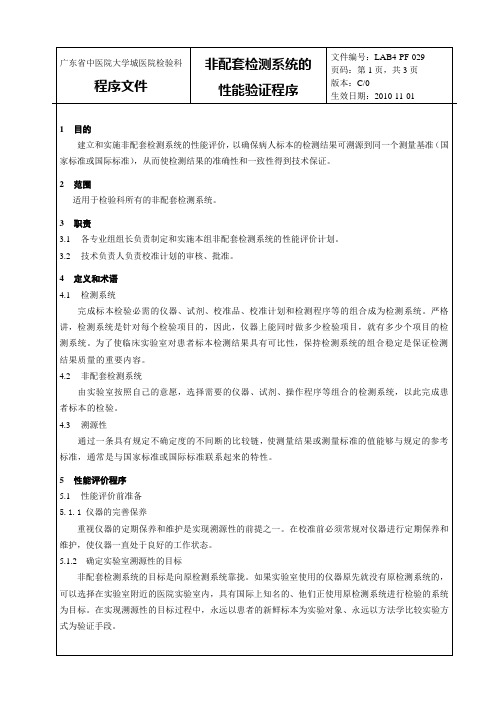
5.2
由实验室按照自己的意愿,选择需要的仪器、试剂、操作程序等组合的检测系统,以此完成患者标本的检验。
溯源性
5.3
通过一条具有规定不确定度的不间断的比较链,使测量结果或测量标准的值能够与规定的参考标准,通常是与国家标准或国际标准联系起来的特性。
性能评价
6
性能评价
6.1
5.1.1
重视仪器的定期保养和维护是实现溯源性的前提之一。在校准前必须常规对仪器进行定期保养和维护,使仪器一直处于良好的工作状态。
广东省中医院检测系统的
性能验证程序
文件编号:LAB4-PF-029
页码:第1页,共3页
版本:C/0
生效日期:2010-11-01
1
2
建立和实施非配套检测系统的性能评价,以确保病人标本的检测结果可溯源到同一个测量基准(国家标准或国际标准),从而使检测结果的准确性和一致性得到技术保证。
5.2.8非配套检测系统分析灵敏度的评估
参照美国国家临床实验室标准化委员会(NCCLS) EP17-A文件要求,对非配套检测系统项目的检测低限、功能灵敏度进行评价。检测低限:测定空白样本20天,计算其均值及标准差。按99.7%可能性定
广东省中医院大学城医院检验科
程序文件
非配套检测系统的
性能验证程序
文件编号:LAB4-PF-029
LAB4-PF-021《检验方法选择和评审程序》
LAB4-PF-023《生物参考区间评审程序》
LAB4-PF-025《检验结果量值溯源管理程序》
LAB4-PF-028《不同检测系统间的比对程序》
页码:第3页,共3页
版本:C/0
生效日期:2010-11-01
义检测低限LLD=X空白+3s空白。功能灵敏度:测定系列低浓度检测限样品20天,计算各浓度的变异系数,绘制浓度与CV的关系曲线图,以理论浓度为X轴,各浓度的变异系数为Y轴,从曲线上查阅CV为20%所对应的浓度,即为功能灵敏度。
Lab4

6 FileI/O
Opening and closing data files. Reading data from and writing data to files. Reading from and writing to spreadsheet-formatted files. Moving and renaming files and directories. Changing file characteristics. Creating, modifying, and reading a configuration file.
1D Array
Waveform graph terminal (1D array)
1D Array
Waveform graph terminal (cluster)
2. Multiple-Plot Waveform Graphs
Build Array function (Array subpalette)
Build Array
1D Arrays
2D array
Waveform graph terminal (2D array)
clusters
cluster array
Waveform graph terminal (cluster array)
5.2 Charts
1. Chart Update Modes
6.2.3 More Writing and Reading of Files
1.Writing and Reading Text Files 可以进行纯文本的读写 Write To Text File Read From Text File 2. Writing and Reading Binary Files
EEE 333 lab4

Explanation: This part is controlling code to realize the adder count up/down, reset, and pause functions.
Pins Assignments for Design
ห้องสมุดไป่ตู้
Time Diagram for Counter Test Bench
Time Diagram for Display Controller Test Bench
Conclusions: In this lab, there are two main issues need to be highly concerned. The first thing to use the frequency divider to make the anode selection and number displaying speed slow enough to been seen. The second thing is to control the display speed and number displaying speed so that we can the four digits illuminate at the same time, and number is always change correctly. At the same time we sent the fastest four digits to the LEDs to let them show the adding movement in binary, and send the slowest frequency signal to the flash signal. The controller part is pretty straightforward.
Lab4RingOscillator实验4的环形振荡器
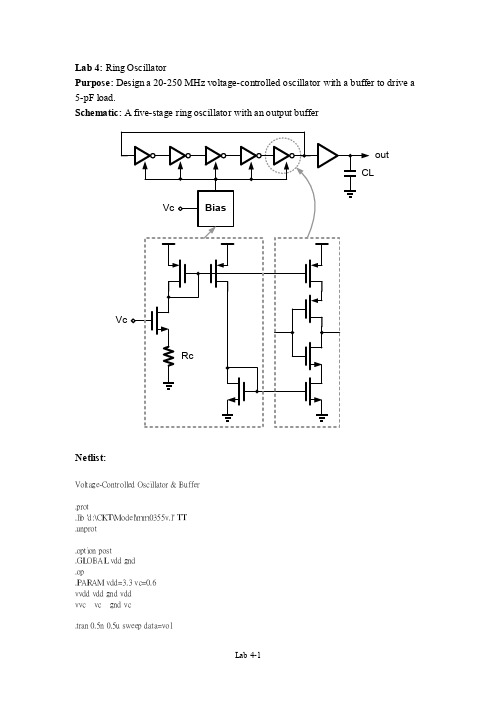
Lab 4: Ring OscillatorPurpose: Design a 20-250 MHz voltage-controlled oscillator with a buffer to drive a 5-pF load.Schematic: A five-stage ring oscillator with an output bufferoutNetlist:Voltage-Controlled Oscillator & Buffer.prot.lib 'd:\CKT\Model\mm0355v.l' TT.unprot.option post.GLOBAL vdd gnd.op.PARAM vdd=3.3 vc=0.6vvdd vdd gnd vddvvc vc gnd vc.tran 0.5n 0.5u sweep data=vol.data vol vc0.6 0.7 0.8 0.9 1.0 1.1 1.2 1.4 1.6 1.8 2.0 2.2 2.4 2.6 2.8 3.0 3.2 .enddata.meas tran Tdelay trig v(in0) val=1.65 rise=3+ targ v(in0) val=1.65 rise=4.meas tran Fosc param='1/Tdelay'.meas tran AVG_power avg power*****VCO*****.ic v(in0) = 0x1 vc vcp vcn bias_vcox2 vcp vcn in0 in1 delaycell_vcox3 vcp vcn in1 in2 delaycell_vcox4 vcp vcn in2 in3 delaycell_vcox5 vcp vcn in3 in4 delaycell_vcox6 vcp vcn in4 in0 delaycell_vcox7 in0 out buffercl out gnd 5p.subckt bias_vco vc vcp vcnmp1 vcp vcp vdd vdd pch l=0.50u w=12u m=1mp2 vcn vcp vdd vdd pch l=0.50u w=12u m=1mn1 vcp vc 1 gnd nch l=0.35u w=4u m=8mn2 vcn vcn gnd gnd nch l=0.50u w=4u m=1rc 1 gnd 16000.ends.subckt delaycell_vco vcp vcn in outmp1 1 vcp vdd vdd pch l=0.50u w=12u m=1mp2 out in 1 vdd pch l=0.35u w=12u m=1mn1 out in 3 gnd nch l=0.35u w=4u m=1mn2 3 vcn gnd gnd nch l=0.50u w=4u m=1.ends.subckt buffer in outmp1 in1 in vdd vdd pch l=0.35u w=12u m=2mn1 in1 in gnd gnd nch l=0.35u w=4u m=2mp2 in2 in1 vdd vdd pch l=0.35u w=12u m=4mn2 in2 in1 gnd gnd nch l=0.35u w=4u m=4mp3 in3 in2 vdd vdd pch l=0.35u w=12u m=8mn3 in3 in2 gnd gnd nch l=0.35u w=4u m=8mp4 out in3 vdd vdd pch l=0.35u w=12u m=8mn4 out in3 gnd gnd nch l=0.35u w=4u m=8.ends.endSimulation:1.Oscillation frequency v.s. VcRc = 1 KRc = 4 KRc = 8 KRc = 16 KVc (Volt)f o s c (H z )2. Power dissipation v .s. VcVc (Volt)P o w e r (W )Rc = 1 KRc = 4 KRc = 8 KRc = 16 KHomework:1. Read the files of .lst and .mt0.2. Discuss the gain Kvco in this work.3. What is the limitation of the ring oscillator?4. How about duty cycle and swing in the VCO?5. How to eliminate the supply noise effect in the VCO?。
JOS实验第6章讲义

第六章. 系统调度,IPC和页面失效控制(lab4)(v0.1)6.1. 实验目标MIT这次实验是在Lab3进程和中断管理的基础上实现,目标是在他们的JOS操作系统中实现多进程管理和进程间消息通信的功能。
在实验三中,我们知道进程是一个执行中的程序实例。
利用分时技术,操作系统上同时可以运行多个进程。
分时技术的基本原理是把CPU的运行时间划分成一个个规定长度的时间片(实验中一个时间片为100ms),让每个进程在一个时间片内运行。
当进程的时间片用完时系统舅利用调度程序切换到另一个进程去运行。
当一个进程在执行时,CPU的所有寄存器中的值、进程的状态以及堆栈中的内容被称为该进程的上下文。
当内核需要切换至另一个进程时,它需要保存当前进程的所有状态,即保存当前进程的上下文,以便在再次执行该进程时,能够恢复到切换时的状态执行下去。
在操作系统的进程调度方式中有抢占式和非抢占式,本实验中采用抢占式进程调度,即现行进程在运行过程中,如果有重要或紧迫的进程到达(其状态必须为就绪),则现运行进程将被迫放弃处理机,系统较处理机立刻分配给新到达的进程,其需要时钟中断处理程序实现。
其中如何产生多个进程以及如何进行进程切换是本实验的目标。
程序的代码比较零散,主要集中在kern和lib目录下。
该实验可以分为3部分:实现调度算法、创建新的进程环境和进程间通信。
第一部分通过循环轮转(Round-Robin)调度算法实现多用户进程;第二部分通过实现类似于Unix进程创建的fork()函数创建新的进程以及实现用户态下的缺页错误处理函数;最后通过时钟中断实现用户进程间的消息通信等。
本实验中的函数在kern下主要是完成以下文件:kern/sched.ckern/syscall.ckern/trapentry.Skern/trap.ckern/env.c在lib目录下需要完成的文件包括:lib/pfentry.Slib/pgfault.clib/fork.clib/ipc.c在本次实验过程中没有检查函数,不过JOS给出了一些用户进程,在实验中运行这些进程和文档说明中的结果对照,如果出现问题可以利用bochs设置断点查看相关的错误,也可以用cprintf打印相关信息,来查看是否运行正确。
EE133-Lab4FMDemo...
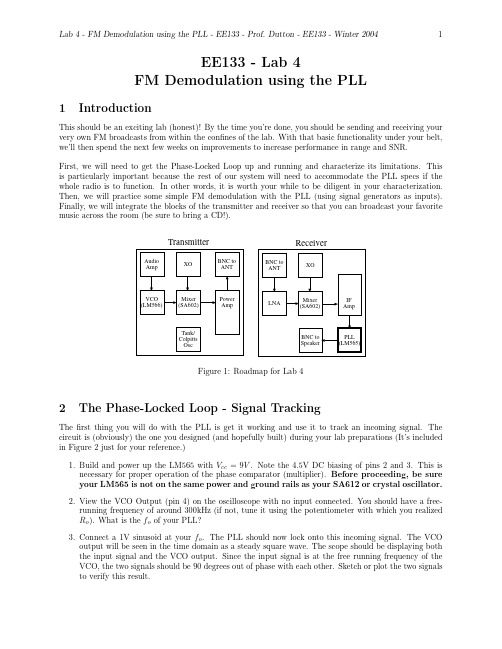
EE133-Lab4FM Demodulation using the PLL1IntroductionThis should be an exciting lab(honest)!By the time you’re done,you should be sending and receiving your very own FM broadcasts from within the confines of the lab.With that basic functionality under your belt, we’ll then spend the next few weeks on improvements to increase performance in range and SNR.First,we will need to get the Phase-Locked Loop up and running and characterize its limitations.This is particularly important because the rest of our system will need to accommodate the PLL specs if the whole radio is to function.In other words,it is worth your while to be diligent in your characterization. Then,we will practice some simple FM demodulation with the PLL(using signal generators as inputs). Finally,we will integrate the blocks of the transmitter and receiver so that you can broadcast your favorite music across the room(be sure to bring a CD!).Figure1:Roadmap for Lab42The Phase-Locked Loop-Signal TrackingThefirst thing you will do with the PLL is get it working and use it to track an incoming signal.The circuit is(obviously)the one you designed(and hopefully built)during your lab preparations(It’s included in Figure2just for your reference.)1.Build and power up the LM565with V cc=9V.Note the4.5V DC biasing of pins2and3.This isnecessary for proper operation of the phase comparator(multiplier).Before proceeding,be sure your LM565is not on the same power and ground rails as your SA612or crystal oscillator.2.View the VCO Output(pin4)on the oscilloscope with no input connected.You should have a free-running frequency of around300kHz(if not,tune it using the potentiometer with which you realized R o).What is the f o of your PLL?3.Connect a1V sinusoid at your f o.The PLL should now lock onto this incoming signal.The VCOoutput will be seen in the time domain as a steady square wave.The scope should be displaying both the input signal and the VCO output.Since the input signal is at the free running frequency of the VCO,the two signals should be90degrees out of phase with each other.Sketch or plot the two signals to verify this result.VinVoutRFigure2:LM565PLL4.Measure the DC voltage on the output of the PLL.(If you have a DC blocking capacitor at the output,you should look at the inside of that cap,or directly at pin7.)Does this agree with your prelab results for the free running frequency voltage?5.Now,change the frequency of the input waveform to350kHz.Be sure the PLL is still locked at thisfrequency by examining the VCO output.Then,lower the input voltage until the PLL loses lock.What is the minimum detectable input signal of your PLL?Note:You can tell that lock has been lost when a large number of different signals suddenly appear in the frequency spectrum,and when the time domain trace is no longer clean and steady.This represents the fact that the PLL is now“searching”for an input signal it can lock to.6.Please reset your signal generator to1V at f o.Then,vary the input signal frequency until the PLLloses lock.Plot or sketch the time domain signal just before it loses lock on either side.7.Record the maximum and minimum”lockable”frequency and the respective phase differences observed.What is your lock range?Also,record the DC value of the output at the highest and lowest frequencies that lock.Do the lock range and observed phase differences agree with theory?Given your actual hold range,what equation for f H wouldfit your data?(Hint:it’s probably not the equation in the data sheet,though it should depend on V c and f o.)?8.Record a few more corresponding pairs of input frequencies and DC output voltages within the lockrange.Roughly sketch the graph of VCO frequency versus output DC voltage.Give an approximate value forκ(mV/kHz)-the’constant’that relates a change in input frequency to a change in DC output voltage.Isκconstant across frequency?Why,or why not?9.According to theory,why is there a difference between the output voltage when you apply a single-frequency signal and the output voltage in the free-running case?Is this consistent with your plot?10.Reduce the power supply from9V to7.5V.What do you observe?What do you observe if you reducethe power supply to6V?11.Set the power supplies to16V.(Be sure that doing this will not damage other chips connected to thepower supply or the4.5V reference-if it will,disconnect the power to those chips).Now re-check the lock range.Does it agree with theory?12.Reset the power supplies to9V.3FM Demodulation using the PLLNow that you’ve seen how the PLL tracks a signal,we will explore one of its applications,FM demodulation. If we recall the original definition of FM,it is a signal whose frequency is proportional to a modulating voltage.We have just seen that a PLL produces an error voltage that is proportional to the frequency of the incoming signal.That’s exactly what we need to demodulate an FM signal.In fact,it’s as simple as setting the center frequency of the VCO in the PLL to the center frequency of the FM signal,and then taking the error voltage as the output.The only restriction is that the frequency deviation of the FM signal must be less than the hold range of the PLL,and that the frequency of the modulating signal be significantly less than the frequency of the carrier.1.Set the input to the PLL to be a1V,FM signal from the signal generator,with a center frequencyequal to your f o(hopefully,around300kHz)and a1kHz modulating signal with∆f=50kHz.2.Connect the scope and signal analyzer to the output(pin7)of the PLL through the coupling capacitor.3.At this point,the output should be a demodulated signal,at1kHz,with a signal to noise ratio of atleast40dB.If the low frequencies seem to be overpowered by feedthrough of the higher frequencies(i.e.if your output seems to be at f o rather than at1kHz),build a low-passfilter and add it to theoutput(Be sure to add the LPF after the coupling capacitor at Pin7).Don’t spend too much time, we’ll put in a more effectivefilter next week.4.Plot or sketch this signal in the frequency and time domain.(Don’t worry about how messy it mightlook in the time domain.)5.Record the S/N Ratio.At this point,you should have a signal with a good S/N ratio and THD(i.e.SNR near40dB and THD from1%-5%).6.Attach the output of the PLL into a speaker and comment on the quality of the1kHz tone.4Transmitting and ReceivingWe are now going to hook up everything you’ve built up to this point,and get yourfirst transmitter with super-heterodyned receiver system running.You have the option of proceeding through these steps with one of two differentflavors of transmitter.Thefirst is simply the Colpitts VCO.The second uses the SA612 (a.k.a.SA602,SA612,NE612-they’re equivalent),the fundamental-mode crystal oscillator,and the LM566. You are welcome to employ either one(or both)of these options-just follow the corresponding directions (denoted by Colpitts VCO/LM566).1.Power up your transmitter from Lab2and view the24.3MHz output signal on the sprectrum analyzer.If you haven’t built your audio amp yet,this is the time to do it.2.For convenience,we will use music from the computer as the signal we are interested in transmitting.So,pop in your favorite CD or MP3and hook up the audio output of the computer to the input of your audio amp(disconnect the microphone and use a big¿22uF coupling cap-if you’d prefer,you can just test with your voice)using a special BNC to stereo cable that will be provided by the TA’s.Connect the output of the audio amp to the base of the varactor/the RF port.Turn up the volume until you get a∆f=50kHz(but,turn down the computer speakers so that you do not damage them with the high volume).3.LM566only:Check that your SA612transmit multiplier from Lab2is still operational.With thefundamental-mode crystal oscillator feeding the LO port at24MHz,connect the output of the LM566 VCO to the RF port.Depending on the size of your LM566output and the maximum allowable input signal for the SA612,you may need to attentuate the signal coming from the VCO.4.Then,connect the node between the tapped inductors where the spectrum analyzer would otherwise beplaced/the output of the SA612on the transmitter to the RF input of the SA612on the receiver(the LO port of the receive SA612should still be fed with the crystal oscillator).You might need to move some BNC’s around to do this.If you have more than2BNC’s left on your board,we highly recommend removing them and giving them back to the TA for reuse.View the output on the spectrum analyzer and make sure that you get a signal at300kHz.What is the approximate signal power at300kHz?5.Now hook up the output of the receive multiplier into the PLL and hook the output of the PLL intoa ment on the relative quality of the music compared to what you got with the AMsynchronous detector.6.Disconnect the transmitter from the receive SA612and now use2antennas to transmit and receive;one offthe tapped inductor/output of SA612on the transmit board and one into the SA612on the receive board(When you get to this step,be sure to let others in the lab know you are transmitting so that they are not surprised when their signals are jammed.Be sure to turn your circuit offwhen you are done!).Turn on the receiver and(hopefully)listen to the ment on the sound quality now.If it doesn’t work,look at the output power of the multiplier.Is this signal large enough for the PLL to lock onto?7.Move your circuits further apart until the receiver stops operating and record this approximate distance.8.For completeness,use a1kHz modulating input into the base of the varactor/VCO input with theamplitude from Lab2needed to get a50kHz deviation.Record the signal to noise ratio of the1kHz output(from the PLL)first with antennas then with the transmitter and receiver directly connected.9.Now that you’ve modulated a signal and demodulated again,try increasing the range by hookingup your LNA into the sequence.Find the minimum detectable signal via antenna then via direct connection.What effect does the LNA have?Congratulations on getting the whole system working!The rest of the quarter should be easier,as you are now an expert RF engineer.From this point on,we will concentrate on the fun stuff:making the system work farther,be portable,and look pretty.Looking ahead we’ll be working on the Intermediate Frequency(IF) Amplifier next week which will boost the distance at which your receiver can demodulate signals,and then we’ll work on a power amplifier for your transmitter,so that you’ll be able to transmit across campus.。
软件测试lab4--使用mujava进行变异测试

软件测试lab4--使⽤mujava进⾏变异测试软件测试技术第四次实验报告⼀、需求分析(描述具体需求)1. 安装MuJava。
2. 根据给定的两个⼩程序使⽤MuJava⽣成对应的变异体。
3. 使⽤Junit给两个程序编写测试集。
4. 使⽤MuJava和测试集测试这些变异体。
⼆、概要设计(简单描述设计思路,配合UML图)1. 设计思路⾸先安装mujava.jar,openjava.jar和junit.jar等需要⽤到的包,在进⾏环境变量的配置,⽣成需要的变异体。
接着编写对应的测试集,再对这些变异体进⾏测试。
三、详细设计(详细描述具体如何实现,附代码及说明)1. 安装MuJava。
将下载好的jar包添加到环境变量中,在CLASSPATH中添加这些jar包的路径,结果如下图所⽰:新建⼀个mujava.config⽂件,并在其中写⼊MuJava_HOME的地址,该地址为新建的MujavaHome的地址。
再新建两个命令脚本⽂件,GenMutants.cmd和RunTest.cmd,在其中分别写⼊如下图所⽰的内容。
2. ⽣成变异体。
先在MujavaHome⽂件夹中新建四个⽂件夹,分别是src,classes,result,testset。
在src⽂件夹中放⼊两个给定的源程序,在classes⽂件夹中放⼊两个源程序在eclipse中编译⽣成的class⽂件。
点击运⾏GenMutants.cmd⽂件,弹出如下图形界⾯,并勾选上所有的变异算⼦。
点击‘Generate’按钮,⽣成变异体,下图分别是BackPack和BubbleSort的变异体:其中,只⽣成了method级别的变异体,没有class级别的变异体。
⽣成变异体后,可以在result⽂件夹内找到⽣成的变异体⽂件。
3. 编写测试⽤例。
(1) backpack的测试⽤例:import org.junit.Assert;import org.junit.After;import org.junit.Before;import org.junit.Test;public class testBackPack {private BackPack c;@Beforepublic void setUp() throws Exception {// setUp()⽤于测试前的初始化c = new BackPack();}@Testpublic void test2() {int m = 10;int n = 3;int w[] = {3, 4, 5};int p[] = {4, 5, 6};int a[][] = {{0, 0, 0, 0, 0, 0, 0, 0, 0, 0, 0},{0, 0, 0, 4, 4, 4, 4, 4, 4, 4, 4},{0, 0, 0, 4, 5, 5, 5, 9, 9, 9, 9},{0, 0, 0, 4, 5, 6, 6, 9, 10, 11, 11}};Assert.assertArrayEquals(a,c.BackPack_Solution(m, n, w, p)); }@Afterpublic void tearDown() throws Exception {// tearDown()⽤于测试后的善后c = null;}}(2) bubblesort的测试⽤例:import static org.junit.Assert.*;import java.util.Arrays;import org.junit.After;import org.junit.Before;import org.junit.Test;public class testBubbleSort {private BubbleSort c;@Beforepublic void setUp() throws Exception {// setUp()⽤于测试前的初始化c = new BubbleSort();}@Testpublic void test1() {int a[] = new int[]{1,6,2,2,5};int b[]=new int[]{2,2,2,1,2,13};int a1[] = new int[]{1,2,2,5,6};int b1[]=new int[]{1,2,2,2,2,13};assertEquals(Arrays.toString(a1), Arrays.toString(c.BubbleSort(a)));assertEquals(Arrays.toString(b1), Arrays.toString(c.BubbleSort(b)));}@Afterpublic void tearDown() throws Exception {// tearDown()⽤于测试后的善后c = null;}}4. 对变异体进⾏测试。
耶格肺功能仪使用说明

MasterScreen 中文手册.doc
8
更换测试气体
为大气瓶和小气瓶配气价格是一样的。
每更换一次测试气体后,一定要将新的气体分成输入计算机,具 体方法如下:
在菜单中点击"Entry of calibration gas concentration",就弹出下 面的对话框:
然后依次输入新的气体成分。
气体与标称值相差很大,所以在换气之前最好用笔记下原有的气体定标 系数,换气后立刻作一次气体定标,记下新的定标系数。如果气体准确, 定标系数应该不会改变太多,如果不准确,会改变很多(因为气体分析 器不会在换气前后发生大改变!)
如果长时间不使用测试气体,一定要关闭气瓶总阀!
MasterScreen 中文手册.doc
MasterScreen 中文手册.doc
7
定标系数有:
Helium C 氦分析器的增益系数,
CO C
一氧化碳分析器的增益系数,
O2 C
氧分析器的增益系数,
重 要 的 要 看 这 些 系 数 的 新 旧 对 比 的 偏 差 系 数 %Diff, 偏 差 系
数%Diff 越接近 0%越好,表示分析器没有变化。
原理: 用干燥的空气校正一氧化碳和氦传感器的零点,用已知气体成分 的标准气来校正气体分析传感器的增益,零点和增益是由计算机控制的 放大器和软件部分来共同调整的。一切全自动完成,免去了手动调正的 随意性和误差。 MasterScreen PFT 的氧分析器也是同样方法自动给空气和 100%纯 氧,用两点法进行校正。
2
流速传感器的定标:容积校正
概述 该程序是对流速传感器进行质量控制,从而保证流速和容量测试 的精确性。所以应该每天测试病人前都要进行一次,或者更换流速传感 器后就应该进行一次。只有激发试验 APS 例外,因为激发试验流速传感 器不是精确的流速检查,而仅仅是流速控制,所以只有每更换一个过滤 网才进行一次。 仪器正常时每次定标结果一般都相差不大,不定标也可以直接进 行测试,但是如果测试前不进行定标,本公司不对测试的精确性负责。
Lab4_1使用自签证书配置SSL
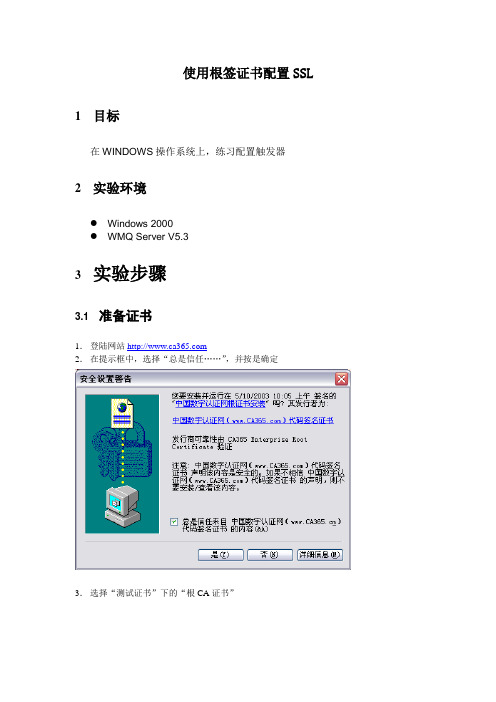
使用根签证书配置SSL 1目标在WINDOWS操作系统上,练习配置触发器2实验环境●Windows 2000●WMQ Server V5.33实验步骤3.1 准备证书1.登陆网站2.在提示框中,选择“总是信任……”,并按是确定3.选择“测试证书”下的“根CA证书”4.在弹出的保存提示窗口,选择“保存”,保存rootTest.cer到本地目录下至安装成功6.点击“测试证书”下的“用表格申请证书”7.在申请表格中,输入如下信息名称:JADY公司:SUYUAN部门:IT城市:NANJING省:JIANGSU国家:CN电子邮件:<YOUREMAILADDRESS> 证书期限:30天证书用途:通用证书8.点击“提交”,在提示窗口选择“是”10.选择“下载并安装证书”根证书相同12.用同样的方法申请并下载、安装JADY2.DER证书13.在IE浏览器菜单中,选择“工具 INTERNET选项”,选择选项卡“内容”,点击“证书”14.在证书窗口,选择“个人”选项卡,选中“JADY”,单击“导出”15.选择“是,导出私钥”16.选择“启用加强保护”17.输入密码18.输入导出文件名称为JADY19.“完成”20.用同样的方式导出证书JADY23.2 创建两个队列管理器并启动1.在CMD命令窗口的命令提示符下,创建并启动队列管理器JADY, JADY2a)CRTMQM JADYb)STRMQM JADYc)CRTMQM JADY2d)STRMQM JADY22.在命令提示符下,输入RUNMQSC JADYa)DEFINE CHANNEL(TO.JADY2) CHLTYPE(SDR) CONNAME(…. 127.0.0.1(1415)')XMITQ(XQ)b)DEFINE QLOCAL(XQ) USAGE(XMITQ)c)END3.在命令提示符下,输入RUNMQSC JADY2a)DEFINE CHANNEL(TO.JADY2) CHLTYPE(RCVR)b)END3.3 为两个队列管理器配置SSL1.在WebSphere MQ资源管理器中,选择QMSSL 1,右键选择“属性”,在属性窗口,选择“SSL”标签页,点击“管理SSL证书”2.选择其中所有证书,按“去除”,删除3.选择“添加”,在添加证书窗口,选择“从文件导入”4.选择QMSSLQ.PXF文件,输入密码,选择“添加”5.完成后,仓库中可以看到新导入的证书6.以同样的方式导入根证书7.选中“QMSSL”,选择右上方的“指定”按钮8.在弹出的窗口,选中“QMSSL”,选择“指定”按钮9.完成后可以看到JADY前的图表由一个勾10.选择“确定”,退出属性窗口11.在JADY2上,以同样的方法导入JADY2.PXF和根证书,并指定JADY212.在MQ资源管理上,选中JADY的发送通道TO.JADY2,右键“属性”,选择“SSL”选项卡,在标准设置中,选择“TRIPLE_DES_SHA_US”,按“确定”完成13.同样的,在MQ资源管理上,选中JADY2的接受方通道TO.JADY2,右键“属性”,选择“SSL”选项卡,在标准设置中,选择“TRIPLE_DES_SHA_US”,按“确定”完成3.4 启动和使用1.在命令行运行RUNMQLSR –M JADY2 –T TCP –P 14152.在MQ资源管理器中,选择JADY的通道TO.JADY2,右键选择“启动”通道。
Lab4-calibre
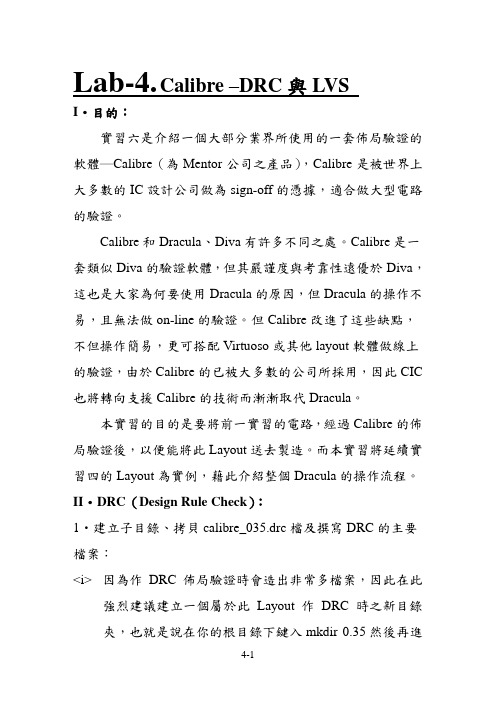
Lab-4.Calibre –DRC與LVSI•目的:實習六是介紹一個大部分業界所使用的一套佈局驗證的軟體―Calibre(為Mentor公司之產品),Calibre是被世界上大多數的IC設計公司做為sign-off的憑據,適合做大型電路的驗證。
Calibre和Dracula、Diva有許多不同之處。
Calibre是一套類似Diva的驗證軟體,但其嚴謹度與考靠性遠優於Diva,這也是大家為何要使用Dracula的原因,但Dracula的操作不易,且無法做on-line的驗證。
但Calibre改進了這些缺點,不但操作簡易,更可搭配Virtuoso或其他layout軟體做線上的驗證,由於Calibre的已被大多數的公司所採用,因此CIC 也將轉向支援Calibre的技術而漸漸取代Dracula。
本實習的目的是要將前一實習的電路,經過Calibre的佈局驗證後,以便能將此Layout送去製造。
而本實習將延續實習四的Layout為實例,藉此介紹整個Dracula的操作流程。
II•DRC(Design Rule Check):1•建立子目錄、拷貝calibre_035.drc檔及撰寫DRC的主要檔案:<i> 因為作DRC佈局驗證時會造出非常多檔案,因此在此強烈建議建立一個屬於此Layout作DRC時之新目錄夾,也就是說在你的根目錄下鍵入mkdir 0.35然後再進入0.35的資料夾內,即鍵入cd 0.35,再鍵入mkdir drcnand3,建立一個名為drcnand3的子目錄。
..<ii> 先進入/avanti/Lab610/avanti/Lab/610/test/lab/drc/目錄下再利用filemgr &或拷貝指令cp,將calibre_035.drc拷貝至你的工作目錄底下。
<iii> 為配合Layout,因此在作DRC驗證時必須利用編輯軟體(ex Vi、textedit….),編輯下面的檔案並存為drc_rules 的檔。
一级注册计量师《计量专业案例分析》冲刺试卷一
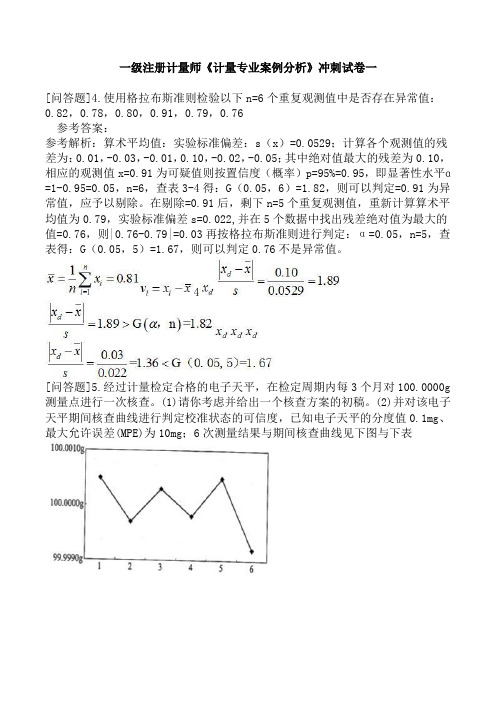
一级注册计量师《计量专业案例分析》冲刺试卷一[问答题]4.使用格拉布斯准则检验以下n=6个重复观测值中是否存在异常值:0.82,0.78,0.80,0.91,0.79,0.76参考答案:参考解析:算术平均值:实验标准偏差:s(x)=0.0529;计算各个观测值的残差为:0.01,-0.03,-0.01,0.10,-0.02,-0.05;其中绝对值最大的残差为0.10,相应的观测值x=0.91为可疑值则按置信度(概率)p=95%=0.95,即显著性水平ɑ=1-0.95=0.05,n=6,查表3-4得:G(0.05,6)=1.82,则可以判定=0.91为异常值,应予以剔除。
在剔除=0.91后,剩下n=5个重复观测值,重新计算算术平均值为0.79,实验标准偏差s=0.022,并在5个数据中找出残差绝对值为最大的值=0.76,则|0.76-0.79|=0.03再按格拉布斯准则进行判定:α=0.05,n=5,查表得:G(0.05,5)=1.67,则可以判定0.76不是异常值。
4[问答题]5.经过计量检定合格的电子天平,在检定周期内每3个月对100.0000g 测量点进行一次核查。
(1)请你考虑并给出一个核查方案的初稿。
(2)并对该电子天平期间核查曲线进行判定校准状态的可信度,已知电子天平的分度值0.1mg、最大允许误差(MPE)为10mg;6次测量结果与期间核查曲线见下图与下表参考答案:参考解析:(1)该电子天平期间核查方案的初稿①选用100gF1等级克组砝码作为核查标准②对电子天平100.0000g秤量点作为核查点③对测量点进行多次测量,取其平均值作为核查结果.④以2次核查结果的差值或核查结果与已知砝码量值之间的差值来评价核查结果⑤若差值小于电子天平的相应秤量的允许误差或测量不确定度,则该电子天平校准状态保持(2)分析电子天平期间核查校准状态的可信度从期间核查测量结果与期间核查曲线,获知计算相邻2次测量数据之差,见下表:[问答题]6.表1相色谱仪(×××检测器)期间核查用部分计量器具表2气相色谱仪(×××检测器)部分计量技术指标要求(1)指出表1和表2中计量单位使用不规范之处并更正;(2)列出计量单位“V•L/kg”对应的两种中文符号的表示形式和该单位的中文名称;(3)由表中气相色谱仪的灵敏度的计量单位推算基本国际单位中的量纲表示形式。
- 1、下载文档前请自行甄别文档内容的完整性,平台不提供额外的编辑、内容补充、找答案等附加服务。
- 2、"仅部分预览"的文档,不可在线预览部分如存在完整性等问题,可反馈申请退款(可完整预览的文档不适用该条件!)。
- 3、如文档侵犯您的权益,请联系客服反馈,我们会尽快为您处理(人工客服工作时间:9:00-18:30)。
实验四
三、实验内容
离散系统分析
5.利用load mtlb命令读入一段语音信号得到序列 x [ k ] ,然后在该段 语音信号中加入500Hz的正弦型干扰信号得到信号 y [ k ] ,利用 FFT分析其频谱。 (1)下列数字滤波器能够滤除信号 y [ k ] 中500Hz正弦型干扰信号。
(3) 计算前100个时刻的完全响应 filter(b,a,x,zi)中的初始值zi不是y[-1]= 1, y[-2]= 2, 它可以由filtic函数计算。 N=100; b=[1,2]; a=[1,0.4,-0.12]; x=ones(1,N); zi=filtic(b,a,[1,2]); y=filter(b,a,x,zi);
实验四
离散系统分析
1. 离散系统的时域响应
离散系统响应y[k]的计算
y = filter(b, a, x): 计算系统在输入x作用下的零状态响应y[k];
a [1, a 1 , , a N 1 , a N ]
b [ b 0 , b1 , , b M 1 , b M ]
y = filter(b, a, x, zi): 计算系统在输入x和初始状态作用下的完全响应y[k]。 zi是由系统的初始状态经过filtic函数转换而得到的初始条 件:zi= filtic (b, a, Y0) ,Y0为系统的初始状态, Y0= [ y[-1],y[-2],y[-3],...]。
2
2
0 . 1428 z
3
3
0 . 03571 z
4
4
0 . 8264 z
0 . 2605 z
0 . 04033 z
(1)计算系统的单位脉冲响应。 (2)当信号
x [ k ] u [ k ] cos( 4
k ) u [ k ] cos(
2
k )u [ k ]
5
k ) u [ k ]; x 3 [ k ] cos(
7 10
k )u [ k ]
(3)该系统具有什么特性?
实验四
三、实验内容
离散系统分析
2.已知某因果LTI系统的系统函数为:
H (z) 0 . 03571 0 . 1428 z 1 1 . 035 z
1 1
0 . 2143 z
a [1, a 1 , , a N 1 , a N ]
b ] = impz(b, a, n):计算n点单位脉冲响应h[k]; 也可简写为:h = impz(b, a, n)。 impz(b, a):绘制单位脉冲响应h[k]的图形。
再利用 H = Y./X 和 h = ifft(H,N) 可以得到系统的单位脉冲响应h[k]。
实验四
三、 实验内容
离散系统分析
1.已知某LTI系统的差分方程为:
y [ k ] 1 . 143 y [ k 1 ] 0 . 412 y [ k 2 ] 0 . 0675 x [ k ] 0 . 1349 x [ k 1] 0 . 0675 x [ k 2 ]
5
4
Magnitude
3
2
1
0
0
0.5
1
1.5 2 Frequency(rad)
2.5
3
3.5
实验四
离散系统分析
4.利用DTFT和DFT确定离散系统的特性
在很多情况下,需要根据LTI系统的输入和输出对系 统进行辨识,即通过测量系统在已知输入x[k]激励下的响 应y[k]来确定系统的特性。 若系统的脉冲响应为h[k],由于存在y[k]=x[k]* h[k], 因而可在时域通过解卷积方法求解h[k]。 在实际应用中,进行信号解卷积比较困难。因此,通 常从频域来分析系统,这样就可以将时域的卷积转变为频 域的乘积,从而通过分析系统输入序列和输出序列的频率 特性来确定系统的频率特性 H ( e j ) ,再由 H ( e ) 得到系统 的脉冲响应h[k]。
变连续系统的函数,主要包含有系统函数、
系统时域响应、系统频域响应等分析函数。
实验四
离散系统分析
1. 离散系统的时域响应
离散时间LTI系统可用如下的线性常系数差分方程来描述:
y[k ] a1 y[k 1] aN 1 y[k ( N 1)] aN y[k N ]
b0 x[k ] b1 x[k 1] bM 1 x[k ( M 1)] bM x[k M ]
M
N
k
( z z 1 )( z z 2 )...( z z M ) ( z p 1 )( z p 2 )...( z p N )
使用MATLAB提供的roots函数计算离散系统的零极点; 使用zplane函数绘制离散系统的零极点分布图。 注意:在利用这些函数时,要求H(z)的分子多项式和分母多项 式的系数的个数相等,若不等则需要补零。
1 z 1 z
1 1 2
已知某离散系统的系统函数为:
H (z) 0 .5 z
分析系统的幅频特性。
6
Magnitude response
b=[1,1]; a=[1,-1,0.5]; [H,w]=freqz(b,a); plot(w,abs(H)) xlabel('Frequency(rad)'); ylabel('Magnitude'); title('Magnitude response');
a [1, a 1 , , a N 1 , a N ] b [ b 0 , b1 , , b M 1 , b M ]
这些系数均从z0按z的降幂排列。
实验四
离散系统分析
1. 离散系统的时域响应
离散系统的单位冲激响应h[k]的计算 1) [h,k] = impz(b, a):计算系统的单位脉冲响应h[k]和相应 的时间向量k;也可简写为:h = impz(b, a)。其中:
已知输入信号x[k]以及系统初始状态y[-1],y[-2] ..., 就可以求出系统的响应。MATLAB提供了计算差分方程的 数值解的函数,可以计算上述差分方程描述的离散系统的 单位脉冲响应、零状态响应和完全响应等。
实验四
离散系统分析
1. 离散系统的时域响应
在调用MATLAB函数时,需要利用描述该离散系统的系数 函数。对差分方程进行Z变换即可得系统函数:
实验四
已知系统函数为 H ( z )
离散系统分析
1 2z 1 0 .4 z
1 1 2
0 . 12 z
,计算
(1) 离散系统的单位脉冲响应; (2) 输入x[k]= u[k],求系统的零状态响应y[k]; (3) 输入x[k]= u[k],初始条件y[-1]= 1, y[-2]= 2,求系统的完全响应y[k]。
(1)初始状态 y [ 1] 1, y [ 2 ] 2 ,输入 x [ k ] u [ k ] 计算系统的完全响应。 (2)当以下三个信号分别通过系统时,分别计算离散系统 的零状态响应:
x 1 [ k ] cos(
10
k ) u [ k ]; x 2 [ k ] cos(
实验四
三、实验内容
离散系统分析
4.已知某离散系统的输入输出序列。 输入序列:2,0.8333,0.3611,0.162,0.0748,0.0354,0.017, 0.0083,0.0041,0.002,0.001,0.0005,0.0002,0.0001, 0.0001,后面的数值均趋于0; 输出序列:0.0056,-0.0259,0.073,-0.1593,0.297, -0.4974,0.7711,-1.1267,1.5702,-2.1037,2.724,-3.4207, 4.174,-4.9528,5.7117,-6.3889,6.9034,-7.1528,7.012, -6.3322,4.9416,-2.648,-0.7564,5.4872,-11.7557, 19.7533,-29.6298,41.4666,-55.2433,70.7979,-87.7810 (1)绘出输入输出信号的波形。 (2)计算该系统的频率响应 ,并绘出其幅频特性。 j H (e (3)计算该系统的单位脉冲响应 ) ,并绘出其波形。
H (z) Y (z) X (z) b 0 b1 z 1 a1 z
1 1
b M 1 z a N 1 z
( M 1 ) ( N 1 )
bM z aN z
M
N
b( z) a(z)
在MATLAB中可使用向量a和向量b分别保存分母多项式和 分子多项式的系数:
实验四
离散系统分析
2.离散系统的系统函数零极点分析
离散LTI系统的系统函数H(z)可以表示为零极点形式:
H (z) Y (z) X (z) b 0 b1 z 1 a1 z
1 1
b M 1 z a N 1 z
( M 1 ) ( N 1 )
bM z aN z
通过系统时,计算系统的零状态响应。
实验四
三、实验内容
离散系统分析
3.已知LTI系统的输入输出序列分别为
( a ) x [ k ] ( ) u [ k ], 2
k
1
1 1 k 1 k y[ k ] ( ) u[ k ] ( ) u[ k ] 4 2 4 1 k 1 k 1 y [ k ] ( ) u [ k ] ( ) u [ k 1] 4 4
)e
j ( )
[H, w]=freqz(b, a, n): 计算系统的n点频率响应H,w为频率点向量。 H=freqz(b, a, w) :计算系统在指定频率点向量w上的频响; freqz(b,a): 绘制频率响应曲线。 其中:b和a分别为系统函数H(z)的分子分母系数矩阵;
