Winofex Analysis 20141114
Tektronix MDO3000 Series 数字多功能作业仪用户指南说明书
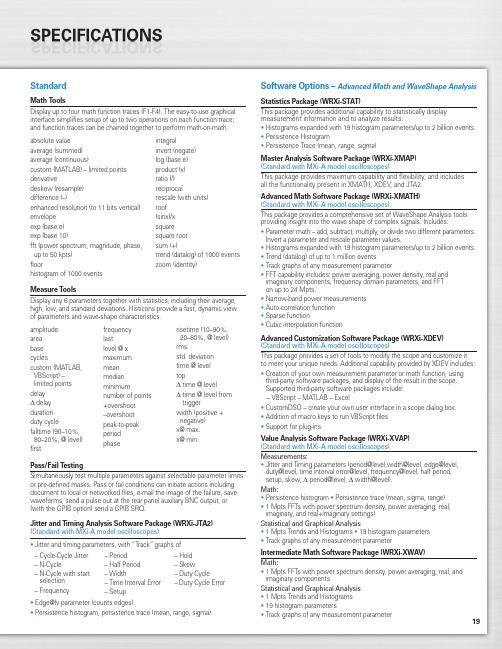
19StandardMath ToolsDisplay up to four math function traces (F1-F4). The easy-to-use graphical interface simplifies setup of up to two operations on each function trace;and function traces can be chained together to perform math-on-math.absolute value integralaverage (summed)invert (negate)average (continuous)log (base e)custom (MATLAB) – limited points product (x)derivativeratio (/)deskew (resample)reciprocaldifference (–)rescale (with units)enhanced resolution (to 11 bits vertical)roof envelope (sinx)/x exp (base e)square exp (base 10)square root fft (power spectrum, magnitude, phase,sum (+)up to 50 kpts) trend (datalog) of 1000 events floorzoom (identity)histogram of 1000 eventsMeasure ToolsDisplay any 6 parameters together with statistics, including their average,high, low, and standard deviations. Histicons provide a fast, dynamic view of parameters and wave-shape characteristics.Pass/Fail TestingSimultaneously test multiple parameters against selectable parameter limits or pre-defined masks. Pass or fail conditions can initiate actions including document to local or networked files, e-mail the image of the failure, save waveforms, send a pulse out at the rear panel auxiliary BNC output, or (with the GPIB option) send a GPIB SRQ.Jitter and Timing Analysis Software Package (WRXi-JTA2)(Standard with MXi-A model oscilloscopes)•Jitter and timing parameters, with “Track”graphs of •Edge@lv parameter (counts edges)• Persistence histogram, persistence trace (mean, range, sigma)Software Options –Advanced Math and WaveShape AnalysisStatistics Package (WRXi-STAT)This package provides additional capability to statistically display measurement information and to analyze results:• Histograms expanded with 19 histogram parameters/up to 2 billion events.• Persistence Histogram• Persistence Trace (mean, range, sigma)Master Analysis Software Package (WRXi-XMAP)(Standard with MXi-A model oscilloscopes)This package provides maximum capability and flexibility, and includes all the functionality present in XMATH, XDEV, and JTA2.Advanced Math Software Package (WRXi-XMATH)(Standard with MXi-A model oscilloscopes)This package provides a comprehensive set of WaveShape Analysis tools providing insight into the wave shape of complex signals. Includes:•Parameter math – add, subtract, multiply, or divide two different parameters.Invert a parameter and rescale parameter values.•Histograms expanded with 19 histogram parameters/up to 2 billion events.•Trend (datalog) of up to 1 million events•Track graphs of any measurement parameter•FFT capability includes: power averaging, power density, real and imaginary components, frequency domain parameters, and FFT on up to 24 Mpts.•Narrow-band power measurements •Auto-correlation function •Sparse function• Cubic interpolation functionAdvanced Customization Software Package (WRXi-XDEV)(Standard with MXi-A model oscilloscopes)This package provides a set of tools to modify the scope and customize it to meet your unique needs. Additional capability provided by XDEV includes:•Creation of your own measurement parameter or math function, using third-party software packages, and display of the result in the scope. Supported third-party software packages include:– VBScript – MATLAB – Excel•CustomDSO – create your own user interface in a scope dialog box.• Addition of macro keys to run VBScript files •Support for plug-insValue Analysis Software Package (WRXi-XVAP)(Standard with MXi-A model oscilloscopes)Measurements:•Jitter and Timing parameters (period@level,width@level, edge@level,duty@level, time interval error@level, frequency@level, half period, setup, skew, Δ period@level, Δ width@level).Math:•Persistence histogram •Persistence trace (mean, sigma, range)•1 Mpts FFTs with power spectrum density, power averaging, real, imaginary, and real+imaginary settings)Statistical and Graphical Analysis•1 Mpts Trends and Histograms •19 histogram parameters •Track graphs of any measurement parameterIntermediate Math Software Package (WRXi-XWAV)Math:•1 Mpts FFTs with power spectrum density, power averaging, real, and imaginary componentsStatistical and Graphical Analysis •1 Mpts Trends and Histograms •19 histogram parameters•Track graphs of any measurement parameteramplitude area base cyclescustom (MATLAB,VBScript) –limited points delay Δdelay duration duty cyclefalltime (90–10%, 80–20%, @ level)firstfrequency lastlevel @ x maximum mean median minimumnumber of points +overshoot –overshoot peak-to-peak period phaserisetime (10–90%, 20–80%, @ level)rmsstd. deviation time @ level topΔ time @ levelΔ time @ level from triggerwidth (positive + negative)x@ max.x@ min.– Cycle-Cycle Jitter – N-Cycle– N-Cycle with start selection – Frequency– Period – Half Period – Width– Time Interval Error – Setup– Hold – Skew– Duty Cycle– Duty Cycle Error20WaveRunner WaveRunner WaveRunner WaveRunner WaveRunner 44Xi-A64Xi-A62Xi-A104Xi-A204Xi-AVertical System44MXi-A64MXi-A104MXi-A204MXi-ANominal Analog Bandwidth 400 MHz600 MHz600 MHz 1 GHz 2 GHz@ 50 Ω, 10 mV–1 V/divRise Time (Typical)875 ps500 ps500 ps300 ps180 psInput Channels44244Bandwidth Limiters20 MHz; 200 MHzInput Impedance 1 MΩ||16 pF or 50 Ω 1 MΩ||20 pF or 50 ΩInput Coupling50 Ω: DC, 1 MΩ: AC, DC, GNDMaximum Input Voltage50 Ω: 5 V rms, 1 MΩ: 400 V max.50 Ω: 5 V rms, 1 MΩ: 250 V max.(DC + Peak AC ≤ 5 kHz)(DC + Peak AC ≤ 10 kHz)Vertical Resolution8 bits; up to 11 with enhanced resolution (ERES)Sensitivity50 Ω: 2 mV/div–1 V/div fully variable; 1 MΩ: 2 mV–10 V/div fully variableDC Gain Accuracy±1.0% of full scale (typical); ±1.5% of full scale, ≥ 10 mV/div (warranted)Offset Range50 Ω: ±1 V @ 2–98 mV/div, ±10 V @ 100 mV/div–1 V/div; 50Ω:±400mV@2–4.95mV/div,±1V@5–99mv/div,1 M Ω: ±1 V @ 2–98 mV/div, ±10 V @ 100 mV/div–1 V/div,±10 V @ 100 mV–1 V/div±**********/div–10V/div 1 M Ω: ±400 mV @ 2–4.95 mV/div, ±1 V @5–99 mV/div, ±10 V @ 100 mV–1 V/div,±*********–10V/divInput Connector ProBus/BNCTimebase SystemTimebases Internal timebase common to all input channels; an external clock may be applied at the auxiliary inputTime/Division Range Real time: 200 ps/div–10 s/div, RIS mode: 200 ps/div to 10 ns/div, Roll mode: up to 1,000 s/divClock Accuracy≤ 5 ppm @ 25 °C (typical) (≤ 10 ppm @ 5–40 °C)Sample Rate and Delay Time Accuracy Equal to Clock AccuracyChannel to Channel Deskew Range±9 x time/div setting, 100 ms max., each channelExternal Sample Clock DC to 600 MHz; (DC to 1 GHz for 104Xi-A/104MXi-A and 204Xi-A/204MXi-A) 50 Ω, (limited BW in 1 MΩ),BNC input, limited to 2 Ch operation (1 Ch in 62Xi-A), (minimum rise time and amplitude requirements applyat low frequencies)Roll Mode User selectable at ≥ 500 ms/div and ≤100 kS/s44Xi-A64Xi-A62Xi-A104Xi-A204Xi-A Acquisition System44MXi-A64MXi-A104MXi-A204MXi-ASingle-Shot Sample Rate/Ch 5 GS/sInterleaved Sample Rate (2 Ch) 5 GS/s10 GS/s10 GS/s10 GS/s10 GS/sRandom Interleaved Sampling (RIS)200 GS/sRIS Mode User selectable from 200 ps/div to 10 ns/div User selectable from 100 ps/div to 10 ns/div Trigger Rate (Maximum) 1,250,000 waveforms/secondSequence Time Stamp Resolution 1 nsMinimum Time Between 800 nsSequential SegmentsAcquisition Memory Options Max. Acquisition Points (4 Ch/2 Ch, 2 Ch/1 Ch in 62Xi-A)Segments (Sequence Mode)Standard12.5M/25M10,00044Xi-A64Xi-A62Xi-A104Xi-A204Xi-A Acquisition Processing44MXi-A64MXi-A104MXi-A204MXi-ATime Resolution (min, Single-shot)200 ps (5 GS/s)100 ps (10 GS/s)100 ps (10 GS/s)100 ps (10 GS/s)100 ps (10 GS/s) Averaging Summed and continuous averaging to 1 million sweepsERES From 8.5 to 11 bits vertical resolutionEnvelope (Extrema)Envelope, floor, or roof for up to 1 million sweepsInterpolation Linear or (Sinx)/xTrigger SystemTrigger Modes Normal, Auto, Single, StopSources Any input channel, External, Ext/10, or Line; slope and level unique to each source, except LineTrigger Coupling DC, AC (typically 7.5 Hz), HF Reject, LF RejectPre-trigger Delay 0–100% of memory size (adjustable in 1% increments, or 100 ns)Post-trigger Delay Up to 10,000 divisions in real time mode, limited at slower time/div settings in roll modeHold-off 1 ns to 20 s or 1 to 1,000,000,000 events21WaveRunner WaveRunner WaveRunner WaveRunner WaveRunner 44Xi-A 64Xi-A 62Xi-A104Xi-A 204Xi-A Trigger System (cont’d)44MXi-A64MXi-A104MXi-A204MXi-AInternal Trigger Level Range ±4.1 div from center (typical)Trigger and Interpolator Jitter≤ 3 ps rms (typical)Trigger Sensitivity with Edge Trigger 2 div @ < 400 MHz 2 div @ < 600 MHz 2 div @ < 600 MHz 2 div @ < 1 GHz 2 div @ < 2 GHz (Ch 1–4 + external, DC, AC, and 1 div @ < 200 MHz 1 div @ < 200 MHz 1 div @ < 200 MHz 1 div @ < 200 MHz 1 div @ < 200 MHz LFrej coupling)Max. Trigger Frequency with400 MHz 600 MHz 600 MHz 1 GHz2 GHzSMART Trigger™ (Ch 1–4 + external)@ ≥ 10 mV@ ≥ 10 mV@ ≥ 10 mV@ ≥ 10 mV@ ≥ 10 mVExternal Trigger RangeEXT/10 ±4 V; EXT ±400 mVBasic TriggersEdgeTriggers when signal meets slope (positive, negative, either, or Window) and level conditionTV-Composite VideoT riggers NTSC or PAL with selectable line and field; HDTV (720p, 1080i, 1080p) with selectable frame rate (50 or 60 Hz)and Line; or CUSTOM with selectable Fields (1–8), Lines (up to 2000), Frame Rates (25, 30, 50, or 60 Hz), Interlacing (1:1, 2:1, 4:1, 8:1), or Synch Pulse Slope (Positive or Negative)SMART TriggersState or Edge Qualified Triggers on any input source only if a defined state or edge occurred on another input source.Delay between sources is selectable by time or eventsQualified First In Sequence acquisition mode, triggers repeatedly on event B only if a defined pattern, state, or edge (event A) is satisfied in the first segment of the acquisition. Delay between sources is selectable by time or events Dropout Triggers if signal drops out for longer than selected time between 1 ns and 20 s.PatternLogic combination (AND, NAND, OR, NOR) of 5 inputs (4 channels and external trigger input – 2 Ch+EXT on WaveRunner 62Xi-A). Each source can be high, low, or don’t care. The High and Low level can be selected independently. Triggers at start or end of the patternSMART Triggers with Exclusion TechnologyGlitch and Pulse Width Triggers on positive or negative glitches with widths selectable from 500 ps to 20 s or on intermittent faults (subject to bandwidth limit of oscilloscope)Signal or Pattern IntervalTriggers on intervals selectable between 1 ns and 20 sTimeout (State/Edge Qualified)Triggers on any source if a given state (or transition edge) has occurred on another source.Delay between sources is 1 ns to 20 s, or 1 to 99,999,999 eventsRuntTrigger on positive or negative runts defined by two voltage limits and two time limits. Select between 1 ns and 20 sSlew RateTrigger on edge rates. Select limits for dV, dt, and slope. Select edge limits between 1 ns and 20 s Exclusion TriggeringTrigger on intermittent faults by specifying the normal width or periodLeCroy WaveStream Fast Viewing ModeIntensity256 Intensity Levels, 1–100% adjustable via front panel control Number of Channels up to 4 simultaneouslyMax Sampling Rate5 GS/s (10 GS/s for WR 62Xi-A, 64Xi-A/64MXi-A,104Xi-A/104MXi-A, 204Xi-A/204MXi-A in interleaved mode)Waveforms/second (continuous)Up to 20,000 waveforms/secondOperationFront panel toggle between normal real-time mode and LeCroy WaveStream Fast Viewing modeAutomatic SetupAuto SetupAutomatically sets timebase, trigger, and sensitivity to display a wide range of repetitive signalsVertical Find ScaleAutomatically sets the vertical sensitivity and offset for the selected channels to display a waveform with maximum dynamic range44Xi-A 64Xi-A 62Xi-A104Xi-A 204Xi-A Probes44MXi-A 64MXi-A104MXi-A 204MXi-AProbesOne Passive probe per channel; Optional passive and active probes available Probe System; ProBus Automatically detects and supports a variety of compatible probes Scale FactorsAutomatically or manually selected, depending on probe usedColor Waveform DisplayTypeColor 10.4" flat-panel TFT-LCD with high resolution touch screenResolutionSVGA; 800 x 600 pixels; maximum external monitor output resolution of 2048 x 1536 pixelsNumber of Traces Display a maximum of 8 traces. Simultaneously display channel, zoom, memory, and math traces Grid StylesAuto, Single, Dual, Quad, Octal, XY , Single + XY , Dual + XY Waveform StylesSample dots joined or dots only in real-time mode22Zoom Expansion TracesDisplay up to 4 Zoom/Math traces with 16 bits/data pointInternal Waveform MemoryM1, M2, M3, M4 Internal Waveform Memory (store full-length waveform with 16 bits/data point) or store to any number of files limited only by data storage mediaSetup StorageFront Panel and Instrument StatusStore to the internal hard drive, over the network, or to a USB-connected peripheral deviceInterfaceRemote ControlVia Windows Automation, or via LeCroy Remote Command Set Network Communication Standard VXI-11 or VICP , LXI Class C Compliant GPIB Port (Accessory)Supports IEEE – 488.2Ethernet Port 10/100/1000Base-T Ethernet interface (RJ-45 connector)USB Ports5 USB 2.0 ports (one on front of instrument) supports Windows-compatible devices External Monitor Port Standard 15-pin D-Type SVGA-compatible DB-15; connect a second monitor to use extended desktop display mode with XGA resolution Serial PortDB-9 RS-232 port (not for remote oscilloscope control)44Xi-A 64Xi-A 62Xi-A104Xi-A 204Xi-A Auxiliary Input44MXi-A 64MXi-A104MXi-A 204MXi-ASignal Types Selected from External Trigger or External Clock input on front panel Coupling50 Ω: DC, 1 M Ω: AC, DC, GND Maximum Input Voltage50 Ω: 5 V rms , 1 M Ω: 400 V max.50 Ω: 5 V rms , 1 M Ω: 250 V max. (DC + Peak AC ≤ 5 kHz)(DC + Peak AC ≤ 10 kHz)Auxiliary OutputSignal TypeTrigger Enabled, Trigger Output. Pass/Fail, or Off Output Level TTL, ≈3.3 VConnector TypeBNC, located on rear panelGeneralAuto Calibration Ensures specified DC and timing accuracy is maintained for 1 year minimumCalibratorOutput available on front panel connector provides a variety of signals for probe calibration and compensationPower Requirements90–264 V rms at 50/60 Hz; 115 V rms (±10%) at 400 Hz, Automatic AC Voltage SelectionInstallation Category: 300 V CAT II; Max. Power Consumption: 340 VA/340 W; 290 VA/290 W for WaveRunner 62Xi-AEnvironmentalTemperature: Operating+5 °C to +40 °C Temperature: Non-Operating -20 °C to +60 °CHumidity: Operating Maximum relative humidity 80% for temperatures up to 31 °C decreasing linearly to 50% relative humidity at 40 °CHumidity: Non-Operating 5% to 95% RH (non-condensing) as tested per MIL-PRF-28800F Altitude: OperatingUp to 3,048 m (10,000 ft.) @ ≤ 25 °C Altitude: Non-OperatingUp to 12,190 m (40,000 ft.)PhysicalDimensions (HWD)260 mm x 340 mm x 152 mm Excluding accessories and projections (10.25" x 13.4" x 6")Net Weight7.26kg. (16.0lbs.)CertificationsCE Compliant, UL and cUL listed; Conforms to EN 61326, EN 61010-1, UL 61010-1 2nd Edition, and CSA C22.2 No. 61010-1-04Warranty and Service3-year warranty; calibration recommended annually. Optional service programs include extended warranty, upgrades, calibration, and customization services23Product DescriptionProduct CodeWaveRunner Xi-A Series Oscilloscopes2 GHz, 4 Ch, 5 GS/s, 12.5 Mpts/ChWaveRunner 204Xi-A(10 GS/s, 25 Mpts/Ch in interleaved mode)with 10.4" Color Touch Screen Display 1 GHz, 4 Ch, 5 GS/s, 12.5 Mpts/ChWaveRunner 104Xi-A(10 GS/s, 25 Mpts/Ch in interleaved mode)with 10.4" Color Touch Screen Display 600 MHz, 4 Ch, 5 GS/s, 12.5 Mpts/Ch WaveRunner 64Xi-A(10 GS/s, 25 Mpts/Ch in interleaved mode)with 10.4" Color Touch Screen Display 600 MHz, 2 Ch, 5 GS/s, 12.5 Mpts/Ch WaveRunner 62Xi-A(10 GS/s, 25 Mpts/Ch in interleaved mode)with 10.4" Color Touch Screen Display 400 MHz, 4 Ch, 5 GS/s, 12.5 Mpts/Ch WaveRunner 44Xi-A(25 Mpts/Ch in interleaved mode)with 10.4" Color Touch Screen DisplayWaveRunner MXi-A Series Oscilloscopes2 GHz, 4 Ch, 5 GS/s, 12.5 Mpts/ChWaveRunner 204MXi-A(10 GS/s, 25 Mpts/Ch in Interleaved Mode)with 10.4" Color Touch Screen Display 1 GHz, 4 Ch, 5 GS/s, 12.5 Mpts/ChWaveRunner 104MXi-A(10 GS/s, 25 Mpts/Ch in Interleaved Mode)with 10.4" Color Touch Screen Display 600 MHz, 4 Ch, 5 GS/s, 12.5 Mpts/Ch WaveRunner 64MXi-A(10 GS/s, 25 Mpts/Ch in Interleaved Mode)with 10.4" Color Touch Screen Display 400 MHz, 4 Ch, 5 GS/s, 12.5 Mpts/Ch WaveRunner 44MXi-A(25 Mpts/Ch in Interleaved Mode)with 10.4" Color Touch Screen DisplayIncluded with Standard Configuration÷10, 500 MHz, 10 M Ω Passive Probe (Total of 1 Per Channel)Standard Ports; 10/100/1000Base-T Ethernet, USB 2.0 (5), SVGA Video out, Audio in/out, RS-232Optical 3-button Wheel Mouse – USB 2.0Protective Front Cover Accessory PouchGetting Started Manual Quick Reference GuideAnti-virus Software (Trial Version)Commercial NIST Traceable Calibration with Certificate 3-year WarrantyGeneral Purpose Software OptionsStatistics Software Package WRXi-STAT Master Analysis Software Package WRXi-XMAP (Standard with MXi-A model oscilloscopes)Advanced Math Software Package WRXi-XMATH (Standard with MXi-A model oscilloscopes)Intermediate Math Software Package WRXi-XWAV (Standard with MXi-A model oscilloscopes)Value Analysis Software Package (Includes XWAV and JTA2) WRXi-XVAP (Standard with MXi-A model oscilloscopes)Advanced Customization Software Package WRXi-XDEV (Standard with MXi-A model oscilloscopes)Spectrum Analyzer and Advanced FFT Option WRXi-SPECTRUM Processing Web Editor Software Package WRXi-XWEBProduct Description Product CodeApplication Specific Software OptionsJitter and Timing Analysis Software Package WRXi-JTA2(Standard with MXi-A model oscilloscopes)Digital Filter Software PackageWRXi-DFP2Disk Drive Measurement Software Package WRXi-DDM2PowerMeasure Analysis Software Package WRXi-PMA2Serial Data Mask Software PackageWRXi-SDM QualiPHY Enabled Ethernet Software Option QPHY-ENET*QualiPHY Enabled USB 2.0 Software Option QPHY-USB †EMC Pulse Parameter Software Package WRXi-EMC Electrical Telecom Mask Test PackageET-PMT* TF-ENET-B required. †TF-USB-B required.Serial Data OptionsI 2C Trigger and Decode Option WRXi-I2Cbus TD SPI Trigger and Decode Option WRXi-SPIbus TD UART and RS-232 Trigger and Decode Option WRXi-UART-RS232bus TD LIN Trigger and Decode Option WRXi-LINbus TD CANbus TD Trigger and Decode Option CANbus TD CANbus TDM Trigger, Decode, and Measure/Graph Option CANbus TDM FlexRay Trigger and Decode Option WRXi-FlexRaybus TD FlexRay Trigger and Decode Physical Layer WRXi-FlexRaybus TDP Test OptionAudiobus Trigger and Decode Option WRXi-Audiobus TDfor I 2S , LJ, RJ, and TDMAudiobus Trigger, Decode, and Graph Option WRXi-Audiobus TDGfor I 2S LJ, RJ, and TDMMIL-STD-1553 Trigger and Decode Option WRXi-1553 TDA variety of Vehicle Bus Analyzers based on the WaveRunner Xi-A platform are available.These units are equipped with a Symbolic CAN trigger and decode.Mixed Signal Oscilloscope Options500 MHz, 18 Ch, 2 GS/s, 50 Mpts/Ch MS-500Mixed Signal Oscilloscope Option 250 MHz, 36 Ch, 1 GS/s, 25 Mpts/ChMS-500-36(500 MHz, 18 Ch, 2 GS/s, 50 Mpts/Ch Interleaved) Mixed Signal Oscilloscope Option 250 MHz, 18 Ch, 1 GS/s, 10 Mpts/Ch MS-250Mixed Signal Oscilloscope OptionProbes and Amplifiers*Set of 4 ZS1500, 1.5 GHz, 0.9 pF , 1 M ΩZS1500-QUADPAK High Impedance Active ProbeSet of 4 ZS1000, 1 GHz, 0.9 pF , 1 M ΩZS1000-QUADPAK High Impedance Active Probe 2.5 GHz, 0.7 pF Active Probe HFP25001 GHz Active Differential Probe (÷1, ÷10, ÷20)AP034500 MHz Active Differential Probe (x10, ÷1, ÷10, ÷100)AP03330 A; 100 MHz Current Probe – AC/DC; 30 A rms ; 50 A rms Pulse CP03130 A; 50 MHz Current Probe – AC/DC; 30 A rms ; 50 A rms Pulse CP03030 A; 50 MHz Current Probe – AC/DC; 30 A rms ; 50 A peak Pulse AP015150 A; 10 MHz Current Probe – AC/DC; 150 A rms ; 500 A peak Pulse CP150500 A; 2 MHz Current Probe – AC/DC; 500 A rms ; 700 A peak Pulse CP5001,400 V, 100 MHz High-Voltage Differential Probe ADP3051,400 V, 20 MHz High-Voltage Differential Probe ADP3001 Ch, 100 MHz Differential Amplifier DA1855A*A wide variety of other passive, active, and differential probes are also available.Consult LeCroy for more information.Product Description Product CodeHardware Accessories*10/100/1000Base-T Compliance Test Fixture TF-ENET-B †USB 2.0 Compliance Test Fixture TF-USB-B External GPIB Interface WS-GPIBSoft Carrying Case WRXi-SOFTCASE Hard Transit CaseWRXi-HARDCASE Mounting Stand – Desktop Clamp Style WRXi-MS-CLAMPRackmount Kit WRXi-RACK Mini KeyboardWRXi-KYBD Removable Hard Drive Package (Includes removeable WRXi-A-RHD hard drive kit and two hard drives)Additional Removable Hard DriveWRXi-A-RHD-02* A variety of local language front panel overlays are also available .† Includes ENET-2CAB-SMA018 and ENET-2ADA-BNCSMA.Customer ServiceLeCroy oscilloscopes and probes are designed, built, and tested to ensure high reliability. In the unlikely event you experience difficulties, our digital oscilloscopes are fully warranted for three years, and our probes are warranted for one year.This warranty includes:• No charge for return shipping • Long-term 7-year support• Upgrade to latest software at no chargeLocal sales offices are located throughout the world. Visit our website to find the most convenient location.© 2010 by LeCroy Corporation. All rights reserved. Specifications, prices, availability, and delivery subject to change without notice. Product or brand names are trademarks or requested trademarks of their respective holders.1-800-5-LeCroy WRXi-ADS-14Apr10PDF。
关于赛门铁克查杀中文XP系统文件问题的事件分析

关于赛门铁克查杀中文XP系统文件问题的事件分析安天安全研究与应急处理中心(Antiy CERT) 一、 事件描述:2006年5月17日,赛门铁克(诺顿)杀毒软件升级病毒库后,会把中文简体版Windows XP系统的关键文件当作病毒隔离,重启后系统将会瘫痪。
该事件引起一些网络舆论上的猜测和假象,主要猜测的焦点在于如果此为一次误报事件,那么根据常理中英文版本原则上基本只有语言集合字符串资源的差异,那么按照特征检测的反病毒软件,为何不误报英文版和其他语言版。
因此进一步推断被误报的2个中文版文件有windows预留的后门。
同时不同人士也对赛门铁克误报原因进行了相关猜测。
Antiy CERT对相关问题进行分析,并根据分析过程撰写此分析报告。
二、 赛门铁克官方解释:赛门铁克对事件的官方说明如下:在windows XP sp2 简体中文版打上补丁KB924270以后,SAV更新到5月17日的病毒定义以后,会把C:\windows\system32\netapi32.dll 和c:\windows\system32\lsasrv.dll认为是backdoor.haxdoor,并且把他们隔离掉。
造成重起机器后无法进入系统,安全模式也无法进入,蓝屏。
赛门铁克对事件的官方解释如下:5月21日下午,赛门铁克称其安全响应中心使用多种自动化系统来辅助完成手动分析, 最近在自动化系统中进行了一处改动,这却无意中引发了自动化系统中使用的一个简单定义发生变化,进而导致2个Windows系统文件被错误地检测为恶意软件。
三、 被误杀文件信息:lsasrv.dll:DLL 文件: lsasrv 或者 lsasrv.dllDLL 名称: Microsoft Local Security Authority Server描述: lsasrv.dll用于本地安全密码验证相关动态链接库文件。
属于: Microsoft Windows Operating System系统 DLL文件:是netapi32.dll:DLL 文件: netapi32 或者 netapi32.dllDLL 名称: Microsoft LAN Manager DLL描述:netapi32.dll是Windows网络应用程序接口,用于支持访问微软网络。
“3414”试验数据分析软件设计原理_____
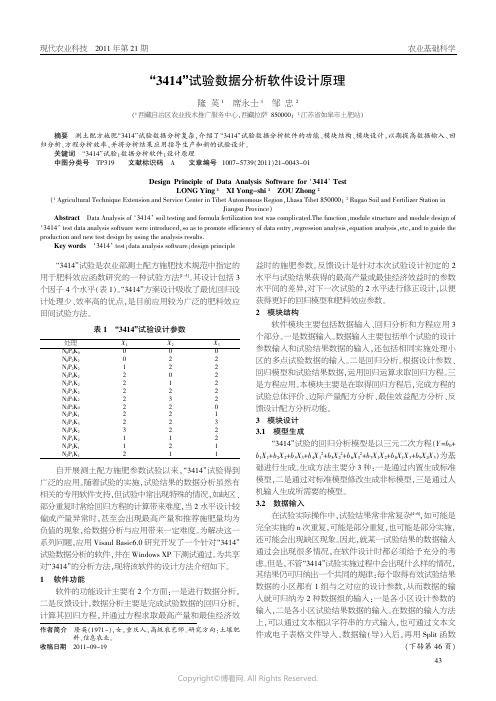
“3414”试验是农业部测土配方施肥技术规范中指定的用于肥料效应函数研究的一种试验方法[1-3]。
其设计包括3个因子4个水平(表1)。
“3414”方案设计吸收了最优回归设计处理少、效率高的优点,是目前应用较为广泛的肥料效应田间试验方法。
自开展测土配方施肥参数试验以来,“3414”试验得到广泛的应用。
随着试验的实施,试验结果的数据分析虽然有相关的专用软件支持,但试验中常出现特殊的情况,如缺区、部分重复时常给回归方程的计算带来难度,当2水平设计较偏或产量异常时,甚至会出现最高产量和推荐施肥量均为负值的现象,给数据分析与应用带来一定难度。
为解决这一系列问题,应用Visaul Basic6.0研究开发了一个针对“3414”试验数据分析的软件,并在Windows XP 下测试通过。
为共享对“3414”的分析方法,现将该软件的设计方法介绍如下。
1软件功能软件的功能设计主要有2个方面:一是进行数据分析,二是反馈设计。
数据分析主要是完成试验数据的回归分析,计算其回归方程,并通过方程求取最高产量和最佳经济效益时的施肥参数。
反馈设计是针对本次试验设计初定的2水平与试验结果获得的最高产量或最佳经济效益时的参数水平间的差异,对下一次试验的2水平进行修正设计,以便获得更好的回归模型和肥料效应参数。
2模块结构软件模块主要包括数据输入、回归分析和方程应用3个部分。
一是数据输入。
数据输入主要包括单个试验的设计参数输入和试验结果数据的输入,还包括相同实施处理小区的多点试验数据的输入。
二是回归分析。
根据设计参数、回归模型和试验结果数据,运用回归运算求取回归方程。
三是方程应用。
本模块主要是在取得回归方程后,完成方程的试验总体评价、边际产量配方分析、最佳效益配方分析、反馈设计配方分析功能。
3模块设计3.1模型生成“3414”试验的回归分析模型是以三元二次方程(Y =b 0+b 1X 1+b 2X 2+b 3X 3+b 4X 12+b 5X 22+b 6X 32+b 7X 1X 2+b 8X 1X 3+b 9X 2X 3)为基础进行生成。
微软消息分析器:一款高级网络包分析器说明书

Neil B MartinT est Manager WSSC-Interop and T oolsMicrosoft CorporationMicrosoft Message Analyzer Packet Analysis at a Higher LevelContent•Packet Analyzer -review •Abstracting views of protocols •Alternative data sources •ETW•Remote Capture•Bluetooth•USB•Evtx•Logs filesMessage Analyzer –What is it?• A packet analyzer is a computer program or a piece of computer hardware that can intercept and log traffic passing over all or part of a network•Packet analyzers capture network packets in real time and display them in human-readable format•WireShark, Microsoft NetMon3.4•These tools are dissectors•If they recognize a packet they dissect it and display the inner fields of the packet•The parsers are written based on the protocol specifications or in some cases through reverse engineering of the protocols whenno specification is available•Dissection and Abstraction•We want to allow a higher level of abstraction view of protcols•Pattern Matching•Match up request/response pairs where possible•Called an operation•Different Viewers and Charts•Addressing many of the challenges of diagnosing modern networks •Protocol Validation•Identify packets that do not match the specification•Data capture from multiple sources•NDIS, Bluetooth, USB, Windows Firewall Layer, Web Proxy•Header only network capture•Reduce data in volume scenarios•Correlation of data across multiple data sources and logs•Load and display multiple data source•Message Analyzer captures ETW •ETW -Event Trace for Windows •Message Capture from:•Traditional NDIS traffic from the Network Adapter •Windows Filtering Platform 9aka Firewall)•Web proxy•USB ports•Bluetooth•Windows SMB Client•Windows SMB Server ……•E vent T racing for W indows ETW•High-resolution (<<100µs)logging infrastructure allows any component to tell the outside world what it is currently doing by firing ETW events.• A powerful diagnostic tool to log every methods/lines inside the code with reasonable performance fordebugging/troubleshooting.•MSDN on ETW/en-us/library/bb968803(VS.85).aspxAll Windows ETW Sources are available to Message Analyzer•Capability to perform remote capture •Select machine and give credentials•Collect data via ETW from NIC on remote machine•Powerful, extensible viewing and analysis •Browse, Select, View•Browse for messages from various sources (live, or stored)•Select a set of messages from those sources by characteristic(s)•View messages in a provided viewer, configure or build your own • A new high-level grid view•High level “Operations” view with automatic re-assembly•“Bubbling up” of errors in the stack to the top level•Ability to drill down the stack to underlying messages and/or packets•On the fly grouping, filtering, finding, or sorting by any message property •Payload rendering•V alidation of message structures, behavior, and architecture•Does the protocol comply with the specifications?•Over 450 published specifications for Windows Protocols(as of Windows 8.1)(/en-us/library/gg685446.aspx)Available online and as PDFContinue to publish new documents with each release of Windows •Continue to develop tools and technology to aid with the development of protocol documents, parsers and test technologyHow to get MA: /en-us/download/details.aspx?id=40308 How to get help: Blog,Operating Guide, T echnet Forum for Message Analyzer •We invite you to Explore Message Analyzer•Connect Community•https:///site216/。
(完整版)《计算机网络》教案

实践教学以强化学生的动手实践能力为目的,以提高操作技能和面向实用技术为设计原则,以组网技术和构建网络应用服务为核心设计实验内容。具体包括简单局域网组网、网络协议分析、路由器配置、典型应用服务器的配置和简单网络应用程序开发等实用性较强的实践内容。部分实验内容可根据学生学习能力和实际情况,让学生自主选做。
教学内容与时间安排:
预习思考题:
1. 你关心的网络性能有哪些(你如何评价网络运行情况的好坏)?
2.如果上网很慢你认为可能的原因是什么?
3.两个人如何通过手电筒传递消息?要考虑哪些问题?请设计一种可行的方案。
内容回顾与本次课内容介绍
一、计算机网络的类别
(一)计算机网络的定义
(二)几种不同类别的网络
布置学生自学。
比较可能没有时间讲完,可让学生课后思考,下次课再讲
第2讲
内容
备注
讲课题目:计算机网络的类别、性能、体系结构
目的要求:掌握计算机网络的基本性能指标、通过研讨理解计算机网络协议分层的意义和作用,理解5层原理体系结构中各层的基本功能。
重点难点:分层体系结构
方法步骤:课堂讲解与实例介绍
器材保障:电脑、投影
时间地点:
6、分组交换与电路交换的比较。
1)分组交换存在的问题:时延、丢包等
通过提问和启发的方式让学生自己将这些问题找出来
2)在资源分配和资源共享方面的比较;
3)在时延方面的比较;
回顾与小结:
1、计算机网络(特别是因特网)的作用;
2、因特网的组成;
3、电路交换、分组交换的基本工作原理;
4、列出本次课要掌握的知识点。
Windows安全防护 MSE安全攻防培训资料

MBSA
既有图形界面版本,又有命令行版本 生成安全报表
系统总得分 每一项安全检查通过或失败得分 针对发现的安全性漏洞,提出详细解释和修补动 作
是一个“只读”工具 -对被检查的机器没有
任何配置或更新操作 用户在每台被检查的机器上必须有本地管理 员权限
使用MBSA
扫描单台计算机
Windows 安全防护
wangdayong@
主要内容
如何保证Windows操作系统的安全 Windows NT/2000/XP安全配置 Windows NT/2000/XP的日志审计 基本安全措施 Windows管理员须知
为什么很难获得安全性 , 保持安全性?
SSR包含了一些向导程序,用来检查和实施
OS,特定应用程序的安全策略(例如: Exchange,IIS)
安全服务器角色 SSR
安全服务器角色框架
设置广泛(例如:服务,端口,注册表键 值,审计,用户组等) “角色”众多(例如:域控制器,文件服 务器,打印服务器,Web服务器等) 适用范围广泛(例如:Internet连接,DMZ,企 业网络,多网卡主机) 可定制 可以增加新的"角色",无需编程
扫描多台计算机
订阅安全公告邮件
从哪里得到补丁 ?
/TechNet/Sec urity
发送邮件到
microsoft_security-subscriberequest@ 利用Windows更新工具接受自动通知 订购安全工具包或联机访问安全工具包网站indows 2000, XP Internet Explorer 5.01和后续产品 IIS 4.0 and 5.0 SQL 7.0 和后续产品
axiom analysis suite的使用方法

axiom analysis suite的使用方法(实用版4篇)篇1 目录1.Axiom Analysis Suite 简介2.安装 Axiom Analysis Suite3.使用 Axiom Analysis Suite4.常见问题与解决方法5.总结篇1正文一、Axiom Analysis Suite 简介Axiom Analysis Suite 是一款功能强大的数据分析软件,适用于各种行业和领域。
它提供了一整套数据处理、分析和可视化工具,帮助用户轻松地从大量数据中提取有价值的信息,以便更好地做出决策。
二、安装 Axiom Analysis Suite1.访问 Axiom Analysis Suite 官方网站,下载并安装软件包。
2.按照安装向导的提示进行操作,完成安装过程。
3.安装完成后,启动 Axiom Analysis Suite,进入主界面。
三、使用 Axiom Analysis Suite1.数据导入(1)支持多种数据格式,如 CSV、Excel、SQL 等。
(2)通过拖放或点击“导入”按钮将数据添加到工作区。
2.数据处理(1)提供多种数据处理功能,如筛选、排序、分组等。
(2)通过“数据”菜单或右键菜单进行操作。
3.数据分析(1)使用内置的统计函数,如平均值、标准差等。
(2)通过“分析”菜单或右键菜单进行操作。
4.数据可视化(1)支持多种图表类型,如柱状图、折线图、饼图等。
(2)通过“可视化”菜单或右键菜单进行操作。
5.报告输出(1)将分析结果导出为 Excel、PDF 等格式。
(2)通过“文件”菜单进行操作。
四、常见问题与解决方法1.数据导入失败:检查数据格式是否正确,或尝试重新安装软件。
2.图表显示不正常:检查数据源是否正确,或尝试重新启动软件。
3.软件运行缓慢:清理不必要的插件,或尝试升级软件版本。
五、总结Axiom Analysis Suite 是一款实用的数据分析软件,适用于各类用户。
Ixia网络测试设备XM2型号说明书

Ixia test systems deliver the industry’s most comprehensive solutions for the performance, functional, and conformance testing of networks and networked applications. The 2-slot XM2 portable chassis provides a high-density, highly-flexible platform on which an Ixia test system can be built. Operating in conjunction with the Ixia family of test applications, the XM2 provides the foundation for a complete portable, flexible test environment.A wide array of interface modules is available for the XM2. The chassis supports up to 32 - 10GbE ports, 12 - 40GbE ports, 4 - 100GbE ports, 4 - packet over SONET (POS) ports, or 4 - asynchronous transfer mode (ATM) ports. These modules provide the network interfaces and distributed processing resources needed for executing a broad range of data, signaling, voice, video, and application testing for layers 2-7.The XM2 chassis supports an integrated test controller that manages all system and testing resources. Resource ownership at a per-port level, coupled with hot-swappable interface modules, ensures a highly flexible and multi-user testing environment. A load module form factor adapter assures backward compatibility with existing Ixia standard form factor interface modules and provides seamless migration from and integration with existing Ixia test system installations.XM2 Chassis Highlights∙Common platform: a single portable solution for executinga wide array of data,signaling, routing, voice,video, and application testingfrom Layer 2 through 7∙Hot swappable modules: interface cards can beactively swapped in and outof the test bed withoutdisrupting ongoing tests∙Extensive interface support: 10/100/1000 Ethernet,10GbE, Higher SpeedEthernet 40Gbps, 100Gbps,and dual-speed40/100Gbps, OC-3c/12cATM, OC-3c/12c/48c/192cPacket over SONET (POS) ∙Integrated PC controllerrunning Windows 7 formanagement and control ofport configuration andstatistics∙High performance: high-speed backplane andsystem controller to supportthe high bandwidthrequirements of mediumscale application tests∙Daisy-chaining of up to 256 Ixia chassis in a single test(XM12 High Performance,XM2, IXIA 400Tv2) with highsynchronization accuracy∙Powerful automationfacilities using the Tclscripting language with easyintegration into automatedlab environments∙Modular sub-components: power supplies, and harddriveXM2 Portable ChassisSpecificationsTemperature1Some high density / high performance load modules may require more power and cooling reducing the number of useable slots.The number of useable slots will be determined by the combination of load modules being used in the chassis.2For a complete list of all Ixia load modules supported by the XM2 chassis please refer to the Ixia Hardware and Reference guide document and the Product Compatibility Matrix that are available under the Support section of the website.3Some high density / high performance load modules may require a lower operating temperature. If this is the case, the operating temperature will be specified in the load module datasheet.Features∙Common platform: a single portable solution for executing a wide array of data, signaling, routing, voice, video, and application testing from Layer 2 through 7∙Hot swappable modules: interface cards can be actively swapped in and out of the test bed without disrupting ongoing tests∙Extensive interface support: 10/100/1000 Ethernet, 10 Gigabit Ethernet, Higher Speed Ethernet 40 Gbps, 100Gbps, and Dual-Speed 40/100 Gbps, OC-3c/12c ATM, OC-3c/12c/48c/192c Packet over SONET (POS), Power over Ethernet (PoE)∙Integrated PC controller running Windows 7 operating system for management and control of port configuration and statistics∙High performance: high-speed backplane and system controller to support the high bandwidth requirements of medium scale application tests∙Daisy-chaining of up to 256 Ixia chassis in a single test (XM12 High Performance, XM2, IXIA 400Tv2) with high synchronization accuracy∙Powerful automation facilities using the Tcl scripting language with easy integration into automated lab environments∙Modular sub-components: power supplies, and hard driveBenefits∙Very high Gigabit and 10 Gigabit Ethernet port density in 3U portable chassis, reducing space requirements and simplifying management∙Wide variety of network interfaces available enables flexible, multi-functional deployment∙High performance architecture speeds test initialization and execution times∙Multi-user environment leverages test equipment investment across multiple tests and users simultaneously∙Port-level user ownership maximizes testing resources across multiple users∙Integrated software packaging/installation for both chassis and interface modules reduces management overhead and simplifies upgrades∙Remote management allows easy access to chassis resources via a network∙Pre-built automated test packages provide for the simple execution of scalable benchmarking metric tests∙Hot-swappable interface modules allow continual test execution in a multi-user environment without interruption ∙Modular sub-components enable simplified and quicker upgrades and replacements∙Backward compatibility of hardware and software with existing Ixia test systems allows easy transition from or integration with existing installationsTargeted Users∙Engineering and quality assurance (QA) groups developing and testing high density Ethernet products∙Engineering and QA groups developing and testing layer 2-7 devices∙Manufacturing groups executing production quality and repetitive testing∙Customer support departments troubleshooting customer issues∙Internet service providers (ISPs), carriers, and large enterprises executing product qualification/acceptance testing or pre-deployment hot staging∙Certification and interoperability labs providing third party equipment test and validationIndustry-Leading PerformanceThe architecture of the XM2 chassis is designed for superior test application performance. Reduced test initialization and execution times compared with existing test systems ensures optimized use of test equipment investment.Ixia’s test systems are built on a proven, scalable archit ecture that integrates a RISC CPU running Linux and network protocol stacks on every test port. This distributed Linux processing environment enables application traffic testing of content-aware devices, together with line-rate stateless traffic generation and analysis on each Ixia test port.High ScalabilityThe XM2 test system is designed to operate in high scalability test environments. The XM2 chassis supports up to 32 Gigabit Ethernet ports and up to 32 10 Gigabit Ethernet ports in a portable 3U high system. Multiple XM2 and other Ixia chassis can be daisy-chained together to extend a single test environment to thousands of ports. The XM2 works in conjunction with Ixia’s family of applications to control and execute testing across large scale test beds.Application SupportThe XM2 high performance chassis supports a wide array of Ixia test applications, including:∙IxLoad for performance testing content-aware devices (e.g., load balancers, web servers, video servers) running protocols such as HTTP, FTP, SMTP, SIP, MPEG2 video, etc.∙IxVoice is a comprehensive hardware and software test framework that provides unified VoIP and PSTN test solutions for the telecom/network equipment∙IxNetwork for control and data plane performance testing of routers and switches with complex protocol support including BGP, OSPF, IS-IS, MPLS, IP multicast and Spanning Tree, including IPv4 and IPv6variations and many more protocols …∙IxAutomate for executing automated, wizard-based data and control plane protocol tests with sophisticated results analysis for RFC-based benchmark performance switch tests∙IxExplorer for granular, highly flexible data plane testing and analysis∙IxChariot for emulation of networked applications to determine end-to-end response times∙IxANVL for protocol conformance testing.Highly ServiceableThe XM2 is highly serviceable. Load modules may be replaced while the chassis is powered on -- all other load modules continue to run unaffected. The system hard drive is mounted on a replaceable tray. An interchangeable, modular power supply is also replaceable. Repairs and replacements are possible in a matter of minutes and without the need to return the chassis to the factory.Investment ProtectionThe XM2 portable chassis delivers increased performance for test applications while at the same time maintaining compatibility with existing Ixia test systems. Ixia standard form factor load modules are supported in the XM2 chassis via a load module adapter that supports hot swap and improved system performance. Test applications, configurations, and automation scripts are compatible, allowing easy migration of existing test beds to the new system without loss of capital investment.Product Ordering Information941-0023OPTIXIAXM2-02 2-slot XM form factor chassis, including integrated PC controller, power supplies, IxOS operating system, and IxExplorer client application.944-0007Standard Form Factor load module adapter module for the XM12 High Performance, XM12 and XM2 chassis. 942-0006Chassis Accessory, Carry case for 941-0023 (XM2-02) chassis; Includes retractable handle, reinforced padded corners, and wheels942-0023AFD2, Auxiliary Function Device, IRIG-B standalone timing unit for any Ixia chassis, RoHS compliant; Includes two 15 ft. cables, 6 ft. USB cable, 6 ft. serial cable, 6 ft. chassis sync cable and power supply; Configure by USB or serial cable; requires cable to be connected to BITS or other timing source942-0002AFD1, Auxiliary Function Device, GPS standalone unit for any Ixia chassis. Includes antenna, USB cable, serial cable, chassis sync cable and power supply. Configure by USB or serial cable, requires antenna to be installed with line-of-sight to the GPS satellites942-0043GPS Roof Antenna and 400ft AFD1 Installation Kit with in-line amplifier. Includes: 75 foot long antenna cable, two, 200 foot long, Series 240 coaxial cables and in-line amplifier. For use with 942-0002 AFD1 Auxiliary Function Device, GPS standalone unit.942-0044GPS Roof Antenna and 400ft AFD1 Installation Kit. Includes: 75 foot long antenna cable, one, 400 foot long, Series 400 coaxial cable. For use with 942-0002 AFD1 Auxiliary Function Device, GPS standalone unit.。
2014,Analytical QbD native gel

Electrophoresis2014,35,2163–21712163Mili PathakDebayon DuttaAnurag Rathore Department of Chemical Engineering,Indian Institute of Technology,New Delhi,IndiaReceived November25,2013 Revised March4,2014 Accepted March7,2014Research ArticleAnalytical QbD:Development of a native gel electrophoresis method for measurementof monoclonal antibody aggregatesThis paper presents a quality by design(QbD)based development of a novel native PAGE (N-PAGE)method as a low-cost analytical tool for analysis of aggregates of monoclonal parability to the present gold standard of SEC has been established.The motivation is the fact that SEC requires relatively expensive equipment and consumables, thus making N-PAGE relevant to those academicians and other small companies involved in early-stage development of biotherapeutics that do not have access to SEC,especially in developing countries.Furthermore,SEC suffers from certain disadvantages including the possibility of secondary interactions between the stationary phase and analyte resulting in higher elution time and therefore underestimation of the analyte size.The proposed N-PAGE method can also serve as an orthogonal analytical method for aggregate analysis.A QbD-based approach has been used for development and optimization of the protocol. First,initial screening studies were carried out with parameters including the running buffer pH,running buffer molarity,gel buffer pH,loading dye,sample concentration, and running voltage.Next,optimization of operating parameters was performed using principles of design of experiments.Thefinal optimized protocol was compared to the traditional SEC method and the results were found to be comparable.While N-PAGE has been in use for protein analysis for several decades,use of N-PAGE for analysis of mAb aggregates with data comparable to SEC such as the case presented here is novel. Keywords:mAb aggregate/Native polyacrylamide gel electrophoresis(N-PAGE)/Quality by design(QbD)/Size-exclusion chromatography(SEC)DOI10.1002/elps.2014000551IntroductionMonoclonal antibodies(mAbs)have been successfully demonstrated to target extracellular proteins with high speci-ficity for treatment of a variety of autoimmune diseases,such as cancer and multiple sclerosis[1,2].Since their introduc-tion in the early1990s,the demand for mAbs has increased rapidly and they presently comprise more than40%of the marketed biotech therapeutics[3].Typical processing scheme for production of mAbs involves product expression in mammalian cells followed by clarification of the harvested cell culture broth.The purification process comprises protein A affinity chromatog-raphy for product capture and removal of host cell related impurities,low pH inactivation for virus removal followed by a combination of cation exchange chromatography(CEX), Correspondence:Professor Anurag Rathore,Department of Chemical Engineering,Indian Institute of Technology,Hauz Khas, New Delhi110016,IndiaE-mail:asrathore@Abbreviations:APS,ammonium persulfate;DOE,design of experiments;mAb,monoclonal antibody;N-PAGE,native PAGE;QbD,quality by design;RMSD,root mean square de-viation anion exchange chromatography(AEX),and/or hydrophobic interaction chromatography(HIC)for removal of a gamut of product-related,process-related,and host cell related impurities[4].Ultrafiltration/diafiltration(UF/DF)steps are intermittently used for product concentration and/or buffer exchange.Thefinal steps include nanofiltration for viral clearance followed by UF/DF into thefinal formulation buffer[4,5].During processing,the process intermediates are analyzed for the various host cell related,process-related, and product-related impurities.This is performed so as to ensure that adequate process control and process monitoring is in place[6–9].Aggregates are one of the important factors responsible for increased risk of immune response.The un-known nature of the formed aggregates as well as their wide size range(six orders of magnitude,from a few nm to few mm in diameter)pose a challenge for analysis.None of the currently available techniques is able to cover this entire size range(kDa to mm)and as a result a combination of several techniques is used for this analysis.Techniques that may be included in this analytical package are SEC,PAGE,asymmet-ricalflowfieldflow fractionation(AF4),electron microscopy, atomic force microscopy(AFM),small angle X ray scatter-ing/small angle neutron scattering(SAXS/SANS),“Native”Colour Online:See the article online to view Figs.1–4in colour.2164M.Pathak et al.Electrophoresis2014,35,2163–2171MS,macro-ion mobility spectrometry,and analytical ultra-centrifugation[10].Each technique has its own strengths and weaknesses.Moreover,the available techniques differ with re-spect to the underlying physical principle and,consequently, differ with respect to the results and type of information obtained.Of these,while SEC is the most commonly used tool due to its excellent robustness,it suffers with certain disadvantages including sample dilution,limited resolution, limited particle size range,and possibility of secondary inter-actions between the stationary phase and analyte resulting in higher elution time and therefore underestimation of the an-alyte size[11].Also,SEC requires expensive instrumentation and consumables[11,12].SDS-PAGE is also an often-used quality control method to differentiate disulfide-mediated and nondisulfide-mediated covalent aggregates but is unable to quantify the total aggregates,as covalent aggregates have a tendency to break down in the presence of chaotropes such as SDS.Native PAGE on the other hand is easy to perform and can analyze both covalent and noncovalent aggregates. However,as the electrophoretic mobility depends both on size and charge,quantification is a difficult task.Quality by design(QbD)has been described by the ICH Q8guideline as“a systematic approach to development that begins with predefined objectives and emphasizes product and process understanding and process control,based on sound science and quality risk management”[13–15].Design of experiment(DOE)is a key element in QbD application toward process development[16,17].In this approach,all rel-evant variables are altered simultaneously through a set of planned experiments followed by statistical analysis of the results.DOE approach has been shown to deliver signifi-cant amount of information through a minimum number of experiments.While numerous examples exist in the litera-ture demonstrating QbD-based process development[18–20], applications toward analytical development are relatively recent[21–24].N-PAGE is based on the premise that any alteration in the charge,conformation,or binding events of the protein occurring during mAb processing would change their rela-tive migration[25–31].As a result,it can be used for stability studies of mAbs and other proteins[32]and also for demon-strating product comparability.It can also be used as an or-thogonal tool to SEC for mAb analysis[12].Thus,the focus of this paper is to develop and validate a novel,robust native PAGE protocol for quantification aggregates of mAbs with p IϾ8using QbD approach.Performance of thefinal proto-col has been compared to the traditional SEC method.This paper demonstrates how the principles of QbD can be applied for development and optimization of analytical methods.2Materials and methods2.1Materials and equipmentAcrylamide,N,N-methylenebisacrylamide,Tris,TEMED,and ammonium persulfate(APS)were obtained from Sigma–Aldrich(St.Louis,MO,USA).Silver nitrate,EDTA,sodium carbonate anhydrous,methanol,and glacial acetic acid used for silver staining were obtained from Merck(Darmstadt, Germany).Neutralized pool of mAb was used for experimen-tation.A major Indian biotech manufacturer donated the mAb.The Mini-PROTEAN Tetra cell electrophoresis unit was purchased from Bio-Rad(Hercules,CA,USA)and used for gel casting and performing electrophoresis.GS800-calibrated densitometer with Quantity One R software was purchased from Bio-Rad and used for gel scanning and analysis.2.2MethodologyA QbD-based methodology was adopted for development and optimization of the N-PAGE-based analytical method for measurement of aggregates[21].First,key performance attributes were defined for the method.For this study,we defined these as the number of bands(to quantitate if com-plete separation is being achieved),error in aggregate per-centage(to quantitate deviation from SEC),and root mean square deviation(RMSD)for aggregate percentage(to quan-titate accuracy for the method).Based on our understanding of development of N-PAGE method,we performed a few scouting studies at the start to prioritize the parameters that have significant effect on the quality of the separation.Next, we optimized the conditions of the running gel followed by optimization of gel percentage.Both these studies employed DOE to get the required information from as few experiments as possible.Finally,the optimized method was compared to the SEC and data were analyzed statistically to demonstrate that the method successfully meets the expectations.2.2.1Scouting studiesMethod attributes,which lead to separation of biomolecules (from literature and trial experiments),include running buffer pH,running buffer molarity,aminocaproic acid ratio, gel buffer molarity,gel buffer pH,loading dye,concentration of sample,voltage,and percentage of resolving gel.All these parameters were studied within the ranges mentioned in Ta-ble1.Effect of each parameter was examined and parameters that were found to be significant were examined further. 2.2.2Optimization of running gel conditions(Study1)In this study,the important parameters from initial screening that were forced to impact protein stability were examined, and the data were analyzed by JMP R 8(SAS Institute,Cary, NC)statistical software.2.2.3Optimization of gel percentage(Study2)In this study,a two-level,three-parameter,full-factorial DOE with two center points was performed(to optimize the gelElectrophoresis2014,35,2163–2171Liquid Phase Separations2165 T able1.Experimental approach followed for creation and optimization of the N-PAGE protocol for analyzing aggregates of mAb products Studies Parameters Range used ConclusionScouting studies Running buffer molarity0.05–0.2M Band migration less at0.05M,but trailing with unclearbackground indicating protein instability at0.2M.Further examined in Study1.Running buffer pH 4.3–6.5Protein denaturation observed at low pH and poormigration at high pH.Further examined in Study1.Aminocaproic acid ratio0.05–0.2M Less migration at low ratio,product instability at higherratio.Further examined in Study1.Gel buffer concentration0.015–0.25M Fine bands at low concentration with higher runningtime,smiley effect,and denaturation at higherconcentration.Further examined in Study1.Loading dye30%of glycerol and sucrose Proper bands obtained at30%sucrose.Locked at30%sucrose.Concentration of sample0.1–1mg/mL Fine bands at low concentration,two overlapping bandsat high concentration.Locked at0.2mg/ml.Voltage50–120V Proper band formation but higher run-time at lowvoltage.Vertical streaking at higher voltages.Lockedat50V.Resolving gel percentage6,8,10Band diffusion high at6%gel resulting in impropervisibility.At10%gel,poor migration with overlappingof aggregate and monomer bands.Proper migrationand band formation at8%.Locked at8%.Phase1study Running buffer molarity0.05–0.15M Optimum value identified as0.14M.Running buffer pH 5.3–6.0Optimum value identified as5.5.Aminocaproic acid ratio0.05–0.1M Optimum value identified as0.1M.Gel buffer concentration0–25mM Did not show significant impact.Phase2study Acrylamide(%)7.5–8.5Optimum value identified as8.5%.Bisacrylamide(%)0.15–0.25Optimum value identified as0.25%.APS(%)0.1–0.2Optimum value identified as0.1%.percentage),and the resulting data were analyzed using JMP R 8(SAS Institute)statistical software.2.2.4Statistical analysis for robustness andcomparabilitySamples with different aggregate content were analyzed with N-PAGE protocol in triplicates to check the robustness of the proposed method as well as to compare the performance of the two methods,were analyzed by SEC.Student’s t-test and RMSD values were used to examine the comparability of the measurements using Student’s t-distribution test.If the calculated t value was less than the t value at p=0.05,the data were deemed to be comparable.3Results and discussion3.1Scouting studiesIn a typical N-PAGE separation,the buffer provides a con-ducting medium for the separation,maintains the pH and ionic strength of the sample similar to the surrounding gel. For proteins with p IϽ8,Tris-glycine buffer(Laemmli buffer system)without SDS has been extensively used in the liter-ature[25,31].In our case,the p I of the mAb is between8.2and8.5,thus we aimed to impart positive charge to the pro-tein.There are various electrophoresis buffers available in the range from3.8to10.2,having different acidic–basic compo-nents[33].The pH of running buffer and stacking gel buffer is known to be an important nder and Wishart used native acidic gel electrophoresis with running gel buffer and stacking gel buffer pH as4.3and5.2,respectively,to sep-arate prion protein oligomers[34].Similarly,Heukeshoven and Dernick used a Tris-HC1/Tris-glycine as basic buffer and beta-alanine(pH4.6)as acidic buffer to develop a native hor-izontal ultrathin PAGE method for proteins under both basic and acidic conditions[35].Thus,for developing the N-PAGE protocol for mAb analysis,the pH of the running buffer,gel buffer,and sample buffer was kept below the p I of the pro-tein without addition of any dye so as to maintain the native structure[5].The pH range6–6.5was chosen,as the struc-tural changes are fully reversible in this range and thus,the native structure of the mAb can be maintained[34,36,37]. Recently,researchers have used150mM aminocaproic acid in buffers for separation of membrane protein complexes. Aminocaproic acid allowed the omission of salt that would otherwise impair electrophoresis[38].As the stability of mAb is known to decrease at high buffer molarities,the optimal buffer molarity has to be estimated[39,40].Based on the above-mentioned observations from litera-ture,scouting studies were performed to examine the various2166M.Pathak et al.Electrophoresis 2014,35,2163–2171Figure 1.Results from the screening study performed for creating an N-PAGE protocol for separation of aggregates for mAb products.(A)Plot comparing the number of bands predicted by the model against actual data.(B)List of the various factors contributing to the variability in the model in order of their impact.(C)Plots showing effect of running buffer concentration,running buffer pH,and concentration of aminocaproic acid on the number of bands.operating parameters and their ranges.The outcome is sum-marized in Table 1.Several parameters were fixed based on the scouting studies.These included the loading dye con-tent (30%sucrose with methyl green),sample concentration (0.2mg/mL),operating voltage (50V at 7mA/gel),tempera-ture (5–10°C),time (3.5–4h),and gel percentage (8%).Based on the results of the scouting studies,we con-cluded that the optimal protocol would need to address is-sues of product stability,resolution,and diffusion of bands.Parameters that affect product stability include the running buffer pH,running buffer molarity,aminocaproic acid con-centration in running buffer,and gel buffer molarity [41,42].Parameters that are known to affect resolution and diffusion of bands include gel content (acrylamide (%),bisacrylamide (%),and APS (%)).These studies were performed as Study 1and Study 2using the principles of DOE.Study 1focused on optimization of the running gel conditions and Study 2focused on optimization of the gel content.3.2Study 1:Optimization of the running gelconditionsIn this study,several parameters including the running buffer pH,running buffer molarity,aminocaproic acid concentra-tion in running buffer,and gel buffer molarity were exam-ined in the ranges listed in Table 1.About 8%of resolvinggel and 3.5%stacking gel were prepared from the stock so-lution of 29.2%acrylamide (14.6g in 50mL Milli-Q water)and 0.8%bisacrylamide (0.4g in 50mL of Milli-Q water).Furthermore,10%APS was freshly prepared each time with TEMED for the free-radical polymerization of acrylamide and bis-acrylamide.Cathode buffer (running buffer)contained aminocaproic acid [6].The number of bands was considered as the output re-sponse in this study.The results obtained were analyzed us-ing JMP R8(SAS Institute)and are shown in Fig.1.The resulting model had an R 2of 0.995and R 2-adjusted value of 0.990,indicating goodness of fit (Fig.1A).It is observed that the gel buffer does not seem to have much impact on the qual-ity of separation as measured by the number of visible bands (Fig.1B).The concentration of the aminocaproic acid,buffer concentration,and the running buffer pH had significant impact on the quality of separation.The latter two variables yielded a curved response with the optimal value at 0.14M of acetate–NaOH buffer,pH 5.5.Based on these results,the op-timal operating conditions were chosen as 0.14M acetic acid in 0.1M 6-aminocaproic acid (pH 5.5)as running buffer,15mM acetic acid–NaOH (pH 6)as gel buffer,loading dye containing 30%sucrose with methyl green,and 3.5%stacking gel with 8%resolving gel.Electrophoresis was performed at 7mA/gel (50V)at temperature between 5and 10°C for 3.5h.Electrophoresis2014,35,2163–2171Liquid Phase Separations2167parison of per-formance of the N-PAGE pro-tocol with the SEC-based separation for two different samples.(A)N-PAGE gel for sample 1.(B)Densitome-ter scan of the N-PAGE gel for sample 1.(C)SEC chro-matogram for sample 1.(D) N-PAGE gel for sample2.(E) SDS-PAGE gel for sample2.(F) Reducing PAGE gel for sample 2.(G)Densitometer scan of the N-PAGE gel for sample2.(H) SEC chromatogram for sam-ple2.(I)Comparison of the ag-gregate percentage measured by N-PAGE versus SEC.Along with N-PAGE,reducing(SDS+DTT)and nonre-ducing(SDS)PAGE were carried out for sample2.Reduc-ing PAGE gel showed two bands,one at25kDa and the other at50kDA(Fig.2F),while in the nonreducing gel,one prominent thick band was observed at150kDa and with two poorly separated,faint bands just above it(Fig.2E),indicat-ing presence of high molecular weight impurities(aggregate percentage ofß4.8).On the contrary,N-PAGE and SEC for sample2gave aggregate content of11.96and10.56,respec-tively(Fig.2D,G–I).The underperformance of the reducing PAGE occurs because in this method the sample is subjected to SDS and DTT.SDS being a chaotropic agent imparts nega-tive charge to the protein and causes inter-and intramolecular repulsion resulting in breakage of noncovalent interactions.DTT being a reducing agent causes cleavage of the disulfide bonds.Thus,both covalent and noncovalent aggregates get disintegrated during the reducing PAGE and only covalent aggregates are quantified in nonreducing PAGE[18,43].By comparing the aggregate percentage value in N-PAGE and nonreducing PAGE,it can be concluded that total aggregate in the sample is11.96%of which4.8%is formed due to covalent interactions and remaining are due to noncovalent interactions.To confirm sample stability during the run,pure mAb sample with0%aggregate(did contain charged variants)was run along with two samples with different aggregate content. The results are shown in Fig.2.It is observed that the two bands of sample1are properly separated using this N-PAGE2168M.Pathak et al.Electrophoresis2014,35,2163–2171Figure 3.Results from the DOE study performed for op-timization of the N-PAGE pro-tocol for separation of ag-gregates for mAb products. The various plots show the various process performance attributes predicted by the model against actual data. Also shown are the key factors that affect a given attribute.protocol and also the values of aggregate are comparable to the values obtained from SEC analysis(Fig.2A–C).How-ever,analysis of the second sample yielded different results (Fig.2D).Three bands of aggregates were observed along with an extra band in addition to the one corresponding to the monomer(lane1in Fig.2D).Pure mAb,acidic variant, and basic variants were also run in this gel(lanes2–4in Fig.2D).It can be concluded that in sample2,the multiple bands are seen(lane1in Fig.2D)due to the separation of basic variants in N-PAGE analysis.While this may be desir-able for analysis of charged variants,our present focus is only on analysis of aggregates,and hence we decided to develop a strategy to mask the charge effect so as to avoid any confusion for the analyst.This was the focus of Study2that is presented in the next section.Factors that were identified for Study2 included acrylamide(%),bisacrylamide(%),and APS(%).3.3Study2:Optimization of the gel contentGel percentage has been known to play an important role in separation of mAb aggregates.While the mesh formed by acrylamide and bis-acrylamide needs to be loose enough to allow differential migration of monomer and aggregate, if the mesh is too loose the resolution suffers from higher band diffusion[44,45].In this study,gel percentage was opti-mized using QbD approach[21].A two-level,three-parameter, full-factorial DOE with two center points was used to per-form experimentation in the ranges mentioned in Table1. The quality of the separation was assessed by monitoring the number of bands,diffusion of bands,and the error in the calculated aggregate percentage from N-PAGE runs.The error in aggregate percentage was calculated by subtract-ing the aggregate percentage measured by SEC from theElectrophoresis2014,35,2163–2171Liquid Phase Separations2169Figure parison of thefinal,optimized N-PAGE protocol with SEC analysis.(A)N-PAGE gel for sample4.(B)Densitometer scan for sample 4.(C)SEC chro-matogram for sample 4.(D and E)Comparison of the aggregate percentage measured by N-PAGE versus SEC for multiple samples.aggregate percent measured by N-PAGE.Figure3shows the outcome of the statistical analysis of the study.The R2and R2-adjusted values for the three models were satisfactory,indi-cating that most of the variability is explained by the proposed models.It is observed that the bisacrylamide percentage solely determines the number of bands,with the number of bands increasing with bisacrylamide percentage.Further-more,bisacrylamide percentage also has the most significant impact on the overall error in aggregate percentage,with the error decreasing with increasing bisacrylamide percentage. Thus,it can be concluded that a high bisacrylamide percent-age(in the range examined)is optimal for separation of ag-gregates by N-PAGE.After bisacrylamide percentage,acrylamide percentage emerged as the most significant variable.It is observed that the error percentage in aggregate decreases with increasing acrylamide percentage and also the diffusion decreases with increasing acrylamide percentage.Hence,a high acrylamide percentage(in the range examined)is also optimal for sep-aration of aggregates by N-PAGE.These observations are in agreement with the understanding that an increase in acry-lamide percentage and bisacrylamide percentage reduces the pore size of the gel,which in turn increasesfineness and resolution between the bands.Optimal pore size is essential for achieving satisfactory resolution between the monomer and aggregate bands.However,further increase in acry-lamide percentage and bisacrylamide percentage will result in2170M.Pathak et al.Electrophoresis2014,35,2163–2171overlapping of the two bands and poor separation.Finally, APS percentage had a comparably lower impact on separa-tion performance,but has linear negative effect on the over-all error in aggregate percentage.Thus,the APS percentage should be less(in the range examined).3.4Optimized N-PAGE protocolThefinal optimized protocol for N-PAGE involved running an8.75%gel with8.5%acrylamide and0.25%bisacrylamide with0.1%APS prepared in15mM acetate–NaOH gel buffer at pH6.The protocol uses0.14M acetate–NaOH as the anode buffer at pH5.5,and0.14M acetate–NaOH as the cathode buffer at pH5.5with0.1M aminocaproic acid. Sample-loading dye would contain30%sucrose with a tinch of methyl green as the tracking dye.Sample-loading concen-tration would be0.2mg/mL without salt and electrophoresis would be performed at7mA/gel(50V)at temperature be-tween5and10°C.3.5Comparison to SEC analysisThefinal N-PAGE protocol was compared to the traditional SEC analysis and the results are illustrated in Fig.4.It is seen that the separation of the monomer from the dimer is acceptable(Fig.4A)and also comparable to that of SEC (Fig.4B and C).Multiple samples with different aggre-gate content were analyzed with the developed protocol in triplicates and the results were found to be comparable to SEC and with low RMSD(Fig.4D).This indicates the reproducibil-ity of the proposed protocol.Finally,the aggregate percentage measured by N-PAGE was compared to SEC(Fig.4F),and the straight line passing through the0,0index demonstrates the comparability of the proposed protocol to SEC.The t-test was performed onfive different samples,each with triplicate run or more,to show comparison of samples analyzed by the two systems(Fig.4D).The calculated t value is less than the tabulated t value at p=0.05demonstrating comparability of the data.This clearly demonstrates the performance of the proposed protocol.4Concluding remarksA QbD-based approach has been demonstrated for creation and optimization of an N-PAGE-based protocol for separa-tion of aggregates of an mAb therapeutic product.The data presented in this study establishes N-PAGE as a suitable com-plimentary method to SEC and perhaps even an alternative to SEC.The authors have declared no conflict of interest.5References[1]James,K.,Bell,G.T.,J.Immunol.Methods1987,100,5–40.[2]Shukla,A.A.,Thommes,J.,Trends Biotechnol.2010,28,253–261.[3]Sommerfeld,S.,Strube,J.,Chem.Eng.Process.2005,44,1123–1137.[4]Strohl,W.R.,Knight,D.M.,Curr.Opin.Biotechnol.2009,20,668–672.[5]Low,D.,O’Leary,R.,Pujar,N.S.,J.Chromatogr.B2007,848,48–63.[6]Read,E.K.,Park,J.T.,Shah,R.B.,Riley,B.S.,Bror-son,K.A.,Rathore,A.S.,Biotechnol.Bioeng.2010,105, 276–284.[7]Read,E.K.,Shah,R.B.,Riley,B.S.,Park,J.T.,Bror-son,K.A.,Rathore,A.S.,Biotechnol.Bioeng.2010,105, 285–295.[8]Rathore,A.S.,Bhambure,R.,Ghare,V.,Anal.Bioanal.Chem.2010,398,137–154.[9]Rathore,A.S.,Joshi,V.,Yadav,N.,Biopharm Int.2013,26,40–45.[10]denEngelsman,J.,Garidel,P.,Smulders,R.,Koll,H.,Smith,B.,Bassarab,S.,Seidl,A.,Hainz,O.,Jiskoot,W., Pharm.Res.2011,28,920–933.[11]Arakawa,T.,Ejima,D.,Li,T.,Philo,J.S.,J.Pharm.Sci.2010,99,1674–1692.[12]Carpenter,J.F.,Randolph,T.W.,Jiskoot,W.,Crommelin,D.J.,Middaugh,C.R.,Winter,G.,J.Pharm.Sci.2010,99,2200–2208.[13]Rathore,A.S.,Trends Biotechnol.2009,27,546–553.[14]Rathore,A.S.,Winkle,H.,Nat.Biotechnol.2009,27,26.[15]ICH Harmonised Tripartite Guideline Q8(R1),Phar-maceutical development,International Conference on Harmonization of Technical Requirements for the Registration of Pharmaceuticals for Human Use, Geneva,Switzerland,2008.(/LOB/ media/MEDIA4986.pdf)[16]Myers,R.H.,Montgomery,D.C.,Anderson-Cook,C.M.,Response Surface Methodology:Process and Product Optimization using Designed Experiments,Wiley Inter-science,New Jersey2009.[17]Kumar,V.,Bhalla,A.,Rathore,A.S.,Biotechnol.Prog.2014,30,86–99.[18]Bade,P.,Kotu,S.P.,Rathore,A.S.,J.Sep.Sci.2012,35,3160–3169.[19]Hoek,P.V.,Harms,J.,Wang,X.,Rathore, A.S.(Eds.),Case Study on Definition of Design Space for a Microbial Fermentation Step,in Quality by Design for Biopharmaceuticals:Perspectives and Case Studies,Wiley Interscience,New Jersey2009, pp.85–109.[20]Ferreira,S.L.C.,Bruns,R.E.,da Silva,E.G.P.,dos San-tos,W.N.L.,Quintella,C.M.,David,J.M.,de Andrade, J.B.,Breitkreitz,M.C.,Jardim,I.C.S.F.,Neto,B.B.,J.Chromatogr.A2007,1158,2–14.[21]Pathak,M.,Chaudhary,N.,Rathore,A.S.,J.Pharm.Biomed.Anal.2014,92,119–126.[22]Vogt,F.G.,Kord,A.S.,J.Pharm.Sci.2011,100,797–812.[23]Oriandini,S.,Pinzauti,S.,Furlanetto,S.,Anal.Bioanal.Chem.2013,405,443–450.[24]Rozet,E.,Lebrun,P.,Hubert P.,Trends Anal.Chem.2013,157–167.。
analysis toolpak 用法 -回复

analysis toolpak 用法-回复使用Analysis ToolPak进行数据分析-解决问题的利器引言:在当今信息时代,数据扮演着越来越重要的角色。
从企业经营到科学研究,无处不体现着数据的重要性。
然而,大量的数据对于我们来说可能是一抹烦恼,如何从这堆数据中找到有价值的信息?这就需要我们借助于数据分析工具来完成。
而其中,Microsoft Excel中的Analysis ToolPak就是一个功能强大的工具,它能够帮助我们进行统计分析和数据建模,提供了许多强大的功能和工具,使我们的数据分析更加高效准确。
本文将带领您详细了解Analysis ToolPak的用法,并通过一系列的步骤回答如何使用它。
第一步:安装和激活Analysis ToolPak安装和激活Analysis ToolPak是使用它的第一步。
请注意,Analysis ToolPak是Microsoft Excel的一个附加组件,因此您需要确保它已经安装在您的计算机上。
打开Excel并点击"文件"菜单,然后选择"选项",在"Excel选项"对话框中打开"添加-Ins"选项卡,找到并选中Analysis ToolPak,然后点击"确认"按钮。
这样,您就成功地安装和激活了Analysis ToolPak。
Analysis ToolPak提供了许多常见的统计分析工具,下面我们将介绍其中的几个。
1. 描述性统计:选择一列或多列数据,然后点击"数据"选项卡中的"数据分析"按钮。
在出现的对话框中,选择"描述性统计",然后点击"确认"按钮。
在新的对话框中,选择要分析的数据范围,并选择要生成结果的位置。
点击"确定",就可以生成描述性统计数据,包括平均值、中位数、标准差等。
ESI.ProCAST.2014.5.Win64铸造工艺仿真软件

RecurDyn.v8R3.SP1.Win64-ISO 1DVD
RecurDyn.v8R2.SP1.1.Win32_64-ISO 2DVD(韩国FunctionBay公司开发出的新一代多体系统动力学仿真软件。它采用相对坐标系
运动方程理论和完全递归算法,非常适合于求解大规模的多体系统动力学问题)
Algor.Designcheck.v23.1 1CD
Algor.Designcheck.v23.1.X64 1CD
Algor Pipepak v23.0.SP1 1CD(管线设计分析软件)
Algor.PipeCheck.v23.0.SP1.x64 1CD
Algor.FEA.v23.SP2 1CD
Medina Abaqus Addon v6.7-2 1CD
Medina Abaqus Addon v6.7-2 X86 & X64 1CDs
·砂型铸造,金属型铸造及倾斜浇注
·熔模铸造,壳模铸造
·消失模铸造,离心铸造
·连续和半连续铸造;
Flow Science产品:
FLOW-3D.v10.1.1.Win32_64.&.Linux32_64 2CD(完全解密,压铸模拟软件)
FLOW-3D CAST Advanced v3.5.2.2 Win32_64-ISO 1CD(铸造模拟软件)
LS-Dyna 算法基础和使用方法(中文)
LS-Dyna 960版关键词用户手册
LS-Dyna 中文培训教程(功能介绍、文件系统、单元介绍、Part使用、材料模式)
LS-Dyna 教程ppt文件
LS-Dyna 培训手册
Ls-Dyna 教材
Algor产品:
文献分析工具endnote

特点(一):收录最重要的学术期刊 特点(二):收录论文的参考文献并索引
化学信息学(曹郁教授)
SCI简介
科学引文索引
Science Citation Index Expanded™ ,SCI
社会科学引文索引
Social Science Citation Index®,SSCI
艺术人文引文索引
化学信息学(曹郁教授)
工程索引_EI
印刷版:The Engineering Index,EI 光盘:Ei Compendex 网络版:Ei Compendex Web 有关工程技术领域的综合性文摘型检索工具
美国信息工程公司编辑出版,印刷版创刊于1884年,几 乎覆盖了所有工程技术领域50多个国家,20多个语 种.数据来源于5100 种工程类期刊、会议论文集和 技术报告. 在EI的检索平台上,可以同时检索INSPEC的数据
考资料写下来,这样要比查找到主题索引后再
列出关键词容易得多。”
化学信息学(曹郁教授)
Hale Waihona Puke SCI简介《科学引文索引》(Science Citation Index,简称
SCI)由美国科学情报研究所(Institute for Scientific Information, ISI)编辑出版。
SCI收录全世界出版的数、理、化、农、林、医、生命 科学、天文、地理、材料、工程技术等自然科学等核心 期刊。 印刷版、光盘版、网络版
是有关国际上物理学、电气与电子工程、计算机与控制学科领 域的权威检索工具
化学信息学(曹郁教授)
Science Citation Index(SCI) 科学引文索引
化学信息学(曹郁教授)
cad系列序列号密钥

796F1 Autodesk Infrastructure Map Server 2014
797F1 Autodesk Inventor Professional 2014
798F1 Autodesk Inventor OEM 2014
667F1 Autodesk Simulation Multiphysics 2014
669F1 Autodesk Simulation Mechanical 2014
675F1 Autodesk Opticore Studio Professional 2014
692F1 Autodesk Real-Time Ray Tracing Cluster 2014
661F1 Autodesk 3ds Max Entertainment Creation Suite Standard 2014
662F1 Autodesk Softimage Entertainment Creation Suite 2014
666F1 Autodesk Inventor Publisher 2014
570F1 Autodesk Simulation Moldflow Adviser Standard 2014
571F1 Autodesk Simulation Moldflow Adviser Premium 2014
572F1 Autodesk Simulation Moldflow Adviser Ultimate 2014
827F1 AutoCAD LT for Mac 2014
LR-analysis中文使用说明

/passport-registration.html
4
目录
欢迎使用本指南 .......................................................................................15 本指南的组成结构 .................................................................................... 16 本指南的目标读者 .................................................................................... 16 LoadRunner 文档.....................................................................................17 其他联机资源 ...........................................................................................18
/passport-registration.html 或单击 HP Passport 登录页面上的 New users - please register (新用户 - 请注册)链接。 如果您订阅相应的产品支持服务,还会收到更新版本或新版本。请与 HP 销售代表联系了解详情。
3
支持
您可以访问 HP Software 支持网站: /go/hpsoftwaresupport
TA Universal Analysis 入门指南

保存结果和程序会话 ........................................................................... 24
退出程序 .................................................................................... 24
启动 Universal Analysis
要启动 Universal Analysis 程序:
EAC常见问题分析PPT学习教案

问题2:登陆EAC后提示“客户端控件打印异常”
解决方案: 第一步:确定是否已安装了客户端,是否在安装过程中添加可信站点。添加 方法:开始-程序-长城软件“设置EAC服务器地址为可信站点 ”。 第二步:打开IE 浏览器点击工具 “Internet选项 ”,安全 —可信站点“站 点”,将EAC 访问的IP 地址输入在“将该网站添加到区域 ”点击添加 。 第三步:如果添加了之后还不可以,那有可能是在安装的过程中杀毒软件阻止 了某些控件的运行,需要重新安装客户端。建议在安装客户端的过程中暂时关 闭杀毒软件,安装完成后在开启。
第8页/共23页
问题7:为什么电子回执导进EAC报没有此案件
解决方案: 第一步:确定这个新申请是否从EAC 导出的;
第二步:请求书中的内部编码自己是否修改过。
XSQ(
系
自
统
己
初 始 的 案)来自新 申 请定 义 的 案
卷
卷
编
编
号
号
第9页/共23页
问题8:新案质检的时候提示说明书与请求书发明名称不一致
第6页/共23页
问题5:撰写官文的时候,点击撰写,报脚本错误
解决方案: 打开IE 浏览器在工具-Internet选项-高级,允许活动内容允许的 全部打上对 钩,禁用脚本调试的对钩都去掉。
第7页/共23页
问题6:任务监控界面或者是我的任务界面,在树状图按某项 查询, 比如“未处理” 出现不了结果
解决方案: 需要跟技术支持联系修改 原因是在填写备注信息的时候 用了回车键 (备注信息一定不能用回车!!!)
岗位职责三工作总结项目运维项目实施银青高速视频监控东毛隧道停车场项目全面实施ip设置贵州独平高速项目全面实施监控室机柜布线四心得体会在这段时间的学习过程中我对部门很多产品从零学起刚到公司的时候感觉压力很大经过这些时间的认真学习和实际操作调整心态现已完全能融入公司的各项岗位职责和管理制度中
symchk.exe的用法 -回复
symchk.exe的用法-回复symchk.exe是Windows操作系统中一个非常有用的工具,用于验证和修复动态链接库(DLL)和可执行文件(EXE)的符号。
它可以帮助开发人员和系统管理员在调试和排除系统问题时定位错误,并提供正确的符号文件,以便更好地理解和分析代码。
在本文中,我将一步一步地介绍symchk.exe的用法,并说明如何使用该工具来进行符号验证和修复。
首先,让我们了解一下符号文件的概念。
在编译源代码时,编译器会生成一个二进制文件,其中包含编译后的机器代码。
同时,编译器会生成一个符号文件,其中包含了代码中变量和函数的名称、类型信息和调用堆栈等。
符号文件通常具有.PDB(Program Database)扩展名,并与二进制文件相对应。
这些符号文件对于调试和分析代码非常重要,因为它们提供了有关二进制文件内部结构和数据的详细信息。
一、安装Debugging Tools for Windows要使用symchk.exe工具,我们首先需要安装“Debugging Tools for Windows”。
这是一组开发工具,可以在Windows系统上进行高级调试和诊断。
您可以在微软的官方网站上找到Debugging Tools for Windows的安装程序,并按照说明进行安装。
安装完成后,我们可以在系统的安装目录下找到symchk.exe工具的可执行文件。
二、使用symchk.exe进行符号验证1. 打开命令提示符或PowerShell窗口,并导航到包含symchk.exe文件的目录。
2. 使用以下命令来验证一个二进制文件的符号:shellsymchk.exe <binary_path> /s <symbol_path> /v`<binary_path>`是要验证的二进制文件的路径,`<symbol_path>`是包含符号文件的路径。
`/v`选项用于输出验证过程的详细信息。
- 1、下载文档前请自行甄别文档内容的完整性,平台不提供额外的编辑、内容补充、找答案等附加服务。
- 2、"仅部分预览"的文档,不可在线预览部分如存在完整性等问题,可反馈申请退款(可完整预览的文档不适用该条件!)。
- 3、如文档侵犯您的权益,请联系客服反馈,我们会尽快为您处理(人工客服工作时间:9:00-18:30)。
Winofex’s analysis of market conditionas of 17th Nov 2014Winofex 对外汇市场走势分析 2014年11月17日Last week’s global market: 上周全球市场分析:Due to settlement of main issues in the United States such as theend of tapering policy and off-year election, it seemed like it was giving a steady influence to the bullish market last week. Consumers’sectors such as Wall Mart had a good performance and the remarkable increase in single day sales in China had aroused expectations for end of year shopping season and hence gave stability in the market. However, the increased volatility in the currency and the commodity market influenced the changes in the flow of various different market sectors. Particularly, due to theslide in the oil prices, the energy sector decreased greatly.美国当局的重大事件,如年底的政改与大选,貌似给上周稳健上行的市场都带来了沉重的打击。
对于销售行来讲,比如沃尔玛在中国市场每日平均营业额高升,引起市场对年底购物狂潮期间的销售额颇具信心,因此市场走势将相对稳定。
但是货币及商品市场的波动却影响了很多周边市场。
特别是在油价突然下滑后,能源商品的价格也跟着大量下滑。
Drop in oil prices caused downswing of crude oil export countries such as South America, affected companies performances in Europe and stressing issues in Ukraine had caused the market to shrink. 油价的突变使原油输出国南美,欧洲和乌克兰等受油价影响的国家市场收缩。
When it became official that Japan might delay the point where they will increase the consumption tax, the market increased by 3.62%. Also, before the enforcement of the cross trading policy of Shanghai and Hong Kong, it showed 2.51% and 2.11% increase in Shanghai market and Hong Kong’s Hang Seng stock price index each. 官方定价使日本将不得不延迟增加消费税,日本股市增值3.62%。
而且在上海和香港制定强制交叉盘政策之前,上海股市和香港股市分别显示2.51%和2.11%的增值。
Besides, there were increase of 1.33% in the UK, 1.21% in the US Nasdaq, 0.79% in Taiwan, 0.64% in India’s market each. There were also increase of 0.35% in DOW Jones index and 0.39% in the S&P500 index. In other words, countries which had issues like Japan and China was ranked the top and the other countries increased about 1%. However, some Europe countries such as Russia, Germany, Italy dropped by 0.80%, 0.42%, 0.68% each. In addition, Brazil dropped by 2.73% as a result of slide in oil prices as South America countries such as Brazil and Peru has high level of dependence on exporting raw materials. 此外,英国股市增值1.33%,美国纳斯达克增值1.21%,台湾增值0.79%,印度增值0.64%。
道琼指数增长0.35%,标准普尔500指数增长0.39%。
也就是说中国,日本被列为前锋,其他国家增值了1%。
但欧洲国家,如俄罗斯,德国,意大利等国家却都分别下跌了0.80%,0.42%,0.68%。
以原材料出口为主要经济支柱的南美国家,如巴西,秘鲁因油价大幅下滑,市场下跌2.73%。
Last week’s forex market flow: 上周外汇市场分析:Stable market was expected but volatility in exchange rate was recorded as issues in Japan such as delaying the plan of increasing their consumption tax and early general election affected the market. Due to this, US dollar turned bullish and other currencies bearish. At the beginning of the week, the Japanese Yen dropped below 115 Yen but when issue such as increasing consumption tax had arisen, the market closed with 116.28 Yen and hence had shown similar flow in the interim.Eventually, the USDJPY increased by 1.53%, GBP by 1.38%, RUB 1.30%, BRL 1.27% and KRW 1.12%. 外汇市场预期将相对稳定,但日本外汇市场将受到汇率波动,政改及早期大选的影响。
因此,美元相对其他国货币走强。
上周初期,日元下跌并低于115,但因增加消费税的消息发出,市场在116.28 结束交易。
最终,USDJPY 汇率增长1.53%,GBP 增长1.38%,RUB增长1.30%,BRL增长1.27% ,KRW增长1.12%。
Last week’s metal flow: 上周金属市场分析:The rate of the gold showed fluctuations in a steady tone due to the rise in USD throughout the week. In other words, despite the rising USD, it didn’t expand the falling rate and had maintained a steady tone. However, when Barack Obama and the Republican Party had a dispute over the Keystone XL pipeline, it increased more than 2% due to the political chaos. Similarly, copper showed fluctuations in a steady tone without major difference, but despite the shrinking industrial production flow in China, it increased by 1.69% as the USD turned bearish on Friday. Even though the Chinese government increased the purchase amount of copper this year due to the price fall, issues such as reduced demand is restricting the rise of the copper price. Likewise, the gold demand in China and India is not increasing. The bullish effect of the USD and reduce in demand is still existing in the product market. In a weekly basis, the gold increased by 1.53%, silver by 3.76%, copper by 0.26%, white gold by 0.38% and the overall flow of the metal market was satisfactory. 黄金在美金增值期间,在一个稳定的价格区域内波动,而没有继续下跌。
但在奥巴马和共和党之间对梯形XL管道发生争议后,金价上升了2%。
相同的,尽管中国工业萎缩,铜价也在稳定价区内浮动,但美金走势转向的星期五,铜价上升了1.69%。
虽然中国政府在铜价低迷期间购买了大量铜,但是市场对铜的低需求量限制了铜价的上升。
相同的,中国和印度对黄金的需求量也没有上升。
美元走强和需求量的影响仍存在商品市场。