On Persistence in Mutual Fund Performance
Journal of Business Research(这篇也很短,早知道翻译这篇了)
Management structure and the performance of funds of mutual fundsWilliam J.Bertin,Laurie Prather ⁎Bond University,Gold Coast,QLD 4229Australiaa b s t r a c ta r t i c l e i n f o Article history:Received 1February 2008Received in revised form 1November 2008Accepted 1November 2008Keywords:Fund of funds Mutual fundsFund performanceManagement structureA rapidly growing mutual fund category is funds of funds (FOFs)which invest in other mutual funds instead of individual securities.This study reports on FOFs'characteristics and performance relative to traditional equity mutual funds and finds that FOFs compare favorably.FOFs with identi fied managers outperform their unidenti fied counterparts,and FOFs that invest in-family outperform both traditional equity funds and those FOFs investing out-of-family.Finally,replicating FOFs'holdings can be prohibitively expensive since they commonly hold funds with high minimum initial investments,closed funds and/or funds that are restricted to a particular investor type.©2008Elsevier Inc.All rights reserved.1.IntroductionThe mutual fund industry is experiencing rapid growth in a category of mutual funds known as funds of funds (FOFs).These funds distinguish themselves by investing in shares of other mutual funds rather than buying individual securities,thus providing a unique opportunity to examine several relevant issues regarding mutual fund management,services and performance.This paper analyzes the characteristics of FOFs to determine whether or not they provide signi ficant investor bene fits including enhanced performance due to management expertise and/or better risk return trade-offs than traditional mutual funds.Further discussion addresses the feasibility and cost of replicating a FOFs'portfolio strategy.In addition to offering the same advantages as traditional mutual funds,FOFs offer instant diversi fication across different fund compa-nies and managers.FOFs expand investment opportunities by providing a mechanism for investing in those traditional funds with high minimum initial investments and funds that are closed,as well as funds that might otherwise be restricted to a speci fic investor type (i.e.,institutional investors).They also enable investors to access foreign funds,and by choosing FOFs the investor easily resolves the individual fund selection dilemma.Alternatively,FOFs potentially involve certain costs and create other disadvantages to the investing public.For instance,the process of investing in FOFs necessarily adds another layer of fees and expenses,and with traditional mutual funds already under fire for excessive costs,FOFs may be seen as prohibitively expensive.Additionally,the diversi fication advantage across fund companies and managers diminishes if FOFs invest in only one fund or within one family of funds.In such cases FOFs serve as a marketing tool for the fund family thus proliferating their offerings in an attempt to keep business in-house.This paper addresses these competing arguments by analyzing the performance and other basic characteristics of FOFs.In doing so,the first items presented are the overall descriptive statistics for a sample of FOFs in comparison to traditional mutual funds and a summary of the relevant risk-adjusted performance data for these funds.Further analyses within the FOFs'sample consider the impact of diversi fica-tion,management expertise and expenses on FOFs'performance.Given the rapid growth and potential bene fits for this category of funds,this study may shed some light on whether FOFs'popularity is justi fied.The results suggest that FOFs do offer diversi fication bene fits to investors at both the fund company and manager level,and FOFs perform as well as,and in some cases better than traditional equity mutual funds with similar investment objectives.Management expertise in fluences performance where FOFs with identi fied team managers perform better than those FOFs with unidenti fied teams.In addition,in-family FOFs outperform those investing out-of-family as well as traditional equity funds.Finally,based on the inaccessibility of closed funds and funds with large minimum initial investments,FOFs provide an investment vehicle which cannot be replicated.The remainder of the paper proceeds as follows.Section 2provides a review of the literature and a discussion of growth trends in the mutual fund market.Section 3presents the descriptive statistics of the FOFs'sample and two different equity fund samples.Section 4de fines the measures used for evaluating the impact of management and the effect of in-family versus out-of-family diversi fication on fund performance.Section 5presents a summary of results and conclusions.Journal of Business Research 62(2009)1364–1369⁎Corresponding author.E-mail addresses:wbertin@.au (W.J.Bertin),lprather@.au (L.Prather).0148-2963/$–see front matter ©2008Elsevier Inc.All rights reserved.doi:10.1016/j.jbusres.2008.11.003Contents lists available at ScienceDirectJournal of Business Research2.Literature review and market trendsPrior literature on traditional mutual fund performance is quite extensive beginning with the early works of Treynor (1965),Sharpe (1966)and Jensen (1968),which suggest that mutual funds do not beat the market.In providing a summary of the early performance related mutual fund literature,Ippolito (1993),by contrast,reaches the opposite conclusion.More recent studies examine performance by analyzing the impact of costs (fees,turnover and expense ratios)and other mutual fund characteristics with findings that frequently contradict one another (see for example,Carhart,1997;Grinblatt and Titman,1994;Hooks,1996;Malkiel,1993,1995;Payne et al.,1999;Wermers,2000).To explain these contradictory results,Brown et al.(1992),Carhart (1997),Elton et al.(1996,1993),Golec (1996),Grinblatt and Titman (1989,1994),Lehman and Modest (1987)and Malkiel (1995)attribute abnormal performance and persistence to benchmark error and/or the overstatement of returns resulting from survivorship bias.The latest studies including,Bär et al.(2006),Cohen et al.(2005),Friesen and Sapp (2007),Gaspar et al.(2006)and Kacperczyk et al.(2005)continue the performance discussion by considering a variety of fund and management speci fic features such as industry concen-tration,management structure,family cross-subsidization,mimicking top performing funds and market timing.Brown et al.(2004)examine funds of hedge funds citing some of the same potential advantages/disadvantages as noted above for FOFs.They find that the additional fees including high incentive fees leave funds of hedge funds with worse performance records than individual hedge funds.Although their hedge fund study relates,no prior mutual fund studies have systematically analyzed FOFs (funds that invest in traditional mutual funds).In addition to being the first examination of FOFs,this paper contributes to the existing literature by comparing FOFs'performance relative to a sample of traditional equity mutual funds as well as to the overall market.Finally,the study analyzes FOFs'performance in terms of fund management structure and provides a systematic approach for selecting the best FOFs.2.1.FOFs growth trendsThe Morningstar Principia Mutual Funds Advanced (MS)reports performance information for 55multi-class domestic and interna-tional equity FOFs.These funds were offered by 17fund families and accounted for approximately $15billion in mutual fund assets.At the end of 2003,the number of FOFs had grown to 526offerings from 67fund families with FOFs'assets totalling over $85billion representing a 28.6%annual growth rate in FOFs'assets over this seven-year period.In comparison,the number of multi-class equity funds across the same investment objective categories as the FOFs increased from 2138to 6492(with assets increasing from $1.14trillion to $2.50trillion)over the 1996–2003period.This increase represents an 11.87%annual growth rate in assets,or less than half that of the FOFs over the same period.In comparison to similarly classi fied equity funds,FOFs in 1996accounts for approximately 1.3%of total mutual fund assets,but by the end of 2003this proportion had grown to 3.4%.Several factors may be responsible for such an increase including performance and perfor-mance-related demand among investors resulting in an increased flow of funds.Additionally,as mutual fund companies attempt to meet increased demand,they may initiate new or expand upon existing FOFs'offerings (or in some cases proliferate their offerings to compete for fund flows).Finally,unrelated to performance,FOFs'growth and popularity may simply be due to the fact that they offer (or are perceived as offering)something different than the standard mutual fund.3.Descriptive statisticsTo analyze fund composition,performance and cost structure,this study compares the sample FOFs to two groups of equity funds including a broad group of equity funds and a subset of these funds with the same investment objectives as the sample of FOFs.Table 1provides descriptive information for the FOFs and the equity fund samples.Focusing strictly on the FOFs,first in 1996andTable 1Descriptive statistics for FOFs and traditional equity funds.Fund of funds Equity funds Equity fund subset 199620031996200319962003Total assets$14.65(bil)$85.32(bil)$1.70(tril)$3.56(tril)$1.14(tril)$2.50(tril)Number of funds a(55)(526)(4103)(11,011)(2138)(6492)Portfolio characteristics Med.mkt.cap.(mil)$9008$14,823$7762$18,785$10,355$23,957Total holdings (#)bNMF 18139165132170Min.purchase (median)$1000$1000$1000$1000$1000$1000Min.purchase $3063$231,415$169,349$916,783$201,902$921,190Performance PE25.8017.8025.4019.6025.2019.40σ(3-year)(%)8.5112.3812.4119.5611.4918.173-year mean return c 11.49−0.3012.90−2.0114.64−3.50MS rating (3-year) 3.00 3.26 3.03 2.96 3.15 2.97Cost structureFront-end fees (%)0.49 1.01 1.46 1.11 1.44 1.11Deferred load (%)0.380.860.880.970.830.9612b-1fees (%)0.250.330.370.420.350.41Expense ratio (%) 1.160.82 1.54 1.58 1.40 1.45Turnover (%)72498412190170Portfolio characteristics,performance and cost variables in the years 1996and 2003for three groups of mutual funds:funds of funds (FOFs),equity funds and a subset of equity funds with the same investment objectives as the FOFs (figures are averages unless otherwise noted).aThese numbers consider all multi-class funds within each group.The results presented in the remainder of the paper consider only those funds in each group with distinct investment portfolios.Thus,the samples used in the performance comparisons consist of 172FOFs and 2369traditional equity funds.bFor FOFs,the median number of funds held;for equity funds,the average number of securities held.cFor all funds,returns are net of asset-based expenses and fees.For the FOFs,the returns are also net of loads assessed by the traditional funds.1365W.J.Bertin,L.Prather /Journal of Business Research 62(2009)1364–1369then again in 2003,growth is apparent from the number of fund offerings (nearly a ten-fold increase)and the increase in total assets.Further,this growth occurs despite increasing loads.In comparison to the broad equity fund group and the equity subset,FOFs exhibit several distinguishing features.For example,Table 1shows that FOFs are substantially smaller than their equity counterparts,which on a percentage basis could contribute to their larger annual total asset growth (approximately 29%annually compared to the 11%for equity funds and 12%for the equity subset over 1996to 2003).In addition to performance as a driver for this growth differential,increased demand for and flows into FOFs are also contributing factors.Table 1further suggests that FOFs hold more funds that invest in smaller companies than the other two equity groups,as illustrated by the lower average median market capitaliza-tion measure.Finally,the average minimum initial purchase is signi ficantly smaller for FOFs indicating that the two equity groups are comprised of funds requiring larger initial investments,perhaps targeting institutional investors.In measuring FOFs'performance,returns are net of not only their own asset-based expenses and fees,but also all expenses,fees,and loads charged by the individual funds in their portfolio.Table 1indicates that FOFs on average carry a higher Morningstar rating,which is consistent with FOFs average three-year mean return exceeding that of the equity or the equity subset group of funds.These higher returns are accompanied by lower volatility suggesting that FOFs'risk-adjusted performance exceeds that of both traditional equity fund groups.As the final section of Table 1indicates,the cost structure of FOFs has changed dramatically since 1996.For example,by 2003front-end fees and deferred loads had more than doubled while 12b-1fees increased by 32%.Despite these increases in fees and loads,FOFs'expenses are still below those of the two equity groups.In addition,the expense ratio and turnover for FOFs decrease from 1.16%to 0.82%and 72%to 49%,respectively,from 1996to 2003.These figures are well below the expense ratio and turnover figures for the traditional equity fund groups,which have experienced increases in both of these cost categories over the same period.To further explore these cost/performance observations,the paper next provides a detailed statistical analysis for both the FOFs'group and the equity subset.4.Performance evaluation 4.1.Performance analysisThe FOFs and the equity funds comparisons are based on two common risk-adjusted performance measures,which include Jensen's alpha (α)and the Sharpe ratio.These measures are estimated for each fund over the period 1996–2003.While the equity fund subset permits the matching of the fund samples based on investment objective,we also control for allocation-based performance differ-ences by estimating modi fied Jensen's alphas using a multi-factor version of the capital asset pricing model.Similar to Elton et al.(2003),the multi-benchmark model includes three different equity market factors and one bond market factor;large and small capitalization stock indexes,a foreign stock index and a bond index.These benchmarks capture the impact of the funds'differential holdings of large-cap,small-cap,foreign and bond investments.The model appears as follows:r pt −r ft =α+βpL r Lt −r ft ðÞ+βpS r St −r ft ðÞ+βpF r Ft −r ft ðÞ+βpB r Bt −r ft ðÞ+e pt ð1Þwhere,r pt is the return on the fund being evaluated in period t ,r ft is the return on the riskless asset in period t (3-month T-bill),βpjis the sensitivity to benchmark j ,r jt is the return on the benchmark in period t ,L is a large stock index (S&P 500),S is a small stock index (S&P 600),F is a foreign stock index (MSCI World),B is a bond index (Lehman Brother's LT Govt/Corp.Bond),εptis the random error.Jensen's alpha the intercept term from the model,provides a measure of abnormal performance.The four indexes (S&P 500,S&P600,MSCI World and Lehman Brother's LT Government/Corporate Bond)are mutually exclusive in their constituents and cover the most commonly used benchmarks,thus minimizing the potential for benchmark error.The Sharpe ratio measures risk-adjusted performance using a benchmark based on the ex-post capital market line and is calculated as follows:SR p =ar p −ar f=σp ð2Þwhere,ar paverage monthly fund return(FOFs returns are net of asset-based expenses and fees,and all realized expenses,fees,and loads of the individual funds in their portfolio.The equity fund subset returns are net of all asset-based expenses and fees).ar f average monthly risk-free return (3-month T-Bill)σpstandard deviation of the monthly returns for the fund.This ratio is calculated for each fund over the period 1996–2003.For performance comparisons,the equity funds sample is the subset group of all equity funds with the same investment objectives (designated by Morningstar )as the FOFs'sample.Therefore,the investment objectives for both the FOFs and equity subset samples include the categories of aggressive growth,growth,growth and income,asset allocation and balanced.Both of the above performance measures are calculated for each fund with a performance history of at least one year.The final sample consists of 172FOFs and 2369equity funds for a total of 2541funds holding distinct investment portfolios.Table 2reports the average alphas and coef ficient estimates of the multi-benchmark model and the average Sharpe ratios for FOFs and the equity fund subset.The table also includes test statistics forTable 2Performance analysis.FOFsEquity Fund Subset t -statistic α−0.0004+−0.0008+1.15βpL 0.38+0.62+−9.74⁎⁎⁎βpS 0.19+0.28+−0.66βpB 0.09+0.02+8.65⁎⁎⁎βpF0.13+0.04+9.32⁎⁎⁎Sharpe ratio 0.08+0.07+ 2.49⁎⁎⁎N1722369This table includes Jensen's alphas and beta estimates for the multi-benchmark model and the Sharpe ratios for the 172FOFs and the subset of 2369equity funds from 1996–2003.For the multi-benchmark model,the estimates for the betas are denoted as:L for the large stock index,S for the small stock index,B for the bond index and F for the foreign stock index.Also included is the Wilcoxon two-sample test statistic comparing the mean coef ficient estimates of the FOFs sample and the equity fund subset.Modi fied Jensen's α:r pt −r ft =α+βpL (r Lt −r ft )+βpS (r St −r ft )+βpB (r Bt −r ft )+βpF (r Ft −r ft )+εpt .Sharpe ratio:SR p =(ar p −ar f )/σp .Coef ficients different from zero:+++1%signi ficance,++5%signi ficance,and +10%signi ficance.Coef ficients different across fund samples:⁎⁎⁎1%signi ficance level,⁎⁎5%signi ficance level,and ⁎10%signi ficance level.1366W.J.Bertin,L.Prather /Journal of Business Research 62(2009)1364–1369comparing the two samples.The alpha estimates for both samples are negative and significantly different from zero indicating that on average neither group outperforms the overall market.Still the magnitude of the equity funds subset negative alpha is twice that of the FOFs'sample and a comparison of the Sharpe ratios suggests that the FOFs outperforms the equity funds subset,and this difference is statistically significant.Thisfinding is in contrast to Brown et al.'s (2004)study where the funds of hedge funds significantly under-performed the individual hedge funds,which may be explained by the fact that FOFs are not subject to the incentive fees that significantly erode the returns for the funds of hedge funds.An analysis of non-overlapping subperiods representing up-market and down-market periods provides results consistent with the overall results.Additionally,separate regression tests indicate that the multi-benchmark model adequately captures potential allocation-based performance differentials.Finally,after considering the impact of fund specific variables including turnover,expense ratio and fund age on performance,FOFs still compare favorably to the equity fund subset.(The results of the robustness tests not included here are available upon request).4.2.Management structure and performanceAdvocates of FOFs hype their ability to provide access to top quality managers and to achieve risk reduction through fund manager and fund company diversification.The potential advantage of manage-ment diversification is obvious assuming that managers'performance records are not perfectly correlated.Finance theory would suggest that by holding a portfolio of funds with different managers,poor performance by one manager can be offset by another's good performance.Along these lines,Fant and O'Neal(1999)document substantial risk reduction benefits associated with diversification across fund managers.Although a similar diversification argument can be made at the fund company level,holding different companies' funds may also expand the range of investment opportunities. Additionally,FOFs that invest across different fund companies may provide monitoring services.Agency theory further suggests that FOFs' managers,in their capacity as monitors,reduce potential inefficiencies arising from agency problems between fund managers and fund owners.Thus,agency costs(the added layer of fees and expenses borne by investors)compensate FOFs'managers for the oversight function they provide.Given the relative performance of FOFs,the next empirical tests examine the potential sources of gains,such as diversification(fund companies/managers)and/or management expertise(monitoring/ informational advantages).As previously reported in Table1,the lower standard deviation of returns for FOFs implies diversification benefits.Since the sample FOFs'holdings are highly diversified(FOFs hold an average of18traditional funds,which in turn hold an average of170individual securities),and Eling and Schuhmacher(2007) document Sharpe ratio rankings of fund performance to be virtually identical to a wide array of other performance measures,the following analyses focus on Sharpe ratio comparisons within the FOFs'sample.The MS database provides information regarding management structure for160of172sample FOFs thus allowing funds to be categorized as follows:funds managed by an individual,funds managed by an identified team(typically fewer than4individuals), or unidentified,team-managed funds.In the FOFs'sample the management structure for the160funds consists of60funds being individually managed,32managed by identified teams and68having unidentified team-managers.If performance is purely due to diversification benefits,then management structure should have no impact on the results.Alternatively,if management expertise adds value,then performance differentials should be evident.To evaluate the performance for the three different groupings based upon their management structures,Table3uses a matrix format to report the Sharpe ratios and significance tests for comparisons of management structure within the FOFs'sample.The Sharpe ratios and the number of funds within each management category are listed along the diagonals of the table,and the Wilcoxon signed-rank test statistics for comparing managers are listed on the off-diagonals.The average monthly ratio is highest for the funds managed by individuals and lowest for the unidentified team-managed funds.The ratios for the two groups of funds with identified managers(individual and team)are0.0751and0.0484,respectively, and the null hypothesis of equal means cannot be rejected.The Sharpe ratio for the unidentified team-managed funds however,is0.0202, resulting in the rejection of the null hypothesis of equal means when comparing this group to the identified team-managed group.These results suggest that benefits extend beyond simple manager diversification or company diversification as better performance is achieved by those funds that specifically designate and identify their managers.Since identified teams may be directly responsible for the FOFs'performance,their reputations are at stake.This responsibility provides the motivation to use their management expertise in selecting fund managers and fund companies,as well as evaluating the economy,industry andfirms in which the traditional funds invest. Thesefindings indicate enhanced performance for identified team managers who provide more than naïve diversification.In contrast, fund companies that offer funds with unidentified managers may be attempting to capitalize on the demand for FOFs by creating a product that simply combines their existing funds.In doing so,these FOFs merely offer naïve diversification with no specialized management expertise,and their performance is significantly worse.Baer et al. (2006)find a negative relationship between team management and fund performance,however,they do not differentiate between identified and unidentified teams.In contrast,sample stratification based on identification of team managers allows us to capture a differential impact for those FOFs putting their names and reputations on the line versus those that are merely creating a popular product.To address the benefits of diversification across fund companies, management expertise,and/or monitoring that reduces the potential agency conflict,the following discussion and analysis compares theTable3Performance measures for FOFs as a function of management structure.Individual Identified Team Man.Unidentified Team Man.Individual Manager 0.0751z=1.0288z=0.9812(60)p-value=(0.1518)p-value=(0.1632)Identified Team Management 0.0484z=2.3091(32)p-value=(0.0105)Unidentified Team Management 0.0202 (68)For the sample of160FOFs based on management structure(individual,identified team and unidentified team),the average monthly Sharpe ratios are reported along the diagonals with the number of funds in each group in parentheses.The off-diagonals include the Wilcoxon z-statistics and p-values used to compare differences in the Sharpe ratios for individual versus identified team,individual versus unidentified team and identified team versus unidentified team.Table4Fund company diversification and performance evaluation.ANOVA teststatisticsWilcoxon teststatisticsSharpe ratio St.dev.z p-value F p-value N In-family FOFs0.11080.31 4.16b0.0001 1.81370.0349135 Out-of-family FOFs−0.00400.10−0.23550.815334 This table includes average monthly Sharpe ratios,standard deviations and ANOVA test statistics.The Wilcoxon signed rank test statistics are also included to compare the performance of135FOFs that invest in-family to that of the34FOFs that invest out-of-family.1367W.J.Bertin,L.Prather/Journal of Business Research62(2009)1364–1369performance of FOFs that invest in-family to those that invest out-of-family.While FOFs investing out-of-family can offer diversification at both the manager level and fund company level,funds investing in-family can only offer diversification at the fund manager level.The data clearly demonstrates that FOFs offer diversification across mutual fund managers as only three cases exist where a FOFs'manager has invested in traditional funds solely under his/her own management. Diversification across different fund companies,however,is less apparent as135of the FOFs invest in-family and only34invest outside of the fund family.To analyze these two distinct groups of FOFs,Table4presents their average monthly Sharpe ratios for performance comparisons.The average monthly ratio for the in-family group is0.1108,which is significantly different from zero and larger than that of the out-of-family group at−0.0040.According to the Wilcoxon signed-rank test, the performance differential between the two groups is statistically significant indicating the desirability of FOFs that invest in-family.Although thisfinding seems contrary to the notion of diversifica-tion and monitoring benefits,the dominance of in-family performance may result from asymmetric information regarding in-house fund managers.FOFs that invest in-house may be privy to inside information that would not be available to the FOFs'managers investing out-of-family.Thus the diversification and monitoring benefits of investing out-of-family are more than offset by the losses associated with asymmetric information,although in most cases investing out-of-family is a function of limited in-house availability of mutual funds.For example,in the case of the out-of-family sample, families only provide on average19traditional equity fund offerings compared to120offerings for in-family FOFs.A further consideration is that within a family,the traditional equity funds may be holding similar portfolios thus creating heavier weightings in certain industries or individual securities when compared to a FOF investing out of family.This investment overlap may be contributing to the superior performance of the in-family group,thus further supporting the informational advantage of FOFs investing in-family.In-family FOFs also have the support of larger fund complexes, such that investing in-house could provide certain cost advantages not available to outsiders,including full or partial waiver of expenses,fees and loads.Fund companies may offer such waivers as a marketing tool to encourage predictableflows into the traditional funds within the family.Additionally,fund companies that offerfinancial advisory services mayfind efficiencies by putting smaller investors into FOFs to reduce costs associated with reviewing and rebalancing portfolios.Thus,holding funds through a FOFs'investment can actually reduce overall costs,as Table1 shows FOFs'average cost structure is lower than that of traditional equity funds.Thisfinding is consistent with the results of Gaspar et al.(2006),which document cross-fund subsidization within mutual fund families.The next analysis considers whether management structure has an impact on performance between in-family and out-of-family FOFs. The identification of management structure is possible for129of the 135in-family FOFs and31of the34in the out-of-family group.Table5 contains the Sharpe ratios for both groups classified by individual managers,identified team managers and unidentified team managers. For the in-family FOFs,individual,identified-team,and unidentified team managed funds have ratios of0.1067,0.0416and0.0338, respectively.While this performance measure for the individually managed funds is larger than the other groups,the null hypothesis of equal means cannot be rejected.These results suggest that in-family versus out-of-family investment decisions are more important than management structure in determining FOFs'performance.For the31 funds that invest out-of-family,15are individually managed,five have team-identified structures and11are unidentified team managed with Sharpe ratios of−0.0196,0.0854and−0.0503,respectively. Thus,the FOFs that invest out-of-family with unidentified team management structures exhibit the worst performance.Afinal analysis compares the performance of the FOFs to the equity fund subset.Table6reports the Sharpe ratios and Jensen's alphas for both the in-family and out-of-family FOFs and also for the subset of equity funds.The comparisons provide evidence that the in-family FOFs not only keep pace with the traditional funds,but that they also exhibit superior performance(approximately10%signifi-cance level).By contrast the Sharpe ratio for the out-of-family FOFs is significantly below that of the traditional funds.These results sup-port the priorfindings that those FOFs investing in-family are the preferred choice not only among FOFs,but also among mutual funds in general.Based on the superior performance of in-family FOFs,the logical extension is to increase returns by replicating a FOFs'portfolio with a hypothetical“do-it-yourself”strategy in an attempt to avoid the additional layer of fees and expenses.In theory,replication is possible given that Morningstar provides complete listings of mutual funds'Table5Performance comparisons:in-family versus out-of-family FOFs and management structure.Sharpe ratio St.dev.t p-value NPanel A:129in-family FOFsIndividual managers(IND)0.10670.26 2.800.007645Identified team-managed(IDT)0.04160.11 2.040.051827Unidentified team-managed(UNT)0.03380.13 1.920.060257Wilcoxon signed-rank tests H0:SR IND=SR IDT z=0.0582H0:SR IND=SR UNT z=1.0244H0:SR IDT=SR UNT z=1.1302H a:SR IND N SR IDT p-value=0.4768H a:SR IND N SR UNT p-value=0.1528H a:SR IDT N SR UNT p-value=0.1292Panel B:31out-of-family FOFsIndividual managers(IND)−0.01960.10−0.79710.438715Identified team-managed(IDT)0.08540.03 5.75310.00455Unidentified team-managed(UNT)−0.05030.10−1.68940.122011This table reports Sharpe ratios,standard deviations and test statistics for comparing the impact of management structure(individual,identified team,unidentified team)on FOFs that invest in-family and FOFs that invest out-of-family.Table6Performance comparisons for FOFs and the equity fund subset.Equity fundFOFs Subset Wilcoxon z p-valueIn-familySharpe ratio0.11080.04100.96670.1668Jensen's alpha−0.0003−0.0008 1.24370.1068Out-of-familySharpe ratio0.00400.0410 2.17890.0147Jensen's alpha−0.0008−0.00080.04020.4840This table compares the performance of the in-family and out-of-family FOFs'performance to that of the equity fund subset using both Sharpe ratio and Jensen'salpha as performance measures and also reports test statistics.1368W.J.Bertin,L.Prather/Journal of Business Research62(2009)1364–1369。
基金管理外文文献翻译
基金管理外文文献翻译(含:英文原文及中文译文)文献出处:英文原文Is Money Really “Smart”? New Evidence on the Relation Between Mutual Fund Flows, Manager Behavior, and Performance PersistenceRuss WermersMutual fund returns strongly persist over multi-year periods—that is the central finding of this paper. Further, consumer and fund manager behavior both play a large role in explaining these longterm continuation patterns—consumers invest heavily in last-year’s winning funds, and managers of these winners invest these inflows in momentum stocks to continue to outperform other funds for at least two years following the ranking year. By contrast, managers of losing funds appear reluctant to sell their losing stocks to finance the purchase of new momentum stocks, perhaps due to a disposition effect. Thus, momentum continues to separate winning from losing managers for a much longer period than indicated by prior studies.Even more surprising is that persistence in winning fund returns is not entirely explained by momentum—we find strong evidence that flow-related buying, especially among growth-oriented funds, pushes up stock prices. Specifically, stocks that winning funds purchase in responseto persistent flows have returns that beat their size, book-to-market, and momentum benchmarks by two to three percent per year over a four-year period. Cross-sectional regressions indicate that these abnormal returns are strongly related to fund inflows, but not to the past performance of the funds—thus, casting some doubt on prior findings of persistent manager talent in picking stocks. Finally, at the style-adjusted net returns level, we find no persistence, consistent with the results of prior studies. On balance, we confirm that money is smart in chasing winning managers, but that a “copycat” s trategy of mimicking winning fund stock trades to take advantage of flow-related returns appears to be the smartest strategy.Eighty-eight million individuals now hold investments in U.S. mutual funds, with over 90 percent of the value of these investments being held in actively managed funds. Further, actively managed equity funds gain the lion’s share of consumer inflows—flows of net new money to equity funds (inflows minus outflows) totalled $309 billion in 2000, pushing the aggregate value of investments held by these funds to almost $4 trillion at year-end 2000. While the majority of individual investors apparently believe in the virtues of active management in general, many appear to hold even stronger beliefs concerning the talents of subgroups of fund managers—they appear to believe that, among the field of active managers, superior managers exist that can “beat the market” for long periods of time. In particular, Morningstar and Lipper compete vigorouslyfor the attention of these true believers by providing regular fund performance rankings, while popular publications such as Money Magazine routinely profile “star” mutual fund managers. In addition, investor dollars, while not very quick to abandon past losing funds, aggressively chase past winners (see, for example, Sirri and Tufano (1998)).Are these “performance-chasers” wasting their money and time, or is money “smart”? Several past papers have attempted to tackle this issue, with somewhat differing results. For example, Grinblatt and Titman (1989a, 1993) find that some mutual fund managers are able to consistently earn positive abnormal returns before fees and expenses, while Brown and Goetzmann (1995; BG) attribute persistence to inferior funds consistently earning negative abnormal returns. Gruber (1996) and Zheng (1999) examine persistence from the viewpoint of consumer money flows to funds, and find that money is “smart”—that is, money flows disproportionately to funds exhibiting superior future returns. However, the exact source of the smart money effect remains a puzzle—does smart money capture manager talent or, perhaps, simply momentum in stock returns?1 More recently, Carhart (1997) examines the persistence in net returns of U.S. mutual funds, controlling for the continuation attributable to priced equity styles (see, for example, Fama and French (1992, 1993, 1996), Jegadeesh and Titman (1993), Daniel andTitman (1997), and Moskowitz and Grinblatt (1999)). Carhart finds little evidence of superior funds that consistently outperform their style benchmarks—specifically, Carhart finds that funds in the highest net return decile (of the CRSP mutual fund database) during one year beat funds in the lowest decile by about 3.5 percent during the following year, almost all due to the one-year momentum effect documented by Jegadeesh and Titman (1993) and to the unexplained poor performance of funds in the lowest prior-year return decile.2 Thus, Carhart (1997) suggests that money is not very smart. Recent studies find somewhat more promising results than Carhart (1997). Chen, Jegadeesh, and Wermers (1999) find that stocks most actively purchased by funds beat those most actively sold by over two percent per year, while Bollen and Busse (2002) find evidence of persistence in quarterly fund performance. Wermers (2000) finds that, although the average style-adjusted net return of the average mutual fund is negative (consistent with Carhart’s study), high-turnover funds exhibit a net return that is significantly higher than low-turnover funds. In addition, these highturnover funds pick stocks well enough to cover their costs, even adjusting for style-based returns. This finding suggests that fund managers who trade more frequently have persistent stockpicking talents. All of these papers provide a more favorable view of the average actively managed fund than prior research, although none focus on the persistence issue with portfolio holdings data.This study examines the mutual fund persistence issue using both portfolio holdings and net returns data, allowing a more complete analysis of the issue than past studies. With these data, we develop measures that allow us to examine the roles of consumer inflows and fund manager behavior in the persistence of fund performance. Specifically, we decompose the returns and costs of each mutual fund into that attributable to (1) manager skills in picking stocks having returns that beat their style-based benchmarks (selectivity), (2) returns that are attributable to the characteristics (or style) of stockholdings, (3) trading costs, (4) expenses, and (5) costs that are associated with the daily liquidity offered by funds to the investing public (as documented by Edelen (1999)). Further, we construct holdings-based measures of momentum-investing behavior by the fund managers. Together, these measures allow an examination of the relation between flows, manager behavior, and performance persistence.In related work, Sirri and Tufano (1998) find that consumer flows react about as strongly to one-year lagged net returns as to any other fund characteristic. In addition, the model of Lynch and Musto (2002) predicts that performance repeats among winners (but not losers), while the model of Berk and Green (2002) predicts no persistence (or weak persistence) as consumer flows compete away any managerial talent. Consistent with Sirri and Tufano (1998), and to test the competing viewpoints of Lynchand Musto (2002) and Berk and Green (2002), we sort funds on their one-year lagged net returns for most tests in this paper. While other ways of sorting funds are attempted.DataWe merge two major mutual fund databases for our analysis of mutual fund performance. Details on the process of merging these databases is available in Wermers (2000). The first database contains quarterly portfolio holdings for all U.S. equity mutual funds existing at any time between January 1, 1975 and December 31, 1994; these data were purchased from Thomson/CDA of Rockville, Maryland. The CDA dataset lists the equity portion of each fund’s holdings (i.e., the shareholdings of each stock held by that fund) along with a listing of the total net assets under management and the self-declared investment objective at the beginning of each calendar quarter. CDA began collecting investment-objective information on June 30, 1980; we supplement these data with hand-collected investment objective data from January 1, 1975.The second mutual fund database is available from the Center for Research in Security Prices (CRSP) and is used by Carhart (1997). The CRSP database contains monthly data on net returns, as well as annual data on portfolio turnover and expense ratios for all mutual funds existing at any time between January 1, 1962 and December 31, 2000. Further details on the CRSP mutual fund database are available from CRSP.These two databases were merged to provide a complete record of the stockholdings of a given fund, along with the fund’s turnover, expense ratio, net returns, investment objective, and total net assets under management during the entire time that the fund existed during our the period of 1975 to 1994 (inclusive).5 Finally, stock prices and returns were obtained from the CRSP stock files.Performance-Decomposition Methodology In this study, we use several measures that quantify the ability of a mutual fund manager to choose stocks, as well as to generate superior performance at the net return level. These measures, in general, decompose the return of the stocks held by a mutual fund into several components in order to both benchmark the stock portfolio and to provide a performance attribution for the fund. The measures used to decompose fund returns include:1. the portfolio-weighted return on stocks currently held by the fund, in excess of returns (during the same time period) on matched control portfolios having the same style characteristics (selectivity)2. the portfolio-weighted return on control portfolios having the same characteristics as stocks currently held by the fund, in excess of time-series average returns on those control portfolios (style timing)3. the time-series average returns on control portfolios having the same characteristics as stocks currently held (style-based returns)4. the execution costs incurred by the fund5. the expense ratio charged by the fund6. the net returns to investors in the fund, in excess of the returns to an appropriate benchmark portfolio.The first three components of performance, which decompose the return on the stocks held by a given mutual fund before any trading costs or expenses are considered, are briefly described next. We estimate the execution costs of each mutual fund during each quarter by applying recent research on institutional trading costs to our stockholdings data—we also describe this procedure below. Data on expense ratios and net returns are obtained directly from the merged mutual fund database. Finally, we describe the Carhart (1997) regression-based performance measure, which we use to benchmark-adjust net returns.The Ferson-Schadt Measure Ferson and Schadt (FS, 1996) develop a conditional performance measure at the net returns level. In essence, this measure identifies a fund manager as providing value if the manager provides excess net returns that are significantly higher than the fund’s matched factor benchmarks, both unconditional and conditional. The conditional benchmarks control for any predictability of the factor return premia that is due to evolving public information. Managers, therefore, are only labeled as superior if they possess superior private information on stock prices, and not if they change factor loadings over time in response to public information. FS also find that these conditionalbenchmarks help to control for the response of consumer cashflows to mutual funds. For example, when public information indicates that the market return will be unusually high, consumers invest unusually high amounts of cash into mutual funds, which reduces the performance measure, “alpha,” from an unconditional model (such as the Carhart model). This reduction in alpha occurs because the unconditional model does not control for the negative market timing induced by the flows. Edelen (1999) provides further evidence of a negative impact of flows on measured fund performance. Using the FS model mitigates this flow-timing effect. The version of the FS model used in this paper starts with the unconditional Carhart four-factor model and adds a market factor that is conditioned on the five FS economic variables.Decomposing the Persistence in Mutual Fund ReturnsSirri and Tufano (1998) find that consumer flows react about as strongly to one-year lagged net returns as to any other fund characteristic. In addition, the model of Lynch and Musto (2002) predicts that performance repeats among winners (but not losers), while the model of Berk and Green (2002) predicts no persistence (or weak persistence) as consumer flows compete away any managerial talent. Consistent with Sirri and Tufano (1998), and to test the competing viewpoints of Lynch and Musto (2002) and Berk and Green (2002), we sort funds on their one-year lagged net returns for the majority of tests in the remainder ofthis paper. When appropriate, we provide results for other sorting approaches as well.中文译文资金真的是“聪明”吗?关于共同基金流动,经理行为和绩效持续性关系的新证据作者:Russ Wermers此外,基金的复苏在多年期间强烈持续- 这是本文的核心发现。
猎头必知的专业术语

猎头必知的专业术语人力资源部门:1.主管类:VP of huma n resources 人力总监huma n resources man ager 人力资源经理HR assista nt 人事助理executive recruiter 主管人员staffi ng man ager 人力经理HR director 人力主管pers onnel supervisor 人事主任director of recruit ing 招聘主管huma n resource specialist 人力资源专家HR ben efits an alyst 人员价值分析HRIS analyst 人力资源系统分析员2.职责分类:薪资福利:payroll supervisor 工资管理人payroll and ben efits administratio n wage and salary admi nistratio nben efits coordi nator compe nsati on an alyst variable compe nsati on 招聘及评估:工资福利管理工资薪水管理员工福利协调员薪酬分析员可变薪酬recruiter 人力资源招聘人员recruitme nt and selecti on 招聘和甄选trai ning and developme nt 培训与发展performa nee evaluati on and review 绩效评估和回顾employee orie ntati on 雇员上岗弓丨导career developme nt 职业生涯发展job descripti on desig n 工作描述设计管理及政策:huma n resources admi nistrati on 人力资源管理HR policies and procedures 人力政策和程序HRIS人力资源系统employme nt law 雇佣法labor relati ons 劳动关系labor laws 劳动法legal complia nee 法律顾问discipli nary and grieva nee procedures 雇员投诉及维持序in dustrial safety programs 产业安全保障human resources coord inator 人力协调员pers onnel represe ntative 员工代表employee relati ons 员工关系pers onnel admi nistratio n 员工管理orga ni zati onal developme nt 组织开发process ree ngin eeri ng业务流程重组财务部门(Finance Professionals ):1.主管级别:VP of finan ce=CFO 财务总监intern ati onal con troller 国际监管assista nt con troller 监管助理portfolio man ager 组合基金经理finance man ager 财政经理payroll man ager 工资经理finan cial assista nt 财务助理director of in vestor relati ons purchas ing man ager 采购经理2.职责分类:主要人员:staff acco untant 人员会计师cost acco untant 成本会计师CPA注册会计师CFA特许金融分析师MBA工商管理硕士finan cial report ing an alystfinan cial an alyst 财政分析员finan cial pla nner 财政预算员acco unts payable clerk 应付帐款文员acco unts receivable clerk 应收帐款文员collecti ons specialist收款专员mutual fund an alyst 共同基金分析员credit an alyst 信用分析员payroll clerk 工资员工bookkeeper 档案管理员procureme nt specialist 采购专员gen eral ledger 总帐会计管理及法规:GAAF公认会计准则ben efits admi nistrati on 禾U益管理portfolio man ageme nt 投资组合管理P&L management 损益管理budget man ageme nt 预算管理cash-flow man ageme nt 现金流管理treasurer 资金调拨投资者关系经理财政分析报告员operati ng and worki ng capital 营运和流动资本fixed asset acco un ti ng 固定资产清算finan cial projecti ons 财政支出bus in ess process ree ngin eeri ng 企业流程再造value-added an alysis 附加价值分析risk man ageme nt 风险处理audit ing and complia nee 审记mergers and acquisiti ons 购并与整合bus in ess valuati ons 商业评估trial bala nee 试算表finan cial stateme nts 财务报表expe nse an alysis 费用分析tax report ing 税报告tax pla nning 税计戈Upayroll 薪资账册Bank recon ciliati ons 乍艮行调和cross-f un cti onal team leadership 跨团队领导finan cial and strategic pla nning 财务战略规戈U Hyperion 财务系统data warehouse report ing 数据库报告MS Excel 微软Excel软件SAP德国SAP软件公司spreadsheets 电子数据表行政部门(Administration/Support ):1.管理级别:office man ager 办公室经理service man ager 服务部经理admi nistrative assista nt 行政助理office assista nt 办公室助理executive secretary 执行秘书secretary 秘书2.职责分类:主要员工:customer service represe ntative 客户服务代表data en try clerk 数据录入员gen eral office clerk 办公室文员front desk receptio nist 柜台接待人员switchboard operator 接线员mailroom clerk 邮件收发员returns clerk 信息反馈员process ing clerk 事件处理员executive assista nt 执行售货员管理及职责分类:office support, 办公室支持customer support 客户支持eve nt pla nning 活动策戈Umeet ing pla nning 会议策戈Uscheduli ng 行程安排word process ing 文档处理ben efits admi ni strati on 财务利益管理acco unts payable 可付帐户acco unts receivable 可接受帐户in voices 开发票office man ageme nt 办公室管理docume nt preparati on 文件准备inven tory con trol 库存管理project man ageme nt 计戈U管理shipp ing and distributi on 运送和分配purchas ing 购买facilities maintenance 设备维护ven dor/c on tractor relati ons 厂商/ 承包商关系prese ntati ons 自我介绍spreadsheets 电子数据表database man ageme nt 数据库管理multili ne phones 多线电话switchboards 电话接线Windows NT/98/95 微软Windows操作系统NT/98/95MS Office (Word, Excel, PowerPoint, Access) 微软O, (Word, Excel, PowerPo int, Access)销售部门:1.主管级别:VP of sales 销售总监sales executive 销售经理sales engin eer 销售工程师sales support man ager 销售支持经理territory man ager 地域经理district sales man ager 地区销售经理regi onal sales man ager 区域销售经理e-bus in ess sales man ager 电子商务经理cha nnel sales man ager 渠道销售经理director of sales 销售主管2.职责分类:主要人员:sales represe ntative 销售代表sales professi onal 专业营销acco unt man ager 客户经理acco unt executive 客户主任customer service 客户服务customer relati ons 客户关系clie nt relati ons 客户关系territory sales represe ntative 地域销售代表in vestme nt represe ntative 投资代表manu facturer represe ntative 厂商代表medical sales represe ntative 医疗销售代表主要职责:outside sales 夕卜部销售in side sales 内部销售tech ni cal sales 技术销售relati on ship sell ing 关系销售relati on ship sales 关系销售con sultative sales 咨询式销售cha nnel sales 渠道销售pharmaceutical sales 医药销售IT sales 信息销售territory expa nsion 地域扩展sales expa nsion 销售扩展solution selli ng 解决方案销售meeti ng and exceedi ng sales quotas 满足和超过销售配B2B/B2C 商家对商家/客户对客户relati on ship buildi ng 人际创建product market ing 产品市场n egotiati ng and clos ing 谈判和完成交易lead gen erati on 潜在顾客开发流程comm uni cati on skills 交际技巧in terpers onal skills 人际交往技巧new bus in ess developme nt 新业务拓展sales prese ntati ons 销售简报PowerPoint 微软办公软件-幻灯片技术质量专业用语QCC Quality Con trol Circle 品質圈PDCA Pl CheckActio n計劃執行檢查總結DCC delivery control cen ter 交貨管制中心3C : Computer電腦類產品Con sumer electro nics 消費性電子產品Comm uni cati on 通訊類產品3T STRATEGY Time to market 及時切入生產Time to volume 及時大量生產Time to money 及時大量交貨FOUR CONTROL Y STEM 大管制系統Engin eeri ng con trol system 工程管制系統Quality control system 品質管制系統Manu facturi ng con trol system 生產管制系統Man ageme nt con trol system 經營管制系統7S: Classification 整理(sorting, organization)-seirRegulation 整頓(arrangement, tidiness)-seiton Clea nli ness 清掃(sweep ing, purity)-seisoConservation 清[吉(cleaning, cleanliness)-seiktsu Culture 教養(discipline)-shitsukeSave節約Safety安全。
Can Mutual Fund Stars Really Pick Stocks- New Evidence from a Bootstrap Analysis
Can Mutual Fund“Stars”Really Pick Stocks?New Evidence from a Bootstrap AnalysisROBERT KOSOWSKI,ALLAN TIMMERMANN,RUSS WERMERS,andHAL WHITE*ABSTRACTWe apply a new bootstrap statistical technique to examine the performance of the U.S.open-end,domestic equity mutual fund industry over the1975to2002period.A bootstrap approach isnecessary because the cross-section of mutual fund alphas has a complex nonnormal distributiondue to heterogeneous risk-taking by funds as well as nonnormalities in individual fund alphadistributions.Our bootstrap approach uncoversfindings that differ from many past studies.Specifically,wefind that a sizable minority of managers pick stocks well enough to more thancover their costs.Moreover,the superior alphas of these managers persist.*Kosowski is from Imperial College,Timmermann and White are from the University of California,San Diego,and Wermers is from the University of Maryland at College Park.We thank an anonymous referee for many insightful comments.Also,we thank Wayne Ferson,Will Goetzmann,Rick Green,Andrew Metrick,and participants at the2001 CEPR/JFI“Institutional Investors and Financial Markets:New Frontiers”symposium at INSEAD(especially Peter Bossaerts,the discussant),the2001European meeting of the Financial Management Association in Paris(especially Matt Morey,the discussant),the2001Western Finance Association annual meetings in Tucson,Arizona(especially David Hsieh,the discussant),the2002American Finance Association annual meetings in Atlanta,Georgia(especially Kent Daniel,the discussant),the Empirical Finance Conference at the London School of Economics(especially Greg Connor,the discussant),and workshop participants at the University of California(San Diego),Humboldt-Universit¨a t zu Berlin,Imperial College(London),and the University of Pennsylvania.Was Peter Lynch,former manager of the Fidelity Magellan fund,a“star”stockpicker,or was he simply endowed with stellar luck?The popular press seems to assume that Mr.Lynch’s fund performed well due to his unusual acumen in identifying underpriced stocks.In addition,Marcus (1990)concludes that the prolonged superior performance of the Magellan fund is difficult to explain as a purely random outcome,that is,a case in which Mr.Lynch and the other Magellan managers have no true stockpicking skills and are merely the luckiest of a large group of fund managers.More recently,the Schroder Ultra Fund topped thefield of6,000funds(across all investment objective categories)with a return of107%per year over the three years ending in2001.This fund closed to new investors in1998due to overwhelming demand,presumably because investors credited the fund manager as having extraordinary skills.Recent research documents that subgroups of fund managers have superior stockpicking skills, even though most prior studies conclude that the average mutual fund underperforms its bench-marks,net of costs.1For example,Chen,Jegadeesh,and Wermers(2000)examine the stockholdings and active trades of mutual funds andfind that growth-oriented funds have unique skills in iden-tifying underpriced large-capitalization growth stocks.Furthermore,Wermers(2000)finds that high-turnover mutual funds hold stocks that substantially beat the Standard and Poor’s500index over the1975to1994period.The apparent superior performance of a small group of funds such as Magellan or the Schroder Ultra Fund raises the question of whether such performance is credible evidence of genuine stock-picking skills,or whether it simply reflects the extraordinary luck of a few individual fund managers. Given hundreds of new funds are launched every year,and by January2005,over4,500equity mu-tual funds existed in the United States(holding assets valued at almost$4.4trillion),it is natural to expect that some funds will outperform market indexes by a large amount simply by chance. However,past studies of mutual fund performance do not explicitly recognize and model the role of luck in performance outcomes.Indeed,to a large extent,the literature on performance persistence focuses on measuring out-of-sample performance to control for luck.These models discount the possibility that luck can also persist.This paper conducts thefirst comprehensive examination of mutual fund performance(“alpha”) that explicitly controls for luck without imposing an ex ante parametric distribution from which fund returns are assumed to be drawn.Specifically,we apply several different bootstrap approaches to analyze the significance of the alphas of extreme funds,that is,funds with large,positive es-timated alphas.In employing the bootstrap to analyze the significance of alpha estimates,we explicitly model and control for the expected idiosyncratic variation in mutual fund returns.As Horowitz(2003)emphasizes,in Monte Carlo experiments the bootstrap can“spectacularly”reduce the difference between true and nominal probabilities of correctly rejecting a given null hypothesis (in our context,that no superior fund managers exist).Furthermore,given the intractability of parametrically modelling the joint distribution of mutual fund alphas across several hundred funds, most of which are very sparsely overlapping,the bootstrap is a very attractive approach to use in analyzing a cross-section of ranked mutual funds.The questions this paper asks can be stated very simply:With mutual fund alphas that deviate significantly from normality,how many funds from a large group would we expect to exhibit high alphas simply due to luck,and,how does thisfigure compare to the number we actually observe? To address these questions,we apply our bootstrap technique to the monthly net returns of the universe of U.S.open-end,domestic equity funds during the1975to2002period–one of the largest panels of fund returns ever analyzed.Across a wide array of performance measurement models, our bootstrap tests consistently indicate that the large positive alphas of the top10%of funds, net of costs,are extremely unlikely to arise solely due to sampling variability(luck).This result obtains when we apply the bootstrap to the cross-sectional distribution of fund alphas,when we apply it to the cross-sectional distribution of the t-statistics of fund alphas,as well as when we apply it under several extensions that we employ.2Our tests also show strong evidence of mutual funds with negative and significant alphas,controlling for luck.To illustrate the focus of our paper,suppose that we are told that a particular fund has an alpha of10%per year over afive-year period.Prima facie,this is an extremely impressive performance record.However,if this fund is the best performer among a group of1,000funds,then its alpha may not appear to be so impressive.Further,when outlier funds are selected from such an ex post ranking of a large cross-section,the separation of luck from skill becomes extremely sensitive to the assumed joint distribution from which the fund alphas are drawn.Any such analysis must account for nonnormality in this distribution,which,as we will show,can result from(1)heterogenous risk-taking across funds and(2)nonnormally distributed individual fund alphas.To address the aforementioned questions,we apply the bootstrap to the monthly returns of the 1,788mutual funds in our sample that exist for at leastfive years.The results show that,by luck alone,nine funds would be expected to exhibit an estimated alpha greater than10%per year(netof costs)over(at least)afive-year period.In reality,29funds exceed this level of alpha.As our analysis will show,this is sufficient,statistically,to provide overwhelming evidence that some fund managers have superior talent in picking stocks.Overall,our results provide compelling evidence that,net of all expenses and costs(except load fees and taxes),the superior alphas of star mutual fund managers survive and are not an artifact of luck.The key to our study is the bootstrap analysis,which allows us to precisely separate luck from skill in the complicated nonnormal cross-section of ranked mutual fund alphas.The above-mentioned bootstrap results correspond to net-of-cost performance.When we repeat our tests at the pre-cost level,ranking domestic equity mutual funds using the stockholdings-level performance measure of Daniel,Grinblatt,Titman,and Wermers(1997),wefind that various highly ranked funds exhibit levels of pre-cost performance that are similar,but slightly higher than their net-of-cost performance;however,almost all low-ranked funds exhibit insignificant pre-cost performance.Thus,much of the aforementioned variation in the cross-section of highly ranked fund net-of-cost performance is due to differences in skill in choosing stocks,not to differences in expenses or trade costs.However,variation across low-ranked funds is mainly due to differences in costs,as these managers exhibit no skills.Thesefindings are noteworthy in that they suggest active management skills generate not only superior cost efficiencies but also superior fund performance. That is,while most funds cannot compensate for their expenses and trade costs,a subgroup of funds exhibits stockpicking skills that more than compensate for such costs.Further bootstrap results indicate that superior performance obtains mainly among growth-oriented funds.This result supports prior evidence at the stockholdings level that indicates that the average manager of a growth-oriented fund can pick stocks that beat their benchmarks,while the average manager of an income-oriented fund cannot(Chen,Jegadeesh,and Wermers(2000)). Ourfindings indicate that even seemingly well-performing income fund managers are merely lucky. In addition,wefind stronger evidence of superior fund management during thefirst half of our sample period;after1990,we must look further to the extreme right tail of the alpha distribution tofind superior managers(i.e.,managers who are not simply lucky).Thus,the huge growth in new funds over the past decade has apparently been driven by a growth in the number of active managers without talent,who often appear in the right tail by chance alone.3 One may wonder whether our results are of economic significance,since our main evidence of superior performance occurs in the top10%of alpha-ranked funds.For example,if the abovebootstrap-based evidence of skill corresponds largely to small mutual funds,then our results may not have significant implications for the average investor in actively managed mutual funds.To address this issue,we measure economic impact by examining the difference in value-added between all funds that exhibit a certain alpha(including lucky and skilled funds)and those funds that exhibit the same alpha by luck alone;this difference measures skill-based value-added.We estimate that active management by funds that exceed an alpha of4%per year(through skill alone)generates about $1.2billion per year in wealth,that is,in excess of benchmark returns,expenses,and trading costs. Thus,subgroups of funds that possess skill add significantly to the wealth of fund shareholders. Note that a similar computation shows that underperforming mutual funds destroy at least$1.5 billion per year in investor wealth.Perhaps the strongest motivation for employing the bootstrap is illustrated by our tests of performance persistence,since most investors look at past performance to infer the future.Here,we focus on reconstructing tests of persistence similar to those used by Carhart(1997),while applying the bootstrap instead of the standard parametric t-tests used by Carhart and others.Notably,our findings overturn some important and widely cited results from Carhart’s paper.Specifically,we find significant persistence in net return alphas(using bootstrapped p-values)for the top decile (and,sometimes,top two deciles)of managers,using several different past alpha ranking periods.Why does the cross-sectional bootstrap yield a substantially different inference regarding high-and low-alpha funds,relative to the often-used p-values of individual fund alphas in these regions? First,our bootstrap formally models the cross-sectional nature of ex post sorts of funds by building the empirical joint distribution of their alphas.This helps in capturing unknown forms of het-eroskedasticity and cross-fund correlations in returns.Further,and as might be expected,higher moments play an important role in the explanation.Indeed,we reject normality for about half of our individual fund alphas,and this translates to nonnormalities in the cross-section of fund alphas. However,and perhaps more surprisingly,we alsofind that clustering in idiosyncratic risk-taking among funds also induces important nonnormalities in the cross-section of alphas.Specifically,we find large cross-sectional variations in the idiosyncratic risks funds take,with clusters of high-and low-risk funds,perhaps due to the risk-shifting of Chevalier and Ellison(1997).In cases in which risk-taking varies substantially,such as among the high-alpha growth funds or the top Carhart-ranked funds mentioned above,the empirical distribution(bootstrap)uncovers thinner tails in the cross-section of fund alphas than that imposed by assuming a parametric normal distribution be-cause of the resulting mixture of individual fund alpha distributions with heterogeneous variances. That is,the presence of clusters of high-risk and low-risk mutual funds(even when individual fund alphas are normally distributed),can create a cross-sectional distribution of alphas that has thin tails relative to a normal distribution,leading to underrejection of the null of no performance in the absence of the bootstrap.In other cases,such as the high-alpha income-oriented funds also noted above,less clustered(more uniformly distributed)risk-taking across funds obtains.The re-sulting cross-section of alphas exhibits thick tails,leading to overrejection of the null(without the bootstrap).Thus,heterogeneous risk-taking among funds,as well as higher moments in individual fund alphas,may induce thin-or thick-tailed cross-sectional alpha distributions,or even tails that are thinner at some percentile points,and thicker at others.It is important to note that ranking funds by their alpha t-statistic controls for differences in risk-taking across funds.That is,the cross-section of fund t-statistics remains normally distributed in the presence of funds with normally distributed alphas,but with different levels of idiosyncratic risk.Nevertheless,the higher moments that wefind in individual fund alphas(i.e.,skewness and kurtosis)result in a cross-section of t-statistics that remains distinctly nonnormal.Indeed,wefind that the bootstrap remains crucial in inference tests when analyzing the cross-section of t-statistics. Thus,our bootstrap provides improved inference in identifying funds with significant skills,because of(1)differential risk-taking among funds and(2)nonnormalities in individual fund alphas.In summary,when we account for the complex distribution of cross-sectional alphas,we confirm that superior managers with persistent talent do exist among growth-oriented funds,and that the bootstrap is crucial to uncovering the significance of such talent.Our results are also interesting in light of the model of Berk and Green(2004),who predict that net return persistence is competed away by fund inflows(since managers likely have decreasing returns-to-scale in their talents).Our evidence of persistence in the top decile of funds indicates that such a reversion to the mean in performance is somewhat slow to occur.Our paper proceeds as follows.Section I describes our bootstrapping procedure,while Section II describes the mutual fund database that we use in our study.Section III provides empirical results,the robustness of which we explore further in Section IV.Section V examines performance persistence using the bootstrap,and Section VI concludes.I.Bootstrap Evaluation of Fund AlphasA.Rationale for the Bootstrap ApproachWe apply a bootstrap procedure to evaluate the performance of open-end domestic equity mutual funds in the U.S..In this setting,there are many reasons why the bootstrap is necessary for proper inference.These include the propensity of individual funds to exhibit nonnormally distributed returns,as well as the cross-section of funds representing a complex mixture of these individual fund distributions.We begin by discussing individual funds.We then progress to the central focus of this paper,that is,evaluating the cross-sectional distribution of ranked mutual fund alphas, which involves evaluating a complex mixture of individual fund alpha distributions.A.1.Individual Mutual Fund AlphasAs we describe in Section III.A of this paper,roughly half of our funds have alphas that are drawn from a distinctly nonnormal distribution.These nonnormalities arise for several reasons. First,individual stocks within the typical mutual fund portfolio realize returns with nonnegligible higher moments.Thus,while the central limit theorem implies that an equal-weighted portfolio of such nonnormally distributed stocks will approach normality,managers often hold heavy positions in relatively few stocks or industries.Second,market benchmark returns may be nonnormal,and co-skewness in benchmark and individual stock returns may obtain.Further,individual stocks exhibit varying levels of time-series autocorrelation in returns.Finally,funds may implement dynamic strategies that involve changing their levels of risk-taking when the risk of the overall market portfolio changes,or in response to their performance ranking relative to similar funds. Thus,because each of these regularities can contribute to nonnormally distributed mutual fund alphas,normality may be a poor approximation in practice,even for a fairly large mutual fund portfolio.The bootstrap can substantially improve on this approximation,as Bickel and Freedman(1984) and Hall(1986)show.For example,by recognizing the presence of thick tails in individual fund returns,the bootstrap often rejects abnormal performance for fewer mutual funds;we return to thisfinding in Section III.B.A.2.The Cross-Section of Mutual Fund AlphasWhile the intuition we gain from the individual fund bootstrap results above is helpful,such intuition does not necessarily carry over to the cross-section of mutual funds.Specifically,the cross-sectional distribution of alphas also carries the effect of variation in risk-taking(as well as sample size)across funds.4Furthermore,cross-sectional correlations in residual(fund-specific) risk,although very close to zero on average,may be nonzero in the tails if some funds load on similar non-priced factors.These effects tend to be important because high-risk funds often hold concentrated portfolios that load on similar industries or individual stocks.That is,while fund-level nonnormalities in alphas may imply nonnormalities in the cross-sectional distribution of alphas,the reverse need not be true.Even funds that have normally distributed residuals can create nonnormalities in the cross-section of ranked alphas.To illustrate, consider1,000mutual funds,each existing over336months(the time span of our sample period). Suppose each fund has independently and identically distributed(IID)standard normal model residuals,and that the true model intercept(alpha)equals zero for each fund.Thus,measured fund alphas are simply the average realized residual over the336months.In this simple case,the cross-sectional distribution of fund alphas would be normally distributed.However,consider the same1,000funds with heterogeneous levels of risk such that,across funds,residual variances range uniformly between0.5and1.5(i.e.,the average variance is unity). In this case,the tails of the cross-sectional distribution of alphas are now fatter than those of a normal distribution.The intuition here is clear:As we move further to the right in the right tail, the probability of these extreme outcomes does not fall very quickly,as high-risk funds more than compensate for the large drop in such extreme outcomes from low-risk funds.Conversely,consider a case in which the distribution of risk levels is less evenly spread out(i.e.,more clustered),with 1%of the funds having a residual standard deviation of four,and the remaining99%having a standard deviation of0.92(the average risk across funds remains equal to one).Here,tails of the cross-section of alphas are now thinner than those of a normal.The intuition for these unexpected results is quite simple:The presence of many funds with low risk levels means that these funds’realized residuals have a low probability of lying out in the far tails of the cross-sectional distribution of alpha estimates.At some point in the right tail,this probability decreases faster than can be compensated by the presence of a small group of high-risk funds.Finally,consider a larger proportion of high-risk funds than the prior case—suppose10%of the1,000funds have a residual standard deviation of two,while the remaining90%have a standard deviation of0.82(again,the risk continues to be equal to one across all funds).In this case,the cross-section of alphas hasfive-and three-percentile points that are thinner,but a one-percentile point that is thicker,than that of a normal.Thus,the cross-section of alphas can have thick or thin tails relative to a normal distribution,regardless of the distribution of individual fund returns, as long as risk-taking is heterogeneous across funds.In unreported tests,we measure the heterogeneity in risk-taking among all U.S.domestic equity mutual funds between1975and2002.Wefind a heavily skewed distribution of risk-taking among funds;most funds cluster together with similar levels of risk,while a significant minority of funds exhibit much higher levels of risk.In further unreported tests,we bootstrap the cross-section of fund alphas,where each fund is assumed to have residuals drawn from a normal distribution that has the same moments as those present in the actual(nonnormal)fund residuals(using a four-factor model to estimate residuals).5The results show that the cross-section of bootstrapped alphas(assuming individual fund alpha normality)has thinner tails relative to a normal distribution,except in the extreme regions of the tails,which are thicker.Therefore,the heterogeneity in risk-taking that we observe in our fund sample generates many unusual nonnormalities in the cross-section of alphas, even before considering any nonnormalities in individual fund alphas.It is important to note that similar cross-sectional effects will not result when we assess the distribution of the t-statistic of the fund alphas.Since the t-statistic normalizes by standard deviation,heterogeneity in risk-taking across funds,by itself,will not bring about nonnormalities in the cross-section.6However,nonnormalities in individual fund residuals—which,as we discuss in a later section,wefind for about half of our funds—still imply nonnormalities in the cross-section of t-statistics.7Thus,many factors,including cross-sectional differences in sample size(fund lives)and risk-taking,as well as fat tails and skews in the individual fund residuals,influence the shape of the distribution of alphas across funds.Given the possible interactions among these effects and the added complexity arising from parameter estimation errors,it is very difficult,using an ex ante imposed distribution,to credibly evaluate the significance of the observed alphas of funds since the quantiles of the standard normal distribution and those of the bootstrap need not be the same in the center,shoulders,tails,and extreme tails.Instead,the bootstrap is required for proper inference involving the cross-sectional distribution of fund performance outcomes.To summarize,it is only in the very special case in which(1)the residuals of fund returns are drawn from a multivariate normal distribution,(2)correlations in these residuals are zero,(3)funds have identical risk levels,and(4)there is no parameter estimation error,that guarantees that the standard critical values of the normal distribution are appropriate in the cross-section.In all other cases,the cross-section will be a complicated mixture of individual fund return distributions,and must be evaluated with the bootstrap.8B.ImplementationIn our implementation we consider two test statistics,namely,the estimated alpha,bα,and the estimated t-statistic of bα,b t bα.Note that bαmeasures the economic size of abnormal performance, but suffers from a potential lack of precision in the construction of confidence intervals,whereas b t bαis a pivotal statistic with better sampling properties.9In addition,b t bαhas another very attractive statistical property.Specifically,a fund that has a short life or engages in high risk-taking will have a high variance-estimated alpha distribution,and thus alphas for these funds will tend to be spurious outliers in the cross-section.In addition,these funds tend to be smaller funds that are more likely to be subject to survival bias,raising the concern that the extreme right tail of the cross-section of fund alphas is inflated.The t-statistic provides a correction for these spurious outliers by normalizing the estimated alpha by the estimated variance of the alpha estimate.Furthermore, the cross-sectional distribution of t-statistics has better properties than the cross-section of alphas, in the presence of heterogenous fund volatilities due to differing fund risk levels or lifespans.For these reasons,we propose an alternate bootstrap that is conducted using b t bα,rather than bα.Indeed, the bulk of our tests in this paper apply to the t-statistic.We apply our bootstrap procedure to monthly mutual fund returns using several models of performance proposed by the past literature.These include the simple one-factor model of Jensen (1968),the three-factor model of Fama and French(1993),the timing models of Treynor and Mazuy (1966)and Merton and Henriksson(1981),and several models that include conditional factors based on the papers of Ferson and Schadt(1996)and Christopherson,Ferson,and Glassman(1998).We present results for two representative models in this paper;however results for all other models are consistent with those presented and are available upon request from the authors.10Thefirst model,the main model that we present in this paper,is the Carhart(1997)four-factor regressionr i,t=αi+βi·RMRF t+s i·SMB t+h i·HML t+p i·P R1Y R t+εi,t,(1) where r i,t is the month-t excess return on managed portfolio i(net return minus T-bill return), RMRF t is the month-t excess return on a value-weighted aggregate market proxy portfolio,and SMB t,HML t,and P R1Y R t are the month-t returns on value-weighted,zero-investment factor-mimicking portfolios for size,book-to-market equity,and one-year momentum in stock returns, respectively.The second representative model is a conditional version of the four-factor model that controls for time-varying RMRF t loadings by a mutual fund,using the technique of Ferson and Schadt (1996).Hence,the second model extends equation(1)as follows:r i,t=αi+βi·RMRF t+s i·SMB t+h i·HML t+p i·P R1Y R t+KX j=1B i,j[z j,t−1·RMRF t]+εi,t,(2)where z j,t−1=Z j,t−1−E(Z j),the end of month-t-1deviation of public information variable j from its time-series mean,and B i,j is the fund’s“beta response”to the predictive value of z j,t−1in forecasting the following month’s excess market return,RMRF t.This model computes the alpha of a managed portfolio,controlling for strategies that dynamically tilt the portfolio’s beta in response to the predictable component of market returns.11We now illustrate the bootstrap implementation with the Carhart(1997)four-factor model of equation(1).The application of the bootstrap procedure to other models used in our paper is very similar,with the only modification of the following steps being the substitution of the appropriate benchmark model of performance.To prepare for our bootstrap procedure,we use the Carhart model to compute ordinary least squares(OLS)-estimated alphas,factor loadings,and residuals using the time series of monthly net returns(minus the T-bill rate)for fund i(r it):r it=bαi+bβi RMRF t+b s i SMB t+b h i HML t+b p i P R1Y R t+b i,t.(3) For fund i,the coefficient estimates,{bαi,bβi,b s i,b h i,b p i},as well as the time series of estimated residuals,{b i,t,t=T i0,...,T i1},and the t-statistic of alpha,b t bαi,are saved,where T i0and T i1are。
外企公司常用英文缩写

外企日常工作中常用的英语术语和缩写语办公室职员( Office Clerk )加入公司的整个过程为例,弓I岀在跨国公司(MNC-Multi-National Company)工作中,日常人们喜欢经常使用的术语( Terminology )和缩写语(Abbreviation )。
[找工作Job Search in g]我立志大学毕业后加入一家跨国公司。
我制作了精美的个人简历( Resume, cv)。
我参加了校园招聘( Campus Recruitment )。
我关注报纸招聘广告( Recruiting Ads)。
我也经常浏览招聘网站( Recruiting Website )。
我还参加人才招聘会( Job Fair )。
[参加面试Be in vited for In terview]我选择了几家中意的公司,投岀了简历。
终于接到了人力资源部(Huma n Resources Departme nt )邀请面试的通知。
经过几轮面试( In terview )和笔试(Writte n Test) 我终于接到了XXXX 公司的聘用书(Offer Letter )。
这是一家独资/合资企业(Wholly Foreig n-Owned Compa ny/Joi nt-Ve nture )。
[录用条件Employment Terms]我隶属XX部门(Department )。
我的职位(Position )是XXXX。
我的工作职责(Job Responsibilities )是XXXX。
我的直接上司( Direct Supervisor )是XXX。
我的起点工资(Starting Salary )是XXXX。
我的入职日期(Join-Date )是XXXX。
我的试用期(Probatio n )是3 个月。
首期劳动合同( Labor Con tract/Employme nt Con tract )的期限(Term )是3 年。
cfa一级notes习题笔记

CFA一级Notes习题笔记EthicsCode of Ethics1.act with integrity, competence, diligence, respect, and in an ethical manner with the public, clients, prospective clients, employers, employees, colleagues in the investment profession, and other participants in the global capital markets2.place the integrity of the investment profession and the interests of clients above their own personal interestse reasonable care and exercise independent professional judgement when conducting investment analysis, making investment recommendations, taking investment actions, and engaging in other professional activities4.practice and encourage others to practice in a professional and ethical manner that will reflect credit on themselves and the profession5.promote the integrity of, and uphold the rules governing, capital markets6.maintain and improve their professional competence and strive to maintain and improve the competence of other ivestment professionals.Standards of Professional ConductI professionalismA.knowledge of the lawB.independence and objectivityC.MisrepresentationD.MisconductII.integrity of capital marketsA.material nonpublic informationB.market manipulationIII.duties to clientsA.Loyalty,Prudence and CareB.Fair DealingC.SuitabilityD.Performance presentationE.preservation of confidentialityIV.duties to employersA.loyaltyB.additional compensation arrangementsC.responsibilities of supervisorsV.investment analysis, reommendations,and actionsA.Diligence and reasonable basismunication with clients and prospective clientsC.record retentionVI.conflicts of interestA.Disclosure of conflictsB.priority of transactionsC.referral feesVII.responsibilities as a CFA institute member or CFA candidateA.conduct as menbers and candidates in the cfa programB.reference to CFA institute, the cfa designation, and the cfa program1.私人投资跟Code无关,但滥用举报违反personal conduct。
vauling mutual fund company

eScholarship provides open access, scholarly publishingservices to the University of California and delivers a dynamicresearch platform to scholars worldwide.Fisher Center for Real Estate and Urban Economics UC BerkeleyTitle:Valuing Mutual Fund CompaniesAuthor:Boudoukh, Jacob , IDC, NYU and NBER Richardson, Matthew , NYU and NBER Stanton, Richard , UC Berkeley Whitelaw, Robert F., NYU, Stern School of BusinessPublication Date:04-29-2004Series:Fisher Center Working PapersPublication Info:Fisher Center Working Papers, Fisher Center for Real Estate and Urban Economics, Institute of Business and Economic Research, UC BerkeleyPermalink:/uc/item/7ms3r416Keywords:Investment, Mutual Fund, Mortgage-Backed SecuritiesAbstract:Combining insights from the contingent claims and the asset-backed securities literatures, we study the economics of value creation in the asset management business. In particular, we provide a theoretical model and a closed form formula for the value of fund fees in the presence of the well known flow-performance relation, giving rise to interesting nonlinearities and volatility-related effects. The theoretical model sheds light on the role of fees, asset growth, asset and benchmark volatility, and the intensity of the flow-performance relation. To better understand the role of changing fund characteristics such as age and size on the fund value and fund risk, we estimate the empirical relation between returns and flows conditional on these characteristics for various asset classes. We study these effects using Monte Carlo simulations for various economically meaningful parameter values for specific asset classes. Measuring value as a fraction of assets under management, we find that both value and risk, systematic and idiosyncratic, decline in size and age. In addition, value is a complex, non-monotonic function of the fee charged on the fund.Valuing Mutual Fund Companies1Jacob Boudoukh a,Matthew Richardson b,Richard Stanton c and Robert F.Whitelaw bApril29,2004JEL classification:G14.1a IDC,NYU and NBER;b NYU and NBER;c U.C.Berkeley.Contact:Prof.Robert Whitelaw,NYU, Stern School of Business,44W.4th St.,New York,NY10012,(212)998-0338,rwhitela@.We thank the Fisher Center for Real Estate and Urban Economics forfinancial support.Valuing Mutual Fund CompaniesABSTRACTCombining insights from the contingent claims and the asset-backed securities literatures,we study the economics of value creation in the asset management business.In particular,we provide a theoretical model and a closed form formula for the value of fund fees in the presence of the well knownflow-performance relation,giving rise to interesting nonlinearities and volatility-related effects.The theoretical model sheds light on the role of fees,asset growth,asset and benchmark volatility,and the intensity of theflow-performance relation.To better understand the role of changing fund characteristics such as age and size on the fund value and fund risk,we estimate the empirical relation between returns andflows conditional on these characteristics for various asset classes.We study these effects using Monte Carlo simulations for various economically meaningful parameter values for specific asset classes.Measuring value as a fraction of assets under manage-ment,wefind that both value and risk,systematic and idiosyncratic,decline in size and age.In addition,value is a complex,non-monotonic function of the fee charged on the fund.1IntroductionAt the end of2002,the mutual fund industry managed over$11trillion dollars of assets worldwide according to data from the Investment Company Institute.Given the size of this industry,it is surprising that no literature has emerged which values mutual fund revenue streams.The literature to date has focused on documenting the performance of mutual funds,while a more recent literature links fundflows to this performance.1While there is considerable debate on the topic of whether mutual funds outperform relevant benchmarks, there is overwhelming evidence that fundflows depend on the ex post performance of mutual funds.This paper develops a valuation methodology for the feeflow generated by these mutual funds(“mutual fund valuation”henceforth).Specifically,we employ a contingent claims approach to mutual fund valuation by recognizing that mutual funds have the essential characteristics of asset-backed securities.The key insight underlying our valuation approach is that in an efficient market the present value of a claim on the future value of an asset is simply a function of the current value of that asset.The result is that the value can be written in terms of three elements:(1)the current value of assets under management,(2) the volatility of assets under management(necessary for valuing option-like features induced by the link between fundflows and fund performance),and(3)a set of parameters that describe the fund(including the fees,the age,the size of assets,and parameters describing theflows into and out of the fund).Of particular interest,for the reasonable case where there is a positive link betweenflows and performance,the functional relation between the mutual fund value and the underlying net asset value of the fund is nonlinear.We are not thefirst to recognize that valuation in the asset management industry can be done using the contingent claims approach.Goetzmann,Ingersoll and Ross(2003)value hedge fund management businesses under incentive fees and high-water mark provisions. While their paper focuses on features that are specific to the hedge fund industry,one could infer mutual fund values that are similar to some special cases of the model provided below by assuming no incentive fees and no high-water marks.In addition,Boudoukh, McAllister,Richardson and Whitelaw(2000)value the revenue streams from deferred load (so-called B and C shares)mutual funds.Some of the insights from these papers carry through here.However,neither paper addresses a critical and complicating feature of mutual fund valuation,namely the evidence that theflow of capital into the fund(and thus the growth rate of the assets)depends on changes in the fund’s value and other characteristics 1See,for example,Elton,Gruber and Blake(1996),Gruber(1996),Carhart(1997),Chevalier and Ellison (1997)and Sirri and Tufano(1998),among others.of the fund.2This issue is key from a valuation perspective and highly relevant for the mutual fund industry,and is the focus of our paper.Methodologically,the closest analogy to our paper can be found in the mortgage-backed securities literature,and in particular empirical mortgage valuation models such as Schwartz and Torous(1989).That paper develops an approach for the valuation of a mortgage-backed security by incorporating an empirical model of mortgage prepayments into a simulation framework.Here,we develop a methodology for the valuation of mutual funds by building into our analysis an empirical model of fundflows.There are a number of similarities between the two approaches and the issues that arise.In the mortgage-backed case,prepayments depend on the underlying factor,i.e.,interest rates,as well as particular characteristics of the mortgages,such as age,burnout,and type.3In the mutual fund case,fundflows also depend on the underlying factor,i.e.,the change in the fund’s net asset value(e.g.,Chevalier and Ellison(1997)and Sirri and Tufano(1998)),as well as fund characteristics such as fund size(e.g.,Sirri and Tufano(1998)),age(e.g.,Chevalier and Ellison(1997)),and fund type (e.g.,Bergstresser and Poterba(2002)),among other variables.Moreover,the techniques for implementing the valuation frameworks are based on the same underlying methodology,i.e., Monte Carlo simulation(e.g.,Boyle(1977)).This paper provides several contributions to the currentfinance literature.First,we develop a methodology for understanding the value and risk of mutual fund revenue streams. In particular,we provide a closed-form solution for a model that incorporates fundflows as a function of relative performance.Though the underlying fundflow model is kept simple for analytical purposes,it identifies some of the salient determinants of fund value.Mutual fund valuation depends both on the underlying asset value and its volatility,similar to asset-backed securities.Other determinants include asset growth and,in particular,the sensitivity of asset growth to relative performance.Interestingly,return volatility matters only to the extentflows correlate with net asset values.We also show that fees play an important role. On the one hand,higher fees increase current revenue,on the other hand,fees reduce growth. The combined effect is ambiguous,depending on the parameters of the system.Second,using the existing empirical literature as an important guide,we build a more realistic empirical fundflow model and embed that model into a valuation framework for mutual funds.Though the empirical results provide some additionalfindings relative to2Goetzmann,Ingersoll and Ross(2003)do discuss this issue for hedge funds,but do not build this into the valuation framework per se.Moreover,they argue that the incentive fee structure limits the amount of assets going into the fund.3Schwartz and Torous(1989)assume mortgage termination is determined entirely by interest rate move-ments.More recent work includes additional factors such as house prices.See,for example,Kau,Keenan, Muller and Epperson(1992),and Downing,Stanton and Wallace(2003).the current literature,the most important contribution lies in being able to link identified fundflow determinants to mutual fund values.Most significantly,our approach accounts for important state-and time-dependencies,such as how changes in funds’size and age affect value.In particular,across all asset classes,we establish the importance of the effects of age and size on assetflow properties such as growth,the sensitivity to performance,and volatility.Last,armed with economically meaningful parameters,we provide detailed comparative static analyses of fund value and risk characteristics for funds of different asset classes for various fund sizes,ages,flow volatilities and fees.Values throughout are measured in terms of the present value of fees per dollar of assets under management.We show how age,size and the fee level affect fund value.In particular,older and/or larger funds are much less valuable,but are also less risky,when compared to young and/or small funds.This lower level of risk reflects both the volatility of the mutual fund value and its sensitivity to changes in the fund’s net asset value and benchmark return.In addition,we show that mutual fund values are a complex,non-monotonic function of the fee charged on the fund.The paper is organized as follows.Section2presents a closed-form solution(and cor-responding analysis)for valuing mutual funds when fundflows depend on changes in the underlying fund’s net asset value(NAV).In Section3,we present an empirical fundflow model for different asset classes.In Section4,we describe the valuation approach under these more general assumptions about fundflow specifications.The valuation methodol-ogy is then implemented and analyzed for its implications for mutual fund values and risk measurement.Section5makes some concluding remarks and suggests directions for future research.2A Closed-form Solution to Mutual Fund ValuationWe develop our theoretical model in continuous time since this makes it easier to derive closed form pricing results in a contingent claims framework.Note that throughout this paper we assume that mutual funds have zero alphas,that is,fund managers do not possess superior skill at choosing undervalued assets.We make this assumption in order to avoid the debate about the presence of excess performance or lack thereof in the mutual fund industry. (See,for example,Ippolito(1992),Elton,Gruber and Blake(1996),and Carhart(1997)for differing evidence,and Berk and Green(2002)for a recent theoretical paper addressing this issue.)As with the usual Black-Scholes framework,we assume that the net asset value of the fund,S t,follows a lognormal diffusion process.Ceteris paribus,the NAV of the fund will decline because of fees paid to the manager of the fund company as well as cash distributions(i.e.,dividends and capital gains)to investors.With respect to fees,we assume that the fee is paid continuously at(annualized)rate c.While in practice fees are generally taken out at discrete points,the fee as a constant proportion of assets is typical across all mutual funds. In this paper,we abstract from the issue of distributions.4The focus of this section is to characterize in a reasonable setting the relation between the fund’s value and the underlying assets under management whenflows depend on the fund’s performance.Under the risk-neutral measure,we can therefore write the NAV dynamics as:dS t=(r−c)S t dt+σS t dZ S,(1)where r is the risk-free rate,c is the management fee,σis the volatility and Z s is the Brownian motion associated with the underlying assets.In equation(1),mutual funds earn expected returns less than the underlying assets due to the fees paid to the mutual fund company.However,as long as the mutual fund cannot be shorted,there is no possibility of arbitrage.5Let the number of shares in the fund be N t,so that the total value of assets under management in the fund isV t=N t S t.The goal of our paper is to better understand the interaction between N and S in light of the existing empirical evidence and the effect of this interaction on fund valuation.We treat the flow of monies into and out of the fund as a lognormal diffusion process governed by,among other factors,a constant meanνand an independent volatility shockσN.As our empirical analysis shows there is an important fraction offlow variations which is unexplained.As long as this variation is not correlated with the underlying NAV of the fund and can be diversified away within a broader set of asset holdings,this noise will have little impact on the fund’s value and priced risk(though not its idiosyncratic risk).However,the assumption that netflows depend on the change in the underlying NAV is clearly the most important piece of evidence and we incorporate this stylized fact below. In particular,we assume that theflow of monies into and out of the fund depends on the contemporaneous return of the NAV of the fund relative to some benchmark.We specify this dependence as a linear relation.Assume that the benchmark is given by index,I t,which4Note that most distributions are reinvested in the funds,so that the effect on the underlying assets under management is small.That is,the NA V decline is offset by the increase in the number of shares of the fund.5There does exist the important issue of why individuals invest in mutual funds in thefirst place under these circumstances.One possibility is that investors face lower transactions costs,either explicitly through trading constraints or implicitly through time constraints.Alternatively,mutual fund managers may possess superior investment skills,i.e.,positive alpha.follows a lognormal diffusion process.Under the risk-neutral measure,the dynamics of the index can be written as:dI t=rI t dt+σI I t dZ I,(2)dZ S dZ I=ρdt,(3)where Z I is the index’s Brownian motion,σI its volatility andρthe correlation between the fund’s NAV uncertainty and the index uncertainty.Assuming that the fundsflow in or out at a rate governed by a constantν,and that the netflows of the fund now depend linearly on its ex-post relative performance,we can write the netflows asdN t/N t=νdt+θ([dS t/S t−r]−γ[dI t/I t−r])+σN dZ N,(4)=(ν−θc)dt+θ(σdZ S−γσI dZ I)+σN dZ N.(5) dZ N dZ S=dZ N dZ I=0.(6)Several observations are in order.First,the parameterγdescribes the rule investors use to judge the fund’s performance versus the benchmark index.For example,γ=1compares the return on the fund’s NAV to the index’s return without adjusting for relative risk.A number of existing studies,such as Sirri and Tufano(1998),Chevalier and Ellison(1997)and Bergstresser and Poterba(2002),use this rule.Alternatively,lettingγequal the fund’s beta, i.e.cov(dS t/S t,dI t/I t)var(dI t/I t),we are assuming fund investors impose a one-factor model for describing excess performance.Gruber(1996),Del Guercio and Tkac(2002),and most performance measurement studies use this(and more elaborate)stly,γ=0is equivalent to investors looking at absolute rather than relative performance.Second,by linkingflows to net(and not gross)returns on the fund,there is a tendency for the netflows to decrease due to the negative effect of fees on NAVs.Of course,in practice,these fees may be related to differing alphas across funds.6As described earlier in this section,we are assuming that the managers of the funds do not have the ability to generate excess performance.In addition,there is considerable evidence linking bothνand θto the size of the fund,the type of fund,the fee structure,the fund’s age,etc.These features will be built into our empirical model of fundflows in the next section.Third,one of the main stylized facts from the empirical literature is that there is a lag between the realization of fund performance and its effect on fundflows,one year being a typical lag chosen in this literature(e.g.,Sirri and Tufano(1998)).In the continuous-time 6However,the evidence in the literature tends to support the opposite conclusion(e.g.,Gruber(1996)).framework above(though not in later sections),we abstract from this feature and assume the effect is instantaneous.This is not an important distinction for valuation.Since the fund’s value depends on the present value of all future fees,and these fees depend on the assets and netflows,whether theflow occurs this period or next period is a second-order effect.Finally,putting aside the idiosyncratic risk,Z N,and index risk,Z I,the stochastic shocks to both NAV and netflows are drawn from the same source.This common shock induces a nonlinear relation between NAV and the value of the fund.This aspect of valuation is new to the literature on mutual funds.Define s t≡log S t,i t≡log I t,and n t≡log N t.By Ito’s Lemma,ds t=r−c−12σ2dt+σdZ S,(7)di t=r−12σ2Idt+σI dZ I,(8)dn t=ν−θc−12θ2σ2+γ2σ2I−2ρσγσI−12σ2Ndt+θ(σdZ S−γσI dZ I)+σN dZ N.(9)Integrating these equations,we obtainsτ=s t+r−c−12σ2(τ−t)+στtdZ S.(10)iτ=i t+r−12σ2I(τ−t)+σIτtdZ I.(11)nτ=n t+ν−θc−12θ2σ2+γ2σ2I−2ρσγσI−12σ2N(τ−t)+θστtdZ S+θγσIτtdZ I+σNτtdZ N.(12)From equations(10)–(12),sτ,iτand nτare normally distributed for allτ.Write M t,T for the present value of all fees between t and some terminal horizon,T(which might be infinite).ThenM t,T=c E tTte−r(τ−t)Vτdτ,(13) or,switching the integral and the expectation,M t,T=cTt E te−r(τ−t)Vτdτ.(14)Since both n t and s t are normal,so is their sum,andE t e−r (τ−t )V τ =E t e n τ+s τ−r (τ−t ) ,=exp [E t (n τ+s τ)+1/2var t (n τ+s τ)−r (τ−t )].(15)From equations (10)and (12),we haveE t (s τ+n τ)=E t (s τ)+E t (n τ),=s t +n t + r +ν−c (1+θ)−12σ2−12θ2 σ2+γ2σ2I −2ρσγσI −12σ2N (τ−t ).(16)var t (s τ+n τ)=var t (s τ)+var t (n τ)+2cov t (n τ,s τ),=σ2(τ−t )+ θ2 σ2+γ2σ2I −2ρσγσI +σ2N (τ−t )+2 θσ2−θρσγσI (τ−t ).(17)Substituting into equation (15)and simplifying,we obtainE t e−r (τ−t )V τ =V t e −[c (1+θ)−ν−θσ(σ−ργσI )](τ−t ).(18)Finally,performing the integration in equation (14),we obtain 7M t,T =cV t T t e −[c (1+θ)−ν−θσ(σ−ργσI )](τ−t )dτ,=c 1−e −[c (1+θ)−ν−θσ(σ−ργσI )](T −t ) c (1+θ)−ν−θσ(σ−ργσI )V t .(19)Letting the terminal horizon go to infinity,we haveM t ≡lim T →∞M t,T =c c (1+θ)−ν−θσ(σ−ργσI )V t for c (1+θ)>ν+θσ(σ−ργσI ).(20)Equations (19)and (20)provide the intuition for understanding the relation between mutual fund values and the value underlying assets under management.Unlike hedge funds,mutual funds tend not to disappear.This is partly due to the lack of a high watermark,but also to the fact that poorly performing funds are generally merged into existing funds so the assets do not disappear (Gruber (1996)).Therefore,since a long horizon setting may be 7As long as c (1+θ)=ν+θσ(σ−ργσI ).Otherwise,M t,T =c V t (T −t ).appropriate for analyzing the present value of fees,wefirst focus our intuition on the infinite horizon case given by equation(20)and discuss thefinite horizon case in a later subsection. Thefinite horizon case is relevant,however,to the extent that we present evidence in the empirical section that the age of the fund has important implications for the parameters governing equation(20).These implications are equivalent to shortening the life of the fund.As afirst pass at the intuition,consider the case in which fundflows are unrelated to fund performance,i.e.,θ=0.This is the typical environment that has been studied in the theoretical literature to date and therefore serves as a useful benchmark.Substitutingθ=0into equation(20),we getM t=cc−νV t for c>ν.(21)Equation(21)is essentially the Gordon growth model in which the initial cashflow is the fee earned on the assets under management,i.e.,cV t.Define the other parameters of the Gordon growth model as r∗for the discount rate and g for the growth rate.In the present case,g=r∗−c+ν.Since the assets are expected to grow at their expected return,adjusted for fees and exogenous growth,the expected return cancels.This is one of the central ideas of the paper,and for that matter any contingent claim analysis;that is,the present value of the future asset price is just today’s price.The present value of the fees then depends on the remaining two components of the growth rate.The fee,c,leads to a lower growth rate as the NAVs decline in c,whileνrepresents general growth in netflows not related to the NAV.Perhaps not surprisingly,this valuation formula suggests that the mutual fund business produces substantial revenue streams in a present value sense.8In particular,if we assume no growth in fundflows(i.e.,ν=0),then the fund’s value equals the current assets under management,V t.In other words,in present value terms,the management company extracts all the value of the assets.This is analogous to the house eventually owning the pot in a poker game by taking a small cut of each hand played.According to equation(21)the present value can even exceed current assets under management.It may,in fact,reach infinity,for growth rates inflows that are larger than the management fee.The more interesting case,and the primary contribution of the paper,is to consider θ=0.As described in the introduction and above,this is the more empirically relevant case.The valuation formula in equation(20)now has two additional terms affecting the growth rate of the cashflows.Thefirst term is cθ.Sinceθmeasures the sensitivity of the 8This equation is similar in spirit to the valuation of a hedge fund contract in Goetzmann,Ingersoll and Ross(2003)if one assumes no high water mark and no incentive fee.In their paper,they focus on hedge funds and treat the number of shares asfixed.They do assume,however,a constant withdrawal rate which is analogous to a negative value ofνin our case.netflows to the fund’s NAV return relative to the benchmark,and the fees cause the NAVs to drift downward through time,cθhurts the cashflow growth.The second term isθΣ, where we defineΣ≡σ(σ−ργσI).Σhas a particularly interesting economic interpretation. It represents the covariance between the fund’s NAV return and the return relative to the benchmark,which determines netflows,namelyΣ=cov(dS t/S t,dS t/S t−γdI t/I t).That is,θΣis relevant for pricing to the extent that the return driving netflows is also correlated with the return on NAV.This is the convexity effect that is common to option pricing and other asset-backed security pricing,such as mortgage-backed securities.2.1Comparative StaticsThe analysis above explains the primary components of the valuation of mutual fund revenue streams.How do these components affect the valuation and under what conditions these components are important?Below,we provide some comparative statics analysis to help answer this question.2.1.1ΣAs long as the sensitivity of fundflow to performance is positive,i.e.,θ>0,then the value of the fund will be increasing in the covariance term,Σ.Note thatΣis increasing inσbut decreasing inρ,σI andγ.Hence,the value of the fund is increasing inσbut decreasing in ρ,σI andγ.This result relating value to the fund’sσhas also been documented by Goetzmann, Ingersoll and Ross(2003)but for completely different reasons.Their result derives from the incentive fee in which hedge funds take a proportion of the return above the high-water mark. Here,even with no incentive fee,this result carries through because fundflow depends on the fund’s performance.Thus,many of the issues surrounding the incentives of fund managers discussed by Grinblatt and Titman(1989),Brown,Harlow and Starks(1996),Chevalier and Ellison(1997),Carpenter(2000),Das and Sundaram(2002)and Goetzmann,Ingersoll and Ross(2003)are relevant in our framework.Of some interest,Brown,Harlow and Starks(1996)and Chevalier and Ellison(1997) analyze the incentives of mutual fund managers to increase theflows into the fund.Under the assumption thatflows go more quickly into the very best performing funds(yielding an option-like payoff),or under the assumption that investors look at year-end returns so that poor performers at mid-year have different incentives,they argue and show empirically that managers may take more volatile positions.9In contrast,the result in equation(20) 9The empirical evidence in support of these claims is not universally accepted(e.g.,Busse(2001)).shows that neither the relative ranking nor nonlinearity in theflow-performance relation are important per se for the managerial incentive to take greater risk.This incentive arises quite naturally from the nonlinear payoffstructure.This is true even if theflow-performance relation is linear(as in equation(4)).The empirical results of Chevalier and Ellison(1997), as well some of the previously cited literature,are,however,important.Theyfind thatθvaries across fund characteristics as well as across fund performance.The effect of volatility on the mutual fund’s value depends very much on the sign and magnitude ofθ.A primary focus of our empirical analysis in Section3is,therefore,on characterizing the fund’sθas a function of the characteristics and performance of the fund.In contrast,as long asθ>0,the value of the fund will be decreasing in the volatility of the index and in its correlation with the fund’s NAV.Intuitively,the index serves as a counterweight to the fund’s own return volatility.Take the extreme case where the fund and index are perfectly correlated.Then the“volatility”effect depends on the relative volatility of the fund versus the index,adjusted forγ.Thus,the incentives of managers described above relates to choosing assets which are both volatile and less correlated with the index subject to the constraints of a contract between investors and the fund(vis a vis the benchmark).Of some interest,this result does not depend on the“mutual fund tournament”explanation of Brown,Harlow and Starks(1996).Their effect will just further accentuate our result here.One interesting example is that of index funds.To the extent index funds are perfectly correlated with the benchmark,and are risk-adjusted so thatγequals the fund’sβin a one-factor model,the value of the fund will be unrelated toΣ.Moreover,if this fund were holding some liquid assets,such as money-market accounts,and it was being judged as an index fund,then its value would actually decrease inΣ.In this example the concavity induced by the fund investor’s risk adjustment on the benchmark outweighs the convexity effect induced by the fund’s own volatility.The example points out the relative importance of(i)the variance-covariance matrix between the fund and benchmark,and(ii)transparency between the fund and investors on what the appropriate benchmark should be.2.1.2cConsider how the fund’s value changes relative to the fees it charges.In the infinite horizon case,wefind a somewhat surprising result.Ifν+θΣ>0,then the mutual fund value actually falls as the manager increases the fee.The intuition is straightforward.Higher fees tend to decrease the net asset value of the fund over time.Sinceν+θΣ>0implies a positive growth rate inflows,the higher fee counteracts this positive growth.In a present value sense,it would be better to let theflows grow quickly and reap the present value of all future fees than take higher fees upfront.Note,however,that the present value of fees。
英语词性变化对照表

possess
可能的
possibility
Possible
possibly
实践
practice
practice
Practical
practically
更喜欢
prefere nee
prefer
进行
procedure•程序
proceed
原因
reas on
reas on able•合理的
con sider
con siderable•可观的con siderate•体贴的
considerably-显著地
~r". -Ph
贡献
con tributi on
con tribute
创造
creature•生物
create
creative•有创造性的created•创造的
文化
culture
cultural
允许
permissi on
permit
人
pers on
personality•人格
personal•个人的
pers on ally•亲自
物理
physics
Physical
physically
政策
policy politician•政治家politics•政治
Political
politically
拥有
滥用
abuse•恶习
abuse
abused
学术的
aeadem y•研究院
academic
接受
accept
acceptable
通入
access
行为金融学文献15Leaning for the Tape Evidence of Gaming Behaviour in Equity Mutual Funds

THE JOURNAL OF FINANCE•VOL.LVII,NO.2•APRIL2002Leaning for the Tape:Evidence of Gaming Behavior in Equity Mutual FundsMARK M.CARHART,RON KANIEL,DAVID K.MUSTO,and ADAM V.REED*ABSTRACTWe present evidence that fund managers inf late quarter-end portfolio prices withlast-minute purchases of stocks already held.The magnitude of price inf lationranges from0.5percent per year for large-cap funds to well over2percent forsmall-cap funds.We find that the cross section of inf lation matches the cross sec-tion of incentives from the f low0performance relation,that a surge of trading inthe quarter’s last minutes coincides with a surge in equity prices,and that theinf lation is greatest for the stocks held by funds with the most incentive to inf late,controlling for the stocks’size and performance.Q UARTER-END AND ESPECIALLY YEAR-END equity mutual fund prices are abnor-mally high.We present strong evidence that some mutual fund managers mark up their holdings at quarter end through aggressive trading of stocks they already hold.Funds with the greatest ability and most incentive to improve their performance exhibit the largest turn-of-quarter effect.Intra-daily data show a surge of transactions and transaction prices in the quar-ter’s last few minutes,and fund-holdings data show a larger effect in the funds with the most incentive to mark up.Considering that open-end equity funds intermediate$3.46trillion~year-end1999!,1this turn-of-quarter in-f lation of their prices is a significant opportunity for potential sellers,and a significant hazard for everybody else.In general,open-end domestic equity mutual funds calculate their net asset values per share~NAVs!from the closing transaction prices of their holdings.*Carhart is from Goldman Sachs Asset Management,Kaniel is from the University of Texas, Musto is from the University of Pennsylvania,and Reed is from the University of North Carolina. The authors thank Marshall Blume;Mercer Bullard;Susan Christoffersen;Dan Deli;Diane Del Guercio;Roger Edelen;Chris Geczy;Bruce Grundy;Don Keim;Alan Lee;Andrew Metrick;Rob Stambaugh;Laura Starks;Paula Tkac;Kent Womack;Jason Zweig;and seminar participants at the Securities Exchange Commission,Iowa,Texas,and the Wharton School;participants in the Western Finance Association meeting in Sun Valley,Idaho;the Academic0Practitioners Con-ference on Mutual Funds at the Investment Company Institute;and RenéStulz and an anon-ymous referee for helpful comments and suggestions.Financial and other support from the Rodney L.White Center for Financial Research and the Wharton Financial Institutions Center is gratefully acknowledged.The views expressed are those of the authors alone,and do not necessarily ref lect the views of Goldman Sachs Asset Management,Wharton,or UT.1Investment Company Institute,Mutual Fund Fact Book,2000Edition,p.73.This figure excludes international funds.661662The Journal of FinanceWhile there are obvious benefits from pricing off the most recent arms-length transactions,there are potential concerns as well.One of these,ex-plored by Chalmers,Edelen,and Kadlec~2000!,Boudoukh et al.~2000!,and others,is the age of thinly traded stocks’last trades,which allows specula-tors to profit off longer-term shareholders.The concern we explore here is the inf luence of last-minute trading on last-trade prices,which allows fund managers to move performance between periods with last-minute trading in stocks they already hold,a practice alternately known as“painting the tape,”“marking up,”or“portfolio pumping.”Market regulators regard this practice as illegal.See Sugawara~2000!.If managers mark up to move performance to one period from the next, the result is abnormally high NAVs at period ends.Because of the signifi-cance of quarterly and annual performance figures,the ends of calendar quarters—particularly the fourth—are logical targets.We first establish that quarter-end distortion of NAVs is economically and statistically significant, then study fund returns,portfolio holdings,stock returns,and stock trades to determine whether the marking-up tactic is responsible.We first establish the abnormal-NAV pattern around quarter ends.Equity fund returns,net of the S&P500,are abnormally high on the last day of the quarter,especially the fourth,and abnormally low the next day.This effect appears in both our database of daily fund returns and in the Lipper daily fund indices.Magnitudes range from around50basis points per year for large-cap funds to well over200basis points for small-cap funds.There is little or no effect at month-ends that are not quarter-ends.We then focus in on the cause of the abnormal returns with a sequence of tests on the cross section of fund and stock returns.We confirm the link between the quarter-end rise and the next-day decline by showing that larger increases precede larger decreases in the cross section,which is not the case for fund returns on other days.Next,to establish whether mutual fund managers are actively involved, we check if funds with relatively more incentive to mark up do in fact show more marking up.We test two hypotheses.First,funds just below the S&P 500for the year mark up to beat the index~Zweig~1997!!,which we call “benchmark-beating.”Second,funds with the best performance mark up to improve their year-end ranking and to profit from the convexity of the f low0 performance relation~Ippolito~1992!,Sirri and Tufano~1998!!and manage-rial incentive pay.We denote this as the“leaning-for-the-tape”hypothesis. Despite its intuitive appeal,we reject the benchmark-beating hypothesis. As Degeorge,Patel,and Zeckhauser~1999!observe,manipulation of a sta-tistic to beat a benchmark should distort the empirical distribution of the statistic around the benchmark.In the empirical distribution of funds’calendar-year returns,there is no distortion around the S&P return,such as De-george,Patel,and Zeckhauser find in corporate-earnings numbers around analysts’expectations,and no distortion around zero return.However,we find significant evidence supporting the leaning-for-the-tape hypothesis.We find that the year’s best-performing funds have the largestEvidence of Gaming Behavior in Equity Mutual Funds663 abnormal year-end return reversals,and the quarter’s best-performing funds have the largest abnormal quarter-end return reversals.Intraday data iso-late much of the pattern in a small window of trading time around the quarter-end day’s close.Finally,we find that the stocks in the disclosed portfolios of the best-performing funds,controlling for capitalization and recent return, show significantly more price inf lation at year-end than do other stocks.We conclude that marking up by mutual funds explains some,if not all,of the price inf lation.The rest of the paper is in five sections.Section I covers the relevant literature on equity and equity-fund returns,and Section II tests for NAV inf lation at period-ends.Section III presents evidence from the cross section of fund returns.Section IV tests for marking up on transactions data,and Section V summarizes and concludes.I.Background and LiteratureTwo literatures relate to regularities in equity-fund returns:the extensive literature on equity-return seasonality,and the more recent literature on equity-fund-return seasonality,which is qualitatively different in both causes and implications.We cover each brief ly,then describe the main hypotheses of this paper in the context of the literature on equity-fund agency issues, particularly those relating to the effect of fund performance on net cash f lows.A.Literature on Equity Return SeasonalityThe finance literature has uncovered and analyzed many peculiarities in equity returns in the days around the year-end.Most attention has focused on small-cap issues.Relative to big-cap stocks,small-cap stocks shift signif-icantly upward on each of the five trading days starting with the last of the year~Keim~1983!,Roll~1983!!with a persistence across years that defies risk-based explanations.Explanations include tax-loss selling and window dressing.Tax-loss selling implies that retail investors’demand for stocks with poor past performance shifts up after the year-end tax deadline~e.g., Roll~1983!,and see Ritter~1988!for evidence that sale proceeds are“parked”for a while!.Similarly,window dressing implies that institutional demand for prior poor performers shifts up after year-end portfolio disclosures~e.g., Haugen and Lakonishok~1988!,Musto~1997!!.Neither explains why the shift starts a day before the year-end.22U.S.mutual funds~with a few exceptions!use trade dateϩ1positions in calculating their daily NAV.Therefore,any changes in position that occur through trading on the last day of the year are not ref lected in that day’s NAV,but rather in the next day’s NAV.However,U.S.GAAP requires that semiannual mutual fund reports ref lect trade date positions,so these trades would be observed in the financial statements of funds with calendar fiscal years.664The Journal of FinanceLining up daily index returns from1963to1981around month ends,Ariel ~1987!isolates all of equities’positive average returns in the nine trading days starting with the last of the month.Various explanations are consid-ered and discarded.Sias and Starks~1997!find that greater institutional ownership is associated with relatively better returns in the last four days of the year,and relatively worse in the first four days of the year,and conclude that individual-investor tax-loss selling explains their finding.However,the average returns are virtually the same over these two periods,so they con-clude it is actually the unusually poor performance of low institutional own-ership stocks at the end of the year,and their good performance at the beginning of the year,that drives their results.At the intraday frequency,Harris~1989!shows that transaction prices systematically rise at the close,and that this“day-end”anomaly is largest at month-ends~the study did not consider quarter-or year-ends separately! and when the last transaction is very near to the close in time.Harris also finds that the effect is stronger for low-priced firms and that buyers more frequently initiate day-end transactions.The literature also documents price shifts directly traceable to institu-tional money management.Harris and Gurel~1986!show that prices on new constituents of the S&P500index abnormally increase more than three per-cent upon announcement,all of which is eliminated within two weeks.Lynch and Mendenhall~1997!,studying a period when S&P additions and dele-tions were announced several trading days in advance,show transaction prices to be temporarily low on deletion days and high on addition days,and Reed~2000!confirms this for Russell2000additions and deletions.This effect is understood to be caused by the rebalancing trades of index managers.B.Literature on Equity-fund Return SeasonalityIt might seem redundant to measure the seasonality of equity-fund re-turns,because we might expect to see only the previously discussed equity-return patterns.But the return on an equity fund is fundamentally different from the return on an equity,and the significance of this difference is only recently being addressed in the literature.An equity return represents the difference between the prices of two arms-length transactions.It tells us what an investor would have earned if he bought at the initial price and sold at the later price.We cannot know how much,if any,another investor could have transacted at these prices,as they are specific to the size and direction,and possibly other circumstances,of those two trades.In many cases,we abstract from transaction times,which is a minor concern for heavily traded stocks but not for the sparsely traded ones.An alternative is to look instead at bid and ask prices,but these,too, are only relevant for trades of a specific size.An equity-fund return represents the difference between two NAV calcu-lations,where each NAV is calculated from the closing prices of the fund’s holdings on their respective primary exchanges.In contrast to an equityEvidence of Gaming Behavior in Equity Mutual Funds665 price,the NAV is the actual transaction price used for purchases and re-demptions of fund shares after the close that day.However,it is unlikely that an investor could purchase or sell all of the fund’s equity positions at the closing prices used to calculate NAV.So NAVs directly represent the experience of hypothetical investors,without the guesswork and error,but they can depart from the“equilibrium”value of fund shares whenever equities’closing prices depart from their equilibrium values.When this departure is predictable,investors have a trading rule whose profits derive from the funds’other shareholders.Some recent studies illustrate the predictability caused by nonsynchro-nous trading.Nonsynchroneity is most extreme in funds holding non-U.S. equities that price these holdings using closing trades on their home ex-change,yet allow fund purchases and redemptions up to the close of U.S. trading~Goetzmann,Ivkovic,and Rouwenhorst~2000!!.But even purely do-mestic funds allow arbitrage to the extent they hold equities whose last trades tend to precede the market close~e.g.,Boudoukh et al.~2000!,Chal-mers et al.~2000!,Greene and Hodges~2000!!.These profit opportunities are sporadic and require good estimates of the magnitude of market moves between non-U.S.and U.S.market closes for international funds,or shortly before the U.S.close for funds holding illiquid stocks.In the popular press,Zweig~1997!demonstrates year-end seasonality in equity funds,and offers an explanation.From1985to1995,the average equity fund outperformed the S&P500by53bp~bpϭbasis points,10100of one percent!on the year’s last trading day,and under performed by37bp on the next year’s first trading day.Small-cap funds shifted more:103bp above the S&P,then60bp below.This does not match the price shifts of small-cap equity indices,which generally beat the market on both days in those years. The explanation offered is that some fund managers cause the pattern by manipulating year-end valuations to improve their fund’s return.In SEC terminology,“marking the close”is“the practice of attempting to inf luence the closing price of a stock by executing purchase or sale orders at or near the close of the market”~see Kocherhans~1995!!.Zweig~1997!pro-poses that the fund managers just short of the S&P500on the year’s pen-ultimate trading day try to pass it by marking the last day’s close with buys. At the least,they could simply increase the probability their holdings close at the ask,but with more aggressive purchases,they could push up both the bid and the ask.Either way,this“marking up”would result in inf lated NAVs and thereby inf lated returns for holding periods ending on that date, and correspondingly de f lated returns over periods beginning then.C.Two Models of the Marking-up StrategyWe consider two models,not mutually exclusive,of the marking-up strat-egy.The first is the scenario just described in which managers mark up to beat the S&P,which we label the“benchmark-beating”model.The idea that funds mark up to beat the S&P500has intuitive appeal;a fund’s success at666The Journal of Financebeating the S&P500is a popular topic in the financial press and in pro-spectuses and annual reports,so it would seem that investors would rewardit with new investment.Interestingly,however,they do not.A recent com-parative study of the f low0performance relation in the mutual fund and pen-sion fund industries,Del Guercio and Tkac~2000!,finds new investmentincreases with performance in both segments,but beating the S&P500bringssignificant new investment only to pension funds,not to mutual funds.So ifa reward mechanism encourages marking up to beat the S&P500,it is prob-ably something other than expectations of new investment.For example,managers’bonus plans might reward outperforming the S&P500.The second model is suggested by the convex relation between past per-formance and subsequent net fund f lows.As Ippolito~1992!and Sirri andTufano~1998!show,net f lows are much more sensitive to the differencebetween two high returns than between two lower returns,so that fundmanagers get more benefit from rank improvements if they are near the topof the distribution.This further implies that on the last day of a referenceperiod,fund managers get more benefit from moving performance to thatperiod from the next if their period-to-date performances are near the top ofthe distribution.They are in the high-slope region of the relation for thisperiod and not particularly likely to be there for the next~Hendricks,Patel,and Zeckhauser~1993!,Brown and Goetzmann~1995!,Carhart~1997!!,whichincreases their incentive to move performance from the next reference pe-riod.Marking up at period end moves performance from the next period.Soin the second model,which we label the“leaning-for-the-tape”model~pic-ture runners at the finish line!,funds mark up at the end of a referenceperiod to improve a superior performance.The primary reference period would intuitively be the calendar year.Re-turns over calendar years figure disproportionately in the analysis of fundperformance in the press,in mutual fund ratings and databases,and in theacademic literature.And managers’bonus plans are typically described ascalendar-year based.Calendar quarters would be a secondary target,giventheir prominence in the press~e.g.,the Wall Street Journal’s quarterly pull-out section!,in shareholder reports~e.g.,the quarterly mailings to pension-plan participants!,and elsewhere.Since the two models isolate marking-up activity in different sets of funds—average performers~i.e.,near the S&P!in one case,top performers in theother—it might seem they are easy to distinguish in the data.But the con-centration of mutual fund holdings in certain equities serves to blur thisdistinction.If funds“herd”to certain equities,as is suggested by Lakonishok,Shleifer,and Vishny~1992!,Grinblatt,Titman,and Wermers~1995!,and Karceski ~1999!,and a few determined fund managers mark up some of these secu-rities,then other funds will benefit from the marking effect of these man-agers.Those responsible may not even manage mutual funds;calendar-yearand quarter returns are also important in other institutional-investor cat-egories,such as pension and hedge funds.Pension and hedge fund managersEvidence of Gaming Behavior in Equity Mutual Funds667 may herd with mutual funds when picking stocks and then mark the close. So even if only the benchmark-beating hypothesis is correct,funds in gen-eral would show at least some of the same return seasonality.And the same applies if only the top-performing hedge funds are marking up.So it is not enough to show that the NAVs of some funds go up then down;we also have to test against these alternative passive scenarios.II.NAV Inflation at Quarter-endsIn this section,we show that equity funds are overpriced at the close of calendar quarters,in the sense that investors who sell at the quarter-end NAV earn abnormally high returns,and those who buy earn abnormally low returns.This is apparent both in the Lipper mutual fund indices and in our own database of individual equity funds.The Lipper time series are useful in that they are popular references regarding fund performance~e.g.,daily in the Wall Street Journal!;they extend through July7,2000;and they sort funds along dimensions of interest.The results from our own database ex-tend back further and also permit us to refine our tests on the cross section of the funds and of funds’holdings.Since the time period over which this return accrues is only one day,our results are insensitive to our model of equity market equilibrium.A.Tests Using Lipper Mutual Fund IndicesLipper produces many equity-fund indices.We use the nine“style”indices that constitute a three-by-three sort of the equities concentrated in$Small-cap,Mid-cap,Large-cap%by$Value,Core,Growth%,and are available daily from July13,1992,through the present.These indices allow us to relate our results on NAV inf lation to the well-documented~e.g.,Fama and French ~1992!!variation of average equity returns with size and book-to-market value.From the return on the Lipper style indices,we subtract the return onthe Lipper index of S&P500funds3to obtain excess returns.If NAVs are inf lated at quarter-and year-ends,we should observe abnor-mally high returns on the last day of each quarter and year,and abnormally low returns on the first day.Let R i,t denote the daily excess return of style index i on day t,for t from July14,1992~the first return we can calculate!, to July7,2000~the last date when we downloaded Lipper data!,and run the following OLS indicator-variable regression:R i,tϭb i,0ϩb i,1YEND tϩb i,2YBEG tϩb i,3QEND t~1!ϩb i,4QBEG tϩb i,5MEND tϩb i,6MBEG tϩe i,t3The Lipper index values,and therefore returns,are based on the total returns of their constituent funds,where total returns are calculated by reinvesting dividends on their ex-dates.668The Journal of Financewhere YEND t takes the value of one when t is the last day of a year,and zero otherwise.Similarly,QEND t and MEND t are one on the last day of a calen-dar quarter that is not a year end,and the last day of a month that is not a quarter end,respectively.The variables YBEG t,QBEG t,and MBEG t are defined analogously,except that they are for the first day of the period.We present the fitted coefficients from these nine regressions in Panels A~YEND and YBEG!,B~QEND and QBEG!,and C~MEND and MBEG!of Table I. The results indicate a strong two-day return reversal pattern across month-end,quarter-end,and year-end periods,especially for small-cap and growth funds.The results are strongest for quarter-and year-ends:Of the36coef-ficients in Panels A and B,all but one are in the predicted direction,and all but four are statistically significant at the10percent level.In addition,the magnitudes decrease strongly in market capitalization,and increase moder-ately from value to growth.Finally,the evidence in Panel C around non-quarter-end month ends is weak.There is a small and generally statistically significant increase on the last day of the month,but almost nothing the next day.To test whether the reversal pattern is significantly more intense at quarter-ends than at other month-ends,we rerun the nine regressions with the vari-ables regrouped so that the second and third coefficients pick the marginal effect of being a quarter-end~including year-end!in addition to being a month-end:R i,tϭb i,0ϩb i,1~YEND tϩQEND t!ϩb i,2~YBEG tϩQBEG t!ϩb i,3~YEND tϩQEND tϩMEND t!~2!ϩb i,4~YBEG tϩQBEG tϩMBEG t!ϩe i,t.The results,in Panel D,again show widespread significance.All but one are in the right direction,and all but three are statistically significant at the five percent rejection level.The magnitudes of the abnormal returns are quite large,especially con-sidering they accrue over just a few days in a year.In small-cap growth funds,the quarter-ending positive abnormal returns total435basis points per year,and the quarter-beginning negative returns sum toϪ345basis points.For our purposes,it is clear that quarter-end prices are inf lated in that selling at those prices delivers economic profits,and there is little of this inf lation at other month ends.Further,abnormal returns of this size are unlikely to be compensation for risk.B.Tests Using Daily Individual Mutual Fund ReturnsTo further analyze period-end abnormal returns,we construct a database of daily returns on2,829funds using daily price,dividend,and dividend reinvestment NAV data from Micropal.Our database consists of diversified open-end equity mutual funds in the aggressive growth,growth and income,Evidence of Gaming Behavior in Equity Mutual Funds669Table IExcess Returns,in Basis Points,of the Lipper Mutual FundIndices around Period-endsNine of the Lipper mutual fund total-return indices are a three by three sort of equity funds, $Small-cap,Mid-CAP,Large-cap%by$Value,Core,Growth%.There is also an index of S&P500 funds.Daily index levels begin July13,1992,and run through July7,2000,a total of2019 trading days.For each of the nine indices,we calculate its daily return net of the S&P-fund index and then for Panels A,B,and C we regress this excess return on six100indicator vari-ables:YEND~last trading day of the year!,YBEG~first of the year!,QEND~last of a calendar quarter other than the fourth!,QBEG~first of a calendar quarter other than the first!,MEND ~last of a month but not the last of a quarter!,and MBEG~first of a month but not the first of a quarter!.The coefficients are arranged into panels:YEND0YBEG in Panel A,QEND0QBEG in Panel B,and MEND0MBEG in Panel C.For Panel D,we use only four100variables: YENDϩQEND,YBEGϩQBEG,YENDϩQENDϩMEND,and YBEGϩQBEGϩMBEG,and we report the coefficients on the first two100variables analogously to the other panels.Results are in basis points.Each of the18time-series regressions has2018observations.For Panels A,B,and C the model isX tϭb0ϩb1YEND tϩb2YBEG tϩb3QEND tϩb4QBEG tϩb5MEND tϩb6MBEG tϩe t.For Panel D,the model isX tϭb0ϩb1~YEND tϩQEND t!ϩb2~YBEG tϩQBEG t!ϩb3~YEND tϩQEND tϩMEND t!ϩb4~YBEG tϩQBEG tϩMBEG t!ϩe t.Small-cap Mid-cap Large-capPanel A:Turn of the Year,YEND0YBEG CoefficientsValue141**0Ϫ30120**0Ϫ34*25**0Ϫ17** Core153**0Ϫ53**155**0Ϫ73**30**0Ϫ20** Growth174**0Ϫ96**157**0Ϫ78**37**0Ϫ33** Panel B:Turn of Calendar Quarters Other than Fourth,QEND0QBEG CoefficientsValue59**0Ϫ33**31**0Ϫ14405Core71**0Ϫ52**60**0Ϫ55**8**0Ϫ5* Growth87**0Ϫ83**69**0Ϫ82**15*0Ϫ17** Panel C:Turn of Months Other than Quarter-ends,MEND0MBEG CoefficientsValue25**0Ϫ910**0126**0Ϫ2 Core21**0Ϫ225**0Ϫ14**0Ϫ1 Growth28**0626**06404Panel D:Quarters versus Other Months,YENDϩQEND0YBEGϩQBEG CoefficientsValue55**0Ϫ24*43**0Ϫ31**402Core70**0Ϫ50**59**0Ϫ59**9**0Ϫ8** Growth81**0Ϫ92**65**0Ϫ87**17**0Ϫ25** *Significantly different from zero at10percent rejection level.**Significantly different from zero at5percent rejection level.670The Journal of Financeand long-term growth categories as defined by Carhart~1997!,and it runs from January2,1985,to August29,1997.There is some survivor bias in the early years of Micropal data.4We calculate total-return time series~reinvest-ing dividends on ex-dates!and also create four equal-weighted fund indices: one for each of the fund categories above,and one for all funds in our sam-ple.For each index,we define its excess return as its own return minus that of the S&P500index~which does not include dividends;we do not use the Lipper index of S&P500funds as it is not available daily for much of this period!.We run the indicator-variable regression~1!,described above,and report the results in Panel A of Table II.These results mirror those from Lipper.Fund prices are significantly in-f lated at quarter ends,especially year ends,and there is little or no inf la-tion at other month ends.While these tests show that the mean return is higher on quarter ends,it is also important to ask if this inf lation is wide-spread across funds.To address this,we estimate regression~1!again,but replace the dependent variable with the percentage of funds that outper-formed the S&P on that day.We show these results in Panel B of Table II. We find80percent of funds beating the S&P on the last day of the fourth quarter,compared to37percent beating the S&P the next day.At the turn of other quarters,62percent beat the S&P on the last day,and40percent the next.In the fund categories,we see the strongest results among aggres-sive growth funds—91percent and34percent around the year-end,70per-cent and34percent around other quarter-ends—and the weakest among growth and income funds.Since growth and income is closest to the value categorization of Lipper,the pattern across fund categories matches that of Table I.Tables I and II show that equity funds are significantly overvalued at the ends of quarters,especially the fourth,compared to just before and after. We see this in the Lipper indices,in our own database,and in the fraction of funds beating the S&P500.The inf lation cuts across styles,but it is stron-gest in funds with a small-cap or growth orientation.It is worth noting that this is not a projection of any previously reported regularity in equity re-turns.The quarter-end results are completely novel,and the year-end results are not indicated in the extensive year-end literature.5Further,as discussed above,there are no market microstructure issues surrounding mutual fund NAVs like there are with individual stock prices,making the results all the more meaningful.4For example,zero of the463funds with Micropal data for some of1985die in1985,whereas one of the493similarly defined funds in the CRSP monthly mutual fund database with data for some of1985dies in1985.The analogous numbers for1990are29out of807in Micropal and 8of700in CRSP,and for1995it is66of2,063in Micropal and67of1,979in CRSP.5The closest would probably be Table III of Sias and Starks~1997!,which addresses a dif-ferent frequency~annual!,a different category of institutions~all of them!,and finds very different numbers.Sias and Starks also conclude that most of the turn-of-the year effect is due to individual investor trading,whereas we find strong evidence of turn-of-the-year effects due to specific institutions~mutual funds!trading.。
Chap004投资学(英)《Mutual Funds and Other Investment Companies》

• Equity funds
• Invest in stock, some fixed-income, or other securities
• Specialized sector funds
• Concentrate on particular industry
• Bond funds
• Specialize in fixed-income (bonds) sector
SEC regulation
The McGraw-Hill Companies, © 2013
64-6
4.3 Mutual Funds
• Investment Policies
• Money market funds
• Commercial paper, repurchase agreements, CDs
4-11 11
4.4 Costs of Investing in Mutual Funds
• Fee Structure
• Operating expenses: Costs incurred by mutual
fund in operating portfolio
• Front-end load: Commission or sales charge
54-5
4.2 Types of Investment Companies
• Other Investment Organizations
• Commingled Funds
• Partnership of investors pooling funds; designed for
trusts/larger retirement accounts to get professional management for fee
金融学期刊(JF)创刊以来50篇最经典论文

金融学期刊(JF)创刊以来50篇最经典论文1) Portfolio Selection证券组合选择Harry Markowitz Volume 7, Issue 1March 19522) Capital Asset Prices: A Theory Of Market Equilibrium Under Conditions Of Risk资本资产价格:风险条件下的市场均衡理论William F. SharpeVolume 19, Issue 3September 19643) Efficient Capital Markets: Review Of Theory And Empirical Work有效市场:理论与经验研究的评论Eugene F. FamaVolume 25, Issue 2May 19704) The Cross-Section Of Expected Stock Returns股票预期收益的横截面(分析)Eugene F. Fama, Kenneth R. FrenchVolume 47, Issue 2June 19925) Counterspeculation, Auctions, And Competitive Sealed Tenders反投机、拍卖和竞争性密封投标William VickreyVolume 16, Issue 1March 19616) A Survey Of Corporate Governance关于公司治理的调查Andrei Shleifer, Robert W. VishnyVolume 52, Issue 2June 19977) Legal Determinants Of External Finance外部融资的法律层面决定因素Rafael La Porta, Florencio Lopez-De-Silanes, Andrei Shleifer, Robert W. VishnyVolume 52, Issue 3July 19978) Corporate Ownership Around The World世界各地的企业所有权Rafael La Porta, Florencio Lopez-De-Silanes, Andrei ShleiferVolume 54, Issue 2April 19999) On the Pricing Of Corporate Debt: The Risk Structure Of Interest Rates 企业债务的定价:利率的风险结构Robert C. MertonVolume 29, Issue 2May 197410) Financial Ratios, Discriminant Analysis And Prediction Of Corporate Bankruptcy财务比率,判别分析和企业破产预测Edward I. AltmanVolume 23, Issue 4September 196811) The Modern Industrial Revolution, Exit, And The Failure Of Internal Control-Systems近代工业革命,退出,和内部控制系统的失灵Michael C. JensenVolume 48, Issue 3July 199312) On Persistence In Mutual Fund Performance共同基金绩效的持久性Mark M. CarhartVolume 52, Issue 1March 199713) On The Relation Between The Expected Value And The Volatility Of The Nominal期望值和名义股票超额回报波动性的关系Lawrence R. Glosten, Ravi Jagannathan, David E. RunkleVolume 48, Issue 5December 199314) Returns To Buying Winners And Selling Losers: Implications For Stock Market Efficiency购买赢家和卖掉输家的回报:对股市效率的启示Narasimhan Jegadeesh, Sheridan TitmanVolume 48, Issue 1March 199315) Informational Asymmetries, Financial Structure, And Financial Intermediation信息不对称、金融结构和金融中介Hayne E. Leland, David H. PyleVolume 32, Issue 2May 197716) The Pricing Of Options On Assets With Stochastic Volatilities具有随机波动性资产期权定价John Hull, Alan WhiteVolume 42, Issue 2June 198717) Efficient Capital Markets: II有效资本市场IIEugene F. FamaVolume 46, Issue 5December 199118) Does The Stock Market Overreact?股市反应过度了吗?Werner F. M. De Bondt, Richard ThalerVolume 40, Issue 3July 198519) Multifactor Explanations Of Asset Pricing Anomalies对资产定价异常现象的多因素解释Eugene F. Fama, Kenneth R. FrenchVolume 51, Issue 1March 199620) The Capital Structure Puzzle资本结构之谜Stewart C. MyersVolume 39, Issue 3July 198421) The Performance Of Mutual Funds In Period 1945-1964共同基金在1945年-1964年的绩效Michael C. JensenVolume 23, Issue 2May 196822) Debt And Taxes负债和税收Merton H. MillerVolume 32, Issue 2May 197723) What Do We Know About Capital Structure? Some Evidence From International Data我们对资本结构了解多少呢?来自国际数据的一些证据Raghuram G. Rajan, Luigi ZingalesDecember 199524) The Benefits Of Lending Relationships: Evidence From Small Business Data借贷关系的好处:来自小企业数据的证据Mitchell A. Petersen, Raghuram G. RajanVolume 49, Issue 1March 199425) Measuring And Testing The Impact Of News On Volatility衡量和检验新闻对波动性的影响Robert F. Engle, Victor K. NgVolume 48, Issue 5December 199326) Investor Psychology And Security Market Under- And Overreactions投资者心理和证券市场的过度反应/反应迟钝Kent Daniel, David Hirshleifer, Avanidhar SubrahmanyamVolume 53, Issue 6December 199827) Contrarian Investment, Extrapolation, And Risk逆向投资、外推法和风险Josef Lakonishok, Andrei Shleifer, Robert W. VishnyVolume 49, Issue 5December 199428) A Simple Model Of Capital Market Equilibrium With Incomplete Information 一个简单的信息不完全的资本市场均衡模型Robert C. MertonVolume 42, Issue 3July 198729) Insiders And Outsiders: The Choice Between Informed And Arms-Length DebtRaghuram G. RajanSeptember 199230) Why Does Stock Market Volatility Change Over Time? 为什么随着时间推移股市波动性会发生变化?G. William SchwertVolume 44, Issue 5September 198931) The Determinants Of Capital Structure Choice资本结构决策的决定因素Sheridan Titman, Roberto WesselsVolume 43, Issue 1March 198832) Inferring Trade Direction From Intraday Data从当日数据推断交易方向Charles M.C. Lee, Mark J. ReadyVolume 46, Issue 2June 199133) The New Issues Puzzle新股发行之谜Tim Loughran, Jay R. RitterVolume 50, Issue 1March 199534) The Limits Of Arbitrage套利限制Andrei Shleifer, Robert W. VishnyVolume 52, Issue 1March 199735) Noise噪声Fischer BlackVolume 41, Issue 3July 198636) Investor Protection And Corporate Valuation投资者保护和公司估值Rafael La Porta, Florencio Lopez-De-Silanes, Andrei Shleifer, Robert Vishny Volume 57. Issue 3June 200237) The Theory Of Capital Structure资本结构理论Milton Harris, Artur RavivVolume 46, Issue 1March 199138) The Long-Run Performance Of Initial Public Offerings首次公开发行股票的长期绩效Jay R. RitterVolume 46, Issue 1March 199139) Initial Public Offerings And Underwriter Reputation首次公开发行和承销商商誉Richard Carter, Steven ManasterVolume 45, Issue 4September 199040) Dividend Policy Under Asymmetric Information信息不对称下的股利政策Merton H. Miller, Kevin RockVolume 40, Issue 4September 198541) A Simple Implicit Measure Of The Effective Bid-Ask Spread In An Efficient Market买卖价差(Bid-Ask Spread)有效市场下有效买卖差价的简单内隐测量Richard RollSeptember 198442) Empirical Performance Of Alternative Option Pricing Models备选的期权定价模型的实证绩效Gurdip Bakshi, Charles Cao, Zhiwu ChenVolume 52, Issue 5December 199743) Compensation And Incentives: Practice vs. Theory薪酬和激励:实践和理论George P. Baker, Michael C. Jensen, Kevin J. MurphyVolume 43, Issue 3July 198844) Are Investors Reluctant To Realize Their Losses?投资者不愿意意识到他们的损失?Terrance OdeanVolume 53, Issue 5October 199845) Size And Book-To-Market Factors In Earnings And Returns盈余和收益的规模和账面-市值因素Eugene F. Fama, Kenneth R. FrenchVolume 50, Issue 1March 199546) Security Prices, Risk, And Maximal Gains From Diversification证券价格、风险和来自多元化的最大收益John LintnerVolume 20, Issue 4December 196547) An Empirical Comparison Of Alternative Models Of The Short-Term Interest-Rate对短期利率备选模型的实证比较K. C. Chan, G. Andrew Karolyi, Francis A. Longstaff, Anthony B. SandersJuly 199248) Risk Management Coordinating Corporate Investment And Financing Policies风险管理协调企业投融资政策Kenneth A. Froot, David S. Scharfstein, Jeremy C. SteinVolume 48, Issue 5December 199349) Disentangling The Incentive And Entrenchment Effects Of Large Shareholdings解析大股东激励和壕沟防御效应Stijn Claessens, Simeon Djankov, Joseph P. H. Fan, Larry H. P. Lang Volume 57, Issue 6December 200250) Valuing Corporate Securities: Some Effects Of Bond Indenture Provisions 公司证券估值:债券契约条款的一些作用Fischer Black, John C. CoxVolume 31, Issue 2May 1976。
金融建模动量因子

您对动量因子的理解是什么呢?请大家积极回帖,一起来探讨!自从Jegadeesh和Titman首先在1993年Journal of Finance上发表了动量因子(Momentum Factor)的研究成果之后(Jegadeeshand Titman, Returns to Buying Winners and Selling Losers: Implications for Stock Market Efficiency, 1993,简而言之,动量因子就是采取逢高买进,逢低卖出的策略所取得的回报),由于它显著的超额回报率(market excess return),数十年来一直是学术界经久不衰的研究课题之一,研究范围包括各个资本市场,各种资产类型,各种时间跨度。
例如:•关于S&P的: Style Momentum Within the S&P 500 Index (Chen and De Bondt, 2004)和Cross-Asset StyleMomentum (Kim,2010)•美国行业/板块: Do Industries ExplainMomentum? (Moskowitz and Grinblatt,1999),Understanding the Nature of the Risks andSources of Rewards to Momentum Investing (GrundyandMartin, 1998)•美国小盘股: Bad News Travels Slowly: Size, Analyst Coverage, and the Profitability of MomentumStrategies (Hong et al, 1999)•欧洲股票市场: International MomentumStrategies,(Rouwenhorst, 1997)•英国股票市场: The Profitability of Momentum Investing, (Lui et al, 1999),Momentum in the UK Stock Market (Hon and Tonks,2001)•中国股票市场: Contrarian and Momentum Strategiesin the China Stock Market: 1993-2000 (Kang et al,2002), The “Value” Effect and the Market for ChineseStocks (Malkiel and Jun, 2009), Momentum andSeasonality in Chinese Stock Markets (Li, Qiu, and Wu, 2010) 和Momentum Phenomenon in the Chinese Class A and B Share Markets (Choudhry and Wu, 2009)•日本股票市场: Eureka! A Momentum Strategy that Also Works in Japan (Chaves , 2012)•澳洲股票市场: Do Momentum Strategies Work?: Australia Evidence, (Drew, Veeraraghavan, and Ye, 2004)•瑞士股票市场: Momentum and IndustryDependence (Herberger, Kohlert, and Oehler, 2009)•新兴股票市场: Local Return Factors and Turnover in Emerging Stock Markets, (Rouwenhorst, 1999)•前沿新兴股票市场: The Cross-Section of Stock Returns in Frontier Emerging Markets (Groot, Pang, and Swinkels,2012)•全球股票市场: Momentum Investing and Business Cycle Risk: Evidence from Pole to Pole, (Griffin et al,2002), International Momentum Strategies (Rouwenhoust, 1998), The Case for Momentum (Berger, Isael, Moskowitz, 2009)•外汇市场: Do Momentum Based Strategies Still Work In Foreign Currency Markets? (Okunev and White,2003), Interaction between Technical Currency Trading and Exchange Rate Fluctuations (Schulmeister,2006), Momentum in Stock Market Returns: Implications for Risk Premia on Foreign Currencies (Nitschka,2010), 和Currency Momentum Strategies (Menkhoff et al, 2011)•大宗商品市场: Momentum Strategies in Commodity Futures Markets (Miffre and Rallis, 2007), The Strategicand Tactical Value of Commodity Futures (Erb and Harvey, 2006)•技术分析: 52-Week High and MomentumInvesting (Georgeand Hwang, 2004).•公司盈利: Momentum Strategies (Chan et al,2006), Firm-specific Attributes and the Cross-section ofMomentum (Sagi and Seasholes, 2007)•在时间维度上: Market States and Momentum (Cooper, Gutierrezand Hameed, 2003),Time-Varying MomentumProfitability (Wang and Xu, 2010), Time SeriesMomentum (Moskowitz et al, 2011), 212 Years of PriceMomentum (Gezcy, 2013), A Century of Evidence onTrend Following (Hurst, Ooi, Pedersen, 2012), TwoCenturies of Trend Following (Lempérière, 2014).还有各种从价格动量 (price momentum)衍生出的变体,例如:•“新鲜”动量:Fresh Momentum (Chen, Kadan and Kose, 2009)•“残余”动量:Residual Momentum (Blitz, Huij and Martens, 2011)•CAPM/Fama-French“残余”动量:Some Tricks to Momentum (SocGen, 2012)•“双重”动量:Risk Premia Harvesting Through Dual Momentum (Antonacci,2013)•“共同”动量: Comomentum: Inferring Arbitrage Activity from Return Correlations (Lou and Polk, 2012)•趋势因子: Trend Factor: A New Determinant ofCross-Section Stock Returns (Han and Zhou, 2013)在跨多种资产的研究中,人们通常把动量因子(Momentum Factor)和价值因子(Value Factor)放在一起研究,例如: Global Tactical Cross-AssetAllocation: Applying Value and Momentum Across Asset Classes (Blitz and VanVliet, 2007), Value and Momentum Everywhere (Asness, Moskowitz, and Pedersen,2009), Using aZ-score Approach to Combine Value and Momentum in Tactical Asset Allocation (Wang and Kohard, 2012), 和Size, Value, and Momentum in International Stock Returns (Fama and French, 2011)也有和反转(Reversal/Mean Reversion)一起研究,例如:Momentum–Reversal Strategy (Yu and Chen, 2011), An Institutional Theory of Momentumand Reversal (Vayanos and Woolley,2010), Momentum and Mean Reversion across National Equity Markets (Balvers and Wu, 2006), Macromomentum: Returns Predictability in International Equity Indices (Bhojraj, 2001)至于动量因子产生的原因至今没有定论,投资者的行为偏差(behavior bias)算是其中一个,主要体现在投资者对于自己掌握的信息过于自信,从而导致资产价格对于新信息反应不足(underreaction): Investor Psychology and Security Market Under-andOver-Reactions(Daniel, Hirshleifer, Subrahmanyam,1998), Overconfidence, Arbitrage, and Equilibrium Asset Pricing (Daniel, Hirshleifer, Subrahmanyam,2001)其他类似的解释例如:When are Contrarian Profits Due to Stock Market Overreaction? (Lo and Mackinlay, 1990), A Model of Investor Sentiment (Barberis,Shleifer, Vishny, 1997), A Unified Theory of Underreaction, Momentum Trading and Overreaction in Asset Markets (Hong and Stein, 1997), Price Momentum andTrading Volume (Lee and Swaminathan, 1998),Underreactions and Overreactions:The Influence of Information Reliability and Portfolio Formation Rules (Bloomfieldet al, 1998), Rational Momentum Effects (Johnson, 2002)除此之外,还有从其他不同角度进行解释的,例如:•交易成本(Trading Cost): The Illusory Nature of Momentum Profits (Lesmond, Schill, and Zhou,2004), Trading Cost of Asset Pricing Anomalies (Frazzini, Israel and Moskowitz,2012)•横截面预期收益(Cross-sectional ExpectedReturns):Momentum is Not an Anomaly(Dittmar et al, 2007)•知情交易(Informed Trading): Momentum and Informed Trading (Hameed et al, 2008)•市场情绪(Sentiment): Sentiment and Momentum(Doukas et al, 2010)•经济周期 (Business Cycle): Momentum, Business Cycle, and Expected Returns(Chordia and Shivakumar,2002)•文化差异 (Cultural Difference): Individualism and Momentum around the World (Chui, Titman and Wei,2009)•过度协方差(Excess Covariance): Momentum and Autocorrelationin Stock Returns(Lewellen, 2002)•避税 (Tax Loss Harvesting): PredictingStock Price Movements from Past Returns: The Role of Consistency and Tax-LossSelling (Grinblatt and Moskowitz, 2004)•宏观风险溢价(Macroeconomic Risk Premium): Momentum Profits, Factor Pricing and Macroeconomic RiskFactor (Zhang, 2008)•前景理论(Prospect Theory ): Prospect Theory, Mental Accounting, and Momentum(Grinblatt and Han,2004)•处置效应(Disposition Effect): The Disposition Effect and Underreaction to News(Frazzini, 2006),其中前景理论与处置效应均指投资者在处理股票时,倾向卖出赚钱的股票、继续持有赔钱的股票。
SSRN-id676246
The ABCs of Mutual Funds:On the Introduction of Multiple Share ClassesVikram NandaUniversity of MichiganZ.Jay WangUniversity of IllinoisLu ZhengUniversity of MichiganJanuary2005We are grateful to comments from Brad Barber,Andrew Caffrey,Sean Collins,Jeffrey Pontiff,Brian Reid and sem-inar participants at the2005AFA annual meetings,the University of California at Davis,University of Illinois at Urbana-Champaign,the University of Michigan Business School,and the Delegated Portfolio Management Confer-ence at the University of Oregon.We thank Jonathan Cohn for excellent research assistance.Contact Information:Vikram Nanda,Ross School of Business,701Tappan St.,Ann Arbor,MI-48109-1234.Phone: 734-763-0105;e-mail:vnanda@;Z.Jay Wang,College of Business,1206S.6th Street,Champaign,IL 61820.Phone:217-265-6598;e-mail:zhiwang@;Lu Zheng,Ross School of Business,701Tappan St.,Ann Arbor,MI-48109-1234.Phone:734-763-5392;e-mail:luzheng@The ABCs of Mutual Funds:On the Introduction of Multiple Share ClassesAbstractIn the1990s,many load funds introduced additional share classes that give investors the choice of paying back-end loads and/or annual fees instead of front-end loads.The transition to a multiple-class structure provides a well-controlled setting for research with regard to investor clienteles and fund performance.We examine(a)whether the new fee structures increase the level and volatility of fund cashflows by attracting new investor clienteles;(b)whether changes induced in fundflow characteristics by the new investor clienteles affect fund performance—despite little change in fund management and investment objectives.Wefind that investors in the new classes tend to have a shorter investment horizon and greater sensitivity to past fund performance than investors in the front-end load class.Introducing the new classes attracts significantly more new money in thefirst one to two years,controlling for performance and other fund attributes.The downside,however, is that about two years after introducing the new classes,funds experience a significant drop in performance,which is expected to substantially erode the cashflow growth induced by the new classes.The results in the paper have significant implications for empirical studies of mutual funds using the data in the1990s.1IntroductionOne of the major innovations that took place in the mutual fund industry in the1990s was the introduction of multiple share classes by load funds.By the end of2002,about50percent of U.S. equity funds offered more than one share class.The new share classes allow investors to replace front-end loads with back-end loads and/or higher annual fees.From a research perspective,this phenomenon is important to study for at least two reasons.First,the transition to a multiple-class structure provides a well-controlled setting for research regarding investor clienteles and fund performance,while keeping fund management and investment objectives virtually unchanged.We propose and test the hypothesis that the new share classes,by attracting different investor clienteles, will significantly alter the characteristics of fund cashflows and fund performance.Second,with the introduction of new classes,researchers face the challenge offinding appropriate ways to treat multiple-class funds in empirical studies of mutual funds.Mutual funds are sold to retail investors through various distribution channels.The traditional and still important distribution channel is the so-called‘advisor’or‘broker’intermediated chan-nel in whichfinancial planners and brokers play a primary role in selling a fund and providing information and other services to investors.Broker-intermediated mutual funds have traditionally been distributed with a front-end load,where the load represents the sales charge paid to brokers. The mutual fund marketplace changed dramatically after the1980s with the arrival and evident popularity of directly marketed no-load mutual funds,characterized by low distribution costs and relatively limited investor services.In the1990s,broker intermediated funds expanded their menu and began to offer share classes with alternative fee structures.The three common share classes are denoted A,B and C.The A class is the traditional class in which investors pay a front-end load and an annual12b-1fee of25to35basis points to compensate brokers.The B class charges a contingent deferred sales load(CDSL)up to5percent upon exit and an annual12b-1fee of about 1percent.This back-end charge typically declines with the investment periods.Finally,the C class usually charges a1percent contingent deferred sales load if redeemed in thefirst year and a similar 1percent annual12b-1fee.An advantage of the class B shares,however,is that they are converted into class A shares after six to eight years,thereby lowering the annual12b-1fee.We begin our analysis by examining whether a switch from a single A class fund to a multiple-class fund increases the overall fund cash inflow.Controlling for performance and other fund characteristics,wefind that funds with multiple share classes attract more money primarily during thefirst year after the introduction of new share classes.The cashflow differences between multiple-class funds and the control group of no-load funds cannot be attributed to differences in cashflow prior to the introduction of new share classes.The increase in cash inflow in thefirst year after adopting a multiple-class structure,controlling for factors such as performance,expenses,and fund size,is estimated to be about12percent.Given the median fund size in2002,this is of the order of16million dollars.The new money growth slows down in the second year and later,following the switch to a multiple-class structure.We next investigate the characteristics that affect a fund family’s decision to introduce new share classes.An obviously important consideration is the cost of introducing new classes and how the cost burden can be shared across funds.The fact that there may be economies of scale in introducing new classes is suggested by the observation that,when fund families introduce new classes,they tend to do so for many of their funds at the same time.If economies of scale are important,larger fund families are in a better position to bear the costs and,hence,more likely to introduce new classes.Consistent with this notion,wefind that larger fund families are indeed significantly more likely to introduce new share classes than smaller families.Another interesting finding is that fund families have a significantly higher probability of switching to a multiple-class structure when they experience a period of good performance—suggesting some strategic timing behavior on the part of fund families.Wefind no evidence that fund families introduce new share classes in response to high cashflows.To understand the nature of investor clienteles,we examine whether the new share classes attract investors with different investment horizon and sensitivity to past fund performance than the existing A share class.The fact that the multiple share classes on a fund obtain the same return before deducting expenses and sales charges allows us to compare the cashflow responses to different fee structures in a setting,where performance and other fund characteristics are the same.Given the structure of the sales charges associated with the fund classes,it is apparent that investors with relatively long investment horizons will prefer the A class with its up-front load andlower annual charges,while those with short and uncertain horizons will prefer the C or B class. Investor preferences may also be determined by the value the investor places on havingflexibility to move between investments.Hence,an investor who believes that she might identify good investment opportunities in the future or has some concern about the quality of a fund might prefer class C to the other two classes.The empirical prediction that follows from the above discussion,therefore,is that the cashflow response to fund performance and the overall cashflow volatility should be the highest for the C class.Consistent with the above prediction,the empirical results show different cashflow patterns for the different share classes.The introduction of new classes may also have an impact on fund performance,as it changes the overall volatility and the level of fund cashflows.It has been argued in the literature that higher cashflow volatility and level will tend to have an adverse effect on a fund’s performance on account of liquidity costs and decreasing returns to scale(see e.g.,Edelen(1999),Nanda,Narayanan and Warther(2000),Chen et al.(2002),Rakowski(2002),Stein(2003),Berk and Green(2004),and Johnson(2004)).This argument plays an important role in explaining the empiricalfinding that performance persistence and the smart money effect(see Gruber(1996),Carhart(1997)and Zheng (1999))are short lived.As investors chase past performance,the increase in the volatility and level of fund cashflow will tend to equalize the expected abnormal returns across funds.Hence,even if performance reflects superior investment skills,we would not expect the performance and the smart money effect to persist in equilibrium.By focusing on the change in performance upon the adoption of a multiple-class structure,we are able to investigate the extent to which performance is adversely affected by the introduction of the multiple share class structure,while holding managerial ability and investment objectives virtually unchanged.We study the impact of the multiple-class structure on fund performance by examining the change in risk-adjusted returns for the A share class of multiple class funds.Our results indicate that,in the second and subsequent years following the introduction of new share classes,the A share classes experience a significant drop in pared to no-load funds,the four-factor adjusted performance is found to decline by about1.2to1.7percent on an annual basis, both before and after controlling for expenses.The estimated impact of fund performance on cash flows suggests that the new money growth would decrease by about2to3percent on an annualbasis due to the performance drop.On the basis of thisfigure,we estimate that four years after the switch to a multiple-class structure,over half of the12percent additional new money growth induced by the new classes is eroded.The empirical evidence suggests trade-offs in switching to a multiple-class structure:funds attract additional cashflows,which in turn hurt fund performance by increasing fund size and cashflow volatility.We also examine the change in expenses for the A share classes after introducing the new pared to no-load funds,multiple-class funds tend to charge lower operating expenses (total expense minus the12b-1fee)before the switch.Wefind some evidence that multiple-class funds further reduce their operating expenses in the years after the switch.Furthermore,the reduction in operating expenses can be explained by the increase in fund and fund family size, which indicates economies of scale in operating mutual funds.The12b-1fees of the A share classes rise slightly relative to those of no-load funds after introducing the new shares.The introduction of multiple share classes raises significant new issues for empirical studies of mutual funds.What should be the unit of observation:a share class or a fund?While the main mutual fund data sources,for example,CRSP and Morningstar,provide information at the share class level,multiple share classes of a fund have the same underlying portfolio and the same before-fee performance.Most investment and management decisions are also made at the fund level rather than at the share class level.Our results indicate that,when analyzing fund level data,it is not only important to estimate fund cashflow,performance,and other characteristics by aggregating across different share classes of the same asset portfolio,but also important to control for the effects of the multiple share class structure.Ourfindings have important implications for empirical studies of mutual funds using data after1990,during which multiple share class structure emerged and was widely adopted.For studies of performance evaluation,our results indicate the importance of controlling for the change in fund performance due to the multiple share class structure,since such a change does not reflect a change in management investment ability.For studies of cashflow patterns and investor behavior,it is also important to control for the temporary shock in cashflows due to the change in investor clienteles associated with the new share classes.The rest of the paper is organized as follows.Section2reviews the relevant literature.Section3 provides institutional details about the share class structure.Section4describes data and summarystatistics.Section5presents methodology and empirical results.We conclude in Section6.2Literature ReviewThe existing research indicates that mutual fundflows are affected by past fund performance, load and expense charges,and fund advertising.Numerous studies,for example,Gruber(1996), Chevalier and Ellison(1997),Goetzmann and Peles(1997),Sirri and Tufano(1998),Del Guercio and Tkac(2002),and Nanda,Wang and Zheng(2004)have demonstrated that mutual fundflows chase past fund performance,especially stellar performance.1Bergstresser and Poterba(2002) suggest that after-tax returns have more explanatory power than pretax returns in explaining fund inflows.Sirri and Tufano(1998)show that fundflows are negatively related to total fund expenses. Wilcox(2003)and Barber,Odean and Zheng(2004)find evidence that mutual fund investors pay more attention to load charges than expense ratios.Jian and Wu(2000),Cronqvist(2003), Gallaher,Kaniel and Starks(2004)and Reuter and Zitzewitz(2004)document that advertisement help funds attract more new money.Evidence suggests that the mutual fund industry exploits the patterns in fundflows to maximize total assets under management.Brown,Harlow and Starks(1996)and Chevalier and Ellison(1997)find evidence that fund managers alter the riskiness of their portfolios at the end of the year to take advantage of the nonlinear shape of the performance-flow relation.Nanda,Wang and Zheng (2004)indicate that some fund families adopt strategies to increase the likelihood of creating a star fund in order to maximize their overall cashflows.Mutual funds and complexes generally want to maximize the assets under management.Offering new fund classes without front-end loads may attract moreflows,but the new money attracted to the fund may increase cashflow volatility and hurt fund performance.Nanda,Narayanan and Warther(2000)develop an equilibrium model of mutual fund size and structure,where fund performance can decline with the increase in fund size and cashflow volatility.Based on their model,funds attracting shorter horizon investors will be associated with greater cashflow volatility 1For evidence on performance persistence,see for example Blake,Elton and Gruber(1993),Goetzmann and Ibbotson(1994),Brown and Goetzmann(1995),Malkiel(1995),Elton,Gruber and Blake(1996),Gruber(1996),and Carhart(1997).and worse performance.In a rational investor model,Berk and Green(2004)argue that new information on managerial ability will affect the cashflow.However,the increase in cashflow may have a negative impact on performance due to decreasing returns to scale.Edelen(1999) and Rakowski(2002)provide empirical evidence on the negative relationship between cashflow volatility and fund performance.Stein(2003)investigates the importance of liquidity costs on the choice of an open-end or closed-end ing simulations,Johnson(2004)shows that short-term investors impose greater liquidity costs on a fund than long-term investors.Chen et al.(2002)document that fund size adversely affects performance after controlling for other fund attributes.A number of papers have studied the decisions of mutual fund families to start new funds and new share classes,for example,Khorana and Servaes(1999)and Zhao(2002).Recently researchers have begun to examine the multiple share class structure of mutual funds.In an Investment Company Institute(ICI)study,Reid and Rea(2003)provide a comprehensive summary of mutual fund distribution channels and distribution costs for the past25years.Livingston and O’Neal (1998)compare the effect on investors of distribution fees for mutual funds with different types of sales arrangements.Lesseig,Long and Smythe(2002)document that multiple share class funds have lower administrative fees but higher management fees than funds with only a single class. However,there is little empirical research on how the multiple share class structure affects fund cashflows and performance.Our studyfills this void in the mutual fund literature by analyzing the effects of introducing multiple share classes on fund cashflows,investor clienteles,performance, and expenses.As many funds introduced multiple share classes in the1990s,it becomes important to analyze fund level cashflow,performance,and other characteristics by aggregating across different share classes of the same asset portfolio.A number of recent papers,for example,Chen et al.(2002)and Reuter(2002),adjust for share classes.Nevertheless,the cashflows and performance of a fund with multiple share classes might well differ from those of a fund with a single share class due to the fee structures and possibly investor clienteles.As a result,it could be important when analyzing fund level performance and cashflow patterns to take into account the effects of multiple share classes. In this paper,we document that the multiple share class structure is a significant determinant offund cashflows and performance.3Institutional BackgroundIn the1990s,most broker intermediated mutual funds introduced new share classes.2Multiple share classes of the same fund obtain returns from the same underlying investment portfolio but differ in fees,expenses,and sales charges.We use the criteria outlined by the ICI to identify share classes.In our study,a fund is defined as a multiple-class fund if it offers A,B,and C shares or A and B shares.3Among the1,731diversified equity funds in our sample,48percent have multiple share classes at the end of2002.In this section,we provide some institutional details about various share classes based on the ICI study by Reid and Rea(2003).In particular,we focus on alternative load and fee structures.We also discuss the empirical implications with respect to investors’choice of share classes.3.1Basics of Share ClassesClass A shares charge investors an up-front load as a percentage of total investment at the time of purchase.For example,if an investor invests$1,000in A shares with a5percent front-end load, she pays a$50load charge to the broker and has a net position of only$950in the fund.A typical load structure involves a maximum front-end load charged to investments below certain threshold (e.g.,$25,000)and a schedule of load reductions for large investments.For investments above1 million dollars,funds typically waive the load charges.Besides the front-end load,class A shares also charge an annual12b-1fee to compensate brokers andfinancial advisors.Under SEC Rule 12b-1,a fund can use its assets to pay for distribution related services.For class A shares,the annual12b-1fee typically ranges from25to35basis points.2Bergstresser,Chalmers,and Tufano(2004)analyze possible benefits to consumers of brokered fund distribution. They conclude that it is difficult to identify the tangible benefits delivered by brokers.3Multiple-class funds offer other class types as well.For example,some share classes are specially designed for institutional investors or retirement plans.However,unlike A,B,and C classes,these share classes do not have an industry-wide standard regarding load and fee structures.Moreover,the naming of these share classes is often at the discretion of fund management,making classifications extremely difficult.For these reasons,we focus exclusively on the A,B,and C classes of multiple-class funds,which are offered to retail investors.Most multiple-class funds offer either A,B,and C shares or A and B shares.Very few funds offer the combination of A and C or B and C.Hence, we exclude them from our analysis.Instead of a front-end load,class B investors pay a contingent deferred sales load(CDSL),also called a back-end load.The CDSL is contingent upon share redemptions and is based on the lesser of the original cost of shares at the time of investment and the current market value of the shares.A typical CDSL structure involves a maximum back-end load(about5%)charged to investments redeemed during thefirst year and a schedule of load reductions for investments held longer.The pace of back-end load reductions is typically1percent per year.Hence,if an investor holds the classB shares for longer than six or seven years,she is not charged any back-end load in case of redemption.Class B shares usually charge an annual12b-1fee of100basis points.However,B shares are typically converted into A shares after six to eight years,resulting in a reduction of the 12b-1fee from100basis points to that of A shares.Like class B investors,shareholders of the C class pay for distribution related services through a combination of a CDSL and an annual12b-1fee(typically100basis points,referred to as the level-load).However,the load and fee structure of class C differs from that of class B along two dimensions.First,the CDSL is set at1percent and is triggered only if an investor redeems her shares during thefirst year of investment.For shares held for more than one year,the CDSL is normally waived.Second,unlike B shares,C shares are not converted into A shares after six to eight years.In other words,class C investors pay the100-basis-point annual12b-1fee for as long as they hold the C shares.3.2Choice between A,B,and C ClassesFor multiple-class funds,the different share classes are issued on the same underlying asset portfolio and thus have the same return before loads and expenses.Since the share classes typically have the same non-distribution related expenses,the difference in net returns(after loads and expenses) is mainly driven by the different payment arrangements for distribution costs.Thus,investment horizons play an important role in determining the share class that would maximize an investor’s net returns.Reid and Rea(2003)demonstrate how the net returns of the three share classes depend on investment horizons.For investors with short investment horizons(one to six years),class C shares deliver the highest net returns.For investors with intermediate investment horizons(seven toeight years),classes B and C perform better than class A.For long term investors with investment horizons over eight years,class A dominates the other two classes.Besides investment horizons, investor preferences may also be affected by the value an investor places on havingflexibility to move between investments,without incurring significant costs.The empirical prediction that follows from the above discussion,therefore,is that the cashflow response to fund performance and the overall cashflow volatility should be higher for class C than for class A or B.3.3No-load Funds and Single A Class FundsIn recent years,other distribution channels have emerged to compete with the traditional‘advisor’or‘broker’intermediated channel.Among the most successful ones are the‘direct’channel and the ‘supermarket’channel.The majority of the funds sold through these channels are no-load funds, which usually have a single class.A typical no-load fund has no sales load and an annual12b-1fee of less than25basis points.Hence,compared to the A,B,or C share class in a multiple-class fund, no-load funds have significantly lower distribution costs.To keep distribution costs low,these funds carry out transactions with investors either directly as in the‘direct’channel or through discount brokers that offer mutual funds from a large number of fund sponsors.The latter channel is referred to as the‘supermarket’channel.Some load funds have not adopted the multiple-class structure and only offer an A share class.4 These funds have load and fee structures that are similar to those of the A class of multiple-class funds,and are distributed mostly through the‘advisor’or‘broker’intermediated channel.4Data4.1Definition of VariablesOur data sample is based on the mutual fund database compiled by the Center for Research in Security Prices(CRSP).This data set provides information on fund complex,monthly total net assets(TNA),monthly returns,and annual characteristics(e.g.,expense ratio,12b-1fee,load, 4Funds that only offer a single B or C class are rarely observed.turnover ratio)for open-end mutual funds,including defunct funds.For our study we include all diversified U.S.equity funds over the period from January1993to December2002,for which we manually identify fund class information.5We focus on the post-1992period during which the majority of multiple share classes emerged.The CRSP mutual fund database treats the multiple share classes offered by a fund as different entities.We manually identify the multiple share classes of a fund according to fund names.For most share classes,the recorded names provide us with information about the nature of the classes (A,B,C,or no-load).6To ensure the accuracy of the class coding,we verify the distribution-related costs(sales loads and12b-1fees)for each reported share class based on the criteria discussed in Section3.We construct the fund level variables by aggregating across the share classes.For our analyses,we use both fund level and class level information.The new money or cashflow of a multiple-class fund is calculated as the sum of new money across all share classes.For each share class,new money is defined to be the dollar change in TNA, net of price appreciation in the class assets.Assuming that new money is invested at the end of each month,the cashflow for class i in month t is given by(Newmoney)it=(TNA)it−(TNA)i,t−1∗(1+R it),(1) where R it is the rate of return of class i in month t.For a multiple-class fund f,the fund level new money is(Newmoney)ft=X i=A,B,C(Newmoney)it.(2) Normalizing the new money by the fund level TNA at the beginning of the month gives a measure for the fund level new money growth:(Newmoneygrowth)ft=(Newmoney)ftP i=A,B,C i,t−1.(3)The fund level turnover ratio,expense ratio,12b-1fee,non12b-1expense(expense ratio net of 12b-1fee),and total load are calculated as the TNA-weighted average of the corresponding class level measures.5To narrow down to a sample of diversified equity funds,we select all open-end equity funds in the CRSP data and then exclude sector funds,international funds,and balanced funds.6For example,AIM Large Cap Growth Fund/A,AIM Large Cap Growth Fund/B,and AIM Large Cap Growth Fund/C are identified as the A class,B class,and C class of the AIM Large Cap Growth Fund,respectively.Finally,we calculate risk-adjusted returns to measure the performance of funds and share classes. Specifically,we calculate the CAPM one-factor,Fama-French(1993)three-factor,and Carhart (1997)four-factor adjusted returns at both the class and fund levels.For a multiple-class fund, the fund abnormal return is the TNA-weighted average of its class abnormal returns.We use the following OLS regressions to estimate factor loadings andαmeasures:R it−RF t=αi+βiRMRF RMRF t+e it,(4) R it−RF t=αi+βiRMRF RMRF t+βiSMB SMB t+βiHML HML t+e it,(5) R it−RF t=αi+βiRMRF RMRF t+βiSMB SMB t+βiHML HML t+βiMOM MOM t+e it,(6) where R i is the rate of return of class i,RF is the one month T-bill rate,R m is the rate of return of the market,RMRF≡R m−RF is the excess market return,SMB is the rate of return on the mimicking portfolio for the size factor in stock returns,HML is the rate of return on the mimicking portfolio for the book-to-market factor in stock returns,MOM is the rate of return on the mimicking portfolio for the momentum factor in stock returns,αis the excess return of the corresponding factor model,andβs are the factor loadings of the corresponding ing the estimated factor loadings(βs)and excess returnα,we define the risk-adjusted return(αit)as7αit≡αi+e it.(7) 4.2Summary StatisticsTable1reports summary statistics for multiple-class funds,no-load funds and single A class funds. The number of multiple-class funds increased dramatically from40in1993to838in2002.The number of no-load funds also increased significantly from321in1993to768in2002.In contrast, the number of single A class funds decreased from313to125during the same period.As also shown in Figure1,the difference reflects the industry trend that many funds switched to a multiple-class structure by adding B and C classes to the existing A class during the sample period.Multiple-class funds in general have higher TNAs than no-load funds and single A class funds:In2002, the median TNA of multiple-class funds is135million while the median TNA of no-load funds 7The test results remain similar if we use a rolling window of the previous36months fund returns to estimate the factor loadings and use the current month fund return to calculateαit.。
FMI7e_ch23Mutual Fund Operations(金融市场好机构—7e, by Jeff Madura))

Investors share the gains or losses generated by the fund
Regulation and taxation
Mutual funds must register with the SEC and provide a prospectus Mutual funds are regulated by state laws If a mutual fund distributes 90 percent or more of its taxable income to shareholders, it is exempt from taxes on dividends, interest, and capital gains
8
Background on Mutual Funds (cont’d)
Types of funds (cont’d)
Hedge funds: Sell shares to wealthy individuals and financial institutions and use the proceeds to invest in securities Differ from open-end funds because:
1
Chapter Outline
Background on mutual funds Stock mutual fund categories Bond fund categories Growth and size of mutual funds Performance of mutual funds Mutual fund scandals
Mutual Fund Flows and Performance in Rational Markets
would like to thank th-lang Chen, Gian Luca Clementi, Jeff Coles, Burton Hollifield, Mike Lemmon, David Musto, Walter Novaes, George Pennacchi, Peter Tufano, Uzi Yoeli and Lu Zheng for their helpful comments and suggestions.
Malkiel (1995, p. 571) concludes that the “study of mutual funds does not provide any reason to abandon a belief that securities markets are remarkably efficient.” In their widely used text book, Ross, Westerfield and Jaffe (2002, p. 353) explain that if the market is “efficient in the semistrong form” average active mutual fund returns should be be the same as the market as whole. They then continue: “the finding that they [active fund managers] do not outperform the market indices is consistent with semistrong-form and weak-form efficiency.” The implication is that stocks are so well priced that not even the best active managers can consistently make money by using their superior ability. From an economic point of view, this implication, were it true, would be troubling. Clearly, the most talented money managers have abilities that are in short supply and could be productively deployed in other activities. One would think these managers would choose to apply their talents in areas where they would reap the highest rewards. If all performance is due to luck, there should be no reason to reward these talents. Yet, in reality, managers appear to reap rich rewards from superior past performance. In the face of this evidence many researchers have concluded that a consistent explanation of these regularities is impossible without appealing to behavioral arguments that depend on irrationality, or to elaborate theories based on asymmetric information or moral hazard. One thing that has been missing from this debate is a clear delineation of what a fully rational model with no moral hazard or asymmetric information implies about the characteristics of active portfolio managers. Before appealing to these additional effects we believe it makes sense to first establish which behaviors in the data are qualitatively and quantitatively consistent with more direct explanations. Our simple model of active portfolio management and fund flows provides a natural benchmark against which to evaluate observed returns, flows, and performance outcomes in this important sector of the financial services industry. Using this model we show the effects discussed above are generally consistent with a fully rational and competitive market for capital investment, and with rational, self-interested choices by fund managers who have differential ability to generate abnormal returns. The model combines three elements. There is competitive provision of capital by investors to mutual funds. There is differential ability to generate high average returns across managers, but decreasing returns to scale in deploying these abilities. Finally, there is learning about managerial ability from past returns. Some of these features have been examined in other models. Our contribution is to show that together they can reproduce the salient features of the empirical evidence as an equilibrium outcome in a rational model. The paper’s main insights are as follows. Investments with active managers do not outperform passive benchmarks as a consequence of the competitiveness of the market for 2
物流英语(05362)课后词汇 全集

词汇 2
活动, 行动 令人惊 异的 每年的 听众, 观众 平均的
十亿的
人民币 圆
会议, 讨论会, 协商会 自信 的,确信 的 十年, 十
发展
专家, 行家
前线
销售商 管理仓库
GDP(gros s domestic product)
growth
headway herald
executiv e factor
flexibil ity gender
integrat ion
internsh ip
manageri al
manufact ure
消费者
公司办 公室 (datum 的复数形 式)数据 纪律, 学科
配送
不同 的,变化 多的 分散, 多种 处于支 配地位 干劲 出现 种族的 摘录, 选录 管理人 员 因素
classify company
extent
offer
pattern
traditio nally
Suppleme ntary Vocabula ry
arbitrar y
典型 的,象征 性的 最后 的,最终 的
普遍 地,到处
分布广 泛的,普 遍的
意愿, 心甘情愿
词汇 2
可适用 的,可应 用的
分类, 分级
区分
比率
主要地
竞争
(运货 的)船, 承运人
中间人
货运代 理 经纪人
词汇 1
充分地
影响, 感动 分配, 安置 在旁 边,到旁 边 帮助 可利用 的 基础, 根据 经纪人 (运货 的)船, 承运人
circumst ance
competit ion
On persistence in mutual fund performance
On Persistence in Mutual Fund PerformanceAuthor(s): Mark M. CarhartSource: The Journal of Finance, Vol. 52, No. 1, (Mar., 1997), pp. 57-82Published by: Blackwell Publishing for the American Finance AssociationStable URL: /stable/2329556Accessed: 07/04/2008 11:55Your use of the JSTOR archive indicates your acceptance of JSTOR's Terms and Conditions of Use, available at/page/info/about/policies/terms.jsp . JSTOR's Terms and Conditions of Use provides, in part, that unless you have obtained prior permission, you may not download an entire issue of a journal or multiple copies of articles, and you may use content in the JSTOR archive only for your personal, non-commercial use.Please contact the publisher regarding any further use of this work. Publisher contact information may be obtained at /action/showPublisher?publisherCode=black .Each copy of any part of a JSTOR transmission must contain the same copyright notice that appears on the screen or printed page of such transmission.JSTOR is a not-for-profit organization founded in 1995 to build trusted digital archives for scholarship. We enable the scholarly community to preserve their work and the materials they rely upon, and to build a common research platform that promotes the discovery and use of these resources. For more information about JSTOR, please contact support@.。
valuing active managers,fees,and fund discounts
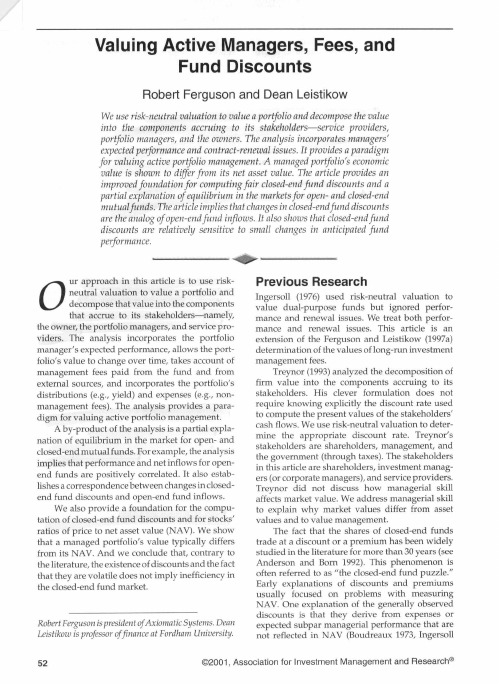
1976, and, particularly. Chance 1997). A second explanation is that the tax liability on unrealized capital appreciation does not show up in NAV (Malkiel 1977). A third argument is that illiquid assets (such as letter stock and private placements) are overvalued in the reported NAV (Malkiel). Lee, Shieifer, and Thaler (1991) claimed that the factors these previous researchers focused on cannot explain all of the closed-end fund puzzle. Lee et al. asserted that the factors do not answer the following questions: • why investors pay a premium for new closedend funds when existing closed-end funds trade at a discount (Weiss 1989; Peavy 1990), • why, after 24 weeks, discounts are the norm for stock funds (Weiss), • why discounts appear to be mean reverting (Sharpe and Sosin 1975), • why seemingly profitable trading strategies can be derived from publicly available information on discounts (Thompson 1978; Brauer 1988), • why prices of closed-end fund shares rise to reported NAVs as termination, either through a liquidation or an open ending, approaches (Brauer 1984; Brickley and Schallheim 1985), • why discounts are so volatile, and • why there is no correlation between premium/ discount changes and interest rate changes (Leeetal). They concluded that discounts and their volatility cannot be explained by the present value of expenses or expected subpar managerial performance. The theory we present is consistent with the points made by Boudreaux (1973), Chance, Ingersoll (1976), and Malkiel. It also explains all the questions raised by Lee et al. Early contributors to the development of using risk-neutral valuation to value the structures of investment management fees include Grinblatt and Titman (1989) and Margrabe (1978). But the Ferguson and Leistikow 1997 papers provide the most complete previous discussion of this process. Boudreaux (1973) and Chance made talent relevant by assuming that future trading is profitable or not. This approach can be viewed as an attempt to make the portfolio "untraded," in the same sense that we use here, by making its future positions unknown now. Neither author, however, explained the crucial role of the marginal shareholder in forcing open-end fund values to NAV. Boudreaux (1973, 1974) recognized the concept of an implied discount or premium. Our model implies a positive relationship between past performance and open-end fund (relative) net inflows. This implication is supported by
出师表原文及翻译

出师表原文及翻译出师表原文:先帝创业未半而中道崩殂(c U)今天下三分,益州疲(p i)弊,此诚危急存亡之秋也。
然侍卫之臣不懈于内,忠志之士忘身于外者,盖追先帝之殊遇,欲报之于陛下也。
诚宜开张圣听,以光先帝遗德,恢弘志士之气,不宜妄自菲薄,引喻失义,以塞(s e)忠谏之路也。
宫中府中,俱为一体;陟(zh 1 )罚臧(z eng )否(p i)不宜异同;若有作奸犯科及为忠善者,宜付有司论其刑赏,以昭陛下平明之理;不宜偏私,使内外异法也。
侍中、侍郎郭攸(y①)之、费祎(y i )董允等,此皆良实,志虑忠纯,是以先帝简拔以遗(w e )陛下。
愚以为宫中之事,事无大小,悉以咨之,然后施行,必能裨(b 1)补阙漏,有所广益。
将军向宠,性行淑均,晓畅军事,试用于昔日,先帝称之曰能,是以众议举宠为督。
愚以为营中之事,事无大小,悉以咨之,必能使行(h dng)阵和睦,优劣得所。
亲贤臣,远小人,此先汉所以兴隆也;亲小人,远贤臣,此后汉所以倾颓也。
先帝在时,每与臣论此事,未尝不叹息痛恨于桓、灵也。
侍中、尚书、长(zh mg)史、参军,此悉贞良死节之臣,愿陛下亲之信之,则汉室之隆,可计日而待也。
臣本布衣,躬耕于南阳,苟全性命于乱世,不求闻达于诸侯。
先帝不以臣卑鄙,猥(w百)自枉屈,三顾臣于草庐之中,咨臣以当世之事,由是感激,遂许先帝以驱驰。
后值倾覆,受任于败军之际,奉命于危难之间,尔来二十有一年矣。
先帝知臣谨慎,故临崩寄臣以大事也。
受命以来,夙(stl)夜忧叹, 恐托付不效,以伤先帝之明,故五月渡泸,深入不毛。
今南方已定,兵甲已足,当奖率三军,北定中原,庶(shd)竭驾(nu)钝,攘(rdng) 除奸凶,兴复汉室,还于旧都。
此臣所以报先帝而忠陛下之职分也。
至于斟酌损益,进尽忠言,则攸之、祎、允之任也。
愿陛下托臣以讨贼兴复之效,不效,则治臣之罪,以告先帝之灵。
若无兴德之言,则责攸之、祎、允等之慢,以彰其咎(jid)o陛下亦宜自谋,以咨诙(zou)善道,察纳雅言,深追先帝遗诏。