Packet_Sniffer_用户手册(中文)
sniffer使用及图解教程

sniffer使用及图解注:sniffer使用及图解sniffer pro 汉化注册版下载黑白影院高清免费在线电影聚集网无聚集无生活,聚集网络经典资源下载sniffer软件的安装还是比较简单的,我们只需要按照常规安装方法进行即可。
需要说明的是:在选择sniffer pro的安装目录时,默认是安装在c:\program files\nai\snifferNT目录中,我们可以通过旁边的Browse按钮修改路径,不过为了更好的使用还是建议各位用默认路径进行安装。
在注册用户时,随便输入注册信息即可,不过EMAIL一定要符合规范,需要带“@”。
(如图1)图1 点击放大注册诸多数据后我们就来到设置网络连接状况了,一般对于企业用户只要不是通过“代理服务器”上网的都可以选择第一项——direct connection to the internet。
(如图2)图2接下来才是真正的复制sniffer pro必需文件到本地硬盘,完成所有操作后出现setup complete提示,我们点finish按钮完成安装工作。
由于我们在使用sniffer pro时需要将网卡的监听模式切换为混杂,所以不重新启动计算机是无法实现切换功能的,因此在安装的最后,软件会提示重新启动计算机,我们按照提示操作即可。
(如图3)重新启动计算机后我们可以通过sniffer pro来监测网络中的数据包。
我们通过“开始->所有程序->sniffer pro->sniffer”来启动该程序。
第一步:默认情况下sniffer pro会自动选择你的网卡进行监听,不过如果不能自动选择或者本地计算机有多个网卡的话,就需要我们手工指定网卡了。
方法是通过软件的file菜单下的select settings来完成。
第二步:在settings窗口中我们选择准备监听的那块网卡,记得要把右下角的“LOG ON”前打上对勾才能生效,最后点“确定”按钮即可。
Sniffer使用简介

网络分析-Sniffer使用简介一、捕获数据包前的准备工作在默认情况下,sniffer将捕获其接入碰撞域中流经的所有数据包,但在某些场景下,有些数据包可能不是我们所需要的,为了快速定位网络问题所在,有必要对所要捕获的数据包作过滤。
Sniffer提供了捕获数据包前的过滤规则的定义,过滤规则包括2、3层地址的定义和几百种协议的定义。
定义过滤规则的做法一般如下:1、在主界面选择“定义过滤器”选项。
2、“定义过滤器→地址”,这是最常用的定义。
其中包括MAC地址、ip地址和ipx地址的定义。
以定义IP地址过滤为例,见图1。
图1比如,现在要捕获地址为10.1.30.100的主机与其他主机通信的信息,在Mode选项卡中,选Include(选Exclude选项,是表示捕获除此地址外所有的数据包);在station选项中,在任意一栏填上10.1.30.100,另外一栏填上“任意的”(“任意的”表示所有的IP地址)。
这样就完成了地址的定义。
注意到Dir.栏的图标:表示,捕获位置1收发的数据包;表示,捕获位置1发送的数据包;表示,捕获位置1收到的数据包。
最后,选取,将定义的规则保存下来,供以后使用。
3、定义过滤器→高级,定义希望捕获的相关协议的数据包。
如图2。
图2比如,想捕获FTP、NETBIOS、DNS、HTTP的数据包,那么说首先打开TCP选项卡,再进一步选协议;还要明确DNS、NETBIOS的数据包有些是属于UDP协议,故需在UDP选项卡做类似TCP选项卡的工作,否则捕获的数据包将不全。
如果不选任何协议,则捕获所有协议的数据包。
“数据包大小”选项中,可以定义捕获的包大小,图3,是定义捕获包大小界于64至128bytes的数据包。
图34、定义过滤器→缓冲,定义捕获数据包的缓冲区。
如图4:图4“缓冲大小”选项卡,将其设为最大40M。
“捕获缓冲”选项卡,将设置缓冲区文件存放的位置。
5、最后,需将定义的过滤规则应用于捕获中。
用Sniffer命令抓包分析操作说明_Jimmy

FortiGate 用Sniffer 命令命令抓包分析说明文档抓包分析说明文档说明说明::本文档针对FortiGate 产品的后台抓包命令使用进行说明,相关详细命令参照相关手册。
在使用后台抓包分析命令时,建议大家使用如SecureCRT 这样的远程管理工具,通过telnet 或者ssh 的方式登陆到网关,由于UTM 本身不支持将抓包的结果保存在设备自身的存储空间,因此需要借助SecureCRT 这样远程管理工具接收文件。
1.基本命令命令: diagnose sniffer packet.# diag sniffer packet <interface> <'filter'> <verbose> <count>2.参数说明2.1 interface<interface> 指定实际的接口名称,可以是真实的物理接口名称,也可以是VLAN 的逻辑接口名称,当使用“any ”关键字时,表示抓全部接口的数据包。
例:#diag sniffer packet port1 //表示抓物理接口为port1的所有数据包#diag sniffer packet any //表示抓所有接口的所有数据包#diag sniffer packet port1-v10 //当在物理接口建立一个VLAN 子接口,其逻辑接口名为port1-v10,此时表示抓port1-v10接口的所有数据包,此处一定注意一个问题,由于抓包命令中的空格使用来区分参数字段的,但是在逻辑接口创建时,接口名称支持空格,考虑到今后抓包分析的方便,建议在创建逻辑接口时不要带有空格。
2.2 verbose<verbose> 指控制抓取数据包的内容1: print header of packets, //只抓取IP的原地址、源端口、目的地址、目的端口和数据包的Sequence numbers 为系统缺省设置2: print header and data from ip of packets, //抓取IP数据包的详细信息,包括IP数据的payload。
网络监听软件Sniffer的使用

利用Sniffer抓包
在抓包过滤器窗口中,选择Address选项卡,如图1-27所示。 窗口中需要修改两个地方:在Address下拉列表中,选择抓包 的类型是IP,在Station1下面输入主机的IP地址,主机的IP地 址是172.18.25.110;在与之对应的Station2下面输入虚拟机 的IP地址,虚拟机的IP地址是172.18.25.109。
利用Sniffer抓包
设置完毕后,点击该窗口的Advanced选项卡,拖动滚动条找 到IP项,将IP和ICMP选中(IP和ICMP的具体解释在第二章, 这里只是做相应的设置),如图1-28所示。
利用Sniffer抓包
向下拖动滚动条,将TCP和UDP选中,再 把TCP下面的FTP和Telnet两个选项选中, 如图1-29所示。
利用Sniffer抓包
这样Sniffer的抓包过滤器就设置完毕了,后面的实验也采用 这样的设置。选择菜单栏Capture下Start菜单项,启动抓包 以后,在主机的DOS窗口中Ping虚拟机,如图1-31所示。
利用Sniffer抓包
等Ping指令执行完毕后,点击工具栏上 的停止并分析按钮,如图1-32所示。
利用Sniffer抓包
在出现的窗口选择Decode选项卡,可以看到数据包在两台计 算机间的传递过程,如图1-33所示。
本章习题
使用Sniffer抓取主机到虚拟机或者到其 他电脑的数据包,并做简要的分析。 (上机完成)
利用sniffer抓包设置完毕后点击该窗口的advanced选项卡拖动滚动条找到ip项将ip和icmp选中ip和icmp的具体解释在第二章这里只是做相应的设置如图128所示
网络监听软件Sniffer的使用
利用Sniffer抓包
模块使用说明书

注意事项:1,使用时请轻拿轻放,切勿扔摔。
2,轻拨轻推电源开关。
3,电池电压最好不要低于2.7V,因为cc2430芯片分辨哪个按键被按下时,是通过模拟量来分辨的,如果电压低于2.7V时,容易造成按键分辨不准确。
虽说CC2430芯片手册上说可以在2.0V工作,但那是最低电压,最好不要在芯片的最低电压点来工作。
最好使用碱性干电池,如南孚牌的等等。
4,做按键闪灯实验时,请不要太快速连续按键,按键动作尽量到位可靠,连续按键的间隔时间最好不少于5秒。
5,当使用电池供电的时候,请不要用仿真器给模块供电。
6、最好也好多看看光盘内的资料,在改动跳线帽等相关硬件连接的时候,请先多看看原理图。
最好在你熟悉了模块之后再改动跳线帽。
7、一定要顺着本模块使用说明书pdf文档仔细往下看,请不要急于求成,一定要仔细的照着本文档仔细操作,切不可急躁!!!初步认识模块篇:一、初步测试模块:cc2430模块套件到你手上的时候,里面下载了个zstack-1.4.3-1.2.1协议栈的sampleapp的demo工程。
第一步:先给两个模块的电池盒上好干电池。
第二步:观察下两个模块,两个模块两边排针上的跳线帽的跳法有一些不同,请仔细观察。
1、如果你购买的两个模块都是不带屏的模块,那么请仔细看下模块上的P2(2x10双排针),其中有一个模块的P2上的P02、P03针(P2双排针的内侧)是被一个跳线帽短接起来的。
那么这个模块在下载了zstack-1.4.3-1.2.1协议栈的sampleapp的DemoEB工程后,这个模块就被协议栈认为是协调器设备了。
但是一定要注意:在zstack-1.4.3.-1.2.1协议栈的其他工程中,是不会认为cc2430芯片的P02和P03被短接起来就是协调器的。
只有在zstack-1.4.3-1.2.1的sanpleapp的DemoEB工程中,代码才认为cc2430芯片的P02和P03被短接起来后就是协调器。
如果是带屏的模块,则屏板上右侧的P7双排针的第10针和第12针是被一个跳线帽连接在一起的,这样的模块zstack-1.4.3-1.2.1协议栈中sanpleapp的DemoEB工程中是被程序认为是协调器,而在zstack-1.4.3.-1.2.1.其他工程中,是不会被认为是协调器模块的。
Sniffer软件的功能和使用方法

Sniffer软件的功能和使用方法6.2.3 Sniffer软件的功能和使用方法一、Sniffer基本概念Sniffer,中文可以翻译为嗅探器,是一种基于被动侦听原理的网络分析方式。
使用这种技术方式,可以监视网络的状态、数据流动情况以及网络上传输的信息。
当信息以明文的形式在网络上传输时,便可以使用网络监听的方式来进行攻击。
将网络接口设置在监听模式,便可以将网上传输的源源不断的信息截获。
Sniffer技术常常被黑客们用来截获用户的口令,据说某个骨干网络的路由器网段曾经被黑客攻入,并嗅探到大量的用户口令。
但实际上Sniffer技术被广泛地应用于网络故障诊断、协议分析、应用性能分析和网络安全保障等各个领域。
二、Sniffer功能Sniffer Pro主要包含4种功能组件(1)监视:实时解码并显示网络通信流中的数据。
(2)捕获:抓取网络中传输的数据包并保存在缓冲区或指定的文件中,供以后使用。
(3)分析:利用专家系统分析网络通信中潜在的问题,给出故障症状和诊断报告。
(4)显示:对捕获的数据包进行解码并以统计表或各种图形方式显示在桌面上。
网络监控是Sniffer的主要功能,其他功能都是为监控功能服务的,网络监控可以提供下列信息。
(1)负载统计数据,包括一段时间内传输的帧数、字节数、网络利用率、广播和组播分组计数等。
(2)出错统计数据,包换CRC错误、冲突碎片、超长帧、对准出错、冲突计数等。
(3)按照不同的底层协议进行统计的数据。
(4)应用程序的响应时间和有关统计数据。
(5)单个工作站或会话组通信量的统计数据。
(6)不同大小数据包的统计数据。
三、 Sniffer Pro 网络监控的几种模式1.1 moniter host table图中不同颜色的区块代表了同一网段内与你的主机相连接的通信量的多少。
本次以 IP 地址为测量基准。
1.2 monitor matrix 监听矩阵显示该兰色圆中的各点连线表明了当前处于活跃状态的点对点连接,也可通过将鼠标放在IP地址上点右键showselectnodes查看特定的点对多点的网络连接,如下图,表示出与192.168.0.250相连接的IP 地址1.3、monitor protocol distribution查看协议分布状态,可以看到不同颜色的区块代表不同的网络协议1.4、monitor dashboard该表显示各项网络性能指标包括利用率、传输速度、错误率Network:显示网络利用率等统计信息。
sniffer软件的初步使用方法

使用Sniffer工具分析以太网帧和IP数据报一、实验目的通过使用Sniffer Pro软件掌握Sniffer(嗅探器)工具的使用方法,实现捕捉FTP、HTTP等协议的数据包,以理解TCP/IP协议中多种协议的数据结构。
二、实验原理Sniffer即网络嗅探器,用于监听网络中的数据包,分析网络性能和故障。
Sniffer 主要用于网络管理和网络维护,系统管理员通过Sniffer可以诊断出通过常规工具难以解决的网络疑难问题,包括计算机之间的异常通信、不同网络协议的通信流量、每个数据包的源地址和目的地址等,它将提供非常详细的信息。
通常每个网络接口都有一个互不相同的硬件地址(MAC地址),同时,每个网段有一个在此网段中广播数据包的广播地址(代表所有的接口地址)。
一般情况下,一个网络接口只响应目的地址是自己硬件地址或者自己所处网段的广播地址的数据帧,并由操作系统进一步进行处理,同时丢弃不是发给自己的数据帧。
通过Sniffer工具,可以将网络接口设置为“混杂”(promiscuous)模式。
在这种模式下,网络接口就处于一个对网络进行“监听”的状态,它可以监听此网络中传输的所有数据帧-而不管数据帧的目标地址是广播地址还是自己或者其它网络接口的地址了。
它将对遭遇的每一个数据帧产生硬件中断.交由操作系统对这个帧进行处理,比如截获这个数据帧,进而实现实时分析数据帧中包含的内容。
当然,如果一个数据帧没有发送到目标主机的网络接口,则目标主机将无法监听到该帧。
所以Sniffer所能监听到的信息将仅限于在同一个物理网络内传送的数据帧.就是说和监听的目标中间不能有路由(交换)或其它屏蔽广播包的设备。
因此。
当Sniffer 工作在由集线器(hub)构建的广播型局域网时,它可以监听到此物理网络内所有传送的数据;而对于由交换机(switch)和路由器(router)构建的网络中,由于这些网络设备只根据目标地址分发数据帧,所以在这种网络中,Sniffer工具就只能监测到目标地址是自己的数据帧再加上针对广播地址的数据帧了。
Sniffer_Pro中文使用教程

Sniffer Pro中文使用教程第1章 Sniffer软件简介 .............................................................................................................. 1-11.1 概述 ............................................................................................................................. 1-11.2 功能简介...................................................................................................................... 1-1第2章报文捕获解析.................................................................................................................. 2-12.1 捕获面板...................................................................................................................... 2-12.2 捕获过程报文统计 ....................................................................................................... 2-12.3捕获报文查看.............................................................................................................. 2-22.4设置捕获条件.............................................................................................................. 2-3第3章报文放送 ........................................................................................................................ 3-13.1 编辑报文发送............................................................................................................... 3-13.2捕获编辑报文发送....................................................................................................... 3-2第4章网络监视功能.................................................................................................................. 4-14.1 Dashbord ..................................................................................................................... 4-14.2 Application Response Time (ART) ............................................................................. 4-1第5章数据报文解码详解 .......................................................................................................... 5-15.1数据报文分层.............................................................................................................. 5-15.2以太报文结构.............................................................................................................. 5-15.3 IP协议.......................................................................................................................... 5-35.4 ARP协议...................................................................................................................... 5-45.5 PPPOE协议 ................................................................................................................... 5-65.6 Radius协议.................................................................................................................. 5-9第1章 Sniffer软件简介1.1 概述Sniffer软件是NAI公司推出的功能强大的协议分析软件。
Sniffer使用教程
• 应用程序自动开始通过活动的本地代理监控流 量
本地代理?
• 本地代理指一组设定、地址及与网卡相关的配 置文件的逻辑概念
– 在Sniffer 的程序目录中,每个本地代理都有唯一的 目录; – 所作的修改奖杯保存在活动本地代理的目录中
Local Agent 1 Configurations Thresholds Address Book Profiles (Filters)
系统要求
• Windows 98 SE, 2000, or NT 4.0 • Sniffer Portable Software (Provided by Network Associates) • Microsoft Internet Explorer with MS Virtual Machine and media player • Pentium 400 MHz CPU with minimum 128 MB RAM (256 MB recommended) and minimum 125 MB free disk space • Network Interface Card with NDIS 3.0+ driver • Enhanced NAI drivers for selected cards enhance performance and allow error frames to be captured and analyzed
The Dashboard
• Sniffer 启动后马上开始收集网络段的数据 • 要实时浏览网络数据, 从Monitor菜单选择 Dashboard • 需通过诊断等工具察看红色区域。
利用百分比
每秒包
每秒的错误数
红色区域 位域值
sniffer使用及图解教程

sniffer使用及图解注:sniffer使用及图解sniffer pro 汉化注册版下载黑白影院高清免费在线电影聚集网无聚集无生活,聚集网络经典资源下载sniffer软件的安装还是比较简单的,我们只需要按照常规安装方法进行即可。
需要说明的是:在选择sniffer pro的安装目录时,默认是安装在c:\program files\nai\snifferNT目录中,我们可以通过旁边的Browse按钮修改路径,不过为了更好的使用还是建议各位用默认路径进行安装。
在注册用户时,随便输入注册信息即可,不过EMAIL一定要符合规范,需要带“@”。
(如图1)图1 点击放大注册诸多数据后我们就来到设置网络连接状况了,一般对于企业用户只要不是通过“代理服务器”上网的都可以选择第一项——direct connection to the internet。
(如图2)图2接下来才是真正的复制sniffer pro必需文件到本地硬盘,完成所有操作后出现setup complete提示,我们点finish按钮完成安装工作。
由于我们在使用sniffer pro时需要将网卡的监听模式切换为混杂,所以不重新启动计算机是无法实现切换功能的,因此在安装的最后,软件会提示重新启动计算机,我们按照提示操作即可。
(如图3)重新启动计算机后我们可以通过sniffer pro来监测网络中的数据包。
我们通过“开始->所有程序->sniffer pro->sniffer”来启动该程序。
第一步:默认情况下sniffer pro会自动选择你的网卡进行监听,不过如果不能自动选择或者本地计算机有多个网卡的话,就需要我们手工指定网卡了。
方法是通过软件的file菜单下的select settings来完成。
第二步:在settings窗口中我们选择准备监听的那块网卡,记得要把右下角的“LOG ON”前打上对勾才能生效,最后点“确定”按钮即可。
抓包工具的原理

抓包工具的原理抓包工具(Packet Sniffer)是一种计算机网络工具,用于拦截、记录、分析网络数据包。
其可以用于网络故障排除、网络安全研究、网络优化等领域。
抓包工具的原理主要是基于网络协议的工作方式,涉及到数据包的传输、分析和处理等方面。
抓包工具的原理分为两个阶段:捕捉分析数据包和提取监控数据。
一、捕捉分析数据包1.数据包的捕获:抓包工具通过网卡(NIC)来接受数据包。
网卡是一种能够读取和发送数据的硬件设备,可以接收来自网络的数据包并将其传递给操作系统。
抓包工具通过NIC获取这些数据包,并通过网络层、传输层、应用层的协议对其进行解析。
2.数据包的解析:抓包工具可以解析每个数据包的内容并提取其中有用的信息,比如源IP地址、目标IP地址、协议类型、数据内容等。
数据包的解析过程涉及到IP、TCP、UDP等协议,抓包工具需要了解这些协议的数据结构、数据格式和数据流程,才能对数据包进行解析。
3.数据包的过滤:抓包工具可以根据用户定义的规则进行数据包的过滤,可以过滤掉一些不必要的数据包,只提取出关注的数据包,减少数据包的数量,提高工作效率。
二、提取监控数据1.统计数据包:抓包工具可以对数据包进行统计,包括各种协议的数量、每种协议的流量、每个主机的数据包数量等。
这些统计数据对于网络管理员和安全分析师分析网络状况和网络安全问题非常有帮助。
2.分析报文:抓包工具可以对数据包进行深入的分析,以便更好地理解网络中的通信过程和协议的运作情况。
在数据包分析的过程中,可以发现网络中的问题和异常,比如网络攻击、网络延迟、网络拥塞等问题,有助于更好地优化网络性能。
综上,抓包工具的原理主要是基于网络协议的工作方式,涉及到数据包的捕获、解析、过滤和统计等方面,以及提取监控数据的过程。
抓包工具为网络故障排查和网络安全研究提供了有效的工具和方法。
nRF Sniffer用户指南v2.0说明书
nRF SnifferUser Guide v2.0Copyright © 2017 Nordic Semiconductor ASA. All rights reserved.Reproduction in whole or in part is prohibited without the prior written permission of the copyright holder.1 IntroductionThe nRF Sniffer is a tool for debugging Bluetooth low energy (BLE) applications by detecting packets between a selected device and the device it is communicating with, even when the link is encrypted. When developing a BLE product, knowing what happens over-the-air between devices can help you isolate and solve any potential issues.By default, the Sniffer lists nearby BLE devices that are advertising, providing the Bluetooth Address and Address type, complete or shortened name, and RSSI.1.1Required hardwareTo set up the Sniffer you will need one of the following kits:•nRF51 Development Kit (PCA10028) v1.0 or later and a micro USB cable•nRF51 Dongle (PCA10031)•nRF52 Development Kit (PCA10040) and a micro USB cable1.2Required software•nRF Sniffer software v2.x or later available on the Sniffer product page under the downloadstab•Wireshark v2.4.2 or later available from /.Wireshark is a free software tool that captures wireless traffic and reproduces it in a readableformat.•An operating system that runs Wireshark v2.4.2 or later•Windows7or later•64 bit OS X 10.6 or later•Linux (check for version compatibility)•Segger J-Link v6.16c (which comes bundled with the nRF Sniffer v2.x software)available from https://•python v2.7.x available from https:///downloads/•pyserial v3.4 or later available from https:///pyserial/pyserial1.3Writing conventionsThis user guide follows a set of typographic rules that makes the document consistent and easy to read. The following writing conventions are used:•Commands are written in Lucida Console.•Pin names are written in Consolas.•File names and User Interface components are written in bold.•Internal cross references are italicized and written in semi-bold.2 Setting up the nRF SnifferSet up the Sniffer for the first time by performing the following steps:1.Install the software listed in Section 1.2 “Required software” on page2 before plugging in thehardware.2.Connect the hardware to a USB port.3.For Windows - Wait for the hardware drivers to be loaded before continuing. You can also clickSkip obtaining driver software from Windows Update to speed up the driver installationprocess.4.Place the hardware between the Peripheral and Central device. Now you’re ready to set up thesoftware.Figure 1 System overviewInstall nRF Sniffer1.For Windows - Go to Help > About Wireshark .2.Click on the Folders tab.3.Click on the location for Extcap path .4.Find and copy the nrf_sniffer_<version>_<hash> ZIP file to the folder associated with “Extcappath”.5.Unzip the ZIP's extcap content to the Wireshark Extcap path found in "About Wireshark” (shownhere as C:\Program Files\Wireshark\extcap ).6.For Windows - Verify that python is callable from the command line.7.For OS X and Linux - Verify that the nrf_sniffer.py file has the “x” permission. If the “x” permissionis missing add it using chmod +x nrf_sniffer.py .8.Close Wireshark.==C:>python --versionPython 2.7.x==Install firmware with SEGGER J-Link.1.Locate the J-Link software.•Windows-Use the jlink.exe program, usually in C:\Program Files (x86)\SEGGER\.•OS X and Linux - Use the jlinkexe program.2.Remove all hardware attached to the USB. Plug in one of the hardware boards and wait for thedrivers to install.3.Open a command window.4.In the command window, type jlink.exe (for Windows) or jlinkexe (for OS X and Linux) and hitEnter to run the program.5.Erase the contents by performing the following steps. Press Enter after each command.a.Type erase.b.Depending on the board you are using, type nRF51422_XXAC (for the nRF 51DK andDongle) or nRF52832_XXAA (for the nRF52 DK).c.Type s to specify the SWD interface.d.For Speed, type 1000.e.Type loadfile then <Path to Wireshark>\extcap\nrf_sniffer_<ver-sion>_<hash>\hex\sniffer_<board name>_<hash>.hexf.Type r to reset the board.g.Type g to run the board firmware.Figure 2 J-Link eraseFinalize the set up1.Verify that the Sniffer firmware is running correctly by checking that LED1 toggles each time apacket is received. At least one device must be advertising for the Sniffer to detect theadvertisements.2.Open Wireshark. You should see “nRF Sniffer on xxxxx” as one of the interfaces.3.Click View>Interface Toolbars>nRF Sniffer to enable the Sniffer interface.4.Click on the board to select it and then click the Wireshark icon to start capturing packets.Figure 3 Initial view - successful installation3 UsingSniffertheThe Wireshark capture screen is displayed when Wireshark is first launched. It includes the Wireshark interface for managing packets that are captured, the nRF Sniffer toolbar, and the hardware interfaces connected to the nRF Sniffer.To make the nRF Sniffer toolbar visible, click View>Interface Toolbars>nRF Sniffer.There are two ways to start sniffing:•Double click on the hardware interface (nRF Sniffer COM54 in Figure 4).•Select the hardware interface by clicking on it and then click the Wireshark icon on the topleft to start sniffing.Figure 4 Wireshark capture screenOnce the Sniffer is running, it reports advertisements and lists nearby devices in the Device List. The Sniffer may not pick up all connect requests and will not always pick up on a connection. In such cases, you need to reconnect and try sniffing again. If you aren’t seeing any activity in your Wireshark console, see Section 6 “Troubleshooting” on page15.The Sniffer has two modes of operation:1.Listens on all advertising channels to pick up as many packets as possible from as many devices aspossible. This is the default mode.2.Follows one particular device and tries to catch all packets sent to or from this particular device.This mode will catch all:•Advertisements and Scan Responses sent from the device•Scan Requests and Connect Requests sent to the device•Packets in the Connection sent between the two devices in the Connection3.1Sniffer commandsThe software interface has several commands to for controlling the Sniffer. Below you will find a list of commands and their description, along with some examples. Figure 5 Sniffer interfaceAll advertising devicesLists nearby devices. If this command is used while sniffing a device, it will stop sniffing that device. This means if the device is in a connection, the sniffer will lose that connection. To enable this option, click the Device list drop-down and select All advertising devices .PasskeyYour device asks you to provide your passkey. Type the 6 digit passkey in the passkey text field from Wireshark, followed by Enter . Then enter the passkey into the device. Passkey entry utilizes Just Works pairing, which is described in detail in “Just Works - sniffing an encrypted connection“ on page 13.Out of band key exchange (OOB)You are asked to provide the 16 byte Out-of-band (OOB) key in hexadecimal (starting with 0x, big endian format). This must be carried out before the device enters encryption. If the entered key is shorter than 16 bytes, it will be padded with zeros in front. OOB entry uses Out of Band pairing, which is described in detail in “Sniffing a connection between devices that are already paired“ on page 14.Advertising hop sequenceChange the order in which the Sniffer switches advertising channels when following a device. Define the order with comma separated channel numbers. For example: 37,38,39. Press Enter when done.This will sniff waiting for a packet on channel 37. After it receives a packet on channel 37 it will transition to sniffing on channel 38. When it receives a packet on channel 38, it will transition to sniffing on channel 39. When it receives a packet on channel 39, it will start sniffing on channel 37, and repeats the operation.Hardware interface Device list Passkey and OOB key Advertising hopsequence Access the online User GuideResets the user interface;RSSI filterApplies an RSSI filter on the packets being received. Only packets that match the filter are displayed. To set the capture filter in the Capture screen in Wireshark use the keyword "rssi".Example: rssi > -70. This will only display packets that have an RSSI greater than -70 dBm.Figure 6 RSSI filterCapturing from multiple hardware interfaces/boardsSelect all hardware interfaces in the Capture Screen in Wireshark and click Start Capturing Packets.Figure 7 Select multiple hardware interfacesInterface IDInterface Identifier used by Wireshark to identify the capture interfaces (frame.interface_id)BoardHardware identifier for the board running the nRF Sniffer firmware (nordic_ble.board_id)Figure 8 Data capture from multiple hardware interfaces4 Using WiresharkAll BLE packets detected by the Sniffer are passed to Wireshark where they are wrapped in a headercontaining useful meta-information not present in the BLE packet itself. Wireshark dissects the packets and separates the actual packet from the meta-information.Packet browsingWhen a packet is selected in the Packet List, the Details pane shows the breakdown of that packet. The bytes of the packet are shown in the Bytes pane. Click a value in Details to highlight it among the bytes, or click onFigure 9 Wireshark interface4.1Display filteringDisplay filters allow you to display a chosen packet subset. Most filters are based on the values of the packets, such as length or access address. The filter expressions use Boolean operators (&& || == != !). Some examples are given in Table 1.Display filter Descriptionbtle.length != 0 Displays only packets where the length field of the BLE packet is notzero, meaning it hides empty data packets.btle.advertising_address Displays only packets that have an advertising address (advertisingpackets).btle A protocol filter that displays all Bluetooth low energy packets. btatt, btsmp, btl2cap Protocol filters for ATT, SMP, and L2CAP packets respectively.Table 1 Display filtering4.1.1Wireshark TipsMore information can be found in the documentation on Wireshark’s website.•For help with constructing filters, click Expression.•Any field in the Packet Details pane can be made into a column by right clicking the value,and click Apply as column.Figure 10 Apply as column•You can apply a value as a filter. This can be useful if you want to see only operationsaffecting a particular handle, for example. To filter packets either having a specific value forsome field, do as follows:•Right click the value in the packet details, click Apply as Filter, and click Selected.•Saving a set of captured packets is useful if they need to be looked at later. To save a set ofcaptured packets do the following:•Click the Stop button to quit capturing packets.•Click File and select Save as to save all packets. Click File and select Export SpecifiedPackets to save a selection of packets.•The Restart button is used to restart a capture and to clear the packet list.actionssniffing5 CommonSniffing advertisements from all nearby devicesTo see advertisements from all nearby devices:1.Start the nRF Sniffer.2.Ensure “All advertising devices” is selected in the Device drop-down.Sniffing advertisement packets involving a single slave deviceTo see advertisement packets, scan requests, and scan responses to and from a single device:1.Start the Sniffer if not already running.2.In the Sniffer, choose the device from the Device drop-down list.Sniffing a connection involving a single slave deviceTo sniff a connection between a specific Peripheral device and a Central:1.Start the Sniffer if not already running.2.In the Sniffer, choose the device from the Device drop-down list.3.Connect the Central to the Peripheral.Just Works - sniffing an encrypted connectionTo sniff a connection encrypted with Just Works:1.Start the Sniffer if not already running.2.In the Sniffer, choose the device from the Device drop-down list.3.Initiate pairing between the devices if it does not happen automatically.The Sniffer willautomatically decrypt encrypted packets.Sniffing a connection between devices that are already pairedThe Sniffer needs to have sniffed the pairing procedure if the devices are already paired. If the sniffer board is reset, stored pairing information will be lost.To sniff a connection encrypted with passkey:1.Start the Sniffer if not already running.2.In the Sniffer, choose the device from the Device drop-down list.3.Initiate pairing between the devices if it does not happen automatically. A passkey will bedisplayed on either the Central or the Peripheral device.4.Type the 6 digit passkey from the passkey text field in Wireshark.5.Press Enter.6.Enter the passkey into the other device after entering it into the Sniffer.To sniff a connection encrypted with OOB:1.Start the Sniffer if not already running.2.In the Sniffer, choose the device from the Device drop-down list.3.Enter the OOB key into the Sniffer before the devices initiate pairing.•Type the OOB key in big-endian, hexadecimal format with a leading "0x".•Press Enter.4.Connect the Central to the Peripheral device.5.Initiate pairing between the devices if it does not happen automatically.6 TroubleshootingThe nRF sniffer is not listed in the Wireshark interface.1.See if the hardware has been enumerated on USB and the drivers are loaded.2.Check that the HEX file for the hardware has been flashed.3.Reset the hardware by unplugging the hardware, waiting 5 seconds, and plugging it back in.If it still doesn’t appear, verify the python script located in the extcap folder is able to run.For Windows:1.Run nrf_sniffer.bat --extcap-interfaces to list the interface.2.If this exits with a python error, verify that python.exe can be run from the command linec:>python.exe --version, where the Python version is the same as Section 1.2 “Required software” on page2.For OS X and Linux:1.Verify that the execute permission is present for the nrf_sniffer.py file.•ls -l nrf_sniffer.py2.If the "x" permission is missing:•chmod +x nrf_sniffer.py3.Run nrf_sniffer.py --extcap-interfaces to list the interface.I cannot see the extcap folder in Wireshark.1.Create the extcap folder as described in “Install nRF Sniffer“ on page 4.nRF Sniffer occasionally works and appears unstable.Make sure you are using the correct software versions as stated in Section 1.2 “Required software” on page2.Verify that the J-Link emulator version on the hardware is as stated in Section 1.2 “Required software” on page2. To verify:1.Open the JLinkConfig.exe in the install folder of the required J-Link version.2.The host firmware and the emulator firmware should have the same date.Upgrade the J-Link emulator version on the hardware.1.Download the J-Link software as mentioned in Section 1.2 “Required software” on page2.2.Unplug the hardware, wait 5 seconds.3.Plug in the hardware.4.For Windows:•Run jlink.exe from the folder where the J-Link software was installed.•A popup appears "A new firmware version is available.....Do you want to upgrade ...?”•Click yes.5.OS X/Linux•Type “jlinkexe”. The J-Link firmware updates automatically.Downgrade the J-Link emulator version on the hardware.For Windows:1.Ensure only one J-Link is connected to your computer.2.Run jlink.exe from the folder where the J-Link version was installed.3.In jlink type “exec invalidatefw”.4.Click yes when prompted.5.In jlink type “exit” to exit jlink.exe.6.Run jlink.exe from the folder where the J-Link version was installed (it is necessary to run it asecond time).7.Click yes to upgrade your firmware.8.You have now successfully downgraded the J-Link version on the emulator.For OS X and Linux:1.Ensure only one J-Link is connected to your computer.2.Run jlink.exe from the folder where the J-Link version was installed. (Install the older version ofJ-Link if required.)3.Run jlinkexe.4.In jlinkexe type "exec invalidatefw".5.In jlinkexe type "exit" to exit the jlinkexe.6.Run jlinkexe (this is required to be run for the second time). The J-Link firmware will be updatedautomatically to the installed version of J-Link.“nRF Sniffer on xxxxx” doesn’t show up as one of the interfaces when I open Wireshark.1.Click View in the Wireshark toolbar.2.Select Interface Toolbars then click nRF Sniffer.Liability disclaimerNordic Semiconductor ASA reserves the right to make changes without further notice to the product to improve reliability, function or design. Nordic Semiconductor ASA does not assume any liability arising out of the application or use of any product or circuits described herein.Life support applicationsNordic Semiconductor’s products are not designed for use in life support appliances, devices, or systems where malfunction of these products can reasonably be expected to result in personal injury. Nordic Semiconductor ASA customers using or selling these products for use in such applications do so at their own risk and agree to fully indemnify Nordic Semiconductor ASA for any damages resulting from such improper use or sale.Contact detailsFor your nearest distributor, please visit .Information regarding product updates, downloads, and technical support can be accessed through your My Page account on our homepage.Main office:Phone: +47 72 89 89 00Fax: +47 72 89 89 89Otto Nielsens veg 127052 Trondheim NorwayMailing address:Nordic Semiconductor P .O. Box 23367004 TrondheimNorwayRevision HistoryDate Version DescriptionNovember 2017 2.0nRF Sniffer updated to work more closely with Wireshark.Updated software to support the nRF52 DK.April 2017 1.4Updated content:•Removed reference to nRF52 Series in the Section 1.1 “Required hardware”on page2•Section 1.2 “Required software” on page2•Section 2 “Setting up the nRF Sniffer” on page3March 2017 1.3Updated content:•Section 1.1 “Required hardware” on page2•Section 1.2 “Required software” on page2•Chapter 2 “Setting up the nRF Sniffer” on page3July 2014 1.2Updated content:•Section 1.1 “Required hardware” on page2•Section 1.2 “Required software” on page2•Chapter 2 “Setting up the nRF Sniffer” on page3•Section 2.1 “Running the Sniffer” on page6•Chapter 3 “Using the Sniffer” on page7•Chapter 4 “Using Wireshark” on page11•Section 4.1.1 “Wireshark Tips” on page12•Chapter 6 “Troubleshooting” on page15April 2014 1.1Updated firmware, now supports all versions of PCA10000 and PCA10001.December 2013 1.0First release.。
packet sniffer过滤指令
Packet Sniffer 过滤指令在网络技术领域中,Packet Sniffer(数据包嗅探器)是一种常用的工具,用于捕获并分析网络数据包。
通过使用Packet Sniffer,网络管理员可以监控和诊断网络流量,以便发现问题和增强网络安全。
而在使用Packet Sniffer 过程中,过滤指令则是必不可少的工具,它可以帮助用户筛选出仅关注的数据包,提高工作效率。
在本文中,我将深入探讨Packet Sniffer 过滤指令的功能和用法,并对其进行全面评估。
在分析过程中,我将以从简到繁、由浅入深的方式进行阐述,以确保你能够更深入地理解Packet Sniffer 过滤指令的重要性。
1. 什么是Packet Sniffer 过滤指令?让我们来了解一下Packet Sniffer 过滤指令的基本概念。
在使用Packet Sniffer 进行网络数据包捕获时,系统会捕获所有经过网络接口的数据包。
而在实际工作中,我们可能只对特定类型、来源或目的地的数据包感兴趣。
这时,Packet Sniffer 过滤指令就派上了用场。
Packet Sniffer 过滤指令可以让用户根据特定的条件,对捕获到的数据包进行过滤,从而只展示符合条件的数据包。
这样一来,可以大大简化数据包分析的工作,只关注关键信息,提高工作效率。
2. Packet Sniffer 过滤指令的基本语法和用法Packet Sniffer 过滤指令通常采用一种特定的语法来进行指定条件的筛选。
这种语法通常包括了关键词、操作符和数值。
以下是一个基本的Packet Sniffer 过滤指令的语法示例:```protocol [operation] value```在这个语法中,protocol代表所要过滤的协议类型,operation代表操作符,value代表筛选条件的数值。
如果我们希望只捕获TCP协议的数据包,可以使用以下过滤指令:```tcp```而如果我们希望捕获特定源IP位置区域的数据包,可以使用以下过滤指令:```src host 192.168.1.1```通过灵活运用Packet Sniffer 过滤指令,用户可以根据自身需求,对网络数据包进行高效地筛选和分析。
Sniffer 工具使用手册

ATOS实验平台Sniffer工具
使用手册
说明
本文档用于描述ATOS实验平台中Sniffer工具的使用说明。
阅读本文档之前,需先阅读《快速入门手册》。
Sniffer工具
Sniffer工具用于抓取ATOS实验平台中无线节点发送的数据,方便编程与开发人员调试与测试。
设置Sniffer节点
打开Cygwin开发环境,将基站板与射频模块连接。
运行命令,进入Sniffer节点代码目录:
cd /opt/atos/apps/Atosenet/ANTSnifferV2/Stack2430/SnifferApp/
运行命令,编译并烧录Sniffer节点:
make antc3 install
使用Sniffer软件
若安装AtosDevKit时选择了【Sniffer监听工具】,则可以使用Sniffer监听工具进行ATOS网络数据的监听,程序可以在【开始菜单】中找到,运行界面如图。
packetsniffer问题解答
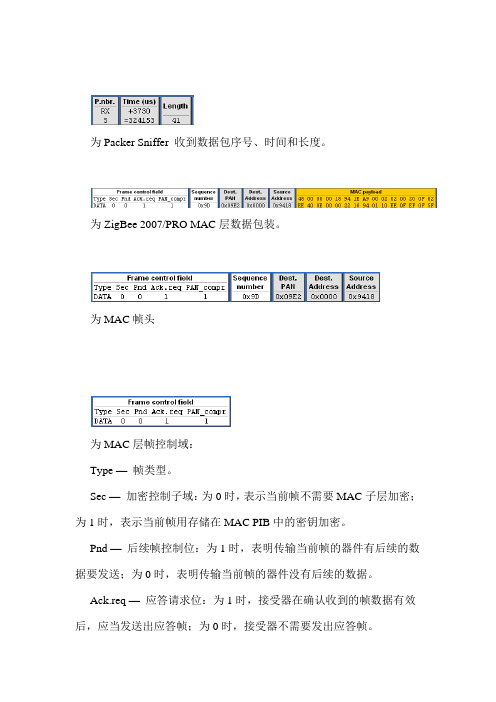
为Packer Sniffer 收到数据包序号、时间和长度。
为ZigBee 2007/PRO MAC层数据包装。
为MAC帧头为MAC层帧控制域:Type —帧类型。
Sec —加密控制子域:为0时,表示当前帧不需要MAC子层加密;为1时,表示当前帧用存储在MAC PIB中的密钥加密。
Pnd —后续帧控制位:为1时,表明传输当前帧的器件有后续的数据要发送;为0时,表明传输当前帧的器件没有后续的数据。
Ack.req —应答请求位:为1时,接受器在确认收到的帧数据有效后,应当发送出应答帧;为0时,接受器不需要发出应答帧。
PAN_compr —同一PAN指示:为1时,表明当前帧是在同一PAN 范围内,只需要目的地址和源地址,而不需要PAN标识符;为0时,表明当前帧是不在同一PAN范围内,不仅需要目的地址和源地址,还需要源PAN标识符与目标标识符。
为数据包序列号。
为MAC层地址域:Dest.PAN —目标PAN标识符。
Dest.Address —目的地址。
Source.Address —源地址。
为MAC帧负载(净荷—可变)。
2.NWK层为ZigBee 2007/PRO NWK层数据包装。
为NWK帧头- 8 -为NWK层帧控制域:Type —帧类型子域,有数据、网络层命令和保留位。
Version —协议版本号。
DR —发现路由子域。
MF —广(多)播标志子域。
如果是单播或者广播帧,值为0;如果为多播帧,值为1.Sec —安全子域,该帧是否有网络层安全操作能力,如果该帧的安全是由另一层来完成或者完成被禁止,则该值为0。
SR —源路由子域,值为1时,源路由子帧才在网络报头中存在。
如果源路由子帧不存在,则源路由子域值为0。
DIEEE — IEEE目的地址子域,值为1时,网络帧报头包含整个IEEE 目的地址。
SIEEE — IEEE源地址子域,值为1时,网络帧报头包含整个IEEE 源地址。
为目的地址域、源地址域、广播半径域和广播序号域。
Sniffer抓包分数据包分析手册

xxi
该数据包有以下特征: 1. 在 IP 的内容中,源地址(source address)为交换机(NAS)的 IP 地址,目的地址(destination address)为 SAM 服务器的 IP 地址。 UDP 的内容中,源端口(source port)为 1812,目的端口(destination port)为 1812。 3. Radius 的内容中,code 的值标识为 1 Radius 的内容中,Identifier 的值为 2,说明该数据包为二次请求包。 具备以上特征的数据包认定为交换机(NAS)向 SAM 服务器发起的二次接入请求包(RADIUS Access-request)。 四.SAM 服务器向交换机(NAS)发送的接入允许包(RADIUS access-accept) 数据包如图:
- 1、下载文档前请自行甄别文档内容的完整性,平台不提供额外的编辑、内容补充、找答案等附加服务。
- 2、"仅部分预览"的文档,不可在线预览部分如存在完整性等问题,可反馈申请退款(可完整预览的文档不适用该条件!)。
- 3、如文档侵犯您的权益,请联系客服反馈,我们会尽快为您处理(人工客服工作时间:9:00-18:30)。
Packet Sniffer
1 介绍
SmartRF™数据包嗅探器是一个PC应用软件,用于显示和存储通过射频硬件节点侦听而 捕获的射频数据包。支持多种射频协议。数据包嗅探器对数据包进行过滤和解码,最后用一 种简洁的方法显示出来。过滤包含几种选项,以二进制文件格式储存。
安装Packet Sniffer时与SmartRF® Studio分开,而且必须在Texas Instruments网站下载. 安装完成后,支持信令协议的所有快捷键被显示在"Start menu"窗口下 注意: 选择“IEEE802.15.4/ZigBee (CC2420)” 协议后启动的Packet Sniffer是独特的.最突出的不 同点是: 数据包只储存在RAM 缓存区里. 欲了解Packet Sniffer CC2420的更多细节请参阅 CC2420的用户手册. 1.1 硬件平台
SmartRF™ Packet Sniffer 用户手册 Rev. 1.10
Packet Sniffer
Packet Sniffer
目录
1 介绍 .........................................................................................................................................3 1.1 硬件平台....................................................................................................................................3 1.2 协议......................................................................................................................................................7 1.3 数据流程......................................................................................................................................................9 1.4 软件 .......................................................................................................................................................9 2 用户界面 ....................................................................................................................................10 2.1 启动窗口. .........................................................................................................................................10 2.2 PACKET SNIFFER WINDOW OF AN ACTIVE SESSION. ........................................................................................10 2.3 菜单与工具栏 .................................................................................................................................12 2.4 安装.............................................................................................................................................................13 2.5 可选区域 ............................................................................................................................. ..................14 2.6 数据包细节 ............................................................................................................................................15 2.7 地址区 ..............................................................................................................................................16 2.8 显示器 .............................................................................................................................................17 2.9 时间轴.......................................................................................................................................................19 2.10 无线设置.............................................................................................................................................19
CC1110EM + SmartRF04EB/SmartRF05EB * CC1111 USB Dongle* CC Debugger + SmartRFCC1110TB*
CC2420 CC2430 CC2431 CC2520 CC2530 CC2531
SimpliciTI
1.1.0 1.0.6 1.0.4 1.0.0
Generic
Any
CC2430DB CC2430EM + SmartRF04EB/SmartRF05EB CC2431EM + SmartRF04EB/SmartRF05EB CC2530EM + SmartRF04EB/SmartRF05EB CC2520EM + SmartRF05EB CC2531 USB Dongle
packet sniffer可以用在多种硬件平台上。. 以下的硬件就可以使用: • CC2531 USB Dongle. • CC Debugger + SmartRF
Packet Sniffer
1.2 协议
启动packet sniffer 时,可支持的协议就显示在启动窗口下。表1列出可支持协议下的软件连 接和捕捉设备的概况。
Protocol
Version 2003
Capture device CC2420EM + CC2400EB
Can be used to capture packets from CC2420
ZigBee
2007/PRO 2006 2003
CC2430DB CC2430EM + SmartRF04EB/SmartRF05EB CC2431EM + SmartRF04EB/SmartRF05EB CC2530EM + SmartRF04EB/SmartRF05EB CC2520EM + SmartRF05EB CC2531 USB Dongle
CC2420 CC2430 CC2431 CC2520 CC2530 CC2531
RF4CE
1.0
CC2430DB CC2430EM + SmartRF04EB/SmartRF05EB CC2431EM + SmartRF04EB/SmartRF05EB CC2530EM + SmartRF04EB/SmartRF05EB CC2520EM + SmartRF05EB CC2531 USB Dongle
5 HELP ....................................................................................................................................................... .....23 6 TROUBLESHOOTING ..............................................................................................................................23 7 GENERAL INFORMATION.......................................................................................26 7.1 DOCUMENT HISTORY ..................................................................................................................................... 26