Matlab各种图表绘图演示
matlab绘图课件

柱状图
总结词
用于比较不同类别数据的数值大小。
详细描述
柱状图是一种常用的数据可视化工具,它通过在垂直或水平方向上绘制一系列的柱子,每个柱子代表一个数据类 别,高度或长度表示该类别的数值大小。柱状图可以清晰地展示不同类别之间的数值差异和比较。
饼图
总结词
用于表示各部分在总体中所占的比例。
VS
详细描述
饼图是一种圆形图表,它将一个完整的圆 分割成若干个扇形,每个扇形代表一个数 据类别,扇形的面积或角度表示该类别的 比例大小。饼图可以清晰地展示各部分在 总体中所占的比例和比较。
动画制作
帧动画
通过在连续的帧上绘制图形或改 变图形属性来创建动画效果。
交互式动画
使用鼠标或键盘控制动画的播放 暂停和停止等操作。
运动轨迹
绘制物体在运动过程中的轨迹, 以展示物体的运动规律和特点。
三维图形
三维曲线
在三维空间中绘制曲线,可以展 示不同变量之间的关系和变化趋
势。
三维曲面
通过绘制三维曲面来展示两个或多 个变量之间的关系和分布情况。
函数调用与执行
在主程序中调用自定义函数,执行绘图操作,实现特定图形的绘 制。
数据导入和导
1 2
数据导入
将外部数据文件(如Excel、CSV等格式)导入 Matlab中,用于后续的绘图分析。
数据处理
对导入的数据进行必要的预处理和清洗,以满足 绘图需求。
3
数据导出
将绘制好的图形和数据导出为特定格式(如PNG 、JPEG、PDF等),方便分享和保存。
三维体图
绘制三维体图来展示数据的空间分 布和密度变化,如云图、等高线图 等。
04
实例分析
绘制正弦函数图像
matlabplot函数详解

matlabplot函数详解plot函数是MATLAB中最重要和最常用的绘图函数之一、它可以绘制多种类型的图形,如折线图、散点图、柱状图等。
在本文中,我们将详细介绍plot函数的用法和参数,以及一些实例演示。
plot函数的一般用法为:plot(x, y, LineSpec),其中x和y分别是要绘制的数据点的横坐标和纵坐标,LineSpec是一个可选参数,用于指定线条的样式和颜色。
1.绘制简单的折线图首先,我们来绘制一个简单的折线图,假设我们有一个数据集x和一个对应的函数y = sin(x)。
我们可以使用以下代码绘制这个折线图:x = linspace(0, 2*pi, 100); % 生成0到2π之间的100个等间距点y = sin(x); % 计算对应的sin值plot(x, y) % 绘制折线图运行以上代码,我们就能得到一个以x为横轴,以y为纵轴的折线图。
2.指定线条样式和颜色我们可以使用LineSpec参数来指定线条的样式和颜色。
LineSpec是一个由3个部分组成的字符串,分别表示线条类型、标记类型和颜色。
例如,我们可以使用红色实线和圆形标记来绘制折线图,代码如下所示:plot(x, y, 'r-o')其中,'r'表示红色,'-'表示实线,'o'表示圆形标记。
运行以上代码,我们可以得到红色实线和圆形标记的折线图。
3.绘制多条曲线plot函数可以同时绘制多条曲线。
我们只需要将不同的数据点传递给x和y,然后用逗号分隔开即可。
例如,我们可以绘制一个由两条正弦曲线构成的图形,代码如下所示:y1 = sin(x);y2 = sin(2*x);plot(x, y1, x, y2)运行以上代码,我们将得到两条正弦曲线组成的图形。
title('折线图示例')xlabel('x')ylabel('y')5.修改坐标轴范围有时候,我们希望修改坐标轴的范围,以更好地展示数据。
matlab教程ppt(完整版)

矩阵的数学运算
总结词
详细描述
总结词
详细描述
掌握矩阵的数学运算,如求逆 、求行列式、求特征值等。
在MATLAB中,可以使用inv() 函数来求矩阵的逆,使用det() 函数来求矩阵的行列式,使用 eig()函数来求矩阵的特征值。 例如,A的逆可以表示为 inv(A),A的行列式可以表示 为det(A),A的特征值可以表 示为eig(A)。
• 总结词:了解特征值和特征向量的概念及其在矩阵分析中的作用。 • 详细描述:特征值和特征向量是矩阵分析中的重要概念。特征值是满足Ax=λx的标量λ和向量x,特征向量是与特征值对
应的非零向量。特征值和特征向量在许多实际问题中都有应用,如振动分析、控制系统等。
04
MATLAB图像处理
图像的读取与显示
变量定义
使用赋值语句定义变量,例如 `x = 5`。
矩阵操作
学习如何创建、访问和操作矩 阵,例如使用方括号 `[]`。
函数编写
学习如何创建自定义函数来执 行特定任务。
02
MATLAB编程
变量与数据类型
01
02
03
变量命名规则
MATLAB中的变量名以字 母开头,可以包含字母、 数字和下划线,但不应与 MATLAB保留字冲突。
了解矩阵的数学运算在实际问 题中的应用。
矩阵的数学运算在许多实际问 题中都有应用,如线性方程组 的求解、矩阵的分解、信号处 理等。通过掌握这些运算,可 以更好地理解和解决这些问题 。
矩阵的分解与特征值
• 总结词:了解矩阵的分解方法,如LU分解、QR分解等。
• 详细描述:在MATLAB中,可以使用lu()函数进行LU分解,使用qr()函数进行QR分解。这些分解方法可以将一个复杂的 矩阵分解为几个简单的部分,便于计算和分析。
matlab教程ppt(完整版)

数据处理
应用MATLAB的信号处理和统计 分析函数库,进行数据预处理、
特征提取和模型训练。
机器学习与深度学习
机器学习
介绍MATLAB中的各种机器学习算法,如线性回归、决策 树、支持向量机等,以及如何应用它们进行分类、回归和 聚类。
深度学习
介绍深度学习框架和网络结构,如卷积神经网络(CNN) 、循环神经网络(RNN)等,以及如何使用MATLBiblioteka B进行 训练和部署。感谢观看
THANKS
符号微积分
进行符号微分和积分运算,如极限、导数和 积分。
符号方程求解
使用solve函数求解符号方程。
符号矩阵运算
进行符号矩阵的乘法、转置等运算。
05
MATLAB应用实例
数据分析与可视化
数据分析
使用MATLAB进行数据导入、清 洗、处理和分析,包括描述性统
计、可视化、假设检验等。
可视化
利用MATLAB的图形和可视化工 具,如散点图、柱状图、3D图等
数值求和与求积
演示如何对数值进行求和与求积 操作。
数值计算函数
介绍常用数值计算函数,如sin、 cos、tan等。
方程求解
演示如何求解线性方程和非线性方 程。
03
MATLAB编程基础
控制流
01
02
03
04
顺序结构
按照代码的先后顺序执行,是 最基本的程序结构。
选择结构
通过if语句实现,根据条件判 断执行不同的代码块。
数据分析
数值计算
MATLAB提供了强大的数据分析工具,支 持多种统计分析方法,可以帮助用户进行 数据挖掘和预测分析。
MATLAB可以进行高效的数值计算,支持 多种数值计算方法,包括线性代数、微积 分、微分方程等。
matlab教程ppt(完整版)

控制流语句
使用条件语句(如if-else)和 循环语句(如for)来控制程序 流程。
变量定义
使用赋值语句定义变量,例如 `a = 5`。
矩阵运算
使用矩阵进行数学运算,如加 法、减法、乘法和除法等。
函数编写
创建自定义函数来执行特定任 务。
02
MATLAB编程语言基础
变量与数据类型
变量命名规则
数据类型转换
编辑器是一个文本编辑器 ,用于编写和编辑 MATLAB脚本和函数。
工具箱窗口提供了一系列 用于特定任务的工具和功 能,如数据可视化、信号 处理等。
工作空间窗口显示当前工 作区中的变量,可以查看 和修改变量的值。
MATLAB基本操作
数据类型
MATLAB支持多种数据类型, 如数值型、字符型和逻辑型等 。
04
MATLAB数值计算
数值计算基础
01
02
03
数值类型
介绍MATLAB中的数值类 型,包括双精度、单精度 、复数等。
变量赋值
讲解如何给变量赋值,包 括标量、向量和矩阵。
运算符
介绍基本的算术运算符、 关系运算符和逻辑运算符 及其优先级。
数值计算函数
数学函数
列举常用的数学函数,如 三角函数、指数函数、对 数函数等。
矩阵的函数运算
总结词:MATLAB提供了许多内置函 数,可以对矩阵进行各种复杂的运算
。
详细描述
矩阵求逆:使用 `inv` 函数求矩阵的 逆。
特征值和特征向量:使用 `eig` 函数 计算矩阵的特征值和特征向量。
行列式值:使用 `det` 函数计算矩阵 的行列式值。
矩阵分解:使用 `factor` 和 `expm` 等函数对矩阵进行分解和计算指数。
matlab里的plot的用法
matlab里的plot的用法Matlab里的plot函数是一种常用的绘图函数,它能够帮助我们可视化数据分布、趋势和关系。
通过plot函数,我们可以创建折线图、散点图、曲线图等,从而更好地理解数据特征。
要使用plot函数,首先需要提供要绘制的数据或函数,然后可以选择性地设置绘图的样式和属性。
下面是plot函数的基本用法:1. 绘制简单折线图```matlabx = [1, 2, 3, 4, 5];y = [2, 4, 6, 8, 10];plot(x, y);```以上代码将绘制一个折线图,x轴代表x数组中的值,y轴代表y数组中的值。
这将创建一个以点连接的简单折线图。
2. 自定义线条样式和颜色```matlabx = linspace(0, 2*pi, 100);y = sin(x);plot(x, y, 'r--', 'LineWidth', 2);```此代码将绘制一个正弦曲线,使用红色虚线作为线条样式,并设置线宽为2。
通过在plot函数中使用字符串参数,可以选择不同的线条样式和颜色。
3. 绘制多个数据集```matlabx = linspace(0, 2*pi, 100);y1 = sin(x);y2 = cos(x);plot(x, y1, 'r-', x, y2, 'b--');legend('Sin', 'Cos');```上述代码将绘制正弦曲线和余弦曲线,并使用图例标识两个数据集。
使用legend函数,我们可以为不同的数据集提供描述性名称。
4. 添加标题、轴标签和图例```matlabx = linspace(0, 2*pi, 100);y = sin(x);plot(x, y);title('Sin Wave');xlabel('X-axis');ylabel('Y-axis');grid on;```以上代码将绘制一个正弦曲线,并添加标题、X轴标签和Y轴标签。
matlab教程ppt(完整版)

汇报人:可编辑
2023-12-24
目录
• MATLAB基础 • MATLAB编程 • MATLAB矩阵运算 • MATLAB数值计算 • MATLAB可视化 • MATLAB应用实例
01
CATALOGUE
MATLAB基础
MATLAB简介
MATLAB定义
MATLAB应用领域
菜单栏
包括文件、编辑、查看、主页 、应用程序等菜单项。
命令窗口
用于输入MATLAB命令并显示 结果。
MATLAB主界面
包括命令窗口、当前目录窗口 、工作空间窗口、历史命令窗 口等。
工具栏
包括常用工具栏和自定义工具 栏。
工作空间窗口
显示当前工作区中的变量。
MATLAB基本操作
变量定义
使用变量名和赋值符号(=)定义变 量。
详细描述
直接输入:在 MATLAB中,可以直 接通过输入矩阵的元 素来创建矩阵。例如 ,`A = [1, 2, 3; 4, 5, 6; 7, 8, 9]`。
使用函数创建: MATLAB提供了多种 函数来创建特殊类型 的矩阵,如`eye(n)`创 建n阶单位矩阵, `diag(v)`创建由向量v 的元素构成的对角矩 阵。
使用bar函数绘制柱状图 ,可以自定义柱子的宽
度、颜色和标签。
使用pie函数绘制饼图, 可以自定义饼块的比例
和颜色。
三维绘图
01
02
03
04
三维线图
使用plot3函数绘制三维线图 ,可以展示三维空间中的数据
点。
三维曲面图
使用surf函数绘制三维曲面图 ,可以展示三维空间中的曲面
。
三维等高线图
第二讲 MATLAB 绘图
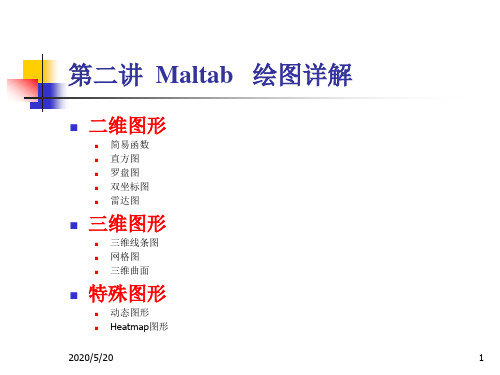
绘制y=1-exp(0.3*t).*cos(0.7*t)
t=6*pi*(0:100)/100; y=1-exp(-0.3*t).*cos(0.7*t); tt=t(find(abs(y-1)>0.05)); ts=max(tt); plot(t,y,'r-'); grid on; axis([0,6*pi,0.6,max(y)]); title('y=1-exp(-\alpha*t)*cos(\omega*t)'); hold on; plot(ts,0.95,'bo'); hold off; set(gca,'xtick',[2*pi,4*pi,6*pi],'ytick',[0.95,1,1.05,max(y)]); grid on;
绘制曲线
x t cos(3t ) , t 2 y t sin t
t = -pi:pi/100:pi; x = t.*cos(3*t); y = t.*sin(t).^2; plot(x,y)
2015-5-14 10
图形标识
图形标识包括:
图名(title) 坐标轴名(xlabel、ylabel) 图形文本注释(text) 图例(legend)
2015-5-14 22
双纵坐标:plotyy指令
plotyy指令调用格式:
plotyy(x1, y1, x2, y2)
x1-y1曲线y轴在左, x2-y2曲线y轴在右。
例3.7:
x = 0:0.01:20; y1 = 200*exp(-0.05*x).*sin(x); y2 = 0.8*exp(-0.5*x).*sin(10*x); plotyy(x,y1,x,y2);
教你如何用matlab绘图(全面)
强大的绘图功能是Matlab的特点之一,Matlab提供了一系列的绘图函数,用户不需要过多的考虑绘图的细节,只需要给出一些基本参数就能得到所需图形,这类函数称为高层绘图函数。
此外,Matlab还提供了直接对图形句柄进行操作的低层绘图操作。
这类操作将图形的每个图形元素(如坐标轴、曲线、文字等)看做一个独立的对象,系统给每个对象分配一个句柄,可以通过句柄对该图形元素进行操作,而不影响其他部分。
本章介绍绘制二维和三维图形的高层绘图函数以及其他图形控制函数的使用方法,在此基础上,再介绍可以操作和控制各种图形对象的低层绘图操作。
一.二维绘图二维图形是将平面坐标上的数据点连接起来的平面图形。
可以采用不同的坐标系,如直角坐标、对数坐标、极坐标等。
二维图形的绘制是其他绘图操作的基础。
一.绘制二维曲线的基本函数在Matlab中,最基本而且应用最为广泛的绘图函数为plot,利用它可以在二维平面上绘制出不同的曲线。
1.plot函数的基本用法plot函数用于绘制二维平面上的线性坐标曲线图,要提供一组x坐标和对应的y坐标,可以绘制分别以x和y为横、纵坐标的二维曲线。
plot函数的应用格式plot(x,y) 其中x,y为长度相同的向量,存储x坐标和y坐标。
例51 在[0 , 2pi]区间,绘制曲线程序如下:在命令窗口中输入以下命令>> x=0:pi/100:2*pi;>> y=2*exp(-0.5*x).*sin(2*pi*x);>> plot(x,y)程序执行后,打开一个图形窗口,在其中绘制出如下曲线注意:指数函数和正弦函数之间要用点乘运算,因为二者是向量。
例52 绘制曲线这是以参数形式给出的曲线方程,只要给定参数向量,再分别求出x,y向量即可输出曲线:>> t=-pi:pi/100:pi;>> x=t.*cos(3*t);>> y=t.*sin(t).*sin(t);>> plot(x,y)程序执行后,打开一个图形窗口,在其中绘制出如下曲线以上提到plot函数的自变量x,y为长度相同的向量,这是最常见、最基本的用法。
MATLAB中绘图命令介绍

MATLAB中绘图命令介绍本节将介绍MATLAB基本xy平面及xyz空间的各项绘图命令,包含一维曲线及二维曲面的绘制。
plot是绘制一维曲线的基本函数,但在使用此函数之前,我们需先定义曲线上每一点的x 及y座标。
下例可画出一条正弦曲线:close all;x=linspace(0, 2*pi, 100); % 100个点的x坐标y=sin(x); % 对应的y坐标plot(x,y);小整理:MATLAB基本绘图函数plot: x轴和y轴均为线性刻度(Linear scale)loglog: x轴和y轴均为对数刻度(Logarithmic scale)semilogx: x轴为对数刻度,y轴为线性刻度semilogy: x轴为线性刻度,y轴为对数刻度若要画出多条曲线,只需将座标对依次放入plot函数即可:hold on 保持当前图形,以便继续画图到当前坐标窗口hold off 释放当前图形窗口title(’图形名称’)(都放在单引号内)xlabel(’x轴说明’)ylabel(’y轴说明’)text(x,y,’图形说明’)legend(’图例1’,’图例2’,…)plot(x, sin(x), x, cos(x));若要改变颜色,在座标对後面加上相关字串即可:plot(x, sin(x), 'c', x, cos(x), 'g');若要同时改变颜色及图线型态,也是在座标对後面加上相关字串即可:plot(x, sin(x), 'co', x, cos(x), 'g*');小整理:plot绘图函数的叁数字元、颜色元、图线型态,y 黄色 .点k 黑色o 圆w 白色x xb 蓝色+ +g 绿色* *r 红色- 实线c 亮青色: 点线m 锰紫色-. 点虚线-- 虚线 plot3三维曲线作图图形完成后,我们可用axis([xmin,xmax,ymin,ymax])函数来调整图轴的范围:axis([0, 6, -1.2, 1.2]);axis函数的功能丰富,其常用的用法有:axis equal :纵横坐标轴采用等长刻度axis square:产生正方形坐标系(默认为矩形)axis auto:使用默认设置axis off:取消坐标轴axis on :显示坐标轴此外,MATLAB也可对图形加上各种注解与处理:xlabel('Input Value'); % x轴注解ylabel('Function Value'); % y轴注解title('Two Trigonometric Functions'); % 图形标题legend('y = sin(x)','y = cos(x)'); % 图形注解grid on; % 显示格线我们可用subplot来同时画出数个小图形於同一个视窗之中:subplot(2,2,1); plot(x,sin(x));subplot(2,2,2); plot(x,cos(x));subplot(2,2,3); plot(x,sinh(x));subplot(2,2,4); plot(x, cosh(x));MATLAB还有其他各种二维绘图函数,以适合不同的应用,详见下表。
如何在Matlab中进行二维和三维绘图
如何在Matlab中进行二维和三维绘图在科学研究和工程领域,数据可视化是一项十分重要的任务,而Matlab作为一种功能强大的数值计算和数据分析软件,自然也提供了丰富的绘图功能。
本文将介绍如何在Matlab中进行二维和三维绘图,并探讨一些常见的绘图技巧和应用。
一、二维绘图Matlab中的二维绘图是最常见和基础的绘图任务之一。
在绘制二维图形时,我们通常会用到plot函数。
这个函数可以接受单个向量作为输入,将这个向量的值作为y轴上的数据点,自动生成与该向量长度相同的x轴坐标。
例如,我们可以用以下代码绘制一个简单的二维折线图:```x = 0:0.1:2*pi;y = sin(x);plot(x, y);```上述代码中,x参量取从0到2π的均匀间隔的值,而y则是根据x计算得到的sin函数值。
plot函数会自动根据输入绘制折线图,并添加相应的轴标签和图例。
在实际应用中,我们经常需要绘制多条曲线在同一个坐标系中进行对比分析。
可以通过在plot函数中传入多个x和y向量实现这一功能。
例如,我们可以通过以下代码绘制一个简单的双曲线图:```x = 0:0.1:2*pi;y1 = sin(x);y2 = cos(x);plot(x, y1, x, y2);```这样,就会在同一个坐标系中同时绘制sin曲线和cos曲线。
除了折线图,Matlab还支持其他常见的二维绘图类型,如散点图、柱状图和面积图等。
这些绘图类型可以通过不同的函数实现,例如scatter、bar和area等。
这里不再一一赘述,读者可以通过Matlab的帮助文档或官方网站了解更多的用法和示例。
二、三维绘图除了二维绘图,Matlab也提供了丰富的三维绘图功能,用于可视化更为复杂的数据和模型。
在绘制三维图形时,我们通常会用到surf函数。
这个函数可以接受两个二维矩阵作为输入,将这两个矩阵的值分别作为x、y轴上的坐标,而将第三个二维矩阵的值作为z轴上的数据点。
四讲Matlab绘图ppt课件
2024/2/12
8
一、二维图形
h o m e 移动光标到命令窗口的左上角。
hold on 保持当前图形。允许在当前图 形状态下,使用同样的缩放比例加入另 一个图形。
hold off 释放图形窗口,这样下一个图 形将称为当前图形。这是缺省状态。
h o l d 在hold on和hold off之间 进行切换。
2024/2/12
9
一、二维图形
subplot(m,n,p)将
图形窗口分割成m行n列,并设置p所指定
的子窗口为当前窗口。子窗口按行由左
至右,由上至下进行编号。这一命令在 M AT L A B的当前版本中也被写作s u b p l o t ( m n p )。
s u b p l o t 设置图形窗口为缺省模 式,即单窗口模式。等价于s u b p l o t ( 1 , 1 , 1 )。
2024/2/12
24
三、三维图形
•p l o t 3 ( x 1 , y 1 , z 1 , str1,x2,y2,z2,s t r 2 ,. . .)用字符串s t r 1确定的 线型和颜色对x 1 , y 1 , z 1绘图,用字符 串s t r 2确定的线型和颜色对x2, y2, z2 绘图. . .。如果省略s t r 1 , s t r 2,. . ., M AT L A B将自动选择线型和颜色。
2024/2/12
25
三、三维图形
m e s h ( X,Y,Z ) 将矩阵Z中的各个
元素作为矩形网格上的高度,对这些值 绘图,并且将相邻的点连接形成三维网 格表面图。颜色由高度,即Z中的元素指 定。
s u r f ( X , Y , Z) 绘制出由坐标
MATLAB作图(超详细)

2020/5/31
数学建模
3. 对数坐标图
在很多工程问题中,通过对数据进行对数转换可以 更清晰地看出数据的某些特征,在对数坐标系中描绘数 据点的曲线,可以直接地表现对数转换.对数转换有双对 数坐标转换和单轴对数坐标转换两种.用loglog函数 可以实现双对数坐标转换,用semilogx和semilogy 函数可以实现单轴对数坐标转换. loglog(Y) 表示 x、y坐标都是对数坐标系
单击鼠标左键,则在当前图形窗口中,以鼠标点中的点为 中心的图形放大2倍;单击鼠标右键,则缩小2倍.
zoom off 关闭缩放模式
grid on
%标注格栅
MATLAB liti37
例 创建一个简单的半对数坐标图. 解 输入命令:
x=0:.1:10;
semilogy(x,10.^x)
MATLAB liti38
例 绘制y=x3的函数图、对数坐标图、半对数坐标图.
2020/5/31
MATLAB liti22 数学建模
返回
三维图形 1. 空间曲线 2. 空间曲面
semilogx(Y) 表示 x坐标轴是对数坐标系
semilogy(…) 表示y坐标轴是对数坐标系
plotyy 有两个y坐标轴,一个在左边,一个在右边
2020/5/31
数学建模
例 用方形标记创建一个简单的loglog.
解 输入命令:
x=logspace(-1,2);
loglog(x,exp(x),’-s’)
数学建模
返回
2. 定制坐标 Axis([xmin xmax ymin ymax zmin zmax])定制图形坐标
x、y、z的最大、最小值
Axis
将坐标轴返回到自动缺省值
第四章___matlab_绘图

例,绘制阶梯曲线 x=0:pi/20:2*pi;y=sin(x);stairs(x,y)
1
0 .8
0 .6
0 .4
0 .2
0
-0 .2
-0 .4
-0 .6
-0 .8
-1
0
1
2
3
4
5
6
7
例:阶梯绘图
h2=[1 1;1 -1];h4=[h2 h2;h2 -h2]; h8=[h4 h4;h4 -h4];t=1:8; subplot(8,1,1);stairs(t,h8(1,:));axis('off') subplot(8,1,2);stairs(t,h8(2,:));axis('off') subplot(8,1,3);stairs(t,h8(3,:));axis('off') subplot(8,1,4);stairs(t,h8(4,:));axis('off') subplot(8,1,5);stairs(t,h8(5,:));axis('off') subplot(8,1,6);stairs(t,h8(6,:));axis('off') subplot(8,1,7);stairs(t,h8(7,:));axis('off') subplot(8,1,8);stairs(t,h8(8,:));axis('off')
1 0.8 0.6 0.4 0.2
0 -0.2 -0.4
y
y1 y2
例 3:y=sin(t);y1=sin(t+0.25);y2=sin(t+0.5); y3=cos(t);y4=cos(t+0.25);y5=cos(t+0.5); plot(t,[y',y1',y2',y3',y4',y5'])
ch8_研究结果的可视化:MATLAB图形绘制

>> x1=linspace(0,2*pi,100);
>> x2=linspace(0,3*pi,100);
>> x3=linspace(0,4*pi,100);
>> y1=sin(x1);
>> y2=1+sin(x2);
3
>> y3=2+sin(x3); >> x=[x1;x2;x3]'; >> y=[y1;y2;y3]';
y = 200*sin(x)/x
200
1
0
y
0
-200
-1
-20
0
20
-2
饼图
赵
1
钱
谢
0 孙
李
-1
-10罗盘图12来自 1509010 56030
2
180
0
0
210
330
240270300
-2
0
单位圆
0 x 楼梯图
0 羽毛图
10
心形图
120 150
90
2 16030
180
0
210
330
2
r2=4012+7c0o3s00(t)
axes('pos',[0.1 0.2 0.8 0.7],'tag','axes1'); uicontrol('style','push',...
'units','normalized',... 'pos',[0.65 0.05 0.1 0.08], ... 'fontsize',12,... 'fontweight','bold',... 'string','绘 图',... 'tag','PlotButton',... 'callback',... ['x = 0:0.05:2*pi;'... 'y = sin(x);'... 'plot(x,y);']); uicontrol('style','push',... 'units','normalized',... 'pos',[0.8 0.05 0.1 0.08], ... 'fontsize',12,... 'fontweight','bold',... 'string','擦 除',... 'tag','ClearButton',... 'callback','cla;');
matlab绘图大全
matlab绘图删除5.1 二维数据曲线图5.1.1 绘制单根二维曲线plot函数的基本调用格式为:plot(x,y)其中x和y为长度相同的向量,分别用于存储x坐标和y坐标数据。
例5-1 在0≤x≤2p区间内,绘制曲线y=2e-0.5xcos(4πx)程序如下:x=0:pi/100:2*pi;y=2*exp(-0.5*x).*cos(4*pi*x);plot(x,y)例5-2 绘制曲线。
程序如下:t=0:0.1:2*pi;x=t.*sin(3*t);y=t.*sin(t).*sin(t);plot(x,y);plot函数最简单的调用格式是只包含一个输入参数:plot(x)在这种情况下,当x是实向量时,以该向量元素的下标为横坐标,元素值为纵坐标画出一条连续曲线,这实际上是绘制折线图。
5.1.2 绘制多根二维曲线1.plot函数的输入参数是矩阵形式(1) 当x是向量,y是有一维与x同维的矩阵时,则绘制出多根不同颜色的曲线。
曲线条数等于y矩阵的另一维数,x被作为这些曲线共同的横坐标。
(2) 当x,y是同维矩阵时,则以x,y对应列元素为横、纵坐标分别绘制曲线,曲线条数等于矩阵的列数。
(3) 对只包含一个输入参数的plot函数,当输入参数是实矩阵时,则按列绘制每列元素值相对其下标的曲线,曲线条数等于输入参数矩阵的列数。
当输入参数是复数矩阵时,则按列分别以元素实部和虚部为横、纵坐标绘制多条曲线。
2.含多个输入参数的plot函数调用格式为:plot(x1,y1,x2,y2,…,xn,yn)(1) 当输入参数都为向量时,x1和y1,x2和y2,…,xn和yn分别组成一组向量对,每一组向量对的长度可以不同。
每一向量对可以绘制出一条曲线,这样可以在同一坐标内绘制出多条曲线。
(2) 当输入参数有矩阵形式时,配对的x,y按对应列元素为横、纵坐标分别绘制曲线,曲线条数等于矩阵的列数。
例5-3 分析下列程序绘制的曲线。
x1=linspace(0,2*pi,100);x2=linspace(0,3*pi,100);x3=linspace(0,4*pi,100);y1=sin(x1);y2=1+sin(x2);y3=2+sin(x3);x=[x1;x2;x3]';y=[y1;y2;y3]';plot(x,y,x1,y1-1)3.具有两个纵坐标标度的图形在MATLAB中,如果需要绘制出具有不同纵坐标标度的两个图形,可以使用plotyy绘图函数。
matlab三维绘图命令和演示

三维绘图2 基本XYZ立体绘图命令●mesh和plot是三度空间立体绘图的基本命令,mesh可画出立体网状图,plot则可画出立体曲面图,两者产生的图形都会依高度而有不同颜色。
下列命令可画出由函数形成的立体网状图:x=linspace(-2, 2, 25); % 在x轴上取25点y=linspace(-2, 2, 25); % 在y轴上取25点[xx,yy]=meshgrid(x, y); % xx和yy都是25x25的矩阵zz=xx.*exp(-xx.^2-yy.^2); % 计算函数值,zz也是21x21的矩阵mesh(xx, yy, zz); % 画出立体网状图●surf和mesh的用法类似:x=linspace(-2, 2, 25); % 在x轴上取25点y=linspace(-2, 2, 25); % 在y轴上取25点[xx,yy]=meshgrid(x, y); % xx和yy都是25x25的矩阵zz=xx.*exp(-xx.^2-yy.^2); % 计算函数值,zz也是25x25的矩阵surf(xx, yy, zz); % 画出立体曲面图●peaks为了方便测试立体绘图,MATLAB提供了一个peaks函数,可产生一个凹凸有致的曲面,包含了三个局部极大点及三个局部极小点,其方程式为:要画出此函数的最快方法即是直接键入peaks:peaksz = 3*(1-x).^2.*exp(-(x.^2) - (y+1).^2) - 10*(x/5 - x.^3 - y.^5).*exp(-x.^2-y.^2) - 1/3*exp(-(x+1).^2 - y.^2)●我们亦可对peaks函数取点,再以各种不同方法进行绘图。
meshz可将曲面加上围裙:[x,y,z]=peaks;meshz(x,y,z);●waterfall可在x方向或y方向产生水流效果:[x,y,z]=peaks;waterfall(x,y,z);●下列命令产生在y方向的水流效果:[x,y,z]=peaks;waterfall(x',y',z');●meshc同时画出网状图与等高线:[x,y,z]=peaks;meshc(x,y,z);●surfc同时画出曲面图与等高线:[x,y,z]=peaks;surfc(x,y,z);●contour3画出曲面在三度空间中的等高线:contour3(peaks, 20);●contour画出曲面等高线在XY平面的投影:contour(peaks, 20);plot3可画出三度空间中的曲线:t=linspace(0,20*pi, 501);plot3(t.*sin(t), t.*cos(t), t);亦可同时画出两条三度空间中的曲线:t=linspace(0, 10*pi, 501);plot3(t.*sin(t), t.*cos(t), t, t.*sin(t), t.*cos(t), -t);三维绘图的主要功能:绘制三维线图绘制等高线图绘制伪彩色图绘制三维网线图绘制三维曲面图、柱面图和球面图绘制三维多面体并填充颜色(一)三维线图plot3 ——基本的三维图形指令调用格式:plot3(x,y,z) —— x,y,z是长度相同的向量plot3(X,Y,Z) —— X,Y,Z是维数相同的矩阵plot3(x,y,z,s) ——带开关量plot3(x1,y1,z1,’s1’,x2,y2,z2,’s2’,…)二维图形的所有基本特性对三维图形全都适用。
MATLAB中绘图命令介绍

MATLAB中绘图命令介绍本节将介绍MATLAB基本xy平面及xyz空间的各项绘图命令,包含一维曲线及二维曲面的绘制。
plot是绘制一维曲线的基本函数,但在使用此函数之前,我们需先定义曲线上每一点的x 及y座标。
下例可画出一条正弦曲线:close all;x=linspace(0, 2*pi, 100); % 100个点的x坐标y=sin(x); % 对应的y坐标plot(x,y);小整理:MATLAB基本绘图函数plot: x轴与y轴均为线性刻度(Linear scale)loglog: x轴与y轴均为对数刻度(Logarithmic scale)semilogx: x轴为对数刻度,y轴为线性刻度semilogy: x轴为线性刻度,y轴为对数刻度若要画出多条曲线,只需将座标对依次放入plot函数即可:hold on 保持当前图形,以便继续画图到当前坐标窗口hold off 释放当前图形窗口title(’图形名称’)(都放在单引号内)xlabel(’x轴说明’)ylabel(’y轴说明’)text(x,y,’图形说明’)legend(’图例1’,’图例2’,…)plot(x, sin(x), x, cos(x));若要改变颜色,在座标对後面加上相关字串即可:plot(x, sin(x), 'c', x, cos(x), 'g');若要同时改变颜色及图线型态,也是在座标对後面加上相关字串即可:plot(x, sin(x), 'co', x, cos(x), 'g*');小整理:plot绘图函数的叁数字元、颜色元、图线型态,y 黄色 .点k 黑色o 圆w 白色x xb 蓝色++g 绿色* *r 红色- 实线c 亮青色: 点线m锰紫色-. 点虚线-- 虚线plot3 三维曲线作图图形完成后,我们可用axis([xmin,xmax,ymin,ymax])函数来调整图轴的范围: axis([0, 6, -1.2, 1.2]);axis函数的功能丰富,其常用的用法有:axis equal :纵横坐标轴采用等长刻度axis square:产生正方形坐标系(默认为矩形)axis auto:使用默认设置axis off:取消坐标轴axis on :显示坐标轴此外,MATLAB也可对图形加上各种注解与处理:xlabel('Input Value'); % x轴注解ylabel('Function Value'); % y轴注解title('Two Trigonometric Functions'); % 图形标题legend('y = sin(x)','y = cos(x)'); % 图形注解grid on; % 显示格线我们可用subplot来同时画出数个小图形於同一个视窗之中:subplot(2,2,1); plot(x, sin(x));subplot(2,2,2); plot(x, cos(x));subplot(2,2,3); plot(x, sinh(x));subplot(2,2,4); plot(x, cosh(x));MATLAB还有其他各种二维绘图函数,以适合不同的应用,详见下表。
matlab绘图教学课件

坐标轴范围
使用xlim和ylim命令控制坐标轴的范围。
坐标轴比例
使用axis命令设置坐标轴的比例,如axis equal确保x轴和y轴比例 一致。
坐标轴标签字体和颜色
使用set命令设置坐标轴标签的字体和颜色等属性。
CHAPTER
02
绘制二维图形
绘制线形图
总结词
展示数据变化趋势
详细描述
线形图用于展示数据随时间或其他变量的变化趋势,通过连接数据点形成线条 ,可以直观地展示数据的走势。
绘制三维柱状图
总结词
三维柱状图是一种展示三维空间中数据分布的图表类型,可以清晰地展示各个数据点在 三个维度上的差异。
详细描述
在Matlab中,可以使用bar3函数绘制三维柱状图。该函数可以接受三个维度的数据, 并按照指定的样式绘制三维柱状图。可以通过调整柱子的颜色、透明度、大小等属性,
来增强三维柱状图的视觉效果。
CHAPTER
05
Matlab绘图应用实例
绘制股票价格走势图
总结词
展示股票价格随时间变化的趋势
详细描述
使用Matlab绘制股票价格走势图,可以清晰地展示股票 价格随时间的变化趋势。通过将股价数据导入Matlab中 ,并使用绘图函数进行绘制,可以方便地观察股票价格 的波动情况。
绘制雷达图
总结词
展示多维数据的综合表现
Matlab绘图教学课件
CONTENTS
目录
• Matlab绘图基础 • 绘制二维图形 • 绘制三维图形 • 图形的高级处理 • Matlab绘图应用实例
CHAPTER
01
Matlab绘图基础
基础绘图函数
01 plot函数:用于绘制二维线图,是最常用 的绘图函数。
- 1、下载文档前请自行甄别文档内容的完整性,平台不提供额外的编辑、内容补充、找答案等附加服务。
- 2、"仅部分预览"的文档,不可在线预览部分如存在完整性等问题,可反馈申请退款(可完整预览的文档不适用该条件!)。
- 3、如文档侵犯您的权益,请联系客服反馈,我们会尽快为您处理(人工客服工作时间:9:00-18:30)。
Matlab 各种类型图表演示(2014) 说明强大的绘图功能是Matlab的特点之一,Matlab提供了十分丰富的的绘图函数,用户不需要过多的考虑绘图的细节,只需要给出一些基本参数就能得到所需图形。
尤其是Matlab 2014a/2014b 采用了全新的绘图系统,图表颜色配置,输出图片质量大大提高. 这里收集了一些Matlab绘图演示实例,从简单的plot到复杂的动画都有.大部分例子来自Mathworks官网, 版权归Mathworks公司. 本人也将逐步加入自己编的绘图例子, 欢迎持续关注,交流[QQ: 2953212138]目录Matlab 各种类型图表演示(2014) (1)说明 (1)基本绘图 (4)plot (1) (4)plot (2) (5)plot (3) (6)ezplot 1 (7)ezplot 2 (8)plot3 (9)ezplot3 (10)loglog (11)Semilogx (12)Semilogy (13)Vertical Bar (14)bar (15)bar3 (17)hist (18)pie (2) (21)pie3 (22)Area (23)contour (24)ezcontourf (25)polar (26)ezpolar (27)rose (28)scatter (29)scatter3 (30)stem (31)stair (33)gplot (34)fill (35)errorbar (36)plotyy (37)subplot (39)subplot (40)image (1) (42)image (2) (43)image (3) (44)quiver (45)quiver3 (46)ribbon (47)surf (1) (48)surf (2) (49)ezsurf (50)mesh (51)ezmesh (52)triplot (54)定制绘图风格 (55)Standard Line Colors (55)Standard Line Styles (56)Standard Plot Markers (57)colorbar (1) (58)colorbar (2) (59)Adding Lines to Plots (60)Adding Text to Plots (1) (61)Adding Text to Plots (2) (62)Adding Latex to Plots (63)shading (64)light, lighting (65)Change Lighting to Phong (66)高级绘图 (68)Area Bar Pie Charts with Annotations (68)Colormap Chart (70)Curve with Lower and Upper Bounds (71)Plot in Plot (72)Publication Quality Graphics (73)Streamline (75)Two Waves (76)win (77)Animation (78)基本绘图plot (1)% Define values for x, y1, and y2x = 0: .1 : 2*pi;y1 = cos(x);y2 = sin(x);% Plot y1 vs. x (blue, solid) and y2 vs. x (red, dashed) figureplot(x, y1, 'b', x, y2, 'r-.', 'LineWidth', 2)% Turn on the gridgrid on% Set the axis limitsaxis([0 2*pi -1.5 1.5])% Add title and axis labelstitle('Trigonometric Functions')xlabel('angle')ylabel('sin(x) and cos(x)')% Load data for the stock indicesload IndexData dates values series% Plot the stock index values versus time figureplot(dates, values)% Use dateticks for the x axisdatetick('x')% Add title and axis labelsxlabel('Date')ylabel('Index Value')title('Relative Daily Index Closings')% Add a legend in the top, left corner legend(series, 'Location', 'NorthWest')% Load Morse dataload MDdata dissimilarities dist1 dist2 dist3% Plot the first set of data in bluefigureplot(dissimilarities, dist1, 'bo')hold on% Plot the second set of data in redplot(dissimilarities, dist2, 'r+')% Plot the third set of data in greenplot(dissimilarities, dist3, 'g^')% Add title and axis labelstitle('Morse Signal Analysis')xlabel('Dissimilarities')ylabel('Distances')% Add a legendlegend({'Stress', 'Sammon Mapping', 'Squared Stress'}, ...'Location', 'NorthWest')% Create the plot using the lemniscate function f(x,y) = (x^2 + y^2)^2 - x^2 + y^2 figureezplot('(x^2 + y^2)^2 - x^2 + y^2', [-1.1, 1.1], [-1.1, 1.1])% Adjust the colormap to plot the function in bluecolormap([0 0 1])% Add a multi-line titletitle({'Lemniscate Function', '(x^2 + y^2)^2 - x^2 + y^2'})% Create a series of lines for the function f(x,y) = y^2 - x^2 + c figureezplot('y^2 - x^2 + 4', [-3 3], [-3 3])hold onezplot('y^2 - x^2 + 2', [-3 3], [-3 3])ezplot('y^2 - x^2', [-3 3], [-3 3])ezplot('y^2 - x^2 - 2', [-3 3], [-3 3])ezplot('y^2 - x^2 - 4', [-3 3], [-3 3])% Adjust the colormap to plot the function in blue colormap([0 0 1])grid on% Add titletitle('y^2 - x^2 - c = 0 for c = -4, 4')plot3% Load the spectra dataload spectraData masscharge time spectra% Create the 3D plotfigureplot3(masscharge, time, spectra)box on% Set the viewing angle and the axis limits view(26, 42)axis([500 900 0 22 0 4e8])% Add title and axis labelsxlabel('Mass/Charge (M/Z)')ylabel('Time')zlabel('Ion Spectra')title('Extracted Spectra Subset')ezplot3% Create the plot using the parametric functions% x = cost(t), y = sin(t), and z = sin(5*t) for -pi < t < pi figureezplot3('cos(t)', 'sin(t)', 'sin(5*t)', [-pi pi])loglog% Create a set of values for the damping factorzeta = [0.01 .02 0.05 0.1 .2 .5 1];% Define a color for each damping factorcolors = ['r' 'g' 'b' 'c' 'm' 'y' 'k'];% Create a range of frequency values equally spaced logarithmically w = logspace(-1, 1, 1000);% Plot the gain vs. frequency for each of the seven damping factors figurefor i = 1:7a = w.^2 - 1;b = 2*w*zeta(i);gain = sqrt(1./(a.^2 + b.^2));loglog(w, gain, 'color', colors(i))hold onend% Set the axis limitsaxis([0.1 10 0.01 100])% Add a title and axis labelstitle('|G|(\omega) vs \omega')xlabel('\omega')ylabel('|G|(\omega)')% Turn the grid ongrid on% Load the response dataload responseData frequency magnitude% Create an x-axis semilog plot using the semilogx function figuresemilogx(frequency, magnitude)% Set the axis limits and turn on the gridaxis([min(frequency) max(frequency) -6.5 6.5])grid on% Add title and axis labelstitle('Magnitude Response (dB)')xlabel('Frequency (kHz)')ylabel('Magnitude (dB)')% Create some dataeb = 0:5;SER = [0.1447 0.1112 0.0722 0.0438 0.0243 0.0122]; BER = [0.0753 0.0574 0.0370 0.0222 0.0122 0.0061];% Create a y-axis semilog plot using the semilogy function % Plot SER data in blue and BER data in redfiguresemilogy(eb, SER, 'bo-')hold onsemilogy(eb, BER, 'r^-')% Turn on the gridgrid on% Add title and axis labelstitle('Performance of Baseband QPSK')xlabel('EbNo (dB)')ylabel('SER and BER')Vertical Bar% Create data for childhood disease casesmeasles = [38556 24472 14556 18060 19549 8122 28541 7880 3283 4135 7953 1884]; mumps = [20178 23536 34561 37395 36072 32237 18597 9408 6005 6268 8963 13882]; chickenPox = [37140 32169 37533 39103 33244 23269 16737 5411 3435 6052 12825 23332];% Create a vertical bar chart using the bar functionfigurebar(1:12, [measles' mumps' chickenPox'], 1)% Set the axis limitsaxis([0 13 0 40000])set(gca, 'XTick', 1:12)% Add title and axis labelstitle('Childhood diseases by month')xlabel('Month')ylabel('Cases (in thousands)')% Add a legendlegend('Measles', 'Mumps', 'Chicken pox')bar% Create data for childhood disease casesmeasles = [38556 24472 14556 18060 19549 8122 28541 7880 3283 4135 7953 1884]'; mumps = [20178 23536 34561 37395 36072 32237 18597 9408 6005 6268 8963 13882]'; chickenPox = [37140 32169 37533 39103 33244 23269 16737 5411 3435 6052 12825 23332]';% Create a stacked bar chart using the bar functionfigurebar(1:12, [measles mumps chickenPox], 0.5, 'stack')% Adjust the axis limitsaxis([0 13 0 100000])set(gca, 'XTick', 1:12)% Add title and axis labelstitle('Childhood diseases by month')xlabel('Month')ylabel('Cases (in thousands)')% Add a legendlegend('Measles', 'Mumps', 'Chicken pox')Horizontal Bar% Create the data for the temperatures and monthstemperatures = [40.5 48.3 56.2 65.3 73.9 69.9 71.1 59.5 48.7 35.3 31.7 30.0]; months = {'Dec', 'Nov', 'Oct', 'Sep', 'Aug', 'Jul', 'Jun', 'May', 'Apr', 'Mar', 'Feb', 'Jan'};% Plot the temperatures on a horizontal bar chartfigurebarh(temperatures)% Set the axis limitsaxis([0 80 0 13])% Add a titletitle('Boston Monthly Average Temperature - 2001')% Change the Y axis tick labels to use the monthsset(gca, 'YTick', 1:12)set(gca, 'YTickLabel', months)% Load monthly temperature dataload MonthlyTemps temperatures months years% Create the 3D bar chartfigurebar3(temperatures)axis([0 13 0 12 0 80])% Add title and axis labelstitle('Boston Monthly Temperatures 1900-2000') xlabel('Month')ylabel('Year')zlabel('Temperature')% Change the x and y axis tick labelsset(gca, 'XTickLabel', months)set(gca, 'YTickLabel', years)% Load nucleotide dataload nucleotideData ncount% Create the histogram using the hist function figurehist(ncount)colormap summer% Add a legendlegend('A', 'C', 'G', 'T')% Add title and axis labelstitle('Histogram of nucleotide type distribution') xlabel('Occurrences')ylabel('Number of sequence reads')pie (1)% Load the data for US population by age 1860-2000load populationAge population groups% Get the population for each age group for the year 2000age2000 = population(15, :);% Create a pie chart using the pie function -- use age groups as labels figurepie(age2000, groups)% Add titletitle('US population by age for the year 2000')pie (2)% Load the data for South American populationsload SouthAmericaPopulations populations countries% Calculate the total populations and percentage by country total = sum(populations);percent = populations/total;% Create a pie chart with sections 3 and 6 explodedfigureexplode = [0 0 1 0 0 1 0 0];pie(percent, explode, countries)% Add titletitle('South American Population by Country')% Create some datax = [1 3 0.5 2.5 2];% Create a 3D pie chart using the pie3 function figureexplode = [0 1 0 0 0];pie3(x, explode)% Add a titletitle('Pie3 Chart')% Load population dataload PopulationAge years population groups% Create the area plot using the area function figurearea(years, population/1000000)colormap winter% Add a legendlegend(groups, 'Location', 'NorthWest')% Add title and axis labelstitle('US Population by Age (1860 - 2000)') xlabel('Years')ylabel('Population in Millions')contour% Load position and elevation data for Mount Bruno load mtBruno Longitude Latitude Elevation% Create a contour plot with 8 contour levels figurecontour(Longitude, Latitude, Elevation, 8)% Add title and exis labelstitle('Mount Bruno Elevation')xlabel('Longitude')ylabel('Latitude')ezcontourf% Create the contour plot using the function f(x,y) = sin(3*x)*cos(x+y) figureezcontourf('sin(3*x)*cos(x+y)', [0, 3, 0, 3])% Change the default colormap to 'spring'colormap('spring')polar% Create data for the functiont = 0:0.01:2*pi;r = abs(sin(2*t).*cos(2*t));% Create a polar plot using the function polar figurepolar(t, abs(sin(2*t).*cos(2*t)))% Add a titletitle('abs(sin(2t)*cos(2t))')ezpolar% Create the plot using the function r(t) = 1 + cos(t)*sin(t)^2 figureezpolar('1+cos(t)*sin(t)^2')rose% Load sunspot dataload sunspotData sunspot% Create a rose plot with 24 sectors figurerose(sunspot, 24)% Add titletitle('Sunspot Frequency')% Load undersea elevation dataload seamount x y z% Create a scatter plot using the scatter function figurescatter(x, y, 10, z)% Add title and axis labelstitle('Undersea Elevation')xlabel('Longitude')ylabel('Latitude')% Load data on ozone levelsload ozoneData Ozone Temperature WindSpeed SolarRadiation% Calculate the ozone levelsz = (Ozone).^(1/3);response = z;% Make a color index for the ozone levelsnc = 16;offset = 1;c = response - min(response);c = round((nc-1-2*offset)*c/max(c)+1+offset);% Create a 3D scatter plot using the scatter3 functionfigurescatter3(Temperature, WindSpeed, SolarRadiation, 30, c, 'filled')view(-34, 14)% Add title and axis labelstitle('Ozone Levels'); xlabel('Temperature'); ylabel('Wind Speed');zlabel('Solar Radiation')% Add a colorbar with tick labelscolorbar('Location', 'EastOutside', 'YTickLabel',…{'2 ppm', '4 ppm', '6 ppm', '8 ppm','10 ppm', '12 ppm', '14 ppm'})stem% Load amplitude dataload amplitudeData sample amplitude% Create a stem plot using the stem function figurestem(sample, amplitude, 'filled', 'b')% Adjust the axis limitsaxis([0 53 -1.2 1.2])% Add title and axis labelstitle('FIR Polyphase Interpolator')xlabel('Samples')ylabel('Amplitude')stem% Load the filter dataload filterData time signal filter1 filter2% Create a stem plot using the stem function figurestem(time, signal, 'filled')hold on% Add the second and third data sets to the plot stem(time - 0.2, filter1, 'c', 'filled')stem(time - 0.4, filter2, 'm', 'filled')% Add a legendlegend('Input Signal', 'Input Delayed by 0.2', ...'Input Delayed by 0.4', 'Location', 'SouthWest')% Load data on beak lengthload beaksData beaks% Calculate histograms for the beak data minBeak = min(beaks);maxBeak = max(beaks);nbins = minBeak:0.2:maxBeak;[nB, xB] = hist(beaks, nbins);% Create a stair plot of beak sizes figurestairs(xB, nB/sum(nB), 'b')% Add title and axis labelstitle('Ground finch beak sizes')xlabel('Beak size in mm')ylabel('Fraction of birds with beak size')% Create the onnectivity graph of the Buckminster Fuller geodesic dome [B, V] = bucky;H = sparse(60, 60);k = 31:60;H(k, k) = B(k, k);% Visualize the graph using the gplot function (blue)figuregplot(B - H, V, 'b-')hold on% Visualize a rotation of the graph (red)gplot(H, V, 'r-')axis off equalfill% Create a yellow trianglefigurex = [0.25, 1.0, 1.0];y = [0.25, 0.25, 1.0];fill(x, y, 'y')hold on% Create an orange diamondx = [2.0, 2.25, 2.0, 1.75];y = [1.25, 1.55, 2.25, 1.5];c = [1 0.8 0.3];fill(x, y, c)% Create a blue rectangleleft = 3.0;right = left + 0.5;bottom = 1.0;top = bottom + 1;x = [left left right right];y = [bottom top top bottom];fill(x, y, 'b')% Create a purple transparent circle xc = 3.0;yc = 1.0;r = 0.5;x = r*sin(-pi:0.1*pi:pi) + xc;y = r*cos(-pi:0.1*pi:pi) + yc;c = [0.6 0 1];fill(x, y, c, 'FaceAlpha', 0.4)% Create a light blue starxc = 1.0;yc = 3.0;t = (-1/4:1/10:3/4)*2*pi;r1 = 0.5;r2 = 0.2; r = (r1+r2)/2 + (r1-r2)/2*(-1).^[0:10]; x = r.*cos(t) + xc;y = r2 - r.*sin(t) + yc;c = [0.6 0.8 1.0];fill(x, y, c)% Create a green transparent ellipse xc = 0.75;yc = 2.5;x = 0.4*sin(-pi:0.1*pi:pi) + xc;y = 0.7*cos(-pi:0.1*pi:pi) + yc;c = [0 0.5 0];fill(x, y, c, 'FaceAlpha', 0.2)% Create a red stop signt = (1/16:1/8:1)'*2*pi;x = 0.4*sin(t) + 3;y = 0.4*cos(t) + 3;fill(x, y ,'r', 'FaceAlpha', 1)% Set the axis limitsaxis([0 4 0 4])axis square% Add a titletitle('Filled Polygons')errorbar% Load Fisher data for three varieties of irisload fisheriris meas% Extract the data for each varietysetosa = meas(1:50, :);virginica = meas(51:100, :);versicolor = meas(101:150, :);% Calculate the means and standard deviations for each variety irisMeans = [mean(setosa); mean(virginica); mean(versicolor)]; irisSTDs = [std(setosa); std(virginica); std(versicolor)];% Draw error bar chart with means and standard deviationsfigureerrorbar(irisMeans, irisSTDs, 's')% Add title and axis labelstitle('Comparison of three species in the Fisher Iris data')xlabel('Species of Iris')ylabel('Mean size in mm')box on% Change the labels for the tick marks on the x-axisirisSpecies = {'Setosa', 'Virginica', 'Versicolor'};set(gca, 'XTick', 1:3, 'XTickLabel', irisSpecies)% Create labels for the legendirisMeas = {'Sepal length', 'Sepal width', 'Petal length', 'Petal width'}; legend(irisMeas, 'Location', 'Northwest')plotyy% Create some data for the two curves to be plotted x = 0:0.01:20;y1 = 200*exp(-0.05*x).*sin(x);y2 = 0.8*exp(-0.5*x).*sin(10*x);% Create a plot with 2 y axes using the plotyy function figure[ax, h1, h2] = plotyy(x, y1, x, y2, 'plot');% Add title and x axis labelxlabel('Time in \mu sec.')title('Frequency Response')% Use the axis handles to set the labels of the y axes set(get(ax(1), 'YLabel'), 'String', 'Low Frequency')set(get(ax(2), 'YLabel'), 'String', 'High Frequency')plotyy% Create the data for the plotsTBdata = [1990 4889 16.4; 1991 5273 17.4; 1992 5382 17.4; 1993 5173 16.5;1994 4860 15.4; 1995 4675 14.7; 1996 4313 13.5; 1997 4059 12.5;1998 3855 11.7; 1999 3608 10.8; 2000 3297 9.7; 2001 3332 9.6;2002 3169 9.0; 2003 3227 9.0; 2004 2989 8.2; 2005 2903 7.9;2006 2779 7.4; 2007 2725 7.2];years = TBdata(:,1);cases = TBdata(:,2);rate = TBdata(:,3);% Create a plot with 2 y axes using the plotyy function% Cases are represented by a bar chart ; Infection rate is represented by an xy plot figure[ax, h1, h2] = plotyy(years, cases, years, rate, 'bar', 'plot');% Change the bar colors to light grayset(h1, 'FaceColor', [0.8, 0.8, 0.8])% Chnage the thickness of the lineset(h2, 'LineWidth', 2)% Add title and x axis labeltitle('Tuberculosis Cases: 1991-2007')xlabel('Years')% Use the axis handles to set the labels of the y axesset(get(ax(1), 'YLabel'), 'String', 'Cases')set(get(ax(2), 'YLabel'), 'String', 'Infection rate in cases per thousand')% Create the data to be plottedTBdata = [1990 4889 16.4; 1991 5273 17.4; 1992 5382 17.4; 1993 5173 16.5;1994 4860 15.4; 1995 4675 14.7; 1996 4313 13.5; 1997 4059 12.5;1998 3855 11.7; 1999 3608 10.8; 2000 3297 9.7; 2001 3332 9.6;2002 3169 9.0; 2003 3227 9.0; 2004 2989 8.2; 2005 2903 7.9;2006 2779 7.4; 2007 2725 7.2];measles = [38556 24472 14556 18060 19549 8122 28541 7880 3283 4135 7953 1884]'; mumps = [20178 23536 34561 37395 36072 32237 18597 9408 6005 6268 8963 13882]'; chickenPox = [37140 32169 37533 39103 33244 23269 16737 5411 3435 6052 12825 23332]'; years = TBdata(:, 1);cases = TBdata(:, 2);rate = TBdata(:, 3);% Create the pie chart in position 1 of a 2x2 gridfiguresubplot(2, 2, 1)pie([sum(measles) sum(mumps) sum(chickenPox)], {'Measles', 'Mumps', 'Chicken Pox'})title('Childhood Diseases')% Create the bar chart in position 2 of a 2x2 gridsubplot(2, 2, 2)bar(1:12, [measles/1000 mumps/1000 chickenPox/1000], 0.5, 'stack')xlabel('Month')ylabel('Cases (in thousands)')title('Childhood Diseases')axis([0 13 0 100])set(gca, 'XTick', 1:12)% Create the stem chart in position 3 of a 2x2 gridsubplot(2, 2, 3)stem(years, cases)xlabel('Years')ylabel('Cases')title('Tuberculosis Cases')axis([1988 2009 0 6000])% Create the line plot in position 4 of a 2x2 gridsubplot(2, 2, 4)plot(years, rate)xlabel('Years')ylabel('Infection Rate')title('Tuberculosis Cases') axis([1988 2009 5 20])% Load the data for the North Atlantic imageload NAimage lng lat naimg% Create the image display using the image command figureimage(lng, lat, naimg)% Turn the axes offaxis off% Add titletitle('North Atlantic')% Load the data for the mandrill imageload mandrill X map% Create the image display using the image command figureimage(X)% Use the colormap specified in the image data file colormap(map)% Turn the axes offaxis off% Add titletitle('Mandrill')% Read the data for the original imageoriginal = imread('ngc6543a.jpg');% Create the first image display using the image command figuresubplot(1, 2, 1)image(original)axis square% Add title for first imagetitle('Original image')% Create the data for the second imageheatmap = mean(original, 3);% Create the second image display using the image command subplot(1, 2, 2)image(heatmap)colormap(hot)axis square% Add title for the second imagetitle('Intensity Heat Map')% Create a grid of x and y points[x, y] = meshgrid(-2:.2:2);% Create the function z(x,y) and its gradientz = x.*exp(-x.^2 - y.^2);[dx, dy] = gradient(z, .2, .2);% Create a contour plot of x, y, and z using the contour functionfigurecontour(x,y,z)hold on% Create a quiver plot of x, y, and the gradients using the quiver function q = quiver(x, y, dx, dy);% Set the axis limitsxlim([-2 2])ylim([-2 2])% Add title and axis labelstitle('x*exp(-x^2-y^2)')xlabel('x')ylabel('x')% Create a grid of x,y, and z values[x, y, z] = meshgrid(-0.8:0.2:0.8, -0.8:0.2:0.8, -0.8:0.8:0.8);% Calculate homogenous turbulence values at each (x,y,z)u = sin(pi*x).*cos(pi*y).*cos(pi*z);v = -cos(pi*x).*sin(pi*y).*cos(pi*z);w = sqrt(2/3)*cos(pi*x).*cos(pi*y).*sin(pi*z);% Draw a 3 dimensional quiver plot using the quiver3 function figurequiver3(x, y, z, u, v, z)% Set the axis limitsaxis([-1 1 -1 1 -1 1])% Add title and axis labelstitle('Turbulence Values')xlabel('x')ylabel('x')zlabel('z')% Create a grid of x and y points[x, y] = meshgrid(-2:0.2:2,-2:0.2:2);% Calculate the response values at each pointR = (1./(x.^2+(y-1).^2).^(1/2)) - (1./(x.^2+(y+1).^2).^(1/2));% Create a ribbon point using the ribbon functionfigureribbon(R)% Add title and axis labelstitle('Response')xlabel('x')ylabel('y')zlabel('z')% Create a grid of x and y pointspoints = linspace(-2, 2, 40);[X, Y] = meshgrid(points, points);% Define the function Z = f(X,Y)Z = 2./exp((X-.5).^2+Y.^2)-2./exp((X+.5).^2+Y.^2);% Create the surface plot using the surf command figuresurf(X, Y, Z)% Generate points for a cylinder with profile 2 + sin(t) t = 0:pi/50:2*pi;[x, y, z] = cylinder(2+sin(t));% Create a surface plot using the surf function figuresurf(x, y, z, 'LineStyle', 'none', 'FaceColor', 'interp') colormap('summer')% Turn off the axis and the gridaxis squareaxis offgrid off% Create the plot using the functions% x = sin(pi*u)*sin(pi*u)*cos(v) ; y = sin(pi*u)*sin(pi*u)*sin(v) ; z = u % with - 1 < u < 1 and 0 < v < 2*pifigureezsurf('sin(pi*u)*sin(pi*u)*cos(v)', ...'sin(pi*u)*sin(pi*u)*sin(v)', ...'u', [-1 1 0 2*pi])% Change the view angle for the plotview(135,15)。
