ArcGIS API for Javascript 应用开发入门
arcgis api for javascript 引用
arcgis api for javascript 引用摘要:1.ArcGIS API for JavaScript 简介2.ArcGIS API for JavaScript 的功能与应用3.ArcGIS API for JavaScript 的优势与不足4.总结正文:【1.ArcGIS API for JavaScript 简介】ArcGIS API for JavaScript 是Esri 公司开发的一款地理信息系统(GIS)软件开发工具包。
它允许开发人员在JavaScript 环境中轻松地创建和发布地图,同时提供了大量的地理信息处理和分析功能。
借助ArcGIS API for JavaScript,开发者可以在Web 应用、桌面应用和移动应用中实现地理信息的展示、查询、编辑和分析等操作,从而为用户提供丰富、高效的空间数据处理与可视化服务。
【2.ArcGIS API for JavaScript 的功能与应用】ArcGIS API for JavaScript 提供了丰富的功能,主要包括以下几个方面:(1)地图展示:开发者可以利用API 创建各种类型的地图,如静态地图、交互式地图和三维地图等,以满足不同应用场景的需求。
(2)地理数据处理与分析:API 提供了地理数据的导入、编辑、查询和分析等功能,支持多种数据格式和数据源,如shapefile、GeoJSON、KML 等。
(3)地图交互:开发者可以利用API 实现地图的缩放、平移、旋转等交互操作,同时还可以添加各种地图工具和控件,如标尺、量距、地图图层等。
(4)地理编码与位置服务:API 提供了地理编码、逆地理编码和位置服务等功能,方便开发者实现地址查询、位置定位和路径规划等应用。
(5)地图分享与发布:开发者可以将地图发布为Web 应用、桌面应用或移动应用,支持多种平台和设备,如Web 浏览器、平板电脑和智能手机等。
【3.ArcGIS API for JavaScript 的优势与不足】(1)优势:- 功能强大,提供全面的地图制作和地理信息处理功能;- 易用性高,支持JavaScript 语言,开发者上手容易;- 跨平台,支持多种操作系统和设备;- 丰富的开发资源,Esri 公司提供大量的文档、教程和示例代码,帮助开发者快速掌握API 的使用。
ArcGIS API for Javascript-课件new
。。。。。。
Stream Layer
StreamLayer
扩展了feature layer,添加了能连接使用HTML5 WebSockets数据流的能 力
VectorTileLayer
矢量切片图层以矢量数据方式加载切片数据,可以在客户端自定切片数据样式
加载地图数据的代码示例
1 2 3
Require函数解析
ServiceAreaTask
。。。。。。
Viewshed
新一代ArcGIS API for JavaScript 4.X
API 4.X vs API 3.X
1. 支持Web3D开发 2. 相同的命名空间 3. 一样的编码方式 4. 不完全兼容3.X API
Cleaner and Simpler API Support for 3D
KMLLayer RasterLayer VectorTileLayer
WebTiledLayer WMTSLayer ArcGISTiledMapServiceLayer OpenStreetMapLayer
FeatureLayer
ArcGISImageServiceVectorLayer
StreamLayer
4. 有各种成熟的JavaScript框架:Dojo、jQuery、ExtJS、 Prototype、YUI……
ArcGIS API for Javascript 主要特点
7、 网络分析:计算最优路径、临近设施和服务区域。 8、 在线编辑:通过要素服务编辑要素的图形、属性、 附件, 进行编辑追踪。 9、 时态感知:展示、查询具有时间特征的地图服务或影像 服务数据。 10、 影像处理:提供动态镶嵌、实时栅格函数处理等功能。 11、 地图输出:提供多种地图图片导出和服务器端打印等功 能。
ArcGIS API for JavaScript 4.x 用户指南说明书
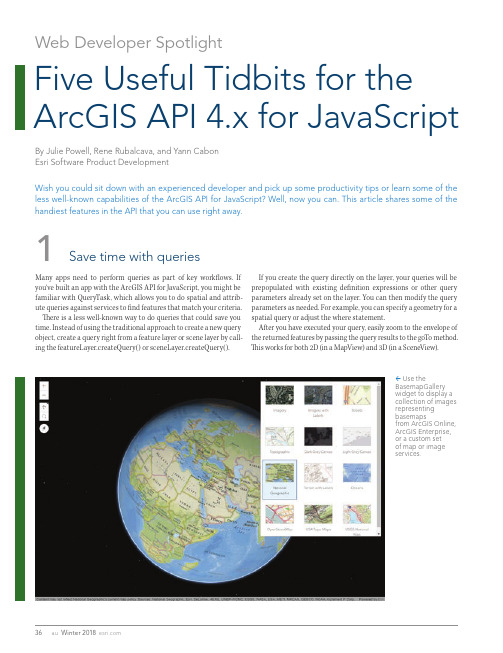
1Save time with queriesMany apps need to perform queries as part of key workflows. If you’ve built an app with the ArcGIS API for JavaScript, you might be familiar with QueryTask, which allows you to do spatial and attrib-ute queries against services to find features that match your criteria. There is a less well-known way to do queries that could save you time. Instead of using the traditional approach to create a new query object, create a query right from a feature layer or scene layer by call-ing the featureLayer.createQuery() or sceneLayer.createQuery(). Web Developer SpotlightF ive Useful Tidbits for the A rcGIS API 4.x for JavaScriptBy Julie Powell, Rene Rubalcava, and Yann Cabon Esri Software Product DevelopmentUse theBasemapGallerywidget to display a collection of images representing basemapsfrom ArcGIS Online, ArcGIS Enterprise, or a custom set of map or image services.If you create the query directly on the layer, your queries will be prepopulated with existing definition expressions or other query parameters already set on the layer. You can then modify the query parameters as needed. For example, you can specify a geometry for a spatial query or adjust the where statement.After you have executed your query, easily zoom to the envelope of the returned features by passing the query results to the goTo method. This works for both 2D (in a MapView) and 3D (in a SceneView).Wish you could sit down with an experienced developer and pick up some productivity tips or learn some of the less well-known capabilities of the ArcGIS API for JavaScript? Well, now you can. This article shares some of the handiest features in the API that you can use right away.Developer’s Corner2What you need to know about picking basemapsYou pick one of Esri’s default basemaps simply by referencing it by name inside your map definition (e.g., basemap: “streets” or basemap: “topo-vector”). Several default basemaps are available in either vector or raster format, and each version has a unique name. For example, the raster version is “topo,” and the vector version is “topo-vector.” You can also use a basemap that is not an Esri default basemap in your application.F ind any of the basemaps provided by the ArcGIS platform by searching ArcGIS Online. Once you find the desired basemap, refer-ence it by its item ID to load it in your application. The item ID is found in the item URL after “id=”. Use this form:new Map({baseMap: {portalItem: {id:“WebMap-id-with-basemap”}}})You can even update the basemap used by a web map after it is loaded by providing a new portalItem as shown in Listing 1.webmap.load().then(() => { webmap.basemap = { portalItem: {id: “b74e3eeef31942869c1f611f341ce8ed” } };↑ Listing 1: Updating the basemap3Use an expression to dynamically create an attribute for visualizationThe ArcGIS API for JavaScript provides powerful ways for you to turn data into information using data-driven visualization. Attributes in a layer can be used to drive the color, opacity, size, or rotation of features. Traditionally, this is done by directly using the attribute values in the layer.What if those attributes aren’t in the layer? You can now use an Arcade expression to dynamically calculate another field at run time to drive the desired visualization. This dynamic field can be calculat-ed using any information source—including a combination of other attributes in the layer.Using Arcade eliminates the need to add new fields to a service layer but yields the same results. For example, to visualize the tem-perature that people actually perceived rather than the temperature that was measured at weather stations worldwide, wind chill and heat index attributes available in a weather service were used by an Arcade expression to generate the fields used for this visualization of apparent temperature. The expression determined which variable (wind chill or heat index) to use as the apparent temperature.→ This map uses an Arcade expression to calculate values forvisualizing the apparent temperature measured at weather stations worldwide.↓ This map of the United States includes three map views in threedifferent spatial references. It uses the dynamic projection of features in a feature layer inside each map view.If you’d like to try this using a fun basemap, search “creative vector tile layers” on and browse some of the interesting vector tile basemaps Esri has published.You can also let the end user pick the basemap. The ArcGIS API for JavaScript gives you a few widgets you can use to allow your end user to dynamically switch between basemaps in your app.The BasemapGallery widget displays a collection of images rep-resenting basemaps from ArcGIS Online, ArcGIS Enterprise, or a custom set of map or image services. If the user is signed in to an ArcGIS Enterprise or ArcGIS Online account, the group of basemaps configured for the organization will automatically populate the BasemapGallery widget. You can also let the user switch between two basemaps using the simple BasemapToggle widget. This widget, like all widgets in ArcGIS API for JavaScript, is responsive and will adapt appropriately to any screen size.4Display thesame mapwith differentprojectionsWith version 4.x of the ArcGIS API for JavaScript, you can display multiple views of the same map using different spatial refer-ences. Perhaps you have a primary map of a region that is best displayed with a particu-lar spatial reference, and an inset map show-ing another region that is best displayed with another spatial reference. Each view uses the same map instance containing a feature layer.F eature layers are dynamic and includesupport for projecting features to different spatial references. Note that this ability to reproject on the fly separates the feature layer from other static layers, such as a vector tile layer, that only display data with the spatial reference applied to the data when the vector tile was created.By default, the view will use the spatial reference of the basemap. If the basemap isn’t specified, then the spatial reference of the first operational layer is used. Explicitly setting the view’s spatial reference to a different coordinate system overrides the spatial reference of the operational layers. You can play with a sample demonstrating this functionality by going to , clicking the Sample Code tab, and searching the samples for “composite views.”To maintain the center, scale, and rotation between web maps, assign each web mapto a single instance of the map view anduse the web map properties to create a new map view object for each web map.5Switch between web maps in your app and maintain focusTo tell a story, you might want your app to allow the user to switch between web maps in the app to show different datasets or alter-native visualizations. You can either maintain the center, scale, and rotation of the map view when the user switches between the web maps or allow all web maps to be initialized independently using the properties originally saved in each web map.If you want a smooth experience when showing different datasets or visualizations of the same location without changing the map’s focus, maintain the center, scale, and rotation between web maps. IfDeveloper’s Corner/esri/arcgis。
arcgis for javascript graphic 方法

ArcGIS for JavaScript 是ArcGIS API for JavaScript 的旧名称。
这是一个允许开发者在web浏览器中创建交互式的地图和地理信息系统(GIS)应用的JavaScript库。
在ArcGIS for JavaScript中,`Graphic`对象是一种基础的图形对象,可以用于表示点、线和面等空间要素。
`Graphic`对象通常包含一个或多个`Point`、`Polyline`或`Polygon`对象,以及与这些对象相关的属性和样式信息。
创建和使用一个`Graphic`对象的基本步骤如下:```javascript// 创建一个新的图形对象var graphic = new esri.Graphic(new esri.Geometry.Point([100, 100]));// 为图形对象设置填充颜色和线条颜色graphic.setSymbology(esri.symbol.SimpleFillSymbol.create({ color: [226, 119, 40],outline: {color: [255, 255, 255],width: 1.5,lineStyle: "esriSLSSolid"}}));// 将图形对象添加到地图图层中map.graphics.add(graphic);```在上述代码中,我们首先创建了一个新的`Graphic`对象,该对象表示一个位于坐标(100,100)的点。
然后,我们使用`setSymbology`方法为该图形对象设置了填充颜色和线条颜色。
最后,我们将该图形对象添加到了地图的图层中。
注意:上述代码需要在一个已经初始化的`Map`对象(假设名称为`map`)的上下文中运行。
如果你需要更详细的示例或教程,可以参考ArcGIS官方文档或相关的开发者社区。
ArcGISAPIforJavaScript之基础篇(四)
ArcGISAPIforJavaScript之基础篇(四)上一篇文章简单的介绍了可视化,需要的同学可以去公众号查找。
这次的文章我改变了以前的写作方法,前几天是按照官网示例顺序写的,这次及以后就是根据一个例子不断的向下引申学习,这样学习更系统。
开学第一天,大三下还那么多课,心累~。
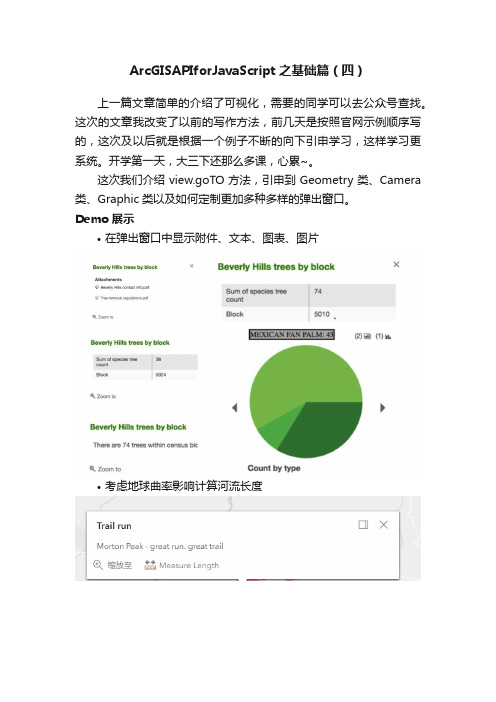
这次我们介绍view.goTO方法,引申到Geometry类、Camera 类、Graphic类以及如何定制更加多种多样的弹出窗口。
Demo展示•在弹出窗口中显示附件、文本、图表、图片•考虑地球曲率影响计算河流长度基础知识MapView - view.goTo(target, options)把view转到给定的对象,对象target包括以下属性。
•target对象。
它可以设置为:[longitude, latitude]、Geometry (或者Geometry[])、Graphic (或者Graphic[])、center与scale属性的组合对象•center 表示MapView的中心点要到的位置•scale 表示MapView的比例•zoom 表示转动到目标时的缩放比例options指view转动时的一些属性选择•animate是否有动画效果,默认为true。
当我把它的属性值改为false时,下面的所有设置都不再有效。
•duration转动的持续时间(单位毫秒)•easing动画效果,它的值有linear | ease | ease-in | ease-out | ease-in-outSceneView - view.goTo(target, options)把view转向给定的对象,target对象包括以下属性。
•target对象。
其值有[longitude, latitude]、Geometry (或者Geometry[])、Graphic (或者Graphic[])、•Viewpoint、Camera、或者center, scale, position, heading and tilt属性的组合对象。
arcgis api for javascript vue使用案例

arcgis api for javascript vue使用案例下面是一个示例代码片段,展示了如何在Vue应用中使用ArcGIS API for JavaScript:首先,需要在Vue项目中安装ArcGIS API for JavaScript:```bashnpm install @arcgis/core```接下来,创建一个Vue组件,命名为Map.vue,用于展示地图:```vue<template><div id="mapView" style="height: 500px;"></div></template><script>import { loadModules } from '@esri/arcgis-loader';export default {name: 'Map',mounted() {this.loadMap();},methods: {async loadMap() {// 加载arcgis模块const [MapView] = awaitloadModules(['esri/views/MapView']);// 创建地图视图const mapview = new MapView({container: 'mapView', // 指定渲染地图的DOM元素 map: {basemap: 'streets' // 使用streets底图},zoom: 10, // 缩放级别center: [longitude, latitude] // 地图中心点坐标});},},};</script><style scoped>#mapView {height: 100%;width: 100%;}</style>```然后,在App.vue中使用Map组件:```vue<template><div id="app"><Map></Map></div></template><script>import Map from './components/Map.vue'; export default {name: 'App',components: {Map,},};</script><style>#app {height: 100vh;display: flex;justify-content: center;align-items: center;}</style>```最后,运行Vue应用:```bashnpm run serve```这样,就可以在Vue应用中展示一个具有基本功能的ArcGIS 地图。
arcgisapi4.xforjs之基础地图篇
arcgisapi4.xforjs之基础地图篇arcgis api3.x for js转向arcgis api4.x,我也是最近的3-4个⽉时间的事情,刚好公司有个webgis项⽬需要展⽰三维场景,项⽬选择arcgis api4.x。
我纯碎记录⼀下⾃⼰学习arcgis api4.x过程中的⼀些⼼得体会,⾃⼰个⼈的⼀些理解,不对之处,还请各位同仁见谅以及多多指教。
⼀、谈谈本篇⾃⼰认为⽐较重要的⼏个专业术语名称的理解:1.ViewView即视图,提供了查看和与地图组件交互的⽅法。
地图仅仅是⼀个容器,存储了包含在基础层和操作层中的地理信息,⽽视图呈现地图及其各个层,使它们对⽤户可见。
View 是基类,它有两个⼦类,代表两种类型的视图:MapView和SceneView。
2.MapViewMapView显⽰⼀个⼆维视图的地图实例,MapView必须建⽴和参考⾄少两个对象:⼀个地图实例和⼀个DOM元素,每个分别设置在映射和容器属性中。
3. SceneViewSceneView显⽰3D查看地图或webscene实例,渲染3D技术采⽤的是WebGL。
SceneView必须有有效的地图实例和⼀个DOM元素中的⼀个⾮零的⾼度和宽度来渲染。
4.Mapmap类包含⽤于存储、管理和覆盖⼆维和三维视图共同的图层的属性和⽅法。
图层可以添加和删除掉,但通过⼀个视图(在⼆维查看数据)或场景视图中能(在3D查看数据)。
因此,地图的实例是⼀个简单的容器保存层,⽽视图显⽰与地图的层和基相互作⽤的⽅式。
Map类有两个⼦类:WebMap以及WebScene,分别对应⼆维视图MapView和三维视图SceneView。
5.BasemapBasemap⽤于创建⾃定义底图。
这些底图创建可以从⾃⼰服务器发布⽡⽚服务或者由第三⽅发布的⽡⽚服务。
6.CameraCamera相机从位置、倾斜和航向⾓度来定义SceneView视图可见程度,Camera只适⽤于3D sceneviews。
arcgis api for js4开发指南

arcgis api for js4开发指南
ArcGIS API for JavaScript 是一个强大的开发工具,可以帮助开发人员将ArcGIS平台的功能和数据嵌入到Web应用程序中。
以下是开发指南:
学习基础知识:了解ArcGIS平台的基本概念和功能,以及JavaScript 编程语言的基础知识。
获取API密钥:在开始开发之前,需要在ArcGIS for Developers网站上注册一个账户并获取API密钥。
配置开发环境:安装和配置Web开发所需的工具,如HTML、CSS、JavaScript和ArcGIS API for JavaScript的相关库。
了解API文档:参考ArcGIS API for JavaScript的官方文档,了解可用的类、方法和事件。
编写代码:使用JavaScript编写代码,调用ArcGIS API for JavaScript提供的类和方法,实现所需的功能和交互。
测试应用程序:在本地或在线环境中测试应用程序,确保功能正常并满足需求。
优化和部署:根据需要优化应用程序的性能和用户体验,并将其部署到Web服务器上供用户访问。
ArcGIS API for JavaScript 入门
数值:整数、浮点数
12,0xA0,12.3
逻辑值:布尔值
true、false
字符串值
“This a Apple”、 转义字符”\t””\,”……
空值
null
未定义值
undefinded。
Байду номын сангаас
对象
Object
使用typeof操作符判定类型
JavaScript语言基础
OK,至此ArcGIS API for JavaScript安装完成。
ArcGIS Server 10.1 离线浏览
打开文件C:\Program Files\ArcGIS\Server\framework\runtime\tomcat\webapps \arcgis#rest\WEB-INF\classes\resources\restconfig.properties 修改文件中jsapi.arcgis和jsapi.arcgis.css,将这两个值指向本 地部署的离线API的地址。
ArcGIS API for JavaScript 智能提示
在Visual Studio 2012/2010及Apanta中支持vsdoc智能提示 方法:
从SDK的”API Reference”的” Code Assist Plugins”页面 中 下载与开发工具对应的vsdoc文件。 在Visual Studio中使用方法:
将下载的Library压缩文件中的arcgis_js_api目录解压到Web Server的目录下
IIS:%SystemDrive%\inetpub\wwwroot Tomcat的webapps目录下。 ArcGIS Server 10.1的tomcat在 %AGSSERVER%\framework\runtime\tomcat
ArcGISAPIforJavaScript4.2学习笔记[22]使用【QueryTask。。。
![ArcGISAPIforJavaScript4.2学习笔记[22]使用【QueryTask。。。](https://img.taocdn.com/s3/m/49af5920e3bd960590c69ec3d5bbfd0a7956d501.png)
ArcGISAPIforJavaScript4.2学习笔记[22]使⽤【QueryTask。
上⼀篇写道,使⽤Query类进⾏查询featureLayer图层的要素,也简单介绍了QueryTask类的使⽤。
这⼀篇博⽂继续推进,使⽤Query类和QueryTask类进⾏空间查询,查询USA的著名⼭体点要素。
同样的,只介绍重点。
本章官⽅名字是:Query using QueryTask照常,先看看结果:(默认三个参数都不动,直接点击按钮)出现了绿⾊的圆锥体,点击圆锥体可以出现定制好的弹窗(PopupTemplate):好,开始上课。
给出引⽤require(["esri/Map","esri/views/SceneView","esri/layers/GraphicsLayer","esri/symbols/PointSymbol3D","esri/symbols/ObjectSymbol3DLayer","esri/tasks/QueryTask","esri/tasks/support/Query","dojo/_base/array","dojo/dom","dojo/on","dojo/domReady!"],function(Map, SceneView, GraphicsLayer, PointSymbol3D,ObjectSymbol3DLayer, QueryTask, Query, arrayUtils, dom, on){...})GraphicsLayer是⽤于显⽰绿⾊的圆锥体的⼏何图层;ObjectSymbol3DLayer、PointSymbol3D是⽤于显⽰绿⾊圆锥的模块;Query和QueryTask是本节空间查询必须的模块。
使用ArcGIS JavaScript API 开发Web 3D应用

三维数据的格式 – SPK格式支持的图层类型
手工 / 规则建模成果 倾斜摄影建模成果 激光雷达的点云数据 点数据
三维数据的格式 – 多面体格式( Multipatch )
是 Geodatabase 格式的一种图层类型 不包含LOD信息 可以用 ArcGIS Pro / ArcGIS Earth (ArcScene / ArcGlobal )打开 只能存放手工 / 规则建模成果
ArcGIS 三维应用开发
球面模式 平面模式
支持WGS84
支持WebMercator
支持任何投影坐标系
ArcGIS 三维应用开发 – 示例
二维服务图层加载 三维场景图层加载
三维场景查询和高亮定位
二维数据的三维符号化
Hello World
演示
基础编程模型
View
-extent -map -...
使用ArcGIS JavaScript API 开发
Web3D应用
易智瑞(中国)信息技术有限公司 雷凯华
ArcGIS二维技术流程
二维数据的 创建
二维地图服 务的发布
二维地图服 务的使用
ArcGIS三维技术流程
三维数据 的创建
三维服务 的发布
三维服务 的使用
1
三维数据
三维数据的生产 – 传统手工建模
三维数据的生产 – CityEngine规则建模
ห้องสมุดไป่ตู้
二维数据作为建模基础(要素+属性) 规则驱动创造三维模型(CGA规则) 动态的智能编辑与布局(联动编辑)
三维数据的生产 – 倾斜摄影技术建模
ArcGIS JavaScript API开发—初级篇

2.3版本提供了更多的widget 。 更好的Popup效果 使用了Dojo 1.6.1
一些基于JavaScript API的网站
.au/public/nsw/home/map/base.html
/coverageviewer/
如何开发?
JavaScript API 的部署
ArcGIS JavaScript API 的离线包部署
•
离线包的下载
-
ArcGIS JavaScript API 的离线包部署
-
用+键实现翻大
用-键实现缩小
Байду номын сангаас
ArcGIS JavaScript API QueryTask
• • •
在地图服务中查询单个图层 你可以查询属性、图形、两者 你在做图形查询时使用丰富的查询关系
-
Intersects, contains, touches, crosses, and others
var queryTask = new esri.tasks.QueryTask("http:// sampleserver1.arcgisonline. com/ArcGIS/rest/services/De mographics/ESRI_Census_ USA/MapServer/0");
-
用URI描述互联网上的资源,所以没有开发工具的限制
URI表示的是统一的资源标识,它是以某种统一的(标准化 的)方式标识资源的简单字符串 REST表述性状态转移,REST很简单,只要使用网址,就可以很 容易地创建、发布和使用“REST风格”的网络服务。 相比REST的前一个标准简单对象访问协议(SOAP),REST风 格的网络服务是轻量级的,使用非常简便、灵活。基于REST的这 些优势。 从ArcGIS Server 9.3引入REST作为新型强大的功能,使用户能够 没有任何困难地发布和使用Web服务。REST是各层次开发者利用 ArcGIS Server创建自定义应用的最简便方法。
ArcGISAPIForJavascript之GraphicsLayer
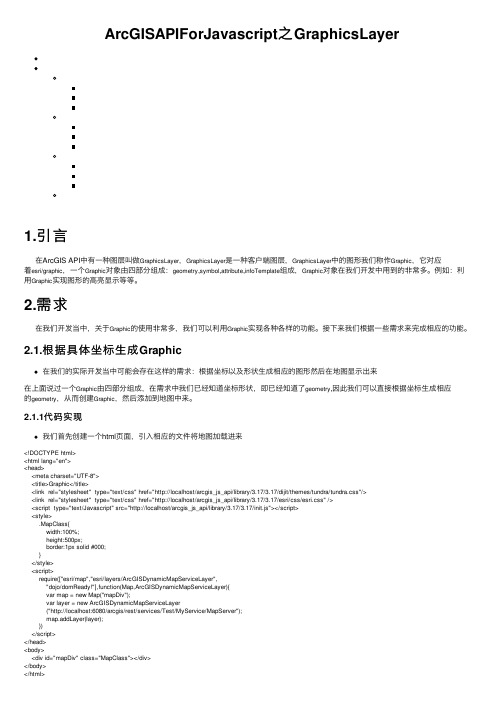
ArcGISAPIForJavascript之GraphicsLayer1.引⾔在ArcGIS API中有⼀种图层叫做GraphicsLayer,GraphicsLayer是⼀种客户端图层,GraphicsLayer中的图形我们称作Graphic,它对应着esri/graphic,⼀个Graphic对象由四部分组成:geometry,symbol,attribute,infoTemplate组成,Graphic对象在我们开发中⽤到的⾮常多。
例如:利⽤Graphic实现图形的⾼亮显⽰等等。
2.需求在我们开发当中,关于Graphic的使⽤⾮常多,我们可以利⽤Graphic实现各种各样的功能。
接下来我们根据⼀些需求来完成相应的功能。
2.1.根据具体坐标⽣成Graphic在我们的实际开发当中可能会存在这样的需求:根据坐标以及形状⽣成相应的图形然后在地图显⽰出来在上⾯说过⼀个Graphic由四部分组成,在需求中我们已经知道坐标形状,即已经知道了geometry,因此我们可以直接根据坐标⽣成相应的geometry,从⽽创建Graphic,然后添加到地图中来。
2.1.1代码实现我们⾸先创建⼀个html页⾯,引⼊相应的⽂件将地图加载进来<!DOCTYPE html><html lang="en"><head><meta charset="UTF-8"><title>Graphic</title><link rel="stylesheet" type="text/css" href="http://localhost/arcgis_js_api/library/3.17/3.17/dijit/themes/tundra/tundra.css"/><link rel="stylesheet" type="text/css" href="http://localhost/arcgis_js_api/library/3.17/3.17/esri/css/esri.css" /><script type="text/Javascript" src="http://localhost/arcgis_js_api/library/3.17/3.17/init.js"></script><style>.MapClass{width:100%;height:500px;border:1px solid #000;}</style><script>require(["esri/map","esri/layers/ArcGISDynamicMapServiceLayer","dojo/domReady!"],function(Map,ArcGISDynamicMapServiceLayer){var map = new Map("mapDiv");var layer = new ArcGISDynamicMapServiceLayer("http://localhost:6080/arcgis/rest/services/Test/MyService/MapServer");map.addLayer(layer);})</script></head><body><div id="mapDiv" class="MapClass"></div></body>创建四个按钮,将四类不同的Graphic添加到GraphicsLayer中<button>添加点</button><button>添加线</button><button>添加⾯</button><button>添加圆</button>12341234引⼊相应的模块,其中包括:dojo/on(⽤于绑定事件的模块)esri/symbols/SimpleMarkerSymbol(点符号类)esri/symbols/SimpleLineSymbol(线符号类)esri/symbols/SimpleFillSymbol(⾯符号类)esri/geometry/Point(点类)esri/geometry/Polyline(折线类)esri/geometry/Polygon(⾯类)esri/geometry/Circle(圆类)dojo/query(dojo的选择器,⽤于选择DOM元素)esri/graphic(图形类)esri/layers/GraphicsLayer(客户端图层类)为相应的按钮添加绑定事件//创建客户端图层var graphicsLayer=new GraphicsLayer();//将客户端图层添加到地图中map.addLayer(graphicsLayer);//通过query查询到button对象var btns=query("button");on(btns,"click",function(event){//获得按钮的⽂本var text=this.innerHTML;//定义线符号var lineSymbol=new SimpleLineSymbol(SimpleLineSymbol.STYLE_DASH, new Color([255, 0, 0]), 3);//定义点符号lvar pSymbol=new SimpleMarkerSymbol(SimpleMarkerSymbol.STYLE_CIRCLE,10, lineSymbol, new Color([255, 0, 0])); //定义⾯符号var fill=SimpleFillSymbol(SimpleFillSymbol.STYLE_SOLID, lineSymbol, new Color([255, 0, 0]));//声明⼀个类型和图形var geometry;var graphic;//根据⽂本定义相应的geometryswitch(text){case "添加点":geometry=new Point({"x":510706,"y":3986100,"spatialReference":map.spatialReference});graphic=new Graphic(geometry,pSymbol);break;case "添加线"://点的坐标对var paths=[];paths[0]=[[510326,3985702],[510994, 3985676],[511078, 3985903],[510433, 3985928]];geometry=new Polyline({"paths":paths,"spatialReference":map.spatialReference})case "添加⾯"://点的坐标对var ring=[];ring[0]=[[510275, 3986100],[510508, 3986162],[510596, 3986032],[510271, 3985847],[510275, 3986100]];geometry=new Polygon({"rings":ring,"spatialReference":map.spatialReference });graphic=new Graphic(geometry,fill);break;case "添加圆"://圆⼼var p=new Point({"x":510706,"y":3986100,"spatialReference":map.spatialReference });//半径var r=20;geometry=new Circle(p,{"radius":r});graphic=new Graphic(geometry,fill);break;}//将图形添加到图层中graphicsLayer.add(graphic);1234567891011121314151617181920212223242526272829303132333435363738394142434445464748495051525354555657585960616263646566676869707172737475767778791234567891011121314151617182.1.2全部代码<!DOCTYPE html><html lang="en"><head><meta charset="UTF-8"><title>Graphic</title><link rel="stylesheet" type="text/css" href="http://localhost/arcgis_js_api/library/3.17/3.17/dijit/themes/tundra/tundra.css"/> <link rel="stylesheet" type="text/css" href="http://localhost/arcgis_js_api/library/3.17/3.17/esri/css/esri.css" />.MapClass{width:100%;height:500px;border:1px solid #000;}</style><script>require(["esri/map","esri/layers/ArcGISDynamicMapServiceLayer","esri/layers/GraphicsLayer","dojo/on","dojo/query","dojo/colors","esri/graphic","esri/symbols/SimpleMarkerSymbol","esri/symbols/SimpleLineSymbol","esri/symbols/SimpleFillSymbol","esri/geometry/Point","esri/geometry/Polyline","esri/geometry/Polygon","esri/geometry/Circle","dojo/domReady!"],function(Map,ArcGISDynamicMapServiceLayer,GraphicsLayer,on,query,Color,Graphic,SimpleMarkerSymbol,SimpleLineSymbol,SimpleFillSymbol,Point,Polyline,Polygon,Circle){var map = new Map("mapDiv");var layer = new ArcGISDynamicMapServiceLayer("http://localhost:6080/arcgis/rest/services/Test/MyService/MapServer");map.addLayer(layer);//创建客户端图层var graphicsLayer=new GraphicsLayer();//将客户端图层添加到地图中map.addLayer(graphicsLayer);//通过query查询到button对象var btns=query("button");on(btns,"click",function(event){//获得按钮的⽂本var text=this.innerHTML;//定义线符号var lineSymbol=new SimpleLineSymbol(SimpleLineSymbol.STYLE_DASH, new Color([255, 0, 0]), 3);//定义点符号lvar pSymbol=new SimpleMarkerSymbol(SimpleMarkerSymbol.STYLE_CIRCLE,10, lineSymbol, new Color([255, 0, 0])); //定义⾯符号var fill=SimpleFillSymbol(SimpleFillSymbol.STYLE_SOLID, lineSymbol, new Color([255, 0, 0]));//声明⼀个类型和图形var geometry;var graphic;//根据⽂本定义相应的geometryswitch(text){case "添加点":geometry=new Point({"x":510706,"y":3986100,"spatialReference":map.spatialReference});graphic=new Graphic(geometry,pSymbol);break;case "添加线"://点的坐标对var paths=[];paths[0]=[[510326,3985702],[510994, 3985676],[511078, 3985903],[510433, 3985928]];geometry=new Polyline({"paths":paths,"spatialReference":map.spatialReference})graphic=new Graphic(geometry,lineSymbol);break;case "添加⾯"://点的坐标对var ring=[];ring[0]=[[510275, 3986100],[510508, 3986162],[510596, 3986032],[510271, 3985847],[510275, 3986100]];geometry=new Polygon({"rings":ring,graphic=new Graphic(geometry,fill);break;case "添加圆"://圆⼼var p=new Point({"x":510706,"y":3986100,"spatialReference":map.spatialReference});//半径var r=20;geometry=new Circle(p,{"radius":r});graphic=new Graphic(geometry,fill);break;}//将图形添加到图层中graphicsLayer.add(graphic);})})</script></head><body><div id="mapDiv" class="MapClass"></div><button>添加点</button><button>添加线</button><button>添加⾯</button><button>添加圆</button></body></html>2.1.3代码解释我们利⽤dojo/query查询到所有的button对象,利⽤dojo/on模块给所有的button对象绑定事件。
ArcGISapiforjavascript——图形-选择一个范围内的点
ArcGISapiforjavascript——图形-选择⼀个范围内的点描述本例展⽰了如何使⽤图形显⽰查询结果,如何使⽤在地图上选择图形和如何修改图形符号为“⾼亮”。
在地图上画⼀个矩形区域,加亮矩形范围内的城市。
这个应⽤统计⾼亮的城市个数并列出城市名称。
能够画另外⼀个矩形来改变⾼亮的城市集合。
初始的在地图上见到的城市集和是应⽤加载时⽣成的查询结果。
查询找到地图服务的的Washington州的所有城市。
城市被加到地图的。
帮助⽤户在地图上画矩形。
⼯具栏不是⼀个⽤户界⾯控件;⼯具栏仅仅是为了显⽰矩形和捕获范围保存JavaScript代码的帮助类。
创建功能栏,激活绘制的类型,提供⼀个绘制完成时做些事情的事件监听器。
在本例中,所以这些都在initToolbar函数中实现:function initToolbar(map) {var tb = new esri.toolbars.Draw(map);dojo.connect(tb, "onDrawEnd", findPointsInExtent);tb.activate(esri.toolbars.Draw.EXTENT);}当画矩形结束时回调函数findPointsInExtent被调⽤。
这个函数循环访问地图⾥每个城市并确定它是否在绘制⼯具栏返回的范围内。
如果在范围内,代码修改城市的图形为加亮符号并且增加城市信息到结果数组。
结果数组被⽤于创建地图下⾯看到的城市名称列表。
注意利⽤html在⼀个表格⾏中放置每个结果。
results.join()⽅法连结结果数组中的所有的元素为⼀个字符串。
这个字符串被放置在<table>标签⾥⾯来创建⼀个表格。
1<!DOCTYPE HTML PUBLIC "-//W3C//DTD HTML 4.01//EN" "/TR/html4/strict.dtd">2<html>3<head>4<meta http-equiv="Content-Type" content="text/html; charset=utf-8"/>5<meta http-equiv="X-UA-Compatible" content="IE=7"/>6<title>Points in Extent</title>7<link rel="stylesheet" type="text/css" href="/jsapi/arcgis/1.5/js/dojo/dijit/themes/tundra/tundra.css">8<script type="text/javascript" src="/jsapi/arcgis/?v=1.5"></script>9<script type="text/javascript">10 dojo.require("esri.map");11 dojo.require("esri.toolbars.draw");12 dojo.require("esri.tasks.query");1314//global variables15var map, defaultSymbol, highlightSymbol, resultTemplate;1617function init() {18//create map, set initial extent and disable default info window behavior1920//创建地图,设置初始化边界21 map = new esri.Map("map", {22 extent: new esri.geometry.Extent(-125.9016637859635, 44.600742276385304, -114.6516637859635, 50.225742276385304, new esri.SpatialReference({wkid:4326})),23 showInfoWindowOnClick:false24 });25 dojo.connect(map, "onLoad", initToolbar);26 map.addLayer(new yers.ArcGISTiledMapServiceLayer("/ArcGIS/rest/services/ESRI_StreetMap_World_2D/MapServer"));2728//initialize symbology29 defaultSymbol = new esri.symbol.SimpleMarkerSymbol().setColor(new dojo.Color([0,0,255]));30 highlightSymbol = new esri.symbol.SimpleMarkerSymbol().setColor(new dojo.Color([255,0,0]));3132//initialize & execute query33var queryTask = new esri.tasks.QueryTask("/ArcGIS/rest/services/Specialty/ESRI_StatesCitiesRivers_USA/MapServer/0"); 34var query = new esri.tasks.Query();35 query.where = "STATE_NAME = 'Washington'";36 query.returnGeometry = true;37 query.outFields = ["CITY_NAME"];38 queryTask.execute(query, addPointsToMap);3940//info template for points returned41 resultTemplate = new Template("City", "<tr><td>${CITY_NAME}</tr></td>");42 }4344//initialize drawing toolbar45function initToolbar(map) {46var tb = new esri.toolbars.Draw(map);4748//find points in Extent when user completes drawing extent49 dojo.connect(tb, "onDrawEnd", findPointsInExtent);5051//set drawing mode to extent52 tb.activate(esri.toolbars.Draw.EXTENT);53 }5455//add points to map and set their symbology + info template56function addPointsToMap(featureSet) {57var features = featureSet.features;58for (var i=0, il=features.length; i<il; i++) {59 map.graphics.add(features[i].setSymbol(defaultSymbol).setInfoTemplate(resultTemplate));60 }61 }6263//find all points within argument extent64function findPointsInExtent(extent) {65var graphics = map.graphics.graphics;66var results = [];67var graphic;68for (var i=0, il=graphics.length; i<il; i++) {69 graphic = graphics[i];7071//if point is contained within extent, highlight it and add for display in results list72if (extent.contains(graphic.geometry)) {73 graphic.setSymbol(highlightSymbol);74 results.push(graphic.getContent());75 }76//else if point was previously highlighted, reset its symbology77else if (graphic.symbol == highlightSymbol) {78 graphic.setSymbol(defaultSymbol);79 }80 }8182//display number of points in extent83 dojo.byId("inextent").innerHTML = results.length;8485//display list of points in extent86 dojo.byId("results").innerHTML = "<table><tbody>" + results.join("") + "</tbody></table>";87 }8889 dojo.addOnLoad(init);90</script>9192</head>93<body class="tundra">94 Draw an Extent on the map to find all points within this extent9596<!-- map div -->97<div id="map" style="width:800px; height:400px; border:1px solid #000;"></div>98<br />99100<!-- display number of points in drawn extent -->101<b># of points in extent = <span id="inextent">0</span></b>102103<!-- list points in extent -->104<div id="results" style="width:400px; height:200px; border:1px solid #000; overflow:auto;"> 105</div>106</body>107</html>。
ArcgisAPIforjs本地部署
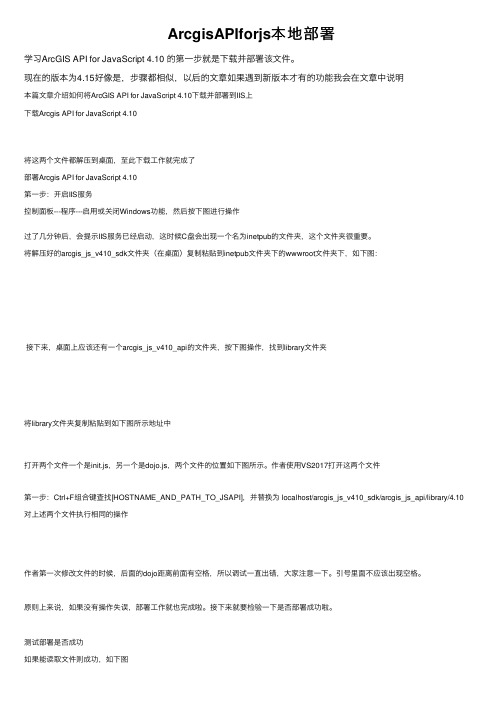
ArcgisAPIforjs本地部署学习ArcGIS API for JavaScript 4.10 的第⼀步就是下载并部署该⽂件。
现在的版本为4.15好像是,步骤都相似,以后的⽂章如果遇到新版本才有的功能我会在⽂章中说明本篇⽂章介绍如何将ArcGIS API for JavaScript 4.10下载并部署到IIS上下载Arcgis API for JavaScript 4.10将这两个⽂件都解压到桌⾯,⾄此下载⼯作就完成了部署Arcgis API for JavaScript 4.10第⼀步:开启IIS服务控制⾯板---程序---启⽤或关闭Windows功能,然后按下图进⾏操作过了⼏分钟后,会提⽰IIS服务已经启动,这时候C盘会出现⼀个名为inetpub的⽂件夹,这个⽂件夹很重要。
将解压好的arcgis_js_v410_sdk⽂件夹(在桌⾯)复制粘贴到inetpub⽂件夹下的wwwroot⽂件夹下,如下图:接下来,桌⾯上应该还有⼀个arcgis_js_v410_api的⽂件夹,按下图操作,找到library⽂件夹将library⽂件夹复制粘贴到如下图所⽰地址中打开两个⽂件⼀个是init.js,另⼀个是dojo.js,两个⽂件的位置如下图所⽰。
作者使⽤VS2017打开这两个⽂件第⼀步:Ctrl+F组合键查找[HOSTNAME_AND_PATH_TO_JSAPI],并替换为 localhost/arcgis_js_v410_sdk/arcgis_js_api/library/4.10 对上述两个⽂件执⾏相同的操作作者第⼀次修改⽂件的时候,后⾯的dojo距离前⾯有空格,所以调试⼀直出错,⼤家注意⼀下。
引号⾥⾯不应该出现空格。
原则上来说,如果没有操作失误,部署⼯作就也完成啦。
接下来就要检验⼀下是否部署成功啦。
测试部署是否成功如果能读取⽂件则成功,如下图下⾯打开⼀个地图,使⽤部署在本机的⽂件,看看能否正确打开上⾯红⾊框括起来的是新的引⽤,引⽤在本地(localhost)部署的⽂件。
ArcGISAPIForJavascript_4.8-渲染器SimpleRenderer
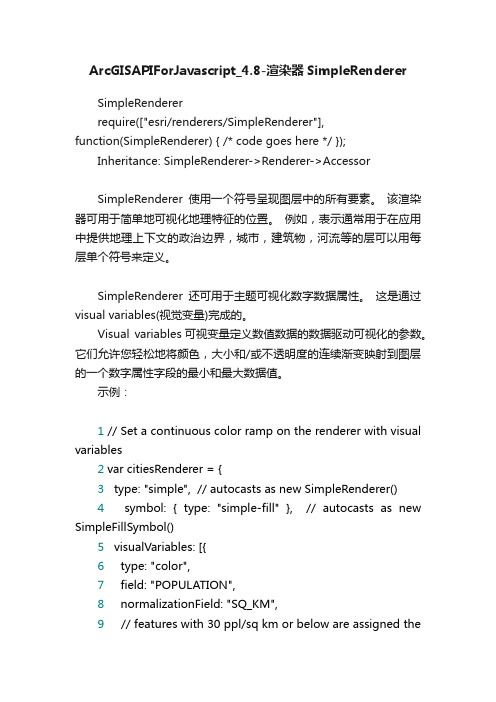
ArcGISAPIForJavascript_4.8-渲染器SimpleRendererSimpleRendererrequire(["esri/renderers/SimpleRenderer"],function(SimpleRenderer) { /* code goes here */ });Inheritance: SimpleRenderer->Renderer->AccessorSimpleRenderer使用一个符号呈现图层中的所有要素。
该渲染器可用于简单地可视化地理特征的位置。
例如,表示通常用于在应用中提供地理上下文的政治边界,城市,建筑物,河流等的层可以用每层单个符号来定义。
SimpleRenderer还可用于主题可视化数字数据属性。
这是通过visual variables(视觉变量)完成的。
Visual variables可视变量定义数值数据的数据驱动可视化的参数。
它们允许您轻松地将颜色,大小和/或不透明度的连续渐变映射到图层的一个数字属性字段的最小和最大数据值。
示例:1// Set a continuous color ramp on the renderer with visual variables2var citiesRenderer = {3 type: "simple", // autocasts as new SimpleRenderer()4symbol: { type: "simple-fill" }, // autocasts as new SimpleFillSymbol()5 visualVariables: [{6 type: "color",7 field: "POPULATION",8 normalizationField: "SQ_KM",9 // features with 30 ppl/sq km or below are assigned thefirst color10 stops: [{ value: 100, color: "#FFFCD4" },11 { value: 500, color: "#0D2644" }]12 }]13};14var citiesLayer = new FeatureLayer({15 url: "rvice",16 renderer: citiesRenderer17 });属性;symbol:渲染器用于可视化图层中所有要素的符号。
arcgis api for js event 参数

arcgis api for js event 参数ArcGIS API for JavaScript 是一款强大的地图交互工具,它允许开发者在网页中嵌入地理信息系统(GIS)功能。
本文将重点介绍ArcGIS API for JavaScript 中的事件系统,以及如何利用事件来实现地图的交互和功能控制。
一、ArcGIS API for JavaScript 简介ArcGIS API for JavaScript 是ArcGIS 家族的一员,由ESRI 公司开发。
它是一个基于JavaScript 的Web 地图库,具有丰富的地图功能和易于使用的API。
通过ArcGIS API for JavaScript,开发者可以在网页中创建交互式地图,实现地图的定制和扩展。
二、ArcGIS API for JavaScript 事件概述在ArcGIS API for JavaScript 中,事件是一种响应特定动作的方式。
当地图或地图要素发生改变时,例如缩放、平移、鼠标悬停等,都会触发相应的事件。
开发者可以通过监听这些事件,并在事件触发时执行特定代码,来实现地图的交互和功能控制。
三、常用事件及其应用1.地图加载事件:onLoad当地图加载完成时,触发onLoad 事件。
此时,地图已经完全加载,可以进行地图操作。
示例:```javascriptmap.on("load", function() {// 地图加载完成后的操作});```2.地图交互事件:onMouseMove、onMouseDown、onMouseUp这些事件分别在鼠标移动、按下和抬起时触发。
可以用于检测鼠标位置,实现地图的交互操作。
示例:```javascriptmap.on("mouse-move", function(e) {// 鼠标移动时的操作});```3.地图缩放事件:onZoom在地图缩放过程中,触发onZoom 事件。
- 1、下载文档前请自行甄别文档内容的完整性,平台不提供额外的编辑、内容补充、找答案等附加服务。
- 2、"仅部分预览"的文档,不可在线预览部分如存在完整性等问题,可反馈申请退款(可完整预览的文档不适用该条件!)。
- 3、如文档侵犯您的权益,请联系客服反馈,我们会尽快为您处理(人工客服工作时间:9:00-18:30)。
ArcGIS API for JavaScript (JavaScript API)是ESRI根据JavaScript技术实现的调用ArcGIS Server REST API接口的一组脚本。
当前的最新版本是Version 3.8。
通过ArcGIS API for JavaScript可以将ArcGIS Server提供的地图资源嵌入到Web应用中。
JavaScript API是基于Dojo框架的,使用了大量的Dojo技术,因此要想熟练掌握API 用法,先要对Dojo框架有个深入的了解!
一:环境介绍
(1)ArcGIS API for JavaScript 3.7 下载地址:/apps/products/download/(2)Eclipse 3.7 +Tomcat 7 +JDK 7
二:搭建步骤
(1)通过Eclipse 创建动态工程,如下:
点击Next :
输入Project Name:ArcgisForJs,设置Target runtime,点击Finish,工程目录如下:
(2)在工程WebContent下创建文件夹arcgis_js
(3)解压arcgis_js_v37_api.zip ,拷贝arcgis_js_v37_api\arcgis_js_api\library\3.7\3.7compact 下的内容到arcgis_js 文件夹下。
(4)修改arcgis_js\init.js 和arcgis_js\ js\dojo\dojo\dojo.js 两个文件,替
换 [HOSTNAME_AND_PATH_TO_JSAPI]为localhost:8080/ArcgisForJs/arcgis_js/ ,格式:IP:web 服务器端口/工程名/创建的文件夹arcgis_js。