3 T magnetic resonance diffusion tensor imaging and fibre trackingPg465 73[PMIDS20451014]
核磁共振成像的英文缩写
核磁共振成像的英文缩写Magnetic Resonance Imaging (MRI)。
Magnetic Resonance Imaging (MRI) is a non-invasive medical imaging technique that produces detailed images of the internal structures of the body using a combination of large magnets, radiofrequency waves, and a computer to process the information. It is widely used in medical diagnostics to assess a wide range of conditions and diseases affecting various organs and tissues.The principle of MRI is based on the interaction of nuclear spins with magnetic fields. Nuclear spins refer to the spin of the protons within atoms, which have a magnetic moment. When placed within a strong static magnetic field, these protons align either parallel or antiparallel to the field, resulting in a net magnetization. This magnetization can be perturbed by applying radiofrequency (RF) waves, which cause the protons to flip their alignment and produce a signal that can be detected and processed.The MRI scanner consists of a large magnet, typically either superconducting or permanent, that generates astrong static magnetic field. The patient lies on a movable table that is inserted into the scanner's bore. The scanner also includes RF coils that transmit and receive RF signals, gradient coils that produce varying magnetic fields to spatially encode the MR signal, and a computer system for controlling the scanner and processing the acquired data.During an MRI scan, the patient lies still within the scanner while the RF coils transmit RF waves at a specific frequency, causing the protons within the body to resonate. As the protons return to their original alignment, theyemit a signal that is detected by the RF coils. Thegradient coils are used to encode this signal spatially, allowing the computer system to reconstruct a 2D or 3Dimage of the scanned area.MRI has several advantages over other imaging modalities. It is non-invasive, meaning it does not involve the insertion of probes or dyes into the body. It provideshigh-resolution images with excellent contrast between soft tissues, making it particularly useful for imaging the brain, muscles, joints, and other soft tissue structures. Additionally, MRI can be used to assess both anatomic and functional information, such as blood flow and metabolite concentrations.MRI is used in a wide range of clinical applications, including but not limited to:1. Brain imaging: MRI is widely used to assess brain structure and function, including the detection of tumors, strokes, aneurysms, and other neurologic conditions. Functional MRI (fMRI) can be used to map brain activity and study cognitive processes.2. Musculoskeletal imaging: MRI is excellent for evaluating joints, muscles, tendons, ligaments, and other musculoskeletal structures. It can detect tears, inflammation, and other pathologies that may not be visible on other imaging modalities.3. Abdominal imaging: MRI can be used to assess organs within the abdomen, such as the liver, spleen, kidneys, and pancreas. It can detect tumors, cysts, and other abnormalities.4. Vascular imaging: MRI can be used to image blood vessels, assessing for aneurysms, stenoses, and other vascular conditions.5. Oncology: MRI is frequently used in the diagnosis and staging of various cancers, including breast, prostate, liver, and brain cancers.However, MRI also has some limitations. It is not suitable for patients with certain implanted devices, such as pacemakers or defibrillators, as the magnetic field can interfere with their function. Additionally, MRI scanning can take longer than other imaging modalities and may not be well-suited for patients who have difficulty remaining motionless for extended periods.In conclusion, Magnetic Resonance Imaging (MRI) is apowerful non-invasive medical imaging technique that provides detailed images of the internal structures of the body. It has a wide range of clinical applications and is a valuable tool in the diagnosis and management of various medical conditions.。
核磁共振工作原理

核磁共振工作原理核磁共振(Nuclear Magnetic Resonance,简称NMR)是一种重要的分析技术和研究手段。
它基于原子核之间的电磁相互作用,通过利用核自旋在外加磁场和射频场作用下的共振吸收现象,实现对样品的结构和性质的分析。
本文将详细介绍核磁共振的工作原理。
一、基本原理核磁共振技术的核心是核磁共振现象。
当一个样品置于磁场中时,其核自旋将受到外加磁场的影响,导致核自旋的量子态能级发生分裂。
此时,如果给样品施加一个与能级间距相符的射频波,将出现共振吸收现象。
这种共振现象的产生是由于外加磁场与样品中核自旋的磁矩相互作用所致。
二、共振条件核磁共振的共振条件可以用以下公式表示:ω = γB0其中,ω表示射频波的角频率,γ是核磁矩的旋磁比,B0是外加磁场的大小。
根据这个公式可知,当外加磁场的强度发生变化时,共振条件也会相应改变。
三、工作步骤核磁共振的工作原理可以分为以下几个步骤:1. 加样处理:样品通常会进行处理,以提高信噪比和磁场均匀性。
处理包括稀释、混合、旋转等。
2. 形成磁场:通过磁铁产生一个强大的静态磁场,这是核磁共振实验的基础条件。
3. 校准射频场:根据样品的特性和实验需求,校准出一个合适的射频场。
4. 施加射频激发信号:给样品施加一个与共振频率匹配的射频激发信号,使样品中的核自旋从基态跃迁到激发态。
5. 探测共振信号:探测样品中的共振信号,记录共振频率和共振幅度。
6. 数据处理和分析:对探测到的共振信号进行处理和分析,提取样品的结构和性质信息。
四、应用领域核磁共振技术在许多领域都有广泛的应用,包括化学、物理、生物、医学等。
在化学领域,核磁共振可以用于分析有机物的结构、鉴定化合物的纯度等。
在物理领域,核磁共振可以用于研究材料的磁性、超导性等性质。
在生物领域,核磁共振可以应用于蛋白质结构研究、DNA解旋等。
在医学领域,核磁共振成像(MRI)可以用于人体各类组织和器官的诊断。
综上所述,核磁共振工作原理是基于核自旋共振现象的。
核磁共振中常用的英文缩写和中文名称
NMR中常用的英文缩写和中文名称收集了一些NMR中常用的英文缩写,译出其中文名称,供初学者参考,不妥之处请指出,也请继续添加.相关附件NMR中常用的英文缩写和中文名称APT Attached Proton Test 质子连接实验ASIS Aromatic Solvent Induced Shift 芳香溶剂诱导位移BBDR Broad Band Double Resonance 宽带双共振BIRD Bilinear Rotation Decoupling 双线性旋转去偶(脉冲)COLOC Correlated Spectroscopy for Long Range Coupling 远程偶合相关谱COSY ( Homonuclear chemical shift ) COrrelation SpectroscopY (同核化学位移)相关谱CP Cross Polarization 交叉极化CP/MAS Cross Polarization / Magic Angle Spinning 交叉极化魔角自旋CSA Chemical Shift Anisotropy 化学位移各向异性CSCM Chemical Shift Correlation Map 化学位移相关图CW continuous wave 连续波DD Dipole-Dipole 偶极-偶极DECSY Double-quantum Echo Correlated Spectroscopy 双量子回波相关谱DEPT Distortionless Enhancement by Polarization Transfer 无畸变极化转移增强2DFTS two Dimensional FT Spectroscopy 二维傅立叶变换谱DNMR Dynamic NMR 动态NMRDNP Dynamic Nuclear Polarization 动态核极化DQ(C) Double Quantum (Coherence) 双量子(相干)DQD Digital Quadrature Detection 数字正交检测DQF Double Quantum Filter 双量子滤波DQF-COSY Double Quantum Filtered COSY 双量子滤波COSYDRDS Double Resonance Difference Spectroscopy 双共振差谱EXSY Exchange Spectroscopy 交换谱FFT Fast Fourier Transformation 快速傅立叶变换FID Free Induction Decay 自由诱导衰减H,C-COSY 1H,13C chemical-shift COrrelation SpectroscopY 1H,13C化学位移相关谱H,X-COSY 1H,X-nucleus chemical-shift COrrelation SpectroscopY 1H,X-核化学位移相关谱HETCOR Heteronuclear Correlation Spectroscopy 异核相关谱HMBC Heteronuclear Multiple-Bond Correlation 异核多键相关HMQC Heteronuclear Multiple Quantum Coherence异核多量子相干HOESY Heteronuclear Overhauser Effect Spectroscopy 异核Overhause效应谱HOHAHA Homonuclear Hartmann-Hahn spectroscopy 同核Hartmann-Hahn谱HR High Resolution 高分辨HSQC Heteronuclear Single Quantum Coherence 异核单量子相干INADEQUATE Incredible Natural Abundance Double Quantum Transfer Experiment 稀核双量子转移实验(简称双量子实验,或双量子谱)INDOR Internuclear Double Resonance 核间双共振INEPT Insensitive Nuclei Enhanced by Polarization 非灵敏核极化转移增强INVERSE H,X correlation via 1H detection 检测1H的H,X核相关IR Inversion-Recovery 反(翻)转回复JRES J-resolved spectroscopy J-分解谱LIS Lanthanide (chemical shift reagent ) Induced Shift 镧系(化学位移试剂)诱导位移LSR Lanthanide Shift Reagent 镧系位移试剂MAS Magic-Angle Spinning 魔角自旋MQ(C) Multiple-Quantum ( Coherence ) 多量子(相干)MQF Multiple-Quantum Filter 多量子滤波MQMAS Multiple-Quantum Magic-Angle Spinning 多量子魔角自旋MQS Multi Quantum Spectroscopy 多量子谱NMR Nuclear Magnetic Resonance 核磁共振NOE Nuclear Overhauser Effect 核Overhauser效应(NOE)NOESY Nuclear Overhauser Effect Spectroscopy 二维NOE谱NQR Nuclear Quadrupole Resonance 核四极共振PFG Pulsed Gradient Field 脉冲梯度场PGSE Pulsed Gradient Spin Echo 脉冲梯度自旋回波PRFT Partially Relaxed Fourier Transform 部分弛豫傅立叶变换PSD Phase-sensitive Detection 相敏检测PW Pulse Width 脉宽RCT Relayed Coherence Transfer 接力相干转移RECSY Multistep Relayed Coherence Spectroscopy 多步接力相干谱REDOR Rotational Echo Double Resonance 旋转回波双共振RELAY Relayed Correlation Spectroscopy 接力相关谱RF Radio Frequency 射频ROESY Rotating Frame Overhauser Effect Spectroscopy 旋转坐标系NOE谱ROTO ROESY-TOCSY Relay ROESY-TOCSY 接力谱SC Scalar Coupling 标量偶合SDDS Spin Decoupling Difference Spectroscopy 自旋去偶差谱SE Spin Echo 自旋回波SECSY Spin-Echo Correlated Spectroscopy自旋回波相关谱SEDOR Spin Echo Double Resonance 自旋回波双共振SEFT Spin-Echo Fourier Transform Spectroscopy (with J modulation) (J-调制)自旋回波傅立叶变换谱SELINCOR Selective Inverse Correlation 选择性反相关SELINQUATE Selective INADEQUA TE 选择性双量子(实验)SFORD Single Frequency Off-Resonance Decoupling 单频偏共振去偶SNR or S/N Signal-to-noise Ratio 信/ 燥比SQF Single-Quantum Filter 单量子滤波SR Saturation-Recovery 饱和恢复TCF Time Correlation Function 时间相关涵数TOCSY Total Correlation Spectroscopy 全(总)相关谱TORO TOCSY-ROESY Relay TOCSY-ROESY接力TQF Triple-Quantum Filter 三量子滤波WALTZ-16 A broadband decoupling sequence 宽带去偶序列WATERGATE Water suppression pulse sequence 水峰压制脉冲序列WEFT Water Eliminated Fourier Transform 水峰消除傅立叶变换ZQ(C) Zero-Quantum (Coherence) 零量子相干ZQF Zero-Quantum Filter 零量子滤波T1 Longitudinal (spin-lattice) relaxation time for MZ 纵向(自旋-晶格)弛豫时间T2 Transverse (spin-spin) relaxation time for Mxy 横向(自旋-自旋)弛豫时间tm mixing time 混合时间τ c rotational correlation time 旋转相关时间。
磁 共 振 成 像课件
亚急性晚期(正铁血红蛋白细胞外期): T1WI和T2WI均为高信 号。
脑出血
脑出血
(一)、高血压脑出血
慢性期(软化灶期): 脑出血囊变液化时,软化灶 T1WI为低信号,T2WI为高信 号,周围含铁血黄素沉积的低 信号环是其特点。
(一)、高血压脑出血
鉴别要点:
脑出血急性期MRI没有CT显示清 楚明确,而亚急性期及慢性期MRI具 有特殊信号特征,可反映出血的演变 规律, MRI 较CT显示优越。
(含铁血黄素 )
(一)、高血压脑出血
MRI表现:
脑出血在脑实质内形成一定程度占位, 血肿较大者常伴有周围水肿,占位效应 更明显。血肿信号根据各期不同而异:
急性期(三天内)
主要是脱氧血红蛋白,血肿T1WI为等 或略低信号, T2WI为低信号。
亚急性早期(正铁红蛋白细胞内期): T1WI上血肿从周边向中 央 逐渐出现高 信号,T2WI仍为低信号。
脑出血MRI成像原理:
血液中含氧血红蛋白2—3小时 T1略低,T2略高
脱氧血红蛋白 T1等信号或低信号,T2低信号 氧 化 亚急性前期 细胞内期T1高信号,T2低信号 亚急性后期 正铁血红蛋白﹛ 细胞外期T1高信号,T2高信号
溶降 酶解 体
急性期
↓ ↓ ↓
缺氧(释放出氧气)
(含铁血黄素 ) 囊变期 坏死囊变 T1低信号,T2高信号,周围低信号环
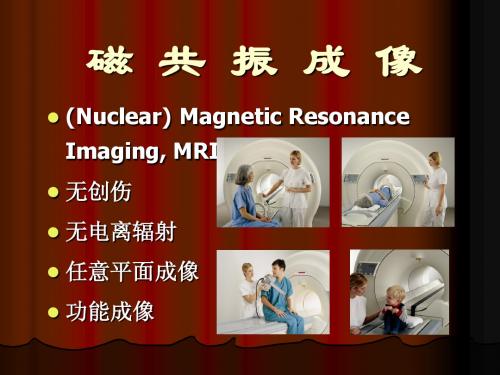
磁 共 振 成 像
(Nuclear) Magnetic Resonance
Imaging, MRI
无创伤
无电离辐射
任意平面成像
功能成像
磁共振设备构成
磁体 (magnet)
信号发生和采集 system) 数据处理和图像显示
磁共振

固体中有两种或更多互相耦合的基团或磁共振系统时,一种基团或系统的磁共振可以影响另一种基团或系统 的磁共振,因而可以利用其中的一种磁共振来探测另一种磁共振,称为磁双共振。例如可利用同一物质中的一种 核的核磁共振来影响和探测另一种核的核磁共振,称为核-核磁双共振;可以用同一物质中的核磁共振来影响和 探测电子自旋共振,称为电子-核磁双共振;也可利用光泵技术来探测其他磁共振(如核磁共振或顺磁共振), 称为光磁双共振或光测磁共振。
当M是顺磁体中的原子(离子)磁矩时,这种磁共振就是顺磁共振。当M是铁磁体中的磁化强度(单位体积中 的磁矩)时,这种磁共振就是铁磁共振。当M=Mi是亚铁磁体或反铁磁体中第i个磁亚点阵的磁化强度时,这种磁 共振就是由 i个耦合的磁亚点阵系统产生的亚铁磁共振或反铁磁共振。当M是物质中的核磁矩时,就是核磁共振。
磁共振也可用量子力学描述:恒定磁场B使磁自旋系统的基态能级劈裂,劈裂的能级称为塞曼能级(见塞曼效 应),当自旋量子数S=1/2时,其裂距墹E=gμBB,g为朗德因子,μ为玻尔磁子,e和me为电子的电荷和质量。外加 垂直于B的高频磁场b(ω)时,其光量子能量为啚ω。如果等于塞曼能级裂距,啚ω=gμBB=啚γB,即ω=γB (啚=h/2π,h为普朗克常数),则自旋系统将吸收这能量从低能级状态跃迁到高能级状态(激发态),这称为 磁塞曼能级间的共振跃迁。量子描述的磁共振条件ω=γB,与唯象描述的结果相同。
亦称抗磁共振。固体中的载流子(电子及空穴)和等离子体以及电离气体在恒定磁场 B和横向高频电场E (ω)的同时作用下,当高频电场的频率ω与带电粒子的回旋频率相等,ω=ωc,这些带电粒子碰撞弛豫时间τ 远大于高频电场周期,即τ≥1/ω时,便可观测到带电粒子的回旋共振。因此,回旋共振常是在高纯、低温(τ 大)和强磁场(ωc高)、高频率的条件下进行观测,其显著特征是在各向同性介质中,介电常数ε和电导率σ成 为张量,称为旋电性。这与其他的磁矩(自旋)系统的磁共振中磁导率 μ为张量(称为旋磁性)不相同。此外, 在电离分子中还可观测到各种带电离子的回旋共振──离子回旋共振。回旋共振主要应用于半导体和金属的能带 结构、载流子有效质量等的研究,也是实现研究旋电器件(如半导体隔离器)、微波参量放大器、负质量放大器、 毫米波激射器和红外激光器的物理基础。
核磁苯环特征区 英文

核磁苯环特征区的英文表达为:Nuclear magnetic benzene ring characteristic region。
核磁共振(Nuclear Magnetic Resonance,NMR)是一种常用的分析技术,通过观测核磁共振现象来研究物质的结构和性质。
苯环是一个六个碳原子构成的芳香环,具有特殊的电子结构和化学性质。
在核磁共振谱中,苯环的特征区主要包括以下几个方面:
1. 化学位移:苯环中的氢原子具有一定的化学位移,即吸收峰在核磁共振谱上的位置。
苯环上的氢原子通常显示在较低化学位移区域,其化学位移范围通常在7-8.5 ppm之间。
2. 耦合常数:苯环中的氢原子之间存在耦合作用,即它们的共振频率相互影响。
苯环上的氢原子通常呈现出三重ts选项对称的耦合模式,即每个氢原子周围都有两个等距离的耦合氢原子。
这种耦合关系导致了峰的裂分,例如,苯环上的顶氢原子会被四个邻近的耦合氢原子裂分为四个峰。
耦合常数可以通过测量裂分的峰距来确定。
3. 积分强度:苯环中各个氢原子的积分强度可以反映它们的相对数量。
在苯环谱图中,积分强度通常以峰的高度或面积表示,用于计算不同位置氢原子的比例关系。
4. 峰形和峰宽:苯环的核磁共振峰通常呈现出对称的形状,峰宽度较窄。
这是由于苯环具有刚性结构和芳香性质,使得苯环上的氢原子的化学位移和峰形较为稳定。
当然,苯环的核磁共振谱还受到其他因素的影响,例如溶剂效应、取代基和环境条件等。
因此,在解读苯环的核磁共振谱时,需要综合考虑这些因素,以及其他实验条件和样品性质的影响。
磁共振DTI在脑梗死诊断中的应用价值
磁共振DTI在脑梗死诊断中的应用价值宋建波;杨晓棠;彭琨;冯艳林;沈伟;刘起旺【摘要】目的探讨磁共振弥散张量成像(DTI)对脑梗死诊断的价值.方法收集临床诊断考虑脑梗死并经常规磁共振成像(MRI)和弥散加权成像(DWI)检查证实为单侧脑梗死病人行DTI检查,共48例.重建ADVAV图、FA图及DTT图,测定脑梗死区及健侧相应部位脑组织的ADVAV值和FA值,对锥体束受累病人,测量双侧大脑脚、脑桥的ADVAV值和FA值测量.结果脑梗死后脑组织ADVAV值、FA值随病理生理演变呈一定规律性变化,在慢性期锥体束受累病例显示远离病变区患侧锥体束FA 值下降,ADVAV变性则无统计学意义.与传统MRI及DWI相比DTI可清晰显示梗死灶与白质纤维束的空间位置关系及其受累程度.结论 DTI结合常规MRI及DWI对梗死灶的解剖定位更准确,ADVAV值与FA值联合应用有助于对脑梗死进行更精确的临床分期,DTI对脑梗死的诊断、治疗及评估预后具有重要临床应用价值.【期刊名称】《中西医结合心脑血管病杂志》【年(卷),期】2010(008)010【总页数】3页(P1196-1198)【关键词】脑梗死;磁共振成像;弥散张量成像【作者】宋建波;杨晓棠;彭琨;冯艳林;沈伟;刘起旺【作者单位】山西医科大学第一医院,030001;山西医科大学第一医院,030001;太钢总医院;太钢总医院;太钢总医院;山西医科大学第一医院,030001【正文语种】中文【中图分类】R743.1;R255.2脑梗死为临床最常见的一种致残率和致死率较高的脑血管疾病,脑梗死的早期诊断和治疗明显影响预后,一直是医学界一大难题。
弥散加权成像(diffusion weighted imaging,DWI)是目前公认的可定性、定位诊断超急性脑梗死的成像方法,但DWI 只能反映弥散梯度方向上水分子的弥散强度,不能反映生物组织水分子弥散呈各向异性的特征,难以显示白质纤维受累情况[1]。
核磁共振参数

核磁共振参数核磁共振(Nuclear Magnetic Resonance,NMR)是一种非常重要的物理技术,可以在不破坏样品的情况下获取大量关于其结构和性质的信息。
在化学、生物学、医学等领域都有广泛的应用。
通过测量核磁共振参数可以得到样品的结构、动力学以及对外界环境的响应等重要信息。
在这篇文章中,我们将介绍一些与核磁共振相关的重要参数,包括化学位移、耦合常数、弛豫时间等。
一、化学位移(Chemical Shift)化学位移是核磁共振谱线上信号的频率和参照物信号频率的差值,通常用单位 ppm(百万分之一)来表示。
化学位移与核素周围的电子环境有关,可以提供关于化合物结构和化学环境的信息。
化学位移可用以下公式表示:\[ \delta = \frac{\nu - \nu_{\text{参照物}}}{\nu_{\text{参照物}}} \times10^6\]\(\delta\) 为化学位移, \(\nu\) 为信号频率,\(\nu_{\text{参照物}}\) 为参照物的信号频率。
二、耦合常数(Coupling Constant)对于一个有多个相邻原子的核磁共振信号,其谱线通常会发生分裂,这是由于不同核之间的相互作用导致的。
耦合常数描述了这种相互作用的强度,通常用单位 Hz 来表示。
耦合常数可以帮助确定分子结构以及质子相对位置。
耦合常数的大小与相邻核之间的距离、化学环境以及分子构型等因素有关。
三、弛豫时间(Relaxation Time)核磁共振信号的衰减过程可以用弛豫时间来描述。
弛豫时间分为自旋晶格弛豫时间(T1)和自旋自旋弛豫时间(T2)。
T1 描述的是核磁共振信号在外部磁场作用下,从激发状态回到平衡状态的过程,而 T2 描述的是核磁共振信号由于各种不均匀性而引起的相位衰减过程。
弛豫时间的大小可以提供关于样品运动、结构等信息。
四、核磁共振频率(NMR Frequency)核磁共振频率是指在给定的磁场下,特定核素的核磁共振信号对应的频率。
- 1、下载文档前请自行甄别文档内容的完整性,平台不提供额外的编辑、内容补充、找答案等附加服务。
- 2、"仅部分预览"的文档,不可在线预览部分如存在完整性等问题,可反馈申请退款(可完整预览的文档不适用该条件!)。
- 3、如文档侵犯您的权益,请联系客服反馈,我们会尽快为您处理(人工客服工作时间:9:00-18:30)。
Original Paper3T magnetic resonance diffusion tensor imaging and fibre tracking in cervical myelopathyM.Xiangshui,C.Xiangjun,Z.Xiaoming,Z.Qingshi,C.Yi,Q.Chuanqiang,M.Xiangxing,L.Chuanfu,H.Jinwen *Department of Radiology,Qi Lu Hospital of Shandong University,Chinaarticle information Article history:Received 4July 2009Received in revised form 20January 2010Accepted 27January 2010AIM:To analyse the characterization of diffusion tensor imaging (DTI)with 3T magnetic resonance imaging (MRI)in cervical myelopathy.METHODS:A total of 21healthy controls and 84patients with cervical myelopathy under-went T2-weighted imaging and DTI.The patients were divided into four groups based on the degree of cord compression and MRI signal intensity of the compressed cord as seen on T2-weighted images.The values of apparent diffusion coefficient (ADC),fractional anisotropy (FA),and eigenvalues (l i )were analysed,and fibre tracking (FT)was performed.RESULTS:For healthy controls,the mean values from the DTI of the cervical spinal cord were ADC ¼0.784Æ0.083Â10À3mm 2/s,FA ¼0.721Æ0.027,l 1,l 2,and l 3¼1.509Æ0.145Â10À3,0.416Æ0.094Â10À3,and 0.411Æ0.102Â10À3mm 2/s,respectively.Only values for l 2and l 3differed significantly between the control and A groups (p <0.05).The mean values of l 2and l 3of group A were 0.516Æ0.105Â10À3and 0.525Æ0.129Â10À3mm 2/s,respectively.ADC,FA,l 1,l 2and l 3differed significantly between the control and B,C,D groups (p <0.01).The FT map for group A showed a normal spinal cord,but that for groups B,C,and D showed a distorted spinal cord at the sites of compression.CONCLUSION:The values of ADC,FA,and l i obtained with DTI could assess subtle structural damage and changes of anisotropy in the cord of cervical myelopathy.Fibre tracking was useful in verifying changes in the compressed cord.Ó2010The Royal College of Radiologists.Published by Elsevier Ltd.All rights reserved.IntroductionSpinal cord compression can be caused by variety of diseases,such as metastases,abscess,degeneration,and myelopathy.Among them,cervical myelopathy is the most common and results in cord demyelination,necrosis,and cavitation.Symptoms of cervical myelopathy include motor,sensory deficits and major functional disability.Magnetic resonance imaging (MRI)is an effective imaging method fordiagnosing cervical myelopathy with abnormal T2-weighted images of dura mater spinalis and,occasionally,the cord.T2-weighted imaging alone,however,has low sensitivity for detecting the subtle structural damage of the cord in myelopathy,especially in patients with chronic onset of symptoms.1–3Optimal treatment of cervical myelopathy requires early detection of the abnormality of the spinal cord.In recent years,diffusion-weighted imaging (DWI)sequences have been obtained for spinal cord diseases,with improvement of the diagnostic sensitivity for chronic spinal abnormalities,4,5but few parameters are derived from DWI.Diffusion tensor imaging (DTI)is an MRI technique.The values of apparent diffusion coefficient (ADC),fractional anisotropy (FA)and eigenvalues (l i )obtained with DTI*Guarantor and correspondent:H.Jinwen,Department of Radiology,Qi Lu Hospital of Shandong University,Wenhuaxi Road 107Jinan,China.Tel.:þ86053182169511;fax:þ86053186927544.E-mail address:cxj20080803@ (H.Jinwen).Contents lists available at ScienceDirectClinical Radiologyjournal homepage:www.elsevierhea/journals/crad0009-9260/$–see front matter Ó2010The Royal College of Radiologists.Published by Elsevier Ltd.All rights reserved.doi:10.1016/j.crad.2010.01.019Clinical Radiology 65(2010)465–473evaluate the scalar properties of the diffuse translation of extracellular water molecules within white matterfibres.6 ADC values represent diffusive strength,with high ADC values indicating robust diffusive strength of extracellular water molecules.FA is an anisotropic parameter:values closer to1represent a more anisotropic structure.7The eigenvectors of the symmetric diffusion tensor,a set of orthogonal vectors,defines the orientation of the principal axes of the diffusion tensor ellipsoid in space.Their corre-sponding eigenvalues represent the lengths of the axes. Therefore these quantities define the size and shape of the ellipsoids and are independent of its orientation in its frame of measurement.The degree of anisotropy could be measured by these eigenvalues.The use offibre track(FT) three-dimensional(3D)reconstructions can track the white matter pathways in the brain and spinal cord.8,9 The application of DTI for brain lesions has enabled the characterization of micro-structural changes in multiple sclerosis,schizophrenia,trauma,stroke,and aging,10–12and the lesions andfibre connectivity of the white matter pathways can be visualized using FT.13,14Although DTI is not routinely used in the clinic,a few studies have demon-strated the technique’s potential for the depiction of path-ological conditions of the spinal cord.The aim of the present study was to investigate the characterization of DTI for detecting and quantitatively analysing myelopathological changes in the cervical spinal cord.Materials and methodsFrom September2006to May2007,936patients with cervical radiculopathy or myelopathy were referred to our institution for MRI of the cervical spinal cord.Eighty-four patients(mean age45years,range16–63years;48men) who met the following criteria were enrolled.The criteria were as follows:disk protrusion seen on MRI,clinical symptoms of neck pain,motor dysfunction,and sensory deficits lasting3months,imagingfindings matched the clinical symptoms(compression level).Patients with previous spine surgery or spine radiation therapy or those who had contraindications to MRI were excluded.Twenty-one healthy volunteers(mean age43years,range18–60 years;12men)with no history of neurological disorders were also enrolled as controls.The MRI protocol was approved by the review board of our institution,and all patients and volunteers gave their informed consent for the study.MRI and DTIImaging involved the use of a3T MRI system(GE Medical Systems,EXCITE,Wisconsin,USA)with a maximum gradient strength of40mT/m.A neck coil was applied. The protocol began with the acquisition of a coronal T2-weighted scout view,then a sagittal T2-weighted fast spin echo(FSE)sequence[field of view320Â320mm; image matrix640Â384;section thickness3mm;repeti-tion time/echo time(TR/TE)3000ms/110ms]and a sagittal T1-weighted spin echo sequence(field of view 320Â320mm;image matrix640Â384;section thickness 3mm;TR/TE550ms/9ms).A sequence of FSE,axial,T2-weighted images(field of view180Â180mm;image matrix256Â256;section thickness4mm;TR/TE3000/ 110ms)was obtained at C1–C2,C2–C3,C3–C4,C4–C5,C5–C6, and C6–C7levels of the cervical spinal cord.Subsequently, a sequence of axial sensitivity-encoding echo-planar DTI (field of view270Â270mm;image matrix96Â96;28 sections,4m thick;TR/TE6000/83ms)was obtained at C1–C7.The acquisition time of DTI per participant was5min. Image analysis involved use of the GE Functool software. Before performing tensor estimation,a GE correction procedure was applied to the DTI dataset to correct distor-tions related to eddy currents induced by the large diffusion-sensitizing gradients.Based on a preliminary study,15non-collinear gradient directions with b value of 1000s/mm2were applied.MeasurementsFor healthy volunteers,the values of ADC,FA,eigenvalues l1,l2,and l3were measured at levels C2–C3,C4–C5,and C6–C7of the cervical spinal cord.The regions of interest (ROI)were drawn manually to set the spinal cord at the most accurate axial b0image,which matched the size of transverse spinal cord.Special attention was paid to elimi-nate the partial volume effect of the cerebrospinalfluid (CSF)surrounding the cord,magnetic susceptibility effects, and motion artefacts in the ROI.A reference database was created by pooling the values of ADC,FA,l1,l2,and l3at different levels of the spinal cord for controls.The84patients were divided into four groups according to severity of disk herniation and MRI signal intensity of the compressed cord seen on T2-weighed images,which were reviewed by two experienced neuroradiologists.Differ-ences in diagnoses were resolved by discussion.Group A patients showed only mild compression of the dura mater spinalis,which referred to the disk protruding beyond the posterior vertebral line with obliteration of the subarach-noid space,without cord compression in the spinal cord adjacent to the site of disk herniation.Group B patients showed slight cord compression,which referred to the observation of a concave defect less than30%of the ante-roposterior diameter of the spinal cord at the site of compression,without any change in signal intensity.Group C patients showed moderate cord compression,which referred to the observation of a concave defect in the spinal cord associated with subtle hyperintense signal changes, the concave defects were30–70%of the anteroposterior diameter of spinal cord.Group D patients showed marked cord compression with obvious hyperintense signal changes,the concave defects of the cord at the sites of compression were more than70%of the anteroposterior diameter of spinal cord.DTI measurements were performed at the sites of compression of the spinal cord in all of the groups(groups A,B,C,and D).Values of ADC,FA,l1,l2,and l3were obtained by using small ROIs of10mm2that were matched in size. The ROIs were at the sites of spinal cord compression forM.Xiangshui et al./Clinical Radiology65(2010)465–473 466Figure 1Representative T2-weighted images,FT,and ADC maps,FA,l 1,l 2,and l 3from DTI of the cervical spine cord of a healthy man.(a)Sagittal and (b)axial T2-weighted images show normal cervical cord and dura matter spinalis.(c)FT of the cervical spinal cord and nervi spinales is clearly demonstrated.The nervi spinales appear disconnected from spinal cord due to the small size of radix anterior,radix posterior,and physiological motion artefact.(d)The b0image is similar to T2-weighted image.(e)FA map:the red region of the cervical cord indicates high anisotropy (long arrow),the blue region of cerebrospinal fluid (CSF)surrounding the red region indicates high isotropy (short arrow).(f)ADC map:the central part of the cervical cord indicates low diffusion strength (long arrow)and the yellow region of CSF that surrounds the spinal cord indicates high diffusion strength (short arrow).(g)l 1map:the red region of the cervical cord symbolizes high diffusion strength (arrow).Maps of l 2(h)and l 3(i):the yellow region of the cervical cord symbolizes similar low diffusion strength(arrow).Table 1M.Xiangshui et al./Clinical Radiology 65(2010)465–473467groups A and B,but were at the abnormal hyperintense areas close to the sites of spinal cord compression at the level of disk herniation according to the b0image for groups C and D.Three-dimensional FT maps were reconstructed with the use of b0images,ADC maps,and FA maps at a GE AW 2.0workstation.For controls,ROIs including the cervical spinal cord and nervi spinales were drawn at each level of the cervical spinal cord (C1–C2,C2–C3,C3–C4,C4–C5,C5–C6,C6–C7)to reconstruct the FTs step by step.To visu-alize the distortion of the cervical spinal cord,ROIs were set at the cervical spinal cord only to reconstruct FTs for patients.A FA threshold value of 0.18and an angulation threshold of 45 were adopted to prevent fibres from sudden transition and to keep tracking based on the connectivity of the neighbourhood.The eigen system (with eigenvalues l 1,l 2,and l 3)were calculated voxel by voxel using a previously described method.15Thus,ADC mean ¼(l 1þl 2þl 3)/3¼l andFA ¼ffiffiffi32r $ffiffiffiffiffiffiffiffiffiffiffiffiffiffiffiffiffiffiffiffiffiffiffiffiffiffiffiffiffiffiffiffiffiffiffiffiffiffiffiffiffiffiffiffiffiffiffiffiffiffiffiffiffiffiffiffiffiffiffiffiffiffiffiffiðl 1Àl Þ2þðl 2Àl Þ2þðl 3Àl Þ2q ffiffiffiffiffiffiffiffiffiffiffiffiffiffiffiffiffiffiffiffiffiffiffiffiffiffil 21þl 22þl 23q were calculated based on formulas that incorporate thetensor elements to generate quantitative parametric ADC and FA maps in healthy volunteers and patients.Statistical analysisResults are expressed as mean ÆSD.Data analysis involved the use of SPSS 13.0(SPSS,Chicago,IL,USA).The statistical significance of the computed mean values of ADC,FA,l 1,l 2,and l 3of groups A,B,C,and D and the controlswere assessed using analysis of variance (ANOVA)and Newman–Keuls test.P <0.05was considered statistically significant.ResultsConventional T2-weighted imaging showed a normal cervical spinal cord in healthy controls.T2-weighted images and maps of ADC,FA,l 1,l 2,and l 3are shown in Fig.1.The mean values of ADC,FA,l 1,l 2,and l 3of C2–C3,C4–C5,and C6–C7levels are listed in Table 1.ANOVA was used to compare the mean values of ADC,FA,l 1,l 2,and l 3at C2–C3,C4–C5and C6–C7levels in cervical spinal cords of 21healthy volunteers.Values of ADC,FA,l 1,l 2,and l 3did not significantly differ between the three different levels of the spinal cord (Fig.2).The mean values for ADC,l 1,l 2,and l 3at the sites of spinal cord compression for patients are listed in Table 2.ANOVA was used to compare the mean values of ADC,FA,l 1,l 2,and l 3at the sites of compression and healthy spinal cords among groups A,B,C,D,and controls.There were significant differences in the ADC values (F ¼32.84,p <0.05),FA (F ¼115.32,p <0.05),l 1(F ¼7.66,p <0.05),l 2(F ¼63.93,p <0.05),and l 3(F ¼43.57,p <0.05)of groups A,B,C,D,and controls.Multiple comparisons with Newman–Keuls test were used to compare the mean values of ADC,FA,l 1,l 2,and l 3among groups A,B,C,D,and controls (21participants per group).Comparison of the values of ADC,FA,l 1,l 2,l 3between the control group and groups A,B,C,D are listed in Fig.3and Table 3.Group A showed only mild compression of the dura mater spinalis with obliteration of the subarachnoid space,without cord compression on T2-weighted images;l 2and l 3but not ADC.FA and l 1differed significantly between the control group and group A (p <0.05;Table 3).Group B showed concave defects in the spinal cord at the compression sites without high signal intensity on T2-weighted images (Fig.4).Group C showed moderate cord compression with subtle hyperintense signal changes on T2-weighted images (Fig.5).Group D showed marked cord compression with conspicuous hyperintense signal changes on T2-weighted images (Fig.6).Groups B,C,and D signifi-cantly differed from controls in ADC,FA,l 1,l 2,and l 3(p <0.01;Fig.3,Table 3).Healthy controls showed continuous and intact FT of the cervical spinal cord.The main white matter tracts could be seen,and the nervi spinales appeared disconnected from the spinal cord because of the small size of radix anterior,radix posterior,and physiological motion artefacts (Fig.1c).The three-dimensional FT map for group A patientsshowedFigure 2Values of ADC,FA,l 1,l 2,and l 3at levels C2–C3,C4–C5,C6–C7of the spine by DTI in healthy controls.Mean values of ADC,FA,l 1,l 2,and l 3did not significantly differ at C2–C3,C4–C5and C6–C7levels.Table 2M.Xiangshui et al./Clinical Radiology 65(2010)465–473468a normal spinal cord,but that for groups B,C,and D showed a distorted spinal cord at sites of compression,which concurred with findings from the T2-weighted images (Figs.4c,5c,and 6c).DiscussionHolder et al.16and Summers et al.17reported successful in vivo diffusion imaging of the human spinal cord using 1.5and 3T MRI.Ford et al.18demonstrated decreased longitu-dinal ADC and increased transverse ADC in a rat spinal cord weight-drop injury model.DTI of spinal cord diseases,such as syringomyelia,multiple sclerosis,trauma,and tumours,have been reported recently from studies of animals and humans.19–22To the authors’knowledge,use of a 3T MRI system to measure values of ADC,FA,l 1,l 2,and l 3to quantitatively analyse spondylosis-related changes of the cervical spinal cord have not been previously reported.In the present study,values of ADC,FA,l 1,l 2,and l 3at levels C2–C3,C4–C5,and C6–C7of the cervical spinal cord were measured in 21healthy volunteers,and the values of ADC,FA,l 1,l 2,and l 3for chronic spinal cord compression were investigated in 84patients with cervical myelopathy.Values of ADC,FA,l 1,l 2,and l 3did not differ at different levels of the cervical spinal cord in healthy volunteers.Previously reported ADC values (0.96–1.14Â10À3mm 2/s)of normal spinal cord 9,14,23,24are similar to those from the present study (0.781–0.788Â10À3mm 2/s).Most previous investigations of FA of the cervical spine involved 1.5T MRI systems in healthy volunteers,with FA values ranging from 0.52to 0.745,9,14,23,24which concurred with the presentresults (0.718–0.726).According to the present study,values of l 2and l 3were much lower than l 1,whereas l 2values were similar to l 3.Results of Holder et al.16concurred with the present results in that diffusion within the cervical spinal cord was highly anisotropic from these FA values and eigenvalues,which was a diffusion tensor cylinder in space.Thus,the pattern of diffusivity matched the anatomic structure of the spinal cord.In fact,the axons running along the spinal cord create an anisotropic structure,whereby random thermal motion along the axons and the surrounding extracellular space is much less restricted than motion in the perpendicular plane.Ito et al.25and Larocca 26reported that the mechanism of lesion formation in cervical myelopathy increased in pres-sure due to continuous or intermittent pinching of the cord,which induced chronic hypoperfusion.Sequential changes,such as hypoxia or ischaemia,may lead to lesion formation.Demir et al.1reported that DWI in patients with cervical myelopathy revealed an increase in water diffusion and changes in diffusion direction.They hypothesized that changes may be located primarily in the interstitial space,in which water molecules may flow rapidly due to the spatial expansion associated with increased internal pressure.An increase in internal pressure may be the result of an increase in pressure around the spinal cord because of cord pinching by bone formation and disk movement and because of cerebrospinal fluid flow disturbances resulting from the narrowing of the spinal canal.In the present study,the mean ADC values were increased at the sites of compression in groups B,C,and D.The mechanisms that produced these abnormalities could not be determined.Changes of water diffusion in spinal cord compression may be one important reason as explained by Demir et al..1,25,26However,mean ADC values were not increased in group A,which suggests that the structure of spinal cord was not damaged with subtle spinal cord compression.Experimental study of spinal cord compression in rats found decreased FA values due to various elements,such as mechanical disruption,tearing of fibres and myelin sheaths,extracellular oedema,Wallerian degeneration,demyelin-ation,loss of spatial organization,liquefaction,or cystic degeneration.27In this study,spinal cord compression was experimentally designed and imaged several months after the onset of compression.The authors’pathophysiological findings concurred with the present findings of lower FA with spinal compression due to cervical myelopathy than that in healthy controls.In the present study,mean FA values decreased at compression sites in groups B,C,and D.The pathological changes in rats reported by Nevo et al.27Figure 3Comparison of the values of ADC,FA,l 1,l 2,and l 3between the control group and patients of groups A,B,C,and D.l 2and l 3,but not ADC,FA,and l 1,significantly differed between group A and controls (p <0.05);ADC,FA,l 1,l 2,and l 3significantly differed between groups B,C,and D and the controls (p <0.05).Table 3M.Xiangshui et al./Clinical Radiology 65(2010)465–473469Figure 4Representative T2-weighted images,FTs and maps of ADC,FA,l i from the DTI of a patient with cervical myelopathy from group B.(a)Sagittal and (b)axial T2-weighted images show the concave defect which is less than 30%of the anteroposterior diameter of the spinal cord at levels C3–C4,C4–C5and C5–C6,without abnormal signal intensity in the compression sites (arrow).(c)FT shows a concave defect of the spinal cord at the compression site corresponding to the T2-weighted images (arrow).(d)b0image shows distortion at the compression site (arrow).(e)FA map:the fading part of the red region indicates decreased anisotropy at the compression site (arrow).(f)ADC map:the blue region of the cervical cord indicates increased diffusion strength at the compression site (arrow).(g)l 1map:the red region of the cervical cord indicates increased diffusion strength at the compression site.Maps of l 2(h)and l 3(i):the yellow regions of the cervical cord suggest increased diffusion strength at the compression site,respectively.M.Xiangshui et al./Clinical Radiology 65(2010)465–473470may be also have occurred in spinal cord compression in patients with cervical myelopathy,which leads to a decrease in FA at the site of compression of the spinal cord.However,mean FA values did not decrease in group A,which suggests that the microstructure of the spinal cord was not damaged in these patients.In the present study,the values of l 1,l 2,and l 3increased with increasing severity of spinal cord compressioninFigure 5Representative T2-weighted images,FT and the maps of ADC,FA,l i from DTI of a patient with cervical myelopathy from group C.(a)Sagittal and (b)axial T2-weighted images show spinal cord compression at the C5–C6level with subtle hyperintensity at the compression site,the degree of cord compression is nearly 50%of the anteroposterior diameter of the spinal cord (arrow).(c)FT shows distortion of the spinal cord at the compression site corresponding to the T2-weighted image (arrow).(d)b0image shows distortion of the compressed site (arrow).(e)FA map:the part of red region is imperceptible,which suggests decreased anisotrophy at the compression site (arrow).(f)ADC map:the green and slight red region of the cervical cord indicate increased diffusion strength at the compressed site (arrow).Maps of l 1(g),l 2(h),and l 3(i):the dark red signal of the cervical cord at the compression site indicates increased diffusion strength.M.Xiangshui et al./Clinical Radiology 65(2010)465–473471groups B,C,and D.These results indicate that the strength of diffusion increased in different orientations of the principal axes of the diffusion tensor ellipsoid in space,but a cylin-drical diffusion pattern remained at compression sites inthese patients.Values of l 1did not differ between group A and the control group,in which no variation of the corre-sponding eigenvectors in group A occurred.However,values of l 2and l 3were significantly higher in group A than intheFigure 6Representative T2-weighted images,FT and the maps of ADC,FA,l i from DTI of a patient with cervical myelopathy from group D.(a)Sagittal and (b)axial T2-weighted images show spinal cord compression at the C4–C5and C5–C6levels with marked hyperintensity at the compression site,the degree of cord compression is nearly 75%of the anteroposterior diameter of spinal cord (arrow).(c)FT shows distortion of the spinal cord at the compressed site corresponding to the T2-weighted image (arrow).(d)b0image shows distortion of the compressed site (arrow).(e)FA map:the green region of cord suggests significant decreased anisotrophy at the compression site (arrow).(f)ADC map:the green and yellow region of the cord indicate distinguished increased diffusion strength at the compression site (arrow).Maps of l 1(g),l 2(h),and l 3(i):the identical dark red signal of the cervical cord at the compression site indicates marked increased diffusion strength,respectively.M.Xiangshui et al./Clinical Radiology 65(2010)465–473472control group,which suggests that corresponding eigen-vectors increased,although measurement error cannot be discounted.This hypothesis needs further investigation.With regard to FT,this tool appears to be more than just a visualization tool for the white matter tracts of the spinal cord.Anatomical correlation to corticospinal and spino-thalamic pathways is excellent.FT measurement can help confirm the positive diagnosis of spinal cord abnormalities by locating the specific compression area.14In the present study,the main white matter tracts could be clearly demonstrated on FT maps in all healthy controls.In patients,the FT map showed distortion and interruption of the compressed spinal cord,which matchedfindings seen on T2-weighted images.Interruptedfibres on FT maps corresponded to FA values below0.18or a rupture angle of 45 ,and this aspect did not mean thatfibres were actually interrupted.We believe that the other appearance with spreadingfibres corresponded to oedema and gliosis of the cord at the compression sites,but there is no objective proof.This hypothesis has to be explored by further studies.The quality of DTI of the cervical spinal cord may be decreased due to the small diameter of the spinal cord,CSF flow,respiratory,cardiac motion artefacts,and magnetic susceptibility artefacts.This technique still needs further improvement.The image and motion artefacts may be improved by use of a better co-registration algorithm and more gradient directions in DTI sequences.28In the prelimi-nary study(performed infive healthy volunteers,with5,10, 15,20,25non-collinear gradient directions selected,and b values set at600,1000,1500,2000,and2500s/mm2, respectively),15non-collinear directions and a b value of 1000s/mm2were helpful in improving the quality of DTI of the spinal cord.It was important to eliminate the partial volume effect of CSF surrounding the cord,magnetic suscep-tibility effects,and motion artefacts in the ROI selection.In conclusion,values of ADC and FA measured by DTI could assess spinal cord abnormalities in patients with cervical myelopathy.The subtle structural damage of the cord in cervical myelopathy could be quantitatively ana-lysed in the early stages of the disease by measuring the values of ADC,FA,l1,l2,and l3.The size and shape of ellipsoids in space of diffusion tensor at compressed spinal cord could be evaluated by the values of l1,l2,and l3.FT was useful in revealing the main white matter tracts of the spinal cord in assessing chronic cord compression. AcknowledgementsThe authors thank Zheng Jinyong,Cong Peixin,Kang Xiaoshui,and Feng Dechao with their assistance in imaging the subjects.References1.Demir A,Ries M,Moonen C,et al.Diffusion-weighted MR imaging withapparent diffusion coefficient and apparent diffusion tensor maps in cervical spondylotic myelopathy.Radiology2003;229:37–43.2.Valsasina P,Agosta F,Benedetti B,et al.Diffusion anisotropy of thecervical cord is strictly associated with disability in amyotrophic lateral sclerosis.J Neurol Neurosurg Psychiatr2007;78:480–4.3.Takahashi M,Yamashita Y,Sakamoto Y,et al.Chronic cervical cordcompression:clinical significance of increased signal intensity on MR images.Radiology1989;173:219–24.4.Tsichiya K,Katase S,Fujikawa A,et al.Diffusion-weighted MRI of thecervical spinal cord using a single-shot fast spin-echo technique:findings in normal subjects and in myelomalacia.Neuroradiology2003;45:90–4.5.Plank C,Koller A,Mueller-Mang C,et al.Diffusion-weighted MR imaging(DWI)in the evaluation of epidural spinal lesions.Neuroradiology 2007;49:977–85.6.Basser P,Mattiello J,LeBihan D.MR diffusion tensor spectroscopy andimaging.Biophys J1994;66:259–67.7.Toosy AT,Werring DJ,Orrell RW,et al.Diffusion tensor imaging detectscorticospinal tract involvement at multiple levels in amyotrophic lateral sclerosis.J Neurol Neurosurg Psychiatr2003;74:1250–7.8.Conturo TE,Lori NF,Cull TS,et al.Tracking neuronalfiber pathways inthe living human brain.Proc Natl Acad Sci USA1999;96:10422–7.9.Renoux J,Facon D,Fillard P,et al.MR diffusion tensor imaging andfibertracking in inflammatory diseases of the spinal cord.AJNR Am J Neuro-radiol2006;27:1947–51.10.Andrade RE,Gasparetto EL,Cruz Jr LC,et al.Evaluation of white matterin patients with multiple sclerosis through diffusion tensor magnetic resonance imaging.Arq Neuropsiquiatr2007;65:561–4.11.Tang CY,Friedman J,Shungu D,et al.Correlations between diffusion tensorimaging(DTI)and magnetic resonance spectroscopy(1H MRS)in schizo-phrenic patients and normal controls.BMC Psychiatry2007;19(7):25. 12.Guadano JV,Jones PS,Fryer TD,et al.Local relationships betweenrestricted water diffusion and oxygen consumption in the ischemic human brain.Stroke2006;37:1741–8.13.Jones DK,Simmons A,Williams SC,et al.Non-invasive assessment ofaxonalfiber connectivity in the human brain via diffusion tensor MRI.Magn Reson Med1999;42:37–41.14.Facon D,Ozanne A,Fillard P,et al.MR diffusion tensor imaging andfibertracking in spinal cord compression.AJNR Am J Neuroradiol 2005;26:1587–94.15.Asser P,Mattiello J,LeBihan D.Estimation of the effective self-diffusiontensor from the NMR spin echo.J Magn Reson B1994;103:247–54. 16.Holder CA,Muthupillai R,Mukundan Jr S,et al.Diffusion-weighted MRimaging of the normal human spinal cord in vivo.AJNR Am J Neuroradiol 2000;21:1799–806.17.Summers P,Staempfli P,Jaermann T,et al.A preliminary study of theeffects of trigger timing on diffusion tensor imaging of the human spinal cord.AJNR Am J Neuroradiol2006;27:1952–61.18.Ford JC,Hackney DB,Alsop DC,et al.MRI characterization of diffusion coef-ficients in a rat spinal cord injury model.Magn Reson Med1994;31:488–94.19.Fujiyoshi K,Yamada M,Nakamura M,et al.In vivo tracing of neural tractsin the intact and injured spinal cord of marmosets by diffusion tensor tractography.J Neurosci2007;27:11991–8.20.Ducreux D,Lepeintre JF,Fillard P,et al.MR diffusion tensor imaging andfibertracking in5spinal cord astrocytomas.AJNR Am J Neuroradiol2006;27:214–6.21.Inglis BA,Neubauer D,Yang L,et al.Diffusion tensor MR imaging andcomparative histology of glioma engrafted in the rat spinal cord.AJNR Am J Neuroradiol1999;20:713–6.22.Agosta F,Rovaris M,Benedetti B,et al.Diffusion tensor MRI of thecervical cord in a patient with syringomyelia and multiple sclerosis.J Neurol Neurosurg Psychiatr2004;75:1647.23.Wheeler-Kingshott C,Hickman S,Parker G,et al.Investigating cervicalspinal cord structure using axial diffusion tensor imaging.Neuroimage 2002;16:93–102.24.Cerciqnani M,Horsfield M,Agosta F,et al.Sensitivity-encoded diffusion tensorMR imaging of the cervical cord.AJNR Am J Neuroradiol2003;24:1254–6. 25.Ito T,Oyanagi K,Takahashi H,et al.Cervical spondylotic myelopathy.Clinicopathologic study on the progression pattern and thin myelinated fibers of the lesions of seven patients examined during complete autopsy.Spine1996;21:827–33.rocca H.Cervical spondylotic myelopathy:natural history.Spine1988;13:854–5.27.Nevo U,Hauben E,Yoles E,et al.Diffusion anisotropy MRI for quantitativeassessment of recovery in injured rat spinal cord.Magn Reson Med 2001;45:1–9.28.Jones DK.The effect of gradient sampling schemes on measures derived fromdiffusion tensor MRI:a Monte Carlo study.Magn Reson Med2004;51:807–15.M.Xiangshui et al./Clinical Radiology65(2010)465–473473。