ELK5.0.1安装配置文档
elk安装文档
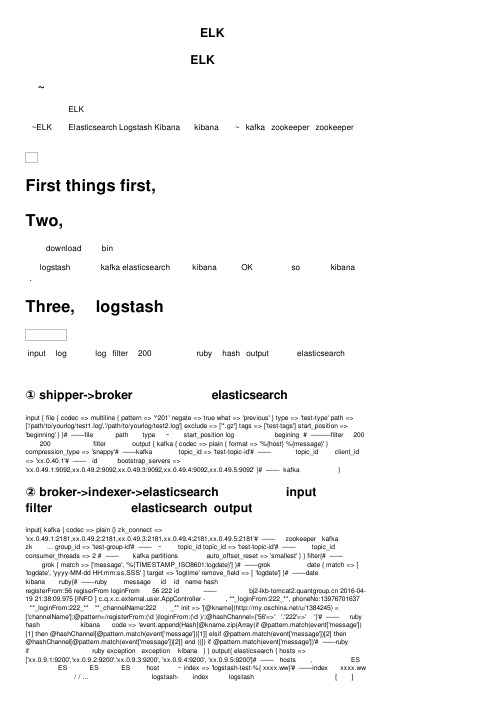
ELk安装文档一、简介ELK由Elasticsearch、Logstash和Kibana三部分组件组成;Elasticsearch是个开源分布式搜索引擎,它的特点有:分布式,零配置,自动发现,索引自动分片,索引副本机制,restful风格接口,多数据源,自动搜索负载等。
Logstash是一个完全开源的工具,它可以对你的日志进行收集、分析,并将其存储供以后使用kibana 是一个开源和免费的工具,它可以为 Logstash 和 ElasticSearch 提供的日志分析友好的 Web 界面,可以帮助您汇总、分析和搜索重要数据日志。
Elasticsearch: 存储各类日志;Logstash: logstash server端用来搜集日志;Kibana: web化接口用作查寻和可视化日志。
二、elasticsearch集群安装elasticsearch-2.0.0版本禁止使用root账号直接运行,所以需要用非root账号用于运行,可以新建或者使用已拥有的用户。
关闭防火墙,调整ulimit参数。
1.安装javaelasticsearch2.0版本需要java8及以上版本的支持,如果系统没有安装java 环境,需要先安装。
将安装包传至linux服务器,编辑~/.bashrc 增加下面三行(修改为正确的路径)exportJAVA_HOME="/usr/java/jdk1.8.0_131"exportJRE_HOME="/usr/java/jdk1.8.0_131/jre/"export PATH=$JAVA_HOME/bin:$PATH#source /etc/profile即可用java -version查看java版本。
2.配置elasticsearch一、将安装包中的elk2.4.tar.gz拷贝到磁盘空间较大的目录下使用root用户mkdir/opt/BOCO解压:tar–xzvfelk2.4.tar.gz–C /opt/BOCO二、修改配置文件(注意此文件有缩进)vi/opt/BOCO/elk/elasticsearch-5.4.0/config/elasticsearch.ymlcluster.nam e:BOCOLOG(集群名,用于定义集群名称): csv-es67(节点名称,保证集群内唯一)path.data:/opt/BOCO/elk/elasticsearch-5.4.0/data(es存储数据的位置)path.logs: /opt/BOCO/elk/elasticsearch-5.4.0/log(es日志文件的位置)network.host: 10.31.2.67(设为本机ip)http.port: 9200(es默认端口9200)discovery.zen.ping.unicast.hosts:["10.31.2.66", "10.31.2.67"](配置es集群列表)discovery.zen.minimum_master_nodes: 3#用于定义elasticsearch发送广播的ip,默认情况下向elasticsearch所在网段的所以ip进行广播3.启动elasticsearch1.启动前调整系统ulimit参数修改vi /etc/security/limits.conf增加以下配置项:句柄最大打开文件数* hardnproc 102400* softnproc 102400* hardnofile 102400* softnofile 102400* hard stack 1024* soft stack 10242.sysctl -w vm.max_map_count=2621443.rm-f/etc/security/limits.d/*#chown-R gcop:gcopelasticsearch-2.4.5#su – gcop#/opt/BOCO/elk/elasticsearch-5.4.0/bin/elasticsearch-d配好两台机器后,检验是否正常启动,查看集群信息:http://10.31.2.66:9200/_cat/nodes?v查看索引:http://10.31.2.66:9200/_cat/indices?v(logstash收集到日志后才有索引)注释:elasticsearch集群内部通信端口为9300,对外通信端口为9200三、 logstash安装1.安装javalogstash2.0版本需要java7及以上版本的支持,如果系统没有安装java环境,需要先安装。
elk部署文档(离线)
部署elasticsearch# 安装rpm -ivh elasticsearch-6.2.3.rpm#查找安装路径rpm -ql elasticsearch一般是装在/usr/share/elasticsearch/下。
设置data的目录# 创建/data/es-data目录,用于elasticsearch数据的存放mkdir -p /data/es-data# 修改该目录的拥有者为elasticsearchchown -R elasticsearch:elasticsearch /data/es-data设置log的目录# 创建/data/es-log目录,用于elasticsearch日志的存放mkdir -p /log/es-log# 修改该目录的拥有者为elasticsearchchown -R elasticsearch:elasticsearch /log/es-log修改配置文件elasticsearch.ymlvim /etc/elasticsearch/elasticsearch.yml根据下面的内容进行修改,wq保存。
#设置data存放的路径为/data/es-datapath.data: /data/es-data#设置logs日志的路径为/log/es-logpath.logs: /log/es-log#设置内存不使用交换分区bootstrap.memory_lock: false#配置了bootstrap.memory_lock为true时反而会引发9200不会被监听,原因不明#设置允许所有ip可以连接该elasticsearchnetwork.host: 0.0.0.0#开启监听的端口为9200http.port: 9200#增加新的参数,为了让elasticsearch-head插件可以访问es (5.x版本,如果没有可以自己手动加)http.cors.enabled: truehttp.cors.allow-origin: "*"3.5 启动elasticsearch# 启动systemctl start elasticsearch# 查看状态systemctl status elasticsearch# 设置开机启动systemctl enable elasticsearch3.6 开启9200端口firewall-cmd --add-port=9200/tcp --permanentfirewall-cmd --reload3.7 测试安装是否成功# 检查9200是否有监听netstat -antp |grep 9200curl http://127.0.0.1:9200有下面类似的内容才说明elasticsearch正常启动。
ELK环境的搭建
防火墙的配置#service iptbales stop#vim /etc/sysconfig/iptables1.-A INPUT -m state --state NEW -m tcp -p tcp --dport 80 -j ACCEPT2.-A INPUT -m state --state NEW -m tcp -p tcp --dport 9200 -j ACCEPT3.-A INPUT -m state --state NEW -m tcp -p tcp --dport 9292 -j ACCEPT安装JDK1.# yum -y install java-1.7.0-openjdk*2.# java -version安装Elastic Ssarch下载Elastic Ssarch#mkdir /data#wget https:///elasticsearch/elasticsearch/elasticsearch-1.4.2.tar.gz#tar -zxvf elasticsearch-1.4.2.tar.gz -C /usr/local/# ln -s /usr/local/elasticsearch-1.4.2 /usr/local/elasticsearch安装elasticsearch-servicewrapper,并启动ElasticSearch服务:#wgethttps:///elasticsearch/elasticsearch-servicewrapper/archive/master.tar.gz #tar -xzf master.tar.gz#mv elasticsearch-servicewrapper-master/service/ /usr/local/elasticsearch/bin/# /usr/local/elasticsearch/bin/service/elasticsearch start#curl -X GET http://localhost:9200(测试ElasticSearch服务是否正常,预期返回200的状态码)安装Logstash# wget https:///logstash/logstash/logstash-1.4.2.tar.gz # tar -zxvf logstash-1.4.2.tar.gz -C /usr/local/# ln -s /usr/local/logstash-1.4.2 /usr/local/logstash# /usr/local/logstash/bin/logstash -e 'input { stdin { } } output { stdout {} }' (简单测试Logstash服务是否正常,预期可以将输入内容以简单的日志形式打印在界面上)创建配置文件目录: mkdir -p /usr/local/logstash/etc vim/usr/local/logstash/etc/hello_search.conf 输入下面:input {stdin {type => "human"}}output {stdout {codec => rubydebug}elasticsearch {host => "192.168.102.129"port => 9300}}/usr/local/logstash/bin/logstash -f /usr/local/logstash/etc/hello_search.conf 安装Kibana#wget https:///kibana/kibana/kibana-3.1.2.tar.gz# tar -zxvf kibana-3.1.2.tar.gz# mv kibana-3.1.2 /var/www/html/kibana# vim /var/www/html/kibana/config.jselasticsearch: "http://IP:9200",# service httpd start修改ElasticSearch的配置文件,追加一行内容,并重启ElasticSearch服务# vim /usr/local/elasticsearch/config/elasticsearch.ymlhttp.cors.enabled: truehttp.cors.allow-origin: http://192.168.102.129: elasticsearch# /usr/local/elasticsearch/bin/service/elasticsearch restarthttp:// IP /kibana。
ELK部署文档

ELK部署⽂档1. 前⾔在⽇常运维⼯作中,对于系统和业务⽇志的处理尤为重要。
尤其是分布式架构,每个服务都会有很多节点,如果要⼿⼯⼀个⼀个的去取⽇志,运维怕是要累死。
简单介绍:ELK 是 elasticsearch + logstash + kibana 三款开源软件的简称。
elasticsearch:是个开源的分布式搜索引擎,特点是:分布式、配置简单、⾃动发现、索引⾃动分⽚、索引副本机制、restful风格接⼝,多数据源,⾃动搜索负载等logstash:可以对⽇志进⾏收集、滤过、并将其存储在 elasticsearch中kibana:可以为 elasticsearch提供友好的⽤户交互界⾯,⽤户可以通过 kibana来分析、搜索甚⾄绘图来分析数据。
这⾥介绍下⽬前使⽤⽐较多的架构:ELK + filebeatFilebeat 是⼀个轻量级开源⽇志⽂件数据收集器,可以将它安装到需要收集的节点上,它会将⽇志输送到 logstash 或 elasticsearch有了 ELK 就可以将分布到多台的⽇志统⼀规划起来。
⽹络上有很多关于 ELK 的部署⽅案,参考了很多发现要不就是⽼版本的,要不就是不太完善,因此⾃⼰做下记录。
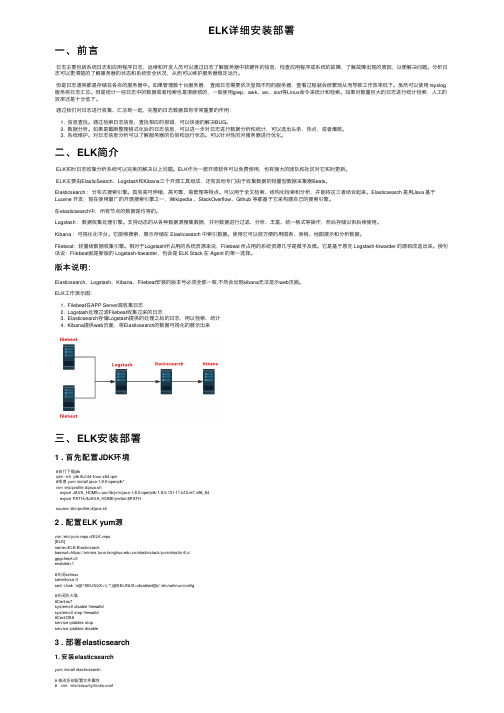
注意:在安装 ELK 的时候,这三个软件的版本必须保持⽀持,否则出现各种bug2. ELK搭建过程实验拓扑图:实验环境主机服务介绍:本次实验是收集 nginx ⽇志,并存储在 elasticsearch中。
将 elasticsearch 和 kibana 安装在同⼀主机上可以避免不必要的⽹络IO操作,直接本机交互。
2.1 Elasticsearch 的安装过程(1)初始化⼯作selinux、firewall 关闭时间同步主机名修改修改打开⽂件最⼤数时间同步:[root@192.168.118.14 ~]#ntpdate 修改主机名:[root@192.168.118.14 ~]#hostnamectl set-hostname node1修改完主机名别忘记在 /etc/hosts 中申明192.168.118.14 node1修改⽂件打开最⼤数:[root@192.168.118.14 ~]#vim /etc/security/limits.conf* soft nproc 655350* hard nproc 655350* soft nofile 655350* hard nofile 655350[root@192.168.118.14 ~]#ulimit -SHn 655350(2)配置 java 环境[root@192.168.118.14 /usr/local/src]#tar xf jdk-8u77-linux-x64.tar.gz -C /usr/local/在 /etc/profile ⽂件中追加JAVA_HOME=/usr/local/jdk1.8.0_77JAVA_BIN=$JAVA_HOME/binPATH=$PATH:$JAVA_BINCLASSPATH=$JAVA_HOME/lib/dt.jar:$JAVA_HOME/lib/tools.jarexport JAVA_HOME JAVA_BIN PATH CLASSPATH[root@192.168.118.14 /usr/local/src]#source /etc/profile[root@192.168.118.14 /usr/local/src]#ln -vs /usr/local/jdk1.8.0_77/bin/java /usr/bin/[root@192.168.118.14 /usr/local/src]#java -versionjava version "1.8.0_77"Java(TM) SE Runtime Environment (build 1.8.0_77-b03)Java HotSpot(TM) 64-Bit Server VM (build 25.77-b03, mixed mode)(3)安装 elasticsearch下载地址:这⾥下载的是 6.8 的 rpm 包直接安装:[root@192.168.118.14 ~/ELK]#yum localinstall elasticsearch-6.8.2.rpm修改配置⽂件如下:[root@192.168.118.14 ~/ELK]#egrep ^[a-z] /etc/elasticsearch/elasticsearch.yml: super-cluster: node1path.data: /var/lib/elasticsearchpath.logs: /var/log/elasticsearchbootstrap.memory_lock: truenetwork.host: 0.0.0.0http.port: 9200discovery.zen.ping.unicast.hosts: ["192.168.118.14"]http.cors.enabled: truehttp.cors.allow-origin: "*"启动[root@192.168.118.14 ~/ELK]#systemctl enable elasticsearch ; systemctl start elasticsearch⾸次启动可能会启动失败,查看⽇志:[root@192.168.118.14 ~/ELK]#tail /var/log/elasticsearch/super-cluster.log…[1]: memory locking requested for elasticsearch process but memory is not locked…如上报错,需要修改启动脚本:[root@192.168.118.14 ~/ELK]#vim /lib/systemd/system/elasticsearch.service在 [Service] 配置段添加:…LimitMEMLOCK=infinity…[root@192.168.118.14 ~/ELK]#systemctl daemon-reload[root@192.168.118.14 ~/ELK]#systemctl start elasticsearch查看端⼝,如果 9200 和 9300 监听,则说明 elasticsearch启动成功。
ELK日志管理系统详细安装和配置

ELK⽇志管理系统详细安装和配置ELK组成ELK由ElasticSearch、Logstash和Kiabana三个开源⼯具组成。
官⽅⽹站:Elasticsearch 是个开源分布式搜索引擎,它的特点有:分布式,零配置,⾃动发现,索引⾃动分⽚,索引副本机制,restful风格接⼝,多数据源,⾃动搜索负载等。
Logstash 是⼀个完全开源的⼯具,他可以对你的⽇志进⾏收集、过滤,并将其存储供以后使⽤(如,搜索)。
Kibana 是⼀个开源和免费的⼯具,它Kibana可以为Logstash 和 ElasticSearch 提供的⽇志分析友好的 Web 界⾯,可以帮助您汇总、分析和搜索重要数据⽇志。
1. 四⼤组件Logstash: logstash server端⽤来搜集⽇志;Elasticsearch: 存储各类⽇志;Kibana: web化接⼝⽤作查寻和可视化⽇志;Logstash Forwarder: logstash client端⽤来通过lumberjack ⽹络协议发送⽇志到logstash server;2. Elasticsearch 简介和安装(ELK的三个组建版本必须保持⼀致)2.1 ElasticSearch是⼀个基于Lucene的搜索服务器。
它提供了⼀个分布式多⽤户能⼒的全⽂搜索引擎,基于RESTful web接⼝。
Elasticsearch是⽤Java开发的,并作为Apache许可条款下的开放源码发布,是当前流⾏的企业级搜索引擎。
设计⽤于中,能够达到实时搜索,稳定,可靠,快速,安装使⽤⽅便。
2.2 从ELK官⽹下载Elasticsearch:下载elasticsearch-6.1.0.tar.gz的tar包后,使⽤ tar -xvf elasticsearch-5.2.1.tar 命令解压,使⽤cd命令进⼊⽂件夹⽬录;启动的时候⼀定要注意,因为es不可以进⾏root账户启动,所以你还需要开启⼀个elsearch账户。
elk安装

安装kafka
$ cat /apps/kafka/config/server.properties
############################# Server Basics #############################
log.segment.bytes=1073741824
log.retention.check.interval.ms=300000
############################# Zookeeper #############################
zookeeper.connect=localhost:2181
$ /apps/kafka/bin/kafka-topics.sh --list --zookeeper localhost:2181
__consumer_offsets
elk-log
elk-log
具体深入kafka需要单独学习了,如果嫌麻烦可以使用Redis比较简单。
-------------------------------------------------------------
compression: gzip
max_message_bytes: 1000000
required_acks: 0
client_id: beats
上述配置表示,Filebeat定期监控:/var/log/nginx/目录下所有以.log结尾的文件,并且将增量日志转发到Kafka集群。filebeat支持file、tcp、udp等输入方式,输出方式支持kafka,file,redis,elasticsearch、logstash等。
ELK详细安装部署
ELK详细安装部署⼀、前⾔⽇志主要包括系统⽇志和应⽤程序⽇志,运维和开发⼈员可以通过⽇志了解服务器中软硬件的信息,检查应⽤程序或系统的故障,了解故障出现的原因,以便解决问题。
分析⽇志可以更清楚的了解服务器的状态和系统安全状况,从⽽可以维护服务器稳定运⾏。
但是⽇志通常都是存储在各⾃的服务器中。
如果管理数⼗台服务器,查阅⽇志需要依次登陆不同的服务器,查看过程就会很繁琐从⽽导致⼯作效率低下。
虽然可以使⽤ rsyslog 服务将⽇志汇总。
但是统计⼀些⽇志中的数据或者检索也是很⿇烦的,⼀般使⽤grep、awk、wc、sort等Linux命令来统计和检索。
如果对数量巨⼤的⽇志进⾏统计检索,⼈⼯的效率还是⼗分低下。
通过我们对⽇志进⾏收集、汇总到⼀起,完整的⽇志数据具有⾮常重要的作⽤:1. 信息查找。
通过检索⽇志信息,查找相应的报错,可以快速的解决BUG。
2. 数据分析。
如果是截断整理格式化后的⽇志信息,可以进⼀步对⽇志进⾏数据分析和统计,可以选出头条,热点,或者爆款。
3. 系统维护。
对⽇志信息分析可以了解服务器的负荷和运⾏状态。
可以针对性的对服务器进⾏优化。
⼆、ELK简介ELK实时⽇志收集分析系统可以完美的解决以上问题。
ELK作为⼀款开源软件可以免费使⽤,也有强⼤的团队和社区对它实时更新。
ELK主要由ElasticSearch、Logstash和Kibana三个开源⼯具组成,还有其他专门由于收集数据的轻量型数据采集器Beats。
Elasticsearch :分布式搜索引擎。
具有⾼可伸缩、⾼可靠、易管理等特点。
可以⽤于全⽂检索、结构化检索和分析,并能将这三者结合起来。
Elasticsearch 是⽤Java 基于Lucene 开发,现在使⽤最⼴的开源搜索引擎之⼀,Wikipedia 、StackOverflow、Github 等都基于它来构建⾃⼰的搜索引擎。
在elasticsearch中,所有节点的数据是均等的。
ELK平台安装部署
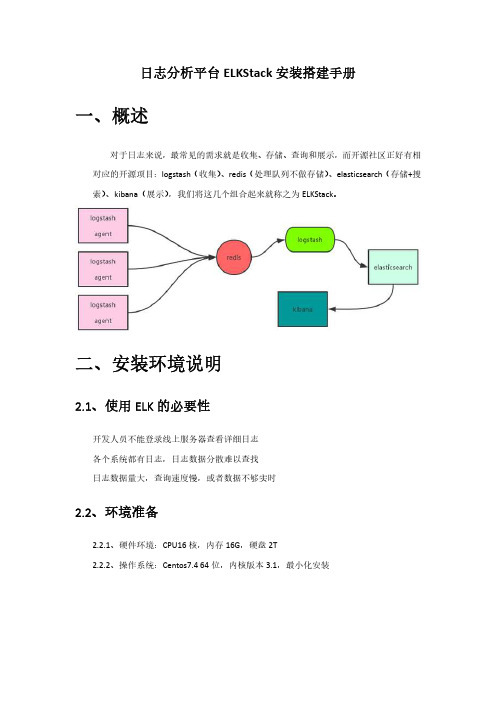
日志分析平台ELKStack安装搭建手册一、概述对于日志来说,最常见的需求就是收集、存储、查询和展示,而开源社区正好有相对应的开源项目:logstash(收集)、redis(处理队列不做存储)、elasticsearch(存储+搜索)、kibana(展示),我们将这几个组合起来就称之为ELKStack。
二、安装环境说明2.1、使用ELK的必要性开发人员不能登录线上服务器查看详细日志各个系统都有日志,日志数据分散难以查找日志数据量大,查询速度慢,或者数据不够实时2.2、环境准备2.2.1、硬件环境:CPU16核,内存16G,硬盘2T2.2.2、操作系统:Centos7.4 64位,内核版本3.1,最小化安装三、部署3.1、安装java环境从官网下载jdk1.8源码包,解压到相应的文件夹,修改变量,这里就不介绍了,如果不会可以去网上搜索,很简单,java安装完成之后使用“java -version”查看是否安装成功。
3.2、安装logstash组件3.2.1、将下载好的源码包解压到“/usr/local/elk”目录。
3.2.2、解压好之后直接运行“/usr/local/elk/logstash-5.6.0/bin/logstash –e “””,这是一个标准化输入和输出测试,如果出现下图中的内容说明测试成功。
3.2.3、直接复制logstash-5.6.0目录两份,分别改名为logstash-5.6.0_syslog_to_redis,logstash-5.6.0_redis_to_es这两个目录分别在运行logstash时要分开,因为后面会有两个配置文件要同时运行。
3.2.4、标准配置文件模板如下,可以参考,如果需要加入过滤器、字段匹配等等需要另外安装插件,并写入相应的配置文件。
3.2.4.1、syslog-to-redis配置模板,这个不需要怎么修改。
3.2.4.2、redis-to-es配置模板,过滤器、字段匹配等插件配置可以直接往里面写。
Elasticsearch5.0.0版本部署手册

Elasticsearch5.0.0版本部署⼿册Elasticsearch 5.0.0版本部署⼿册1.Elasticsearch5.0.0版本不⽀持root⽤户启动,之前版本设置-Des.insecure.allow.root=true失效,必须修改es源码并且重新编译才能设置root启动【解决⽅案:groupadd esearchuseradd esearch -g esearch -p elasticsearch2.在⾮root⽤户下启动Elasticsearch5.0.0报错java.io.FileNotFoundException,⽇志⽂件Permission Denied解决⽅案:chown ${user} -R ${path} 使⽤chown命令将path路径下的es⽬录的⽤户组更改为user3.[Warn] max file descriptors for elasticsearch likely too low,increase to at least [65536]切换到root⽤户下,编辑limits.conf的内容vi /etc/security/limits.conf添加如下内容soft nofile 65536hard nofile 131072soft nproc 2048hard nproc 4096切换到⾮root⽤户4.[Warn] max number of threads [1024] for user [esearch] likely too low,increase to at least [2048]切换到root⽤户下,编辑limits.d⽬录下的配置内容vi /etc/security/limits.d/90-nproc.conf修改 * soft nproc 1024为 * soft nproc 2048切换为⾮root⽤户5.[Warn] max virtual memory areas vm.max_map_count [65530] likely to low,increase to at least [262144]切换到root⽤户下,修改sysctl.confvi /etc/sysctl.conf添加配置:vm.max_map_count=655360执⾏命令:sysctl -p重新启动elasticsearch6.使⽤./elasticsearch命令或者./elasticsearch -d命令成功启动elasticsearch后,web浏览器访问http://IP:9200端⼝失败修改./config/elasticsearch.yml配置⽂件network.host: 192.168.76.89重启elasticsearch即可7.elasticsearch⽆法使⽤elasticsearch-plugin命令安装head插件,我们需要以standalone server的⽅式启动head插件1.安装git命令:yum -y install git2.从github上下载elasticsearch-head的源码:git clone git:///mobz/elasticsearch-head.git3.修改head⽬录权限chmod -R 777 *4.node的安装:head的本质是nodejs⼯程,因此需要安装node,使⽤npm来安装依赖的包(npm相当于maven)yum -y install xz 安装xz命令xz -d node*.tar.xz 解压nodejs安装包tar -xvf node*.tarvim /etc/profile增加Node的环境变量set node environmentexport NODE_HOME=/usr/elk/node-v6.9.1-linux-x64export PATH=$PATH:$NODE_HOME/binsource /etc/profileecho $NODE_HOMEnode -vnpm -v5.安装grunt:grunt是⼀个很⽅便的构建⼯具,可以进⾏打包压缩、测试、执⾏等⼯作,5.0的head插件就是通过grunt启动到elasticsearch-head的⽬录下npm install -g grunt-cli检测grunt是否安装成功grunt -version6.修改head插件源码vim /elasticsearch-head/Gruntfile.jsconnect: { server: { options: { port: 9100, hostname: '*', base: '.', keepalive: true } } }增加hostname属性,设置为*vim /elasticsearch-head/_site/app.js修改head的链接地址this.base_uri = this.config.base_uri || this.prefs.get("app-base_uri") || "";为this.base_uri = this.config.base_uri || this.prefs.get("app-base_uri") || "";7.运⾏head在head的根⽬录下,安装head依赖npm install启动nodejsgrunt server8.安装head插件后,访问9100⽆法正常链接elasticsearch在elasticsearch.yml中增加跨域⽀持,重启es和head插件http.cors.enabled: truehttp.cors.allow-origin: "*"9.启动elasticsearch报错ng.IllegalStateException: failed to obtain node locks 删除elasticsearch/data⽬录下的nodes⽬录10.logstash启动报错:Could not find or load main class org.jruby.Main检查logstash的⽬录下是否存在Gemfile和Gemfile.jruby-1.9.lock⽂件若⽆,重新下载logstash.zip⽂件11.logstash配置⽂件elasticsearch5.x版本不⽀持_ttl的设置,因此要去除logstash模板⽂件中的ttl属性logstash中不⽀持worker的设定【TODO:其他代替设置】。
ELK日志归集 - 搭建及使用说明文档V1

ELK使用指导书文件更改摘要目录1. 背景 (1)2. 架构 (1)3. ELK介绍 (2)4. ELK软件版本 (2)5. kafka、Zookeeper安装配置 (2)6. Filebeat安装配置 (6)7. elasticsearch安装配置 (8)8. logstash安装配置 (12)9. kibana安装配置 (14)1.背景早期在系统规模较小的时期,系统的运维工作主要靠运维人员手工完成,随着业务的急剧膨胀,及服务的多样化,让网络的组建变得越来越复杂,一个系统可能涉及到多个设备,部署多个实例,运维人员手工的去查看定位问题变得困难,效率低效。
设备的增加让跨运维小组之间的沟通代价变得很高,各种日志和告警散落在不同的设备上,如果日志的文件设计不合理,可能还会导致打开日志文件耗时高,甚至失败的结果。
为了解决这些困难,统一日志中心应运而生。
2.架构Elastic Stack 提供Beats 和Logstash 套件来采集任何来源、任何格式的数据。
其实Beats 和Logstash的功能差不多,都能够与Elasticsearch 产生协同作用,而且。
logstash比filebeat功能更强大一点,2个都使用是因为:Beats 是一个轻量级的采集器,支持从边缘机器向Logstash 和Elasticsearch 发送数据。
考虑到Logstash 占用系统资源较多,我们采用Filebeat 来作为我们的日志采集器。
并且这里采用kafka作为传输方式是为了避免堵塞和丢失,以实现日志的实时更新。
3.ELK介绍1.Filebeat:filebat是一个用于转发和集中日志数据的轻量级shipper。
作为代理安装在服务器上,filebeat监视指定的日志文件或位置,收集日志事件,并将它们转发给ElasticSearch或logstash进行索引。
2.Logstash:Logstash 是开源的服务器端数据处理管道,能够同时从多个来源采集数据,转换数据,然后将数据发送到存储库。
ELK环境搭建
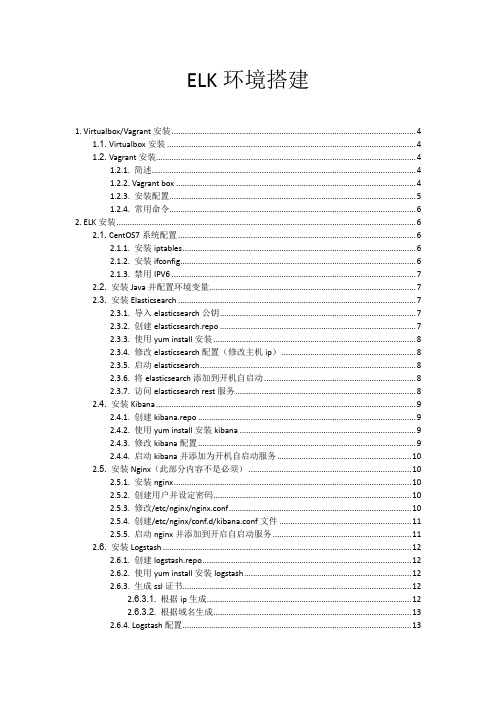
ELK环境搭建1. Virtualbox/Vagrant安装 (4)1.1. Virtualbox安装 (4)1.2. Vagrant安装 (4)1.2.1. 简述 (4)1.2.2. Vagrant box (4)1.2.3. 安装配置 (5)1.2.4. 常用命令 (5)2. ELK安装 (6)2.1. CentOS7系统配置 (6)2.1.1. 安装iptables (6)2.1.2. 安装ifconfig (6)2.1.3. 禁用IPV6 (6)2.2. 安装Java并配置环境变量 (6)2.3. 安装Elasticsearch (7)2.3.1. 导入elasticsearch公钥 (7)2.3.2. 创建elasticsearch.repo (7)2.3.3. 使用yum install安装 (7)2.3.4. 修改elasticsearch配置(修改主机ip) (7)2.3.5. 启动elasticsearch (7)2.3.6. 将elasticsearch添加到开机自启动 (7)2.3.7. 访问elasticsearch rest服务 (7)2.4. 安装Kibana (8)2.4.1. 创建kibana.repo (8)2.4.2. 使用yum install安装kibana (8)2.4.3. 修改kibana配置 (9)2.4.4. 启动kibana并添加为开机自启动服务 (9)2.5. 安装Nginx(此部分内容不是必须) (9)2.5.1. 安装nginx (9)2.5.2. 创建用户并设定密码 (9)2.5.3. 修改/etc/nginx/nginx.conf (9)2.5.4. 创建/etc/nginx/conf.d/kibana.conf文件 (10)2.5.5. 启动nginx并添加到开启自启动服务 (10)2.6. 安装Logstash (11)2.6.1. 创建logstash.repo (11)2.6.2. 使用yum install安装logstash (11)2.6.3. 生成ssl证书 (11)2.6.3.1. 根据ip生成 (11)2.6.3.2. 根据域名生成 (11)2.6.4. Logstash配置 (12)2.6.4.1. Input (12)2.6.4.2. Filter (12)2.6.4.3. Output (12)2.6.5. 测试配置是否正确 (13)2.6.6. 启动logstash并添加为开机自启动服务 (13)2.6.7. 安装Kibana Dashboards (13)2.7. 安装Filebeat (13)2.7.1. 导入elasticsearch公钥 (13)2.7.2. 创建elastic-beats.repo (13)2.7.3. 安装filebeat (14)2.7.4. 配置Filebeat (14)2.7.4.1. 一个简单的配置 (14)2.7.4.1.1. 使用elasticsearch作为输出 (14)2.7.4.1.2. 使用logstash作为输出 (14)2.7.5. load filebeat template (15)2.7.6. 启动filebeat并添加为系统开机自启动服务 (15)2.7.7. 测试filebeat (15)2.7.8. Connect to Kibana (16)2.8. 安装topbeat (17)2.8.1. 导入elasticsearch公钥 (17)2.8.2. 创建elastic-beats.repo (18)2.8.3. 安装topbeat (18)2.8.4. 配置Topbeat (18)2.8.5. load topbeat template (18)2.8.6. 启动topbeat并添加为系统开机自启动服务 (18)2.8.7. 测试topbeat (18)2.8.8. Connect to Kibana (20)2.9. logstash扩展配置 (22)2.9.1. Nginx日志配置 (22)2.9.1.1. Logstash Patterns: Nginx (22)2.9.1.2. Logstash Filter: Nginx (23)2.9.1.3. 重启logstash (23)2.9.1.4. Filebeat Prospector: Nginx (23)2.9.1.5. 重启filebeat (24)2.9.1.6. kibana搜索效果图 (24)2.9.2. Apache HTTP Web Server日志配置 (24)2.9.2.1. Logstash Filter: Apache (24)2.9.2.2. 重启logstash (24)2.9.2.3. Filebeat Prospector: Apache (24)2.9.2.4. 重启filebeat (25)2.9.3. Tomcat日志配置 (25)2.9.3.1. 定义Logstash Patterns: Tomcat (25)2.9.3.2. 定义Logstash Filter: Tomcat (26)2.9.3.3. 重启logstash (26)2.9.3.4. Filebeat Prospector: Tomcat (26)2.9.3.5. 重启filebeat (27)2.9.3.6. kibana搜索效果图 (27)2.9.4. 最终配置 (27)2.10. 使用Kibana查询分析日志 (28)2.11. Elasticsearch插件安装 (32)2.11.1. plugin命令介绍 (32)2.11.2. 安装head插件 (32)2.11.3. 安装bigdesk插件 (35)2.11.4. 安装kopf插件 (37)2.11.5. 插件列表 (37)3. 参考资料 (37)4. 使用Elasticsearch做全文检索 (37)环境:Vagrant 1.8.1CentOS 7.2 192.168.0.228Elasticsearch 2.3.2logstash 2.2.4Kibana 4.4.2filebeat 1.2.2topbeat 1.2.21.Virtualbox/Vagrant安装此部分内容不是必须,已有linux环境可跳过该步骤。
Linux下安装ELK详细教程
Linux下安装ELK详细教程上⼀篇⽂章详细说明了如何在windows下部署ELK,今天我们再详细说说在Linux下如何部署。
本⽂中使⽤的操作系统是Centos7。
什么是ELK?为什么使⽤ELK?在上⽂中已经说过,这⾥就不再赘述,有需要的朋友可以查看,下⾯我们直接进⼊今天的主题。
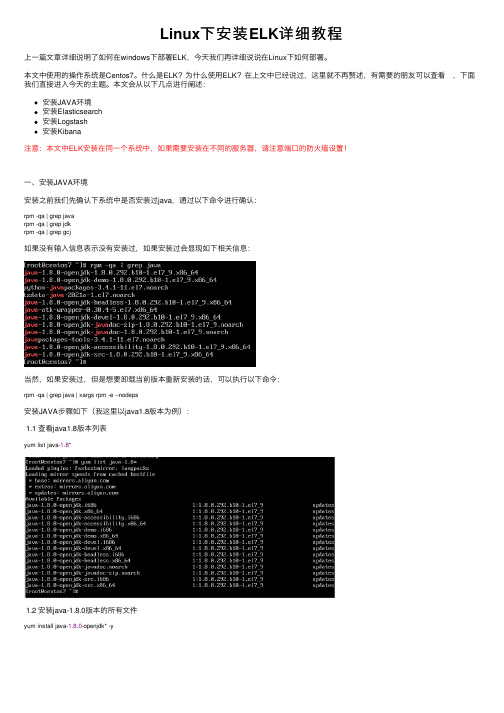
本⽂会从以下⼏点进⾏阐述:安装JAVA环境安装Elasticsearch安装Logstash安装Kibana注意:本⽂中ELK安装在同⼀个系统中,如果需要安装在不同的服务器,请注意端⼝的防⽕墙设置!⼀、安装JAVA环境安装之前我们先确认下系统中是否安装过java,通过以下命令进⾏确认:rpm -qa | grep javarpm -qa | grep jdkrpm -qa | grep gcj如果没有输⼊信息表⽰没有安装过,如果安装过会显现如下相关信息:当然,如果安装过,但是想要卸载当前版本重新安装的话,可以执⾏以下命令:rpm -qa | grep java | xargs rpm -e --nodeps安装JAVA步骤如下(我这⾥以java1.8版本为例):1.1 查看java1.8版本列表yum list java-1.8*1.2 安装java-1.8.0版本的所有⽂件yum install java-1.8.0-openjdk* -y1.3 检查java是否安装成功java -version⼆、安装Elasticsearch2.1 下载安装eswget https://artifacts.elastic.co/downloads/elasticsearch/elasticsearch-7.12.0-x86_64.rpm sudo rpm --install elasticsearch-7.12.0-x86_64.rpm通过以下命令可以查看es的安装路径(正常安装在/usr/share/elasticsearch/)rpm -ql elasticsearch2.2 修改ES数据和⽇志存储路径# 创建⽬录,⽤于存储elasticsearch数据mkdir -p /data/elasticsearch/datadir# 修改⽬录权限chown -R elasticsearch:elasticsearch /data/elasticsearch/datadir# 创建⽇志⽬录mkdir -p /data/elasticsearch/logdir# 修改⽬录权限chown -R elasticsearch:elasticsearch /data/elasticsearch/logdir2.3 修改ES配置⽂件vi /etc/elasticsearch/elasticsearch.yml修改信息如下:# 集群名称,按照⾃⼰的需求调整: my-application# 节点名称: node-1# 设置data存储⽬录path.data: /data/elasticsearch/datadir# 设置logs⽇志的⽬录path.logs: /data/elasticsearch/logdir# 设置内存不使⽤交换分区bootstrap.memory_lock: false# 设置允许所有ip可以连接该elasticsearch,这⾥根据项⽬需求⾃⾏修改network.host: 0.0.0.0# 开启监听的端⼝,默认为9200http.port: 9200discovery.seed_hosts:["127.0.0.1"]cluster.initial_master_nodes: ["node-1"]2.4 启动ES# 启动服务systemctl start elasticsearch# 查看运⾏状态systemctl status elasticsearch# 设置开机启动systemctl enable elasticsearch注意:问题:如果是通过SSH远程登录的服务器,启动ES服务时会报错,原因是部署ES时创建的elasticsearch⽤户默认是禁⽌shell登录的,通过切换⽤户命令可以看到提⽰:this account is currently not avaliable。
Elk实时日志分析平台5.0版本源码安装配置
Elk实时日志分析平台5.0版本源码安装配置ELK5.0版本源码安装过程,水平有限,凑合着看!!最后附上安装包一、配置Java环境变量[plain] view plain copyprint?1.# mkdir /usr/local/java/ –p2.# cd /usr/local/java/3.# tar zxvf /data/elk5.0/jdk-8u111-linux-x64.tar.gz4.5.# cat >>/etc/profile<<EOF6.7.export JAVA_HOME=/usr/local/java/jdk1.8.0_1118.export PATH=$PATH:$JAVA_HOME/bin9.exportCLASSPATH=.:$JAVA_HOME/lib/dt.jar:$JAVA_HOM E/lib/tools.jar10.EOF11.12.# source /etc/profile13.# java -version14.java version "1.8.0_111"15.Java(TM) SE Runtime Environment (build 1.8.0_111-b14)16.Java HotSpot(TM) 64-Bit Server VM (build 25.111-b14, mixedmode)二、安装elasticsearch[plain] view plain copyprint?1.# mkdir /data/PRG/-p2.# cd /data/PRG/3.# tar zxvf /data/elk5.0/elasticsearch-5.0.0.tar.gz4.# mv elasticsearch-5.0.0 elasticsearch5.# useradd elasticsearch -s /sbin/nologin6.# chown elasticsearch. elasticsearch /data/PRG/elasticsea rch/添加启动脚本vi /etc/init.d/elasticsearch[plain] view plain copyprint?1.#!/bin/sh2.#3.# elasticsearch <summary>4.#5.# chkconfig: 2345 80 206.# description: Starts and stops a single elasticsearch insta nce on this system7.#8.9.10.### BEGIN INIT INFO11.# Provides: Elasticsearch12.# Required-Start: $network $named13.# Required-Stop: $network $named14.# Default-Start: 2 3 4 515.# Default-Stop: 0 1 616.# Short-Description: This service manages the elasticsearch daemon17.# Description: Elasticsearch is a very scalable, schema-free and high-performance search solution supporting multi-tenancy and near realtime search.18.### END INIT INFO19.20.21.#22.# init.d / servicectl compatibility (openSUSE)23.#24.if [ -f /etc/rc.status ]; then25.. /etc/rc.status26.rc_reset27.fi28.29.30.#31.# Source function library.32.#33.if [ -f /etc/rc.d/init.d/functions ]; then34.. /etc/rc.d/init.d/functions35.fi36.37.38.39.40.41.42.# Sets the default values for elasticsearch variables us ed in this script43.export JAVA_HOME=/usr/local/java/jdk1.8.0_11144.ES_USER="elasticsearch"45.ES_GROUP="elasticsearch"=elasticsearch47.ES_HOME="/data/PRG/elasticsearch"48.MAX_OPEN_FILES=6553649.MAX_MAP_COUNT=26214450.LOG_DIR="$ES_HOME/log/"51.DATA_DIR="$ES_HOME/lib/"52.CONF_DIR="$ES_HOME/config"53.mkdir -p $LOG_DIR54.chown -R elasticsearch.elasticsearch $ES_HOME55.56.57.PID_DIR="$ES_HOME/log"58.59.60.# Source the default env file61.ES_ENV_FILE="/etc/sysconfig/elasticsearch"62.if [ -f "$ES_ENV_FILE" ]; then63.. "$ES_ENV_FILE"64.fi65.66.67.# CONF_FILE setting was removed68.if [ ! -z "$CONF_FILE" ]; then69.echo "CONF_FILE setting is no longer supported. elasti csearch.yml must be placed in the config directory and cannot be renamed."70.exit 171.fi72.73.74.exec="$ES_HOME/bin/elasticsearch"75.prog="elasticsearch"76.pidfile="$PID_DIR/${prog}.pid"77.78.79.export ES_HEAP_SIZE80.export ES_HEAP_NEWSIZE81.export ES_DIRECT_SIZE82.export ES_JAVA_OPTS83.export ES_GC_LOG_FILE84.export ES_STARTUP_SLEEP_TIME85.export JAVA_HOME86.export ES_INCLUDE87.ulimit -n $MAX_OPEN_FILES88.lockfile=$ES_HOME/log/$prog89.90.91.# backwards compatibility for old config sysconfig file s, pre 0.90.192.if [ -n $USER ] && [ -z $ES_USER ] ; then93.ES_USER=$USER95.96.97.checkJava() {98.if [ -x "$JAVA_HOME/bin/java" ]; then99.JAVA="$JAVA_HOME/bin/java"100.else101.JAVA=`which java`102.fi103.104.105.if [ ! -x "$JAVA" ]; then106.echo "Could not find any executable java binary. Pleas e install java in your PATH or set JAVA_HOME"107.exit 1108.fi109.}110.111.112.start() {113.checkJava114.[ -x $exec ] || exit 5115.if [ -n "$MAX_LOCKED_MEMORY" -a -z "$ES_HEAP_SIZE" ]; then116.echo "MAX_LOCKED_MEMORY is set - ES_HEAP_SIZE must also be set"117.return 7118.fi119.if [ -n "$MAX_OPEN_FILES" ]; then120.ulimit -n $MAX_OPEN_FILES122.if [ -n "$MAX_LOCKED_MEMORY" ]; then123.ulimit -l $MAX_LOCKED_MEMORY124.fi125.if [ -n "$MAX_MAP_COUNT" -a -f /proc/sys/vm/max_map_count ]; then126.sysctl -q -w vm.max_map_count=$MAX_MAP_COUNT127.fi128.export ES_GC_LOG_FILE129.130.131.# Ensure that the PID_DIR exists (it is cleaned at OS st artup time)132.if [ -n "$PID_DIR" ] && [ ! -e "$PID_DIR" ]; then133.mkdir -p "$PID_DIR" && chown "$ES_USER":"$ES_GROUP" "$PID_DIR"134.fi135.if [ -n "$pidfile" ] && [ ! -e "$pidfile" ]; then136.touch "$pidfile" && chown "$ES_USER":"$ES_GROUP" "$pidfile"137.fi138.139.140.cd $ES_HOME141.echo -n $"Starting $prog: "142.# if not running, start it up here, usually something lik e "daemon $exec"143.daemon --user $ES_USER --pidfile $pidfile $exec -p $pidfile -d145.146.#daemon --user $ES_USER --pidfile $pidfile $exec -p $pidfile -d -Des.default.path.home=$ES_HOME -Des.default.path.logs=$LOG_DIR -Des.default.path.data=$DATA_DIR -Des.default.path.conf=$CONF_DIR147.retval=$?148.echo149.[ $retval -eq 0 ] && touch $lockfile150.return $retval151.}152.153.154.stop() {155.echo -n $"Stopping $prog: "156.# stop it here, often "killproc $prog"157.killproc -p $pidfile -d 86400 $prog158.retval=$?159.echo160.[ $retval -eq 0 ] && rm -f $lockfile161.return $retval162.}163.164.165.restart() {166.stop167.start168.}169.171.reload() {172.restart173.}174.175.176.force_reload() {177.restart178.}179.180.181.rh_status() {182.# run checks to determine if the service is running or use generic status183.status -p $pidfile $prog184.}185.186.187.rh_status_q() {188.rh_status >/dev/null 2>&1189.}190.191.192.193.194.case "$1" in195.start)196.rh_status_q && exit 0197.$1198.;;199.stop)200.rh_status_q || exit 0201.$1202.;;203.restart)204.$1205.;;206.reload)207.rh_status_q || exit 7208.$1209.;;210.force-reload)211.force_reload212.;;213.status)214.rh_status215.;;216.condrestart|try-restart)217.rh_status_q || exit 0218.restart219.;;220.*)221.echo $"Usage: $0 {start|stop|status|restart|condrestart| try-restart|reload|force-reload}"222.exit 2223.esac224.exit $?[plain] view plain copyprint?1.# chmod +x /etc/init.d/elasticsearch2.3.# /etc/init.d/elasticsearch start4.5.# /etc/init.d/elasticsearch status6.elasticsearch (pid 20895) is running...7.# netstat -ntlp |grep 9[2-3]008.tcp 0 0 :::9300 :::* LISTEN 20895/java9.tcp 0 0 :::9200 :::* LISTE N 20895/java三、配置elasticsearch内存低于2G,需要修改jvm配置[plain] view plain copyprint?1.# vim /data/PRG/elasticsearch/config/jvm.options2.-Xms512m3.-Xmx512m[plain] view plain copyprint?1.# cat /data/PRG/elasticsearch/config/elasticsearch.yml|gr ep -v '#'work.host: 0.0.0.0 ###开启监听地址,3.action.auto_create_index:.security,.monitoring*,.watches,.triggered_watches,.watcher-history*4.####以下模块视情况是否开启5.xpack.security.enabled: true ####开启用户认证6.xpack.monitoring.enabled: true7.xpack.graph.enabled: true8.xpack.watcher.enabled: true9.xpack.security.authc.realms: ####用户认证模式,ldap、file、pki、ActiveDirectory等10.file1:11.type: file12.order: 0四、安装logstash[plain] view plain copyprint?1.# cd /data/PRG/2.# tar zxvf /data/elk5.0/logstash-5.0.0.tar.gz3.# mv logstash-5.0.0 logstash4.# useradd logstash -s /sbin/nologin5.# chown logstash. logstash /data/PRG/logstash添加启动脚本vim /etc/init.d/logstash[plain] view plain copyprint?1.#!/bin/sh2.# Init script for logstash3.# Maintained by Elasticsearch4.# Generated by pleaserun.5.# Implemented based on LSB Core 3.1:6.# * Sections: 20.2, 20.37.#8.### BEGIN INIT INFO9.# Provides: logstash10.# Required-Start: $remote_fs $syslog11.# Required-Stop: $remote_fs $syslog12.# Default-Start: 2 3 4 513.# Default-Stop: 0 1 614.# Short-Description:15.# Description: Starts Logstash as a daemon.16.### END INIT INFO17.18.PATH=/sbin:/usr/sbin:/bin:/usr/bin:/data/PRG/logstas h/bin19.export PATH20.21.if [ `id -u` -ne 0 ]; then22.echo "You need root privileges to run this script"23.exit 124.fi25.=logstash27.28.LS_USER=logstash29.LS_GROUP=logstash30.LS_HOME=/data/PRG/logstash31.LS_HEAP_SIZE="1g"32.LS_LOG_DIR=/data/PRG/logstash/logs33.LS_LOG_FILE="${LS_LOG_DIR}/$name.log"34.pidfile="${LS_LOG_DIR}/$name.pid"35.LS_CONF_DIR=/data/PRG/logstash/conf.d36.LS_OPEN_FILES=1638437.LS_NICE=1938.KILL_ON_STOP_TIMEOUT=${KILL_ON_STOP_TIMEOUT-0} #default value is zero to this variable but could be updated b y user request39.LS_OPTS=""40.41.42.[ -r /etc/default/$name ] && . /etc/default/$name43.[ -r /etc/sysconfig/$name ] && . /etc/sysconfig/$name44.45.program=$LS_HOME/bin/logstash46.args=" -f ${LS_CONF_DIR} -l ${LS_LOG_FILE} ${LS_OPTS}"47.48.quiet() {49."$@" > /dev/null 2>&150.return $?51.}52.53.start() {54.55.LS_JAVA_OPTS="${LS_JAVA_OPTS} -Djava.io.tmpdir=${LS_HOME}"56.HOME=${LS_HOME}57.export PATH HOME LS_HEAP_SIZE LS_JAVA_OPTS LS_U SE_GC_LOGGING LS_GC_LOG_FILE58.59.# chown doesn't grab the suplimental groups when se tting the user:group - so we have to do it for it.60.# Boy, I hope we're root here.61.SGROUPS=$(id -Gn "$LS_USER" | tr " " "," | sed 's/,$//'; echo '')62.63.if [ ! -z $SGROUPS ]64.then65.EXTRA_GROUPS="--groups $SGROUPS"66.fi67.68.# set ulimit as (root, presumably) first, before we drop privileges69.ulimit -n ${LS_OPEN_FILES}70.71.# Run the program!72.nice -n ${LS_NICE} chroot --userspec $LS_USER:$LS_GROUP $EXTRA_GROUPS / sh -c "73.cd $LS_HOME74.ulimit -n ${LS_OPEN_FILES}75.$program $args > ${LS_LOG_DIR}/$name.stdout" 2> " ${LS_LOG_DIR}/$name.err" &76.77.# Generate the pidfile from here. If we instead made t he forked process78.# generate it there will be a race condition between the pidfile writing79.# and a process possibly asking for status.80.echo $! > $pidfile81.82.echo "$name started."83.return 084.}85.86.stop() {87.# Try a few times to kill TERM the program88.if status ; then89.pid=`cat "$pidfile"`90.echo "Killing $name (pid $pid) with SIGTERM"91.ps -ef |grep $pid |grep -v 'grep' |awk '{print $2}' | xargs kill -992.# Wait for it to exit.93.for i in 1 2 3 4 5 6 7 8 9 ; do94.echo "Waiting $name (pid $pid) to die..."95.status || break96.sleep 197.done98.if status ; then99.if [ $KILL_ON_STOP_TIMEOUT -eq 1 ] ; then100.echo "Timeout reached. Killing $name (pid $pid) with SIGKILL. This may result in data loss."101.kill -KILL $pid102.echo "$name killed with SIGKILL."103.else104.echo "$name stop failed; still running."105.return 1 # stop timed out and not forced106.fi107.else108.echo "$name stopped."109.fi110.fi111.}112.113.status() {114.if [ -f "$pidfile" ] ; then115.pid=`cat "$pidfile"`116.if kill -0 $pid > /dev/null 2> /dev/null ; then117.# process by this pid is running.118.# It may not be our pid, but that's what you get with j ust pidfiles.119.# TODO(sissel): Check if this process seems to be the s ame as the one we120.# expect. It'd be nice to use flock here, but flock uses f ork, not exec,121.# so it makes it quite awkward to use in this case.122.return 0123.else124.return 2 # program is dead but pid file exists125.fi126.else127.return 3 # program is not running128.fi129.}130.131.configtest() {132.# Check if a config file exists133.if [ ! "$(ls -A ${LS_CONF_DIR}/* 2> /dev/null)" ]; then 134.echo "There aren't any configuration files in ${LS_CON F_DIR}"135.return 1136.fi137.138.HOME=${LS_HOME}139.export PATH HOME140.141.test_args="-t -f ${LS_CONF_DIR} ${LS_OPTS} "142.$program ${test_args}143.[ $? -eq 0 ] && return 0144.# Program not configured145.return 6146.}147.148.case "$1" in149.start)150.status151.code=$?152.if [ $code -eq 0 ]; then153.echo "$name is already running"154.else155.start156.code=$?157.fi158.exit $code159.;;160.stop) stop ;;161.force-stop) force_stop ;;162.status)163.status164.code=$?165.if [ $code -eq 0 ] ; then166.echo "$name is running"167.else168.echo "$name is not running"169.fi170.exit $code171.;;172.reload) reload ;;173.restart)174.stop && start175.;;176.check)177.configtest178.exit $?179.;;180.*)181.echo "Usage: $SCRIPTNAME {start|stop|status|restart|c heck}" >&2182.exit 3183.;;184.esac185.186.exit $?[plain] view plain copyprint?1.# chmod +x /etc/init.d/logstash2.# /etc/init.d/logstash start3.# /etc/init.d/logstash status4.logstash is running5.6.# netstat -ntlp|grep 96007.tcp 0 0 :::9600 :::* LISTE N 10141/java五、配置logstash# cat /data/PRG/logstash/config/logstash.yml |grep -v '#' http.host: "0.0.0.0" ###开启监听地址ngin日志收集[plain] view plain copyprint?1.# cat /data/PRG/logstash/conf.d/filter.conf2.input {3.beats {4.port => 102005.}6.}7.8.filter {9.grok {10.match=> {11.message => "%{IPORHOST:remote_addr} ,, %{IPORHOST:http_host} , \"%{WORD:http_verb}(?:%{PATH: baseurl}\?%{NOTSPACE:params}|%{DATA:raw_http_request})\" , %{NUMBER:http_status_code}, %{NUMBER:bytes_read} , %{QS:re ferrer} , %{QS:agent} ,\"%{IPORHOST:client_ip}, %{IPORHOST:pro xy_server}\" , - , - , - ,%{IPORHOST:server_ip} , %{BASE10NUM:re quest_duration}"12.}13.14.match=> {15.message => "%{IPORHOST:remote_addr} ,, %{IPORHOST:http_host} , \"%{WORD:http_verb}(?:%{PATH: baseurl}\?%{NOTSPACE:params}|%{DATA:raw_http_request})\" , %{NUMBER:http_status_code}, %{NUMBER:bytes_read} , %{QUO TEDSTRING:referrer} , %{QS:agent} ,\"%{IPORHOST:client_ip}, %{I PORHOST:proxy_server}\" ,%{IPORHOST}:%{INT} , %{INT} , %{BA SE10NUM} , %{IPORHOST} ,%{BASE10NUM:request_duration}"16.}17.}18.19.}20.output {21.elasticsearch {22.hosts =>["192.168.62.200:9200"]23.index =>"operation-%{+YYYY.MM.dd}"24.document_type=> "nginx2"er => 'admin' #### elasticsearch的用户名,用X-PACK插件创建26.password =>'kbsonlong' #### elasticsearch的用户名27.}28.stdout { codec =>rubydebug }29.}六、安装kibana[plain] view plain copyprint?1.# cd /data/PRG/2.# tar zxvf /data/elk5.0/kibana-5.0.0-linux-x86_64.tar.gz3.# mv kibana-5.0.0-linux-x86_64 kibana4.# useradd kibana –s /sbin/nologin5.# chown kibana. kibana /data/PRG/kibana添加启动脚本# vim /etc/init.d/kibana[plain] view plain copyprint?1.#!/bin/sh2.# Init script for kibana3.# Maintained by4.# Generated by pleaserun.5.# Implemented based on LSB Core 3.1:6.# * Sections: 20.2, 20.38.### BEGIN INIT INFO9.# Provides: kibana10.# Required-Start: $remote_fs $syslog11.# Required-Stop: $remote_fs $syslog12.# Default-Start: 2 3 4 513.# Default-Stop: 0 1 614.# Short-Description:15.# Description: Kibana16.### END INIT INFO17.18.PATH=/sbin:/usr/sbin:/bin:/usr/bin19.export PATH20.21.KIBANA_HOME=/data/PRG/kibana=kibana23.program=$KIBANA_HOME/bin/kibana24.args=''25.pidfile="$KIBANA_HOME/logs/$name.pid"26.LOG_HOME="$KIBANA_HOME/logs"27.28.[ -r /etc/default/$name ] && . /etc/default/$name29.[ -r /etc/sysconfig/$name ] && . /etc/sysconfig/$name30.31.[ -z "$nice" ] && nice=032.33.trace() {34.logger -t "/etc/init.d/kibana" "$@"35.}37.emit() {38.trace "$@"39.echo "$@"40.}41.42.start() {43.44.# Ensure the log directory is setup correctly.45.[ ! -d "$LOG_HOME" ] && mkdir "$LOG_HOME"46.chmod 755 "$LOG_HOME"47.48.49.# Setup any environmental stuff beforehand50.51.52.# Run the program!53.54.#chroot --userspec "$user":"$group" "$chroot" sh -c "55.56.$program $args >> $LOG_HOME/kibana.stdout 2>> $ LOG_HOME/kibana.stderr &57.58.# Generate the pidfile from here. If we instead made t he forked process59.# generate it there will be a race condition between the pidfile writing60.# and a process possibly asking for status.61.echo $! > $pidfile63.emit "$name started"64.return 065.}66.67.stop() {68.# Try a few times to kill TERM the program69.if status ; then70.pid=$(cat "$pidfile")71.echo "Killing $name (pid $pid) with SIGTERM"72.ps -ef |grep $pid |grep -v 'grep' |awk '{print $2}' | xargs kill -973.# Wait for it to exit.74.for i in 1 2 3 4 5 ; do75.trace "Waiting $name (pid $pid) to die..."76.status || break77.sleep 178.done79.if status ; then80.if [ "$KILL_ON_STOP_TIMEOUT" -eq 1 ] ; then81.trace "Timeout reached. Killing $name (pid $pid) with SIGKILL. This may result in data loss."82.kill -KILL $pid83.emit "$name killed with SIGKILL."84.else85.emit "$name stop failed; still running."86.fi87.else88.emit "$name stopped."89.fi91.}92.93.status() {94.if [ -f "$pidfile" ] ; then95.pid=$(cat "$pidfile")96.if ps -p $pid > /dev/null 2> /dev/null ; then97.# process by this pid is running.98.# It may not be our pid, but that's what you get with j ust pidfiles.99.# TODO(sissel): Check if this process seems to be the s ame as the one we100.# expect. It'd be nice to use flock here, but flock uses f ork, not exec,101.# so it makes it quite awkward to use in this case.102.return 0103.else104.return 2 # program is dead but pid file exists105.fi106.else107.return 3 # program is not running108.fi109.}110.111.112.113.114.case "$1" in115.force-start|start|stop|status|restart)116.trace "Attempting '$1' on kibana"118.esac119.120.case "$1" in121.force-start)122.PRESTART=no123.exec "$0" start124.;;125.start)126.status127.code=$?128.if [ $code -eq 0 ]; then129.emit "$name is already running" 130.exit $code131.else132.start133.exit $?134.fi135.;;136.stop) stop ;;137.status)138.status139.code=$?140.if [ $code -eq 0 ] ; then141.emit "$name is running" 142.else143.emit "$name is not running" 144.fi145.exit $code146.;;147.restart)148.149.stop && start150.;;151.*)152.echo "Usage: $SCRIPTNAME {start|force-start|stop|force-start|force-stop|status|restart}" >&2 153.exit 3154.;;155.esac156.157.exit $?[plain] view plain copyprint?1.# chmod +x /etc/init.d/kibana2.# /etc/init.d/kibana start3.# /etc/init.d/kibana status4.# netstat -ntlp |grep 56015.tcp 0 0 0.0.0.0:5601 0.0.0.0:* L ISTEN 13052/node6.七、配置kibana[plain] view plain copyprint?1.# cat /data/PRG/kibana/config/kibana.yml |grep -v '#'2.server.host: "0.0.0.0"3.4.####以下模块视情况是否开启5.xpack.security.enabled: true6.xpack.monitoring.enabled: true7.xpack.graph.enabled: true8.xpack.reporting.enabled: true八、x-pack插件安装# /data/PRG/kibana/bin/kibana-plugin install file:///root/x-pack-5.0.0.zip# /data/PRG/elasticsearch/bin/elasticsearch-plugin install file:///root/x-pack-5.0.0.zip离线安装x-pack要修改用户脚本,默认创建用户配置文件在/etc/elasticsearch/x-pack目录# vim /data/PRG/elasticsearch/bin/x-pack/users否则在创建用户的时候提示/etc/elasticsearch/x-pack/users…tmp不存在# mkdir /etc/elasticsearch/x-pack/# chown elasticsearch. elasticsearch /etc/elasticsearch/x-pack/-R九、 x-pack管理用户1、添加用户[plain] view plain copyprint?1.# cd /data/PRG/elasticsearch2.# bin/x-pack/users useradd admin -p kbsonlong -rsuperuser2、查看用户[plain] view plain copyprint?1.# /data/PRG/elasticsearch/bin/x-pack/users list2.admin :superuser3.test : - ###创建用户时没有添加-r参数,所以没有用户角色3、测试用户登录[plain] view plain copyprint?1.# curl http://localhost:9200/_xpack/ --useradmin:kbsonlong2.{"build":{"hash":"7763f8e","date":"2016-10-26T04:51:59.202Z"},"license":{"uid":"06a82587-66ac-4d4a-90c4-857d9ca7f3bc","type":"trial","mode":"trial","status":"active","expiry_date_in_millis":1483753731066},"features":{"graph":{"descripti on":"GraphData Exploration for the ElasticStack","available":true, "enabled":true},"monitoring":{"description":"Monitoringfor the E lasticStack","available":true,"enabled":true},"security":{"descripti on":"Securityfor the ElasticStack","available":true,"enabled":true}, "watcher":{"description":"Alerting,Notification and Automation f or the ElasticStack","available":true,"enabled":true}},"tagline":"Yo uknow, for X"}4、删除用户[plain] view plain copyprint?1.# /data/PRG/elasticsearch/bin/x-pack/users userdel test2.3.# /data/PRG/elasticsearch/bin/x-pack/users list4.admin :superuser十、安装filebeat[plain] view plain copyprint?1.# cd /data/PRG2.# tar zxvf / data/elk5.0/filebeat-5.0.0-linux-x86_64.tar.gz3.# mv filebeat-5.0.0-linux-x86_64 filebeat配置启动脚本# vim /etc/init.d/filebeat[plain] view plain copyprint?1.#!/bin/bash2.#3.# filebeat filebeat shipper4.#5.# chkconfig: 2345 98 026.#7.8.### BEGIN INIT INFO9.# Provides: filebeat10.# Required-Start: $local_fs $network $syslog11.# Required-Stop: $local_fs $network $syslog12.# Default-Start: 2 3 4 513.# Default-Stop: 0 1 614.# Short-Description: Sends log files to Logstash or directly to Elasticsear ch.15.# Description: filebeat is a shipper part of the Elast ic Beats16.# family. Please see: /products/beats17.### END INIT INFO18.19.20.21.PATH=/usr/bin:/sbin:/bin:/usr/sbin22.export PATH23.24.[ -f /etc/sysconfig/filebeat ] && . /etc/sysconfig/filebeat25.pidfile=${PIDFILE-/data/PRG/filebeat/filebeat.pid}26.agent=${PB_AGENT-/data/PRG/filebeat/filebeat}27.args="-c /data/PRG/filebeat/filebeat.yml"28.test_args="-e -configtest"29.wrapper="filebeat-god"30.wrapperopts="-r / -n -p $pidfile"31.RETVAL=032.33.# Source function library.34.. /etc/rc.d/init.d/functions35.36.# Determine if we can use the -p option to daemon, killproc, and status.37.# RHEL < 5 can't.38.if status | grep -q -- '-p' 2>/dev/null; then39.daemonopts="--pidfile $pidfile"40.pidopts="-p $pidfile"41.fi42.43.test() {44.$agent $args $test_args45.}46.47.start() {48.echo -n $"Starting filebeat: "49.test50.if [ $? -ne 0 ]; then51.echo52.exit 153.fi54.daemon $daemonopts $wrapper $wrapperopts -- $agent $args55.RETVAL=$?56.echo57.return $RETVAL58.}59.60.stop() {61.echo -n $"Stopping filebeat: "62.killproc $pidopts $wrapper63.RETVAL=$?64.echo65.[ $RETVAL = 0 ] && rm -f ${pidfile}66.}67.68.restart() {69.test70.if [ $? -ne 0 ]; then71.return 172.fi73.stop74.start75.}76.77.rh_status() {78.status $pidopts $wrapper79.RETVAL=$?80.return $RETVAL81.}82.83.rh_status_q() {84.rh_status >/dev/null 2>&185.}86.87.case "$1" in88.start)89.start90.;;91.stop)92.stop93.;;94.restart)95.restart96.;;97.condrestart|try-restart)98.rh_status_q || exit 099.restart100.;;101.status)102.rh_status103.;;104.*)105.echo $"Usage: $0 {start|stop|status|restart|condrestart} "106.exit 1107.esac108.109.exit $RETVAL配置filebeat[plain] view plain copyprint?1.# cat filebeat/filebeat.yml |grep -v '#'2.filebeat.prospectors:3.- input_type: log4.5.paths:6.-/tmp/nginx.log7.output.logstash:8.enabled: true9.hosts: ["localhost:10200"]启动filebeat[plain] view plain copyprint?1.# /etc/init.d/filebeat5 start2.Starting filebeat: 2016/12/0807:18:37.177631 beat.go:264 : INFO Home path: [/data/PRG/filebeat] Config path:[/data/PRG/ filebeat] Data path: [/data/PRG/filebeat/data] Logs path:[/data/ PRG/filebeat/logs]3.2016/12/08 07:18:37.177681 beat.go:174:INFO Setup Bea t: filebeat; Version: 5.0.04.2016/12/08 07:18:37.177760 logstash.go:90:INFO Max Re tries set to: 35.2016/12/08 07:18:37.177828 outputs.go:106:INFO Activat ed logstash as output plugin.6.2016/12/08 07:18:37.177912 publish.go:291:INFO Publish er name: operation7.2016/12/08 07:18:37.178158 async.go:63:INFO Flush Inter val set to: 1s8.2016/12/08 07:18:37.178170 async.go:64:INFO Max Bulk Size set to: 20489.Config OK10.[ OK ]11.12.# /etc/init.d/filebeat5 status13.filebeat-god (pid 7365) is running...14.15.# ps -ef |grep filebeat16.root 7405 1 0 15:18 pts/1 00:00:00 filebeat-god -r / -n -p/data/PRG/filebeat/filebeat.pid -- /data/PRG/filebeat/filebeat -c/data/PRG/filebeat/filebeat.yml17.root 7406 7405 0 15:18 pts/1 00:00:00 /data/PRG /filebeat/filebeat -c/data/PRG/filebeat/filebeat.yml附上安装源码包,包括x-pack、beat等百度云盘/s/1skT4zCx相关文章推荐•· 18.ELK实时日志分析平台之Elasticsearch安装配置•· 22.ELK实时日志分析平台之Logstash安装•· 24.ELK实时日志分析平台之Filebeat介绍及安装方法。
ELK完整搭建流程(小白入门记)
zk ... group_id => 'test-group-id'# —— ~
topic_id topic_id => 'test-topic-id'# ——
topic_id
consumer_threads => 2 # —— kafka partitions
auto_offset_reset => 'smallest' } } filter{# ——
ELK
ELK
~
~ELK
ELK Elasticsearch Logstash Kibana
kibana
~ kafka zookeeper zookeeper
First things first,
Two,
download
bin
logstash .
kafka elasticsearch
kibana
OK
Three, logstash
kibana ruby{# ——ruby
message id id name hash
registerFrom:56 regiserFrom loginFrom 56 222 id
——
2016-04-
19 21:38:09,975 [INFO ] er.AppController -
['xx.0.9.1:9200','xx.0.9.2:9200','xx.0.9.3:9200', 'xx.0.9.4:9200', 'xx.0.9.5:9200']# —— hosts ,
ES
ES
ES
ELK生产环境架构及配置

ELK⽣产环境架构及配置⼀、架构环境tomcat+filebeat: 10.14.4.118es+redis+nginx: 10.14.2.191es + logstach +kibana: 10.14.2.192流程:tomcat⽇志 <-- filebeat(收集tomcat⽇志输出到redis) --> redis⼆、客户端配置(tomcat+filebeat) [10.14.4.118]1、filebeat收集tomcat⽇志输出以redis服务器中,filebeat.yml配置⽂件内容如下:# cat /usr/local/filebeat-6.3.2/filebeat.yml###################### Filebeat Configuration Example ########################## This file is an example configuration file highlighting only the most common# options. The filebeat.reference.yml file from the same directory contains all the# supported options with more comments. You can use it as a reference.## You can find the full configuration reference here:# https://www.elastic.co/guide/en/beats/filebeat/index.html# For more available modules and options, please see the filebeat.reference.yml sample# configuration file.#=========================== Filebeat inputs =============================filebeat.inputs:# Each - is an input. Most options can be set at the input level, so# you can use different inputs for various configurations.# Below are the input specific configurations.- type: log# Change to true to enable this input configuration.enabled: true# Paths that should be crawled and fetched. Glob based paths.paths:- /data/srpcn/tomcat-api/logs/catalina.*.outtags: ["api-catalina"]#- c:\programdata\elasticsearch\logs\*# Exclude lines. A list of regular expressions to match. It drops the lines that are# matching any regular expression from the list.#exclude_lines: ['^DBG']# Include lines. A list of regular expressions to match. It exports the lines that are# matching any regular expression from the list.#include_lines: ['^ERR', '^WARN']# Exclude files. A list of regular expressions to match. Filebeat drops the files that# are matching any regular expression from the list. By default, no files are dropped.#exclude_files: ['.gz$']# Optional additional fields. These fields can be freely picked# to add additional information to the crawled log files for filtering#fields:# level: debug# review: 1### Multiline options# Mutiline can be used for log messages spanning multiple lines. This is common# for Java Stack Traces or C-Line Continuation# The regexp Pattern that has to be matched. The example pattern matches all lines starting with [# Defines if the pattern set under pattern should be negated or not. Default is false.multiline.negate: true# Match can be set to "after" or "before". It is used to define if lines should be append to a pattern# that was (not) matched before or after or as long as a pattern is not matched based on negate.# Note: After is the equivalent to previous and before is the equivalent to to next in Logstashmultiline.match: after- type: logpaths:- /data/srpcn/tomcat-h5/logs/catalina.*.outtags: ["h5-catalina"]multiline.pattern: '^[0-9]{4}-[0-9]{2}-[0-9]{2}'multiline.negate: truemultiline.match: aftertail_file: true#============================= Filebeat modules =============================== filebeat.config.modules:# Glob pattern for configuration loadingpath: ${path.config}/modules.d/*.yml# Set to true to enable config reloadingreload.enabled: false# Period on which files under path should be checked for changes#reload.period: 10s#==================== Elasticsearch template setting ========================== setup.template.settings:index.number_of_shards: 3#index.codec: best_compression#_source.enabled: false#================================ General ===================================== # The name of the shipper that publishes the network data. It can be used to group# all the transactions sent by a single shipper in the web interface.#name:# The tags of the shipper are included in their own field with each# transaction published.#tags: ["service-X", "web-tier"]# Optional fields that you can specify to add additional information to the# output.#fields:# env: staging#============================== Dashboards ===================================== # These settings control loading the sample dashboards to the Kibana index. Loading# the dashboards is disabled by default and can be enabled either by setting the# options here, or by using the `-setup` CLI flag or the `setup` command.#setup.dashboards.enabled: false# The URL from where to download the dashboards archive. By default this URL# has a value which is computed based on the Beat name and version. For released# versions, this URL points to the dashboard archive on the artifacts.elastic.co# website.#setup.dashboards.url:#============================== Kibana =====================================# Starting with Beats version 6.0.0, the dashboards are loaded via the Kibana API.# This requires a Kibana endpoint configuration.setup.kibana:# Kibana Host# Scheme and port can be left out and will be set to the default (http and 5601)# In case you specify and additional path, the scheme is required: http://localhost:5601/path# IPv6 addresses should always be defined as: https://[2001:db8::1]:5601#host: "localhost:5601"#============================= Elastic Cloud ==================================# These settings simplify using filebeat with the Elastic Cloud (https://cloud.elastic.co/).# The cloud.id setting overwrites the `output.elasticsearch.hosts` and#cloud.id:# The cloud.auth setting overwrites the `ername` and# `output.elasticsearch.password` settings. The format is `<user>:<pass>`.#cloud.auth:#================================ Outputs ===================================== # Configure what output to use when sending the data collected by the beat.#-------------------------- Elasticsearch output ------------------------------output.redis:# Array of hosts to connect to.hosts: ["10.14.2.191:6379"]key: iau-10.14.4.118# Optional protocol and basic auth credentials.#protocol: "https"#username: "elastic"#password: "changeme"#----------------------------- Logstash output --------------------------------#output.logstash:# The Logstash hosts#hosts: ["localhost:5044"]# Optional SSL. By default is off.# List of root certificates for HTTPS server verifications#ssl.certificate_authorities: ["/etc/pki/root/ca.pem"]# Certificate for SSL client authentication#ssl.certificate: "/etc/pki/client/cert.pem"# Client Certificate Key#ssl.key: "/etc/pki/client/cert.key"#================================ Logging ===================================== # Sets log level. The default log level is info.# Available log levels are: error, warning, info, debug#logging.level: debug# At debug level, you can selectively enable logging only for some components.# To enable all selectors use ["*"]. Examples of other selectors are "beat",# "publish", "service".#logging.selectors: ["*"]#============================== Xpack Monitoring =============================== # filebeat can export internal metrics to a central Elasticsearch monitoring# cluster. This requires xpack monitoring to be enabled in Elasticsearch. The# reporting is disabled by default.# Set to true to enable the monitoring reporter.#xpack.monitoring.enabled: false# Uncomment to send the metrics to Elasticsearch. Most settings from the# Elasticsearch output are accepted here as well. Any setting that is not set is# automatically inherited from the Elasticsearch output configuration, so if you# have the Elasticsearch output configured, you can simply uncomment the# following line.#xpack.monitoring.elasticsearch:2、filebeat服务启动说明filebeat 统⼀安装在每个web端的/usr/local/下启动 ./filebeat -e -c filebeat.yml由于是使⽤⼆进制编译安装,启动每个服务都是需要后台运⾏,所以使⽤screen命令screen 命令简单使⽤screen -dmS NAME 创建名为NAME的会话screen -list 查看当前主机下会话screen -r NAME 进⼊名为NAME的会话ctrl+A+D 退出三、elasticsearch配置1、10.14.2.191 /usr/local/elasticsearch-6.3.2/config/elasticsearch.yml## NOTE: Elasticsearch comes with reasonable defaults for most settings.# Before you set out to tweak and tune the configuration, make sure you# understand what are you trying to accomplish and the consequences.## The primary way of configuring a node is via this file. This template lists# the most important settings you may want to configure for a production cluster.## Please consult the documentation for further information on configuration options:# https://www.elastic.co/guide/en/elasticsearch/reference/index.html## ---------------------------------- Cluster -----------------------------------## Use a descriptive name for your cluster:##: my-application## ------------------------------------ Node ------------------------------------## Use a descriptive name for the node:##: node-1## Add custom attributes to the node:##node.attr.rack: r1## ----------------------------------- Paths ------------------------------------## Path to directory where to store the data (separate multiple locations by comma):##path.data: /path/to/data## Path to log files:##path.logs: /path/to/logs## ----------------------------------- Memory -----------------------------------## Lock the memory on startup:##bootstrap.memory_lock: true## Make sure that the heap size is set to about half the memory available# on the system and that the owner of the process is allowed to use this# limit.## Elasticsearch performs poorly when the system is swapping the memory.## ---------------------------------- Network -----------------------------------## Set the bind address to a specific IP (IPv4 or IPv6):##network.host: 192.168.0.1## Set a custom port for HTTP:##http.port: 9200## For more information, consult the network module documentation.## --------------------------------- Discovery ----------------------------------## Pass an initial list of hosts to perform discovery when new node is started:# The default list of hosts is ["127.0.0.1", "[::1]"]##discovery.zen.ping.unicast.hosts: ["host1", "host2"]## Prevent the "split brain" by configuring the majority of nodes (total number of master-eligible nodes / 2 + 1): ##discovery.zen.minimum_master_nodes:## For more information, consult the zen discovery module documentation.## ---------------------------------- Gateway -----------------------------------## Block initial recovery after a full cluster restart until N nodes are started:##gateway.recover_after_nodes: 3## For more information, consult the gateway module documentation.## Require explicit names when deleting indices:##action.destructive_requires_name: true: es-cluster: es-node1node.master: truenode.data: truenetwork.host: 0.0.0.0discovery.zen.ping.unicast.hosts: ["10.14.2.191","10.14.2.192"]http.cors.enabled: truehttp.cors.allow-origin: "*"bootstrap.memory_lock: falsebootstrap.system_call_filter: false[root@localhost config]# pwd/usr/local/elasticsearch-6.3.2/config2、10.14.2.192 /usr/local/elasticsearch-6.3.2/config/elasticsearch.yml# cat /usr/local/elasticsearch-6.3.2/config/elasticsearch.yml# ======================== Elasticsearch Configuration ========================= ## NOTE: Elasticsearch comes with reasonable defaults for most settings.# Before you set out to tweak and tune the configuration, make sure you# understand what are you trying to accomplish and the consequences.## The primary way of configuring a node is via this file. This template lists# the most important settings you may want to configure for a production cluster.## Please consult the documentation for further information on configuration options:# https://www.elastic.co/guide/en/elasticsearch/reference/index.html## ---------------------------------- Cluster -----------------------------------## Use a descriptive name for your cluster:##: my-application## ------------------------------------ Node ------------------------------------## Use a descriptive name for the node:##: node-1## Add custom attributes to the node:##node.attr.rack: r1## ----------------------------------- Paths ------------------------------------## Path to directory where to store the data (separate multiple locations by comma):##path.data: /path/to/data## Path to log files:##path.logs: /path/to/logs## ----------------------------------- Memory -----------------------------------## Lock the memory on startup:##bootstrap.memory_lock: true## Make sure that the heap size is set to about half the memory available# on the system and that the owner of the process is allowed to use this# limit.## Elasticsearch performs poorly when the system is swapping the memory.## ---------------------------------- Network -----------------------------------## Set the bind address to a specific IP (IPv4 or IPv6):##network.host: 192.168.0.1## Set a custom port for HTTP:##http.port: 9200## Pass an initial list of hosts to perform discovery when new node is started:# The default list of hosts is ["127.0.0.1", "[::1]"]##discovery.zen.ping.unicast.hosts: ["host1", "host2"]## Prevent the "split brain" by configuring the majority of nodes (total number of master-eligible nodes / 2 + 1): ##discovery.zen.minimum_master_nodes:## For more information, consult the zen discovery module documentation.## ---------------------------------- Gateway -----------------------------------## Block initial recovery after a full cluster restart until N nodes are started:##gateway.recover_after_nodes: 3## For more information, consult the gateway module documentation.## ---------------------------------- Various -----------------------------------## Require explicit names when deleting indices:##action.destructive_requires_name: true: es-cluster: es-node2node.master: truenode.data: truenetwork.host: 0.0.0.0discovery.zen.ping.unicast.hosts: ["10.14.2.191","10.14.2.192"]http.cors.enabled: truehttp.cors.allow-origin: "*"bootstrap.memory_lock: falsebootstrap.system_call_filter: false四、logstash 10.14.2.192 【/data/logstash-6.3.2/conf.d】1、bh-redis-to-es# cat /data/logstash-6.3.2/conf.d/bh-redis-to-es###########input 从redis获取不同key的⽇志数据##############################################收集准⽣产10.14.2.170上的项⽬⽇志input {redis {port => "6379"host => "10.14.2.191"data_type => "list"key => "beforehand-10.14.2.170"type => "redis-input-2.170"}#收集准⽣产10.14.2.190上的⽇志redis {port => "6379"host => "10.14.2.191"data_type => "list"key => "beforehand-10.14.2.190"type => "redis-input-2.190"}}###########filter 此处的filter的作⽤是将@timestamp字段按照北京时间显⽰⽇期####################filter {# date {# match => ["message","UNIX_MS"]# target => "@timestamp"# }# ruby {# code => "event.set('timestamp', event.get('@timestamp').time.localtime + 8*60*60)"# }# ruby {# code => "event.set('@timestamp',event.get('timestamp'))"# }# mutate {############output 将获取的⽇志数据输⼊到es集群中############################################ output {if [type] == "redis-input-2.170" {if "bh-api-catalina" in [tags] {elasticsearch {hosts => ["10.14.2.191:9200"]index => "bh-api-catalina-%{+YYYY.MM.dd}"action => "index"}}else if "bh-h5-catalina" in [tags] {elasticsearch {hosts => ["10.14.2.191:9200"]index => "bh-h5-catalina-%{+YYYY.MM.dd}"action => "index"}}else if "bh-b2b_admin-catalina" in [tags] {elasticsearch {hosts => ["10.14.2.191:9200"]index => "bh-b2b_admin-catalina-%{+YYYY.MM.dd}"action => "index"}}else if "bh-silubuy-catalina" in [tags] {elasticsearch {hosts => ["10.14.2.191:9200"]index => "bh-silubuy-catalina-%{+YYYY.MM.dd}"action => "index"}}else if "bh-boss-catalina" in [tags] {elasticsearch {hosts => ["10.14.2.191:9200"]index => "bh-boss-catalina-%{+YYYY.MM.dd}"action => "index"}}}if [type] == "redis-input-2.190" {if "bh-web-catalina" in [tags] {elasticsearch {hosts => ["10.14.2.191:9200"]index => "bh-web-catalina-%{+YYYY.MM.dd}"action => "index"}}else if "bh-b2b_supplier-catalina" in [tags] {elasticsearch {hosts => ["10.14.2.191:9200"]index => "bh-b2b_supplier-catalina-%{+YYYY.MM.dd}"action => "index"}}else if "bh-b2b_www-catalina" in [tags] {elasticsearch {hosts => ["10.14.2.191:9200"]index => "bh-b2b_www-catalina-%{+YYYY.MM.dd}"action => "index"}}else if "bh-business-catalina" in [tags] {elasticsearch {hosts => ["10.14.2.191:9200"]index => "bh-business-catalina-%{+YYYY.MM.dd}"action => "index"}}}#调试模式,⽣产时不建议开启# stdout {#codec => rubydebug# }}###########input 从redis获取不同key的⽇志数据############################################# ##收集silubuy的⽣产项⽬⽇志input {redis {port => "6379"host => "10.14.2.191"data_type => "list"key => "b2c-10.14.2.114"type => "redis-input-2.114"}}#收集iau-www-10.14.4.119项⽬⽇志input {redis {port => "6379"host => "10.14.2.191"data_type => "list"key => "iau-10.14.4.119"type => "redis-input-4.119"}}#收集iau-www-10.14.4.120项⽬⽇志input {redis {port => "6379"host => "10.14.2.191"data_type => "list"key => "iau-10.14.4.120"type => "redis-input-4.120"}}#收集iau-api_h5-10.14.4.104项⽬⽇志input {redis {port => "6379"host => "10.14.2.191"data_type => "list"key => "iau-10.14.4.104"type => "redis-input-4.104"}}#收集iau-api_h5-10.14.4.118项⽬⽇志input {redis {port => "6379"host => "10.14.2.191"data_type => "list"key => "iau-10.14.4.118"type => "redis-input-4.118"}}#收集iau-boss_daemo-10.14.2.185项⽬⽇志input {redis {port => "6379"host => "10.14.2.191"data_type => "list"key => "iau-10.14.2.185"type => "redis-input-2.185"}}#收集iau-business-10.14.2.186项⽬⽇志input {redis {port => "6379"host => "10.14.2.191"data_type => "list"key => "iau-10.14.2.186"type => "redis-input-2.186"}}#收集b2b-admin-10.14.51.104项⽬⽇志input {redis {port => "6379"host => "10.14.2.191"data_type => "list"key => "b2b-admin-10.14.51.104"type => "redis-input-51.104"}}redis {port => "6379"host => "10.14.2.191"data_type => "list"key => "b2b-10.14.51.102"type => "redis-input-51.102"}}#收集b2b-supplier_www-10.14.51.103项⽬⽇志input {redis {port => "6379"host => "10.14.2.191"data_type => "list"key => "b2b-10.14.51.103"type => "redis-input-51.103"}}###########filter 此处的filter的作⽤是将@timestamp字段按照北京时间显⽰⽇期####################filter {# date {# match => ["message","UNIX_MS"]# target => "@timestamp"# }# ruby {# code => "event.set('timestamp', event.get('@timestamp').time.localtime + 8*60*60)"# }# ruby {# code => "event.set('@timestamp',event.get('timestamp'))"# }# mutate {# remove_field => ["timestamp"]# }#}############output 将获取的⽇志数据输⼊到es集群中############################################ output {#silubuy项⽬ 10.14.2.114if [type] == "redis-input-2.114" {elasticsearch {hosts => ["10.14.2.191:9200"]index => "b2c-silubuy-catalina-%{+YYYY.MM.dd}"action => "index"}}#iau-www项⽬ 10.14.4.119if [type] == "redis-input-4.119" {elasticsearch {hosts => ["10.14.2.191:9200"]index => "iau-www-4.119-catalina-%{+YYYY.MM.dd}"action => "index"}}#iau-www项⽬ 10.14.4.120if [type] == "redis-input-4.120" {elasticsearch {hosts => ["10.14.2.191:9200"]index => "iau-www-4.120-catalina-%{+YYYY.MM.dd}"action => "index"}}#iau-business项⽬ 10.14.2.186if [type] == "redis-input-2.186" {elasticsearch {hosts => ["10.14.2.191:9200"]index => "iau-business-catalina-%{+YYYY.MM.dd}"action => "index"}}#b2b-admin项⽬, 10.14.51.104if [type] == "redis-input-51.104" {elasticsearch {hosts => ["10.14.2.191:9200"]index => "b2b-admin-catalina-%{+YYYY.MM.dd}"action => "index"#iau-h5-api项⽬ 10.14.4.104if [type] == "redis-input-4.104" {if "api-catalina" in [tags] {elasticsearch {hosts => ["10.14.2.191:9200"]index => "iau-api-4.104-catalina-%{+YYYY.MM.dd}"action => "index"}}else if "h5-catalina" in [tags] {elasticsearch {hosts => ["10.14.2.191:9200"]index => "iau-h5-4.104-catalina-%{+YYYY.MM.dd}"action => "index"}}}#iau-h5-api项⽬ 10.14.4.118if [type] == "redis-input-4.118" {if "api-catalina" in [tags] {elasticsearch {hosts => ["10.14.2.191:9200"]index => "iau-api-4.118-catalina-%{+YYYY.MM.dd}"action => "index"}}else if "h5-catalina" in [tags] {elasticsearch {hosts => ["10.14.2.191:9200"]index => "iau-h5-4.118-catalina-%{+YYYY.MM.dd}"action => "index"}}}#iau-boss-daemo项⽬ 10.14.2.185if [type] == "redis-input-2.185" {if "boss-catalina" in [tags] {elasticsearch {hosts => ["10.14.2.191:9200"]index => "iau-boss-catalina-%{+YYYY.MM.dd}"action => "index"}}else if "daemo-catalina" in [tags] {elasticsearch {hosts => ["10.14.2.191:9200"]index => "iau-daemo-catalina-%{+YYYY.MM.dd}"action => "index"}}}#b2b-www-supplier项⽬ 10.14.51.102if [type] == "redis-input-51.102" {if "b2b-www-catalina" in [tags] {elasticsearch {hosts => ["10.14.2.191:9200"]index => "b2b-www-51.102-catalina-%{+YYYY.MM.dd}" action => "index"}}else if "b2b-supplier-catalina" in [tags] {elasticsearch {hosts => ["10.14.2.191:9200"]index => "b2b-supplier-51.102-catalina-%{+YYYY.MM.dd}" action => "index"}}}#b2b-www-supplier项⽬ 10.14.51.103if [type] == "redis-input-51.103" {if "b2b-www-catalina" in [tags] {elasticsearch {hosts => ["10.14.2.191:9200"]index => "b2b-www-51.103-catalina-%{+YYYY.MM.dd}" action => "index"}elasticsearch {hosts => ["10.14.2.191:9200"]index => "b2b-supplier-51.103-catalina-%{+YYYY.MM.dd}" action => "index"}}}#调试模式,⽣产时不建议开启# stdout {#codec => rubydebug# }}。
ELK 安装配置
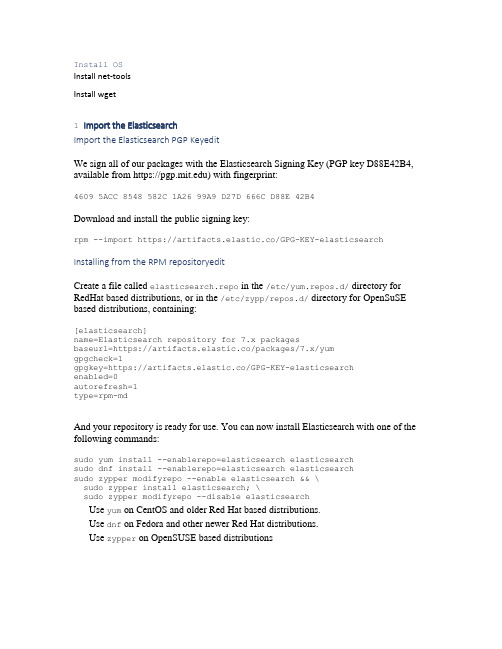
Install OSInstall net-toolsInstall wget1 Import the ElasticsearchImport the Elasticsearch PGP KeyeditWe sign all of our packages with the Elasticsearch Signing Key (PGP key D88E42B4, available from https://) with fingerprint:4609 5ACC 8548 582C 1A26 99A9 D27D 666C D88E 42B4Download and install the public signing key:rpm --import https://artifacts.elastic.co/GPG-KEY-elasticsearch Installing from the RPM repositoryeditCreate a file called elasticsearch.repo in the /etc/yum.repos.d/ directory for RedHat based distributions, or in the /etc/zypp/repos.d/ directory for OpenSuSE based distributions, containing:[elasticsearch]name=Elasticsearch repository for 7.x packagesbaseurl=https://artifacts.elastic.co/packages/7.x/yumgpgcheck=1gpgkey=https://artifacts.elastic.co/GPG-KEY-elasticsearchenabled=0autorefresh=1type=rpm-mdAnd your repository is ready for use. You can now install Elasticsearch with one of the following commands:sudo yum install --enablerepo=elasticsearch elasticsearchsudo dnf install --enablerepo=elasticsearch elasticsearchsudo zypper modifyrepo --enable elasticsearch && \sudo zypper install elasticsearch; \sudo zypper modifyrepo --disable elasticsearchUse yum on CentOS and older Red Hat based distributions.Use dnf on Fedora and other newer Red Hat distributions.Use zypper on OpenSUSE based distributionsSysV init vs systemd editElasticsearch is not started automatically after installation. How to start and stop Elasticsearch depends on whether your system uses SysV init or systemd (used by newer distributions). You can tell which is being used by running this command:ps -p 1Running Elasticsearch with systemd editTo configure Elasticsearch to start automatically when the system boots up, run the following commands:sudo /bin/systemctl daemon-reloadsudo /bin/systemctl enable elasticsearch.serviceElasticsearch can be started and stopped as follows:sudo systemctl start elasticsearch.servicesudo systemctl stop elasticsearch.serviceConfiguring ElasticsearchElasticsearch defaults to using /etc/elasticsearch for runtime configuration. The ownership of this directory and all files in this directory are set to root:elasticsearch on package installation and the directory has the setgid flag set so that any files and subdirectories created under /etc/elasticsearch are created with this ownership as well (e.g., if a keystore is created using the keystore tool). It is expected that this be maintained so that the Elasticsearch process can read the files under this directory via the group permissions.Elasticsearch loads its configuration from the/etc/elasticsearch/elasticsearch.yml file by default. The format of this config file is explained in Configuring Elasticsearch.network.host: localhosthttp.port: 9200add:discovery.seed_hosts : 127.0.0.1:9300You should use wget in order to download Kibana and then you should install it using the rpm command:wget https://artifacts.elastic.co/downloads/kibana/kibana-7.8.0-x86_64.rpmrpm -ivh kibana-7.8.0-x86_64.rpmNext step is editing the Kibana configuration file.nano /etc/kibana/kibana.ymlUncomment the configuration lines for server.port, server.host and elasticsearch.url.server.port: 5601server.host: "localhost"elasticsearch.url: "http://localhost:9200"The changes need to be saved and then you can exit.Start the Kibana service and set it to start automatically on boot:systemctl enable kibanasystemctl start kibanaYou have now finished the installation of Kibana.Install and configure NginxNext thing is to install Nginx and of course to configure it as a reverse proxy to access Kibana from the public IP address.Nginx can be found in the Epel repository, install epel-release with yum.yum install epel-releaseThen, you need to install the Nginx and httpd-tools package.yum install nginx httpd-toolsnohup /usr/share/logstash/bin/logstash -f /usr/share/logstash/config/nginx.conf &ELK troubleshooting1 http://10.16.2.121:9200/_cat/indices?v{"error":{"root_cause":[{"type":"master_not_discovered_exception","reas on":null}],"type":"master_not_discovered_exception","reason":null},"sta tus":503}2 http://10.16.2.121:9200/{"name" : "","cluster_name" : "elasticsearch","cluster_uuid" : "_na_","version" : {"number" : "7.8.0","build_flavor" : "default","build_type" : "rpm","build_hash" : "757314695644ea9a1dc2fecd26d1a43856725e65","build_date" : "2020-06-14T19:35:50.234439Z","build_snapshot" : false,"lucene_version" : "8.5.1","minimum_wire_compatibility_version" : "6.8.0","minimum_index_compatibility_version" : "6.0.0-beta1"},"tagline" : "You Know, for Search"}All change to default (#) then restart elasticsearch the uuid auto createdvi /etc/elasticsearch/elasticsearch.ymldiscovery.seed_hosts : 127.0.0.1:9300Logstash install and configure and send to zabbixInstallRPM install1 Download and install the public signing key:sudo rpm --import https://artifacts.elastic.co/GPG-KEY-elasticsearch2 Add the following in your /etc/yum.repos.d/ directory in a file with a .repo suffix, for example logstash.repo[logstash-7.x]name=Elastic repository for7.x packagesbaseurl=https://artifacts.elastic.co/packages/7.x/yumgpgcheck=1gpgkey=https://artifacts.elastic.co/GPG-KEY-elasticsearch enabled=1autorefresh=1type=rpm-md3 And your repository is ready for use. You can install it with:sudo yum install logstashWindows installUnzip to a folderTestFirst, let’s test your Logstash installation by running the most basic Logstash pipeline.A Logstash pipeline has two required elements, input and output, and one optional element, filter. The input plugins consume data from a source, the filter plugins modify the data as you specify, and the output plugins write the dataTo test your Logstash installation, run the most basic Logstash pipeline. For example:cd logstash-7.8.0bin/logstash -e 'input { stdin { } } output { stdout {} }'[root@bjc-vm-winlogbeat logstash]# /usr/share/logstash/bin/logstash -e 'input { stdin { } } output { stdout {} }'WARNING: Could not find logstash.yml which is typically located in $LS_HOME/config or/etc/logstash. You can specify the path using --path.settings. Continuing using the defaults Could not find log4j2 configuration at path /usr/share/logstash/config/log4j2.properties. Using default config which logs errors to the console[WARN ] 2020-07-15 07:25:04.475 [LogStash::Runner] multilocal - Ignoring the 'pipelines.yml' file because modules or command line options are specified[INFO ] 2020-07-15 07:25:04.486 [LogStash::Runner] runner - Starting Logstash {"logstash.version"=>"7.8.0", "jruby.version"=>"jruby 9.2.11.1 (2.5.7) 2020-03-25 b1f55b1a40 OpenJDK 64-Bit Server VM 25.102-b14 on 1.8.0_102-b14 +indy +jit [linux-x86_64]"}[INFO ] 2020-07-15 07:25:06.271 [Converge PipelineAction::Create<main>] Reflections - Reflections took 62 ms to scan 1 urls, producing 21 keys and 41 values[INFO ] 2020-07-15 07:25:07.281 [[main]-pipeline-manager] javapipeline - Starting pipeline {:pipeline_id=>"main", "pipeline.workers"=>2, "pipeline.batch.size"=>125,"pipeline.batch.delay"=>50, "pipeline.max_inflight"=>250, "pipeline.sources"=>["config string"], :thread=>"#<Thread:0x1c548e23 run>"}[INFO ] 2020-07-15 07:25:08.468 [[main]-pipeline-manager] javapipeline - Pipeline started {"pipeline.id"=>"main"}The stdin plugin is now waiting for input:[INFO ] 2020-07-15 07:25:08.554 [Agent thread] agent - Pipelines running{:count=>1, :running_pipelines=>[:main], :non_running_pipelines=>[]}[INFO ] 2020-07-15 07:25:08.816 [Api Webserver] agent - Successfully started Logstash API endpoint {:port=>9600}test/usr/share/logstash/vendor/bundle/jruby/2.5.0/gems/awesome_print-1.7.0/lib/awesome_print/formatters/base_formatter.rb:31: warning: constant ::Fixnum is deprecated{"message" => "test","@version" => "1","@timestamp" => 2020-07-14T23:26:32.410Z,"host" => ""}^C[WARN ] 2020-07-15 07:26:53.217 [SIGINT handler] runner - SIGINT received. Shutting down. ^C[FATAL] 2020-07-15 07:26:53.418 [SIGINT handler] runner - SIGINT received. Terminating immediately..[ERROR] 2020-07-15 07:26:53.545 [LogStash::Runner] Logstash - org.jruby.exceptions.ThreadKill [root@bjc-vm-winlogbeat logstash]#Configure1 Default and systemctl startDefault path and name/etc/logstash/conf.d *.conf# systemcrl start logstash2 manuallynohup /usr/share/logstash/bin/logstash -f /usr/share/logstash/config/nginx.conf &3 ExampleLinux: check linux secure logConf contentinput {file {path => ["/var/log/secure"]type => "system"start_position => "beginning"}}filter {grok {match => { "message" =>"%{SYSLOGTIMESTAMP:message_timestamp} %{SYSLOGHOST:hostname} %{DA TA:message_program}(?:\[%{POSINT:message_pid}\])?: %{GREEDYDATA:message_content}" } #这里通过grok 对message字段的数据进行字段划分,这里将message字段划分了5个子字段。
Linux下ELK环境搭建
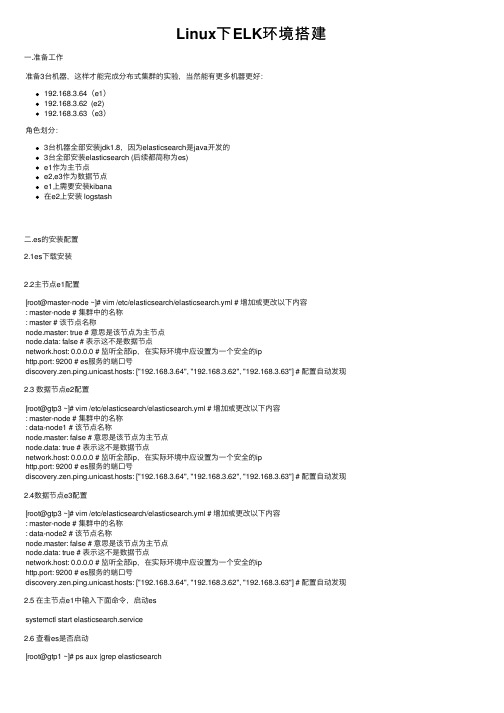
Linux下ELK环境搭建⼀.准备⼯作准备3台机器,这样才能完成分布式集群的实验,当然能有更多机器更好:192.168.3.64(e1)192.168.3.62 (e2)192.168.3.63(e3)⾓⾊划分:3台机器全部安装jdk1.8,因为elasticsearch是java开发的3台全部安装elasticsearch (后续都简称为es)e1作为主节点e2,e3作为数据节点e1上需要安装kibana在e2上安装 logstash⼆.es的安装配置2.1es下载安装2.2主节点e1配置[root@master-node ~]# vim /etc/elasticsearch/elasticsearch.yml # 增加或更改以下内容: master-node # 集群中的名称: master # 该节点名称node.master: true # 意思是该节点为主节点node.data: false # 表⽰这不是数据节点network.host: 0.0.0.0 # 监听全部ip,在实际环境中应设置为⼀个安全的iphttp.port: 9200 # es服务的端⼝号discovery.zen.ping.unicast.hosts: ["192.168.3.64", "192.168.3.62", "192.168.3.63"] # 配置⾃动发现2.3 数据节点e2配置[root@gtp3 ~]# vim /etc/elasticsearch/elasticsearch.yml # 增加或更改以下内容: master-node # 集群中的名称: data-node1 # 该节点名称node.master: false # 意思是该节点为主节点node.data: true # 表⽰这不是数据节点network.host: 0.0.0.0 # 监听全部ip,在实际环境中应设置为⼀个安全的iphttp.port: 9200 # es服务的端⼝号discovery.zen.ping.unicast.hosts: ["192.168.3.64", "192.168.3.62", "192.168.3.63"] # 配置⾃动发现2.4数据节点e3配置[root@gtp3 ~]# vim /etc/elasticsearch/elasticsearch.yml # 增加或更改以下内容: master-node # 集群中的名称: data-node2 # 该节点名称node.master: false # 意思是该节点为主节点node.data: true # 表⽰这不是数据节点network.host: 0.0.0.0 # 监听全部ip,在实际环境中应设置为⼀个安全的iphttp.port: 9200 # es服务的端⼝号discovery.zen.ping.unicast.hosts: ["192.168.3.64", "192.168.3.62", "192.168.3.63"] # 配置⾃动发现2.5 在主节点e1中输⼊下⾯命令,启动essystemctl start elasticsearch.service2.6 查看es是否启动[root@gtp1 ~]# ps aux |grep elasticsearch[root@gtp1 ~]# netstat -lntp |grep java # es服务会监听两个端⼝9300端⼝是集群通信⽤的,9200则是数据传输时⽤的。
elk教程

elk教程标题:Elk教程Elk(即Elasticsearch、Logstash和Kibana)是一套常用于日志收集、分析和可视化的工具。
它由三个部分构成,分别是Elasticsearch、Logstash和Kibana。
本教程将介绍如何使用Elk 进行日志管理和分析。
Elasticsearch是一个高性能的开源分布式搜索引擎。
它可以存储和索引大量的数据,并提供强大的搜索和分析功能。
通过使用Elasticsearch,您可以快速地搜索和过滤日志数据,以便找到所需的信息。
Logstash是一个用于数据采集、处理和转换的开源工具。
它可以从不同的来源收集日志数据,如文件、网络等,并将其统一处理和格式化。
Logstash可以将采集到的数据发送到Elasticsearch进行索引和存储。
Kibana是一个基于Web的用户界面,用于可视化和分析存储在Elasticsearch中的日志数据。
它提供了丰富的图表、图形和仪表盘,帮助用户更直观地理解和分析日志数据。
使用Elk进行日志管理和分析的基本流程如下:1. 安装和配置Elasticsearch、Logstash和Kibana。
2. 使用Logstash定义数据源和过滤规则,以便收集和处理日志数据。
3. 将日志数据发送到Elasticsearch进行索引和存储。
4. 使用Kibana创建仪表盘和图表,以便可视化和分析日志数据。
通过Elk,您可以快速地收集、存储和分析大量的日志数据。
它提供了丰富的功能和工具,可帮助您更好地理解和利用日志数据。
这将有助于您提高系统的性能和稳定性,并快速定位和解决问题。
在本教程中,我们将深入介绍每个组件的功能和用法,并提供实际操作的示例。
希望通过学习Elk教程,您能够更好地掌握日志管理和分析的技巧,从而提高系统的运维能力。
- 1、下载文档前请自行甄别文档内容的完整性,平台不提供额外的编辑、内容补充、找答案等附加服务。
- 2、"仅部分预览"的文档,不可在线预览部分如存在完整性等问题,可反馈申请退款(可完整预览的文档不适用该条件!)。
- 3、如文档侵犯您的权益,请联系客服反馈,我们会尽快为您处理(人工客服工作时间:9:00-18:30)。
一、基础环境
系统:Centos7.2 (Centos6.* 亦可)
CPU:2*CPUs
内存:2G
硬盘:50G
二、安装前准备
1、关闭防火墙:
# systemctl stopfirewalld.service
# systemctl disablefirewalld.service
2、关闭selinux服务
# vi /etc/selinux/config
编辑:
SELINUX=disabled
3、安装jdk
#yum install java-1.8.0-openjdk –y
设置java环境变量:
#export JAVA_HOME=/usr/java #export JAVACMD=`which java`
三、安装elasticsearch
从
https://artifacts.elastic.co/downloads/elasticsearch /elasticsearch-5.0.1.rpm下载elasticsearch5.0.1安装包
#wget
https://artifacts.elastic.co/downloads/elasticsearch /elasticsearch-5.0.1.rpm
开始安装:
# rpm -ivh elasticsearch-5.0.1.rpm
修改配置文件:
#vi /etc/elasticsearch/elasticsearch.yml 配置:
network.host: 192.168.1.233
http.port: 9200
启动Elasticsearch:
#service elasticsearch start
验证:
在浏览器中输入192.168.1.233:9200
即为成功
四、安装Kibana
从
https://artifacts.elastic.co/downloads/kibana/kibana
-5.0.1-x86_64.rpm下载kibana5.0.1的安装包
# wget https://artifacts.elastic.co/downloads/kibana/kibana
-5.0.1-x86_64.rpm
开始安装:
# rpm -ivh kibana-5.0.1-x86_64.rpm
修改配置文件:
# vi /etc/kibana/kibana.yml
配置:
server.port: 5601
server.host: "192.168.1.233"
elasticsearch.url: "http://192.168.1.233:9200"
启动Kibana:
# servicekibanastart
验证:
浏览器中输入:192.168.1.233:5601
五、安装Logstash
从
https://artifacts.elastic.co/downloads/logstash/logs tash-5.0.1.rpm下载logstash 5.0.1
#wgethttps://artifacts.elastic.co/downloads/logstash /logstash-5.0.1.rpm
安装Logstash:
把/etc/logstash/下的log4j2.properties、logstash.yml 两个文件复制到/usr/share/logstash/config下
# cp /etc/logstash/log4j2.properties /usr/share/logstash/config/
# cp /etc/logstash/logstash.yml/usr/share/logstash/config /
在 /etc/logstash/conf.d/下新增配置文件test.conf #vi /etc/logstash/conf.d/test.conf
录入测试配置内容:
input{stdin{}}
output{stdout{}}
指定用test.conf启动logstash:
# /usr/share/logstash/bin/logstash -f /etc/logstash/conf.d/test.conf
Logstash即为安装成功。