GE公司盈余质量分析
企业经营结构分析常用的三种g矩阵分析法

企业经营结构分析常用的三种g矩阵分析法一、企业战略分析模型:ROSRMS矩阵矩阵也称做销售回报和相对市场份额矩阵,主要是用来分析企业的不同业务单元或产品的发展战略。
该分析模型定义,企业某个业务单元或产品在市场上的销售额应该与其在市场中的相对份额成正比,并且该业务单元或产品的销售额越高,该业务单元或产品为企业所提供的销售回报就应该越高。
数据分析人员根据上图,可了解企业的某种业务单元或产品的销售额在由低向高不断增加,其相对市场份额和销售回报也在一个“通道”内由低向高不断增加。
如果该业务单元或产品的销售额增加,而其对企业的销售回报或相对市场份额降低,那么企业就不应该在这个时候进入其他领域,应该着重改善这个业务单元或产品的经营状况。
二、公司战略价值分析模型:价值链模型为了提升企业战略,美国战略管理学家Porter第一次提出价值链分析的方法。
企业的竞争优势来源于企业在设计、生产、营销、交货等过程及辅助过程中所进行的许多相互分离的活动,这些活动中的每一种都对企业的相对成本地位有所贡献,并奠定了企业竞争优势的基础。
价值链模型将一个企业的行为分解为战略性相关的许多活动,企业正是通过比其竞争对手更廉价或更出色地开展这些重要的战略活动来赢得竞争优势的。
在数据分析中,价值链模型目的在于帮助企业分析公司运行的哪个环节可以提高客户价值或降低生产成本。
三、成熟市场企业地位分析:三四矩阵三四矩阵是由波士顿咨询集团提出的。
这个模型用于分析一个成熟市场中企业的竞争地位。
在一个稳定的竞争市场中,参与市场竞争的参与者一般分为三类,领先者、参与者、生存者。
领先者一般是指市场占有率在15%以上,可以对市场变化产生重大影响的企业,如在价格、产量等方面;参与者一般是指市场占有率介于5%~15%之间的企业,这些企业虽然不能对市场产生重大的影响,但是它们是市场竞争的有效参与者;生存者一般是局部细分市场填补者,这些企业的市场份额都非常低,通常小于5%。
盈余质量研究:进展,挑战及研究方向——基于Dechow—Ge—Schrand(2010)文献综述
2 0 l 3年 4月
怀 陀学 院 学 报
J O URNAL OF HUAI HUA UNI VERSI TY
VO 1 . 3 2. No. 4 Ap r .2 0 I 3 方 向
l h l P a l ‘ n i n g s qu a l i t l i l e r a h l + ‘ c【 l v t r t h e t us r t t wo de c a d e s 8 1 1 ( t a f 0 w o f t l I P i mp o t l a l I t c o n t r i b u t i o n s f t + o n l t l t i s l i t e r a t mP. Th e a u t h t ’ r s l ’p r e s t I l l s
1 ) ( ) NG Xi a o— i l l a l l
(Fi n a n e e a n d Ec O l l Ol ni C S Ac c o l l 1 1 l i n g De p a r t me n t. , J t l u i f , I i v e r s i t ). Be n gb u. . 4 t z h u i 2 3 3 0 0 0)
— —
Ba s e d o n t h e E a r n i n g s Qu a l i t y Re s e a r c h Re v i e we d i n De c h o w,Ge a n d S c h r a n d ( 2 0 1 0) ( DGS )
中 图 分 类 号 :F 8 3
盈 余 管理 ;
异 常 应计 项 目; 代 理 变量
文 章 编 号 :1 6 7 l 一 9 7 4 3( 2 0 1 3 )0 4 —0 0 5 0— 0 2
企业盈利质量分析中英文对照外文翻译文献

企业盈利质量分析中英文对照外文翻译文献(文档含英文原文和中文翻译)原文:Measuring the quality of earnings1. IntroductionGenerally accepted accounting principles (GAAP) offer some flexibility in preparing the financial statements and give the financial managers some freedom to select among accounting policies and alternatives. Earning management uses the flexibility in financial reporting to alter the financial results of the firm (Ortega and Grant, 2003).In other words, earnings management is manipulating the earning to achieve apredetermined target set by the management. It is a purposeful intervention in the external reporting process with the intent of obtaining some private gain (Schipper, 1989).Levit (1998) defines earning management as a gray area where the accounting is being perverted; where managers are cutting corners; and, where earnings reports reflect the desires of management rather than the underlying financial performance of the company.The popular press lists several instances of companies engaging in earnings management. Sensormatic Electronics, which stamped shipping dates and times on sold merchandise, stopped its clocks on the last day of a quarter until customer shipments reached its sales goal. Certain business units of Cendant Corporation inflated revenues nearly $500 million just prior to a merger; subsequently, Cendant restated revenues and agreed with the SEC to change revenue recognition practices. AOL restated earnings for $385 million in improperly deferred marketing expenses. In 1994, the Wall Street Journal detailed the many ways in which General Electric smoothed earnings, including the careful timing of capital gains and the use of restructuring charges and reserves, in response to the article, General Electric reportedly received calls from other corporations questioning why such common practices were “front-page” news.Earning management occurs when managers use judgment in financial reporting and in structuring transactions to alter financial reports to either mislead some stakeholders about the underlying economic performance of the company or to influence contractual outcomes that depend on reported accounting numbers (Healy and Whalen, 1999).Magrath and Weld (2002) indicate that abusive earnings management and fraudulent practices begins by engaging in earnings management schemes designed primarily to “smooth” earnings to meet internally or externally imposed earnings forecasts and analysts’ expectations.Even if earnings management does not explicitly violate accounting rules, it is an ethically questionable practice. An organization that manages its earnings sends amessage to its employees that bending the truth is an acceptable practice. Executives who partake of this practice risk creating an ethical climate in which other questionable activities may occur. A manager who asks the sales staff to help sales one day forfeits the moral authority to criticize questionable sales tactics another day.Earnings management can also become a very slippery slope, which relatively minor accounting gimmicks becoming more and more aggressive until they create material misstatements in the financial statements (Clikeman, 2003)The Securities and Exchange Commission (SEC) issued three staff accounting bulletins (SAB) to provide guidance on some accounting issues in order to prevent the inappropriate earnings management activities by public companies: SAB No. 99 “Materiality”, SAB No. 100 “Restructuring and Impairment Charges” and SAB No. 101 “Revenue Recognition”.Earnings management behavior may affect the quality of accounting earnings, which is defined by Schipper and Vincent (2003) as the extent to which the reported earnings faithfully represent Hichsian economic income, which is the amount that can be consumed (i.e. paid out as dividends) during a period, while leaving the firm equally well off at the beginning and the end of the period.Assessment of earning quality requires sometimes the separations of earnings into cash from operation and accruals, the more the earnings is closed to cash from operation, the higher earnings quality. As Penman (2001) states that the purpose of accounting quality analysis is to distinguish between the “hard” numbers resulting from cash flows and the “soft” numbers resulting from accrual accounting.The quality of earnings can be assessed by focusing on the earning persistence; high quality earnings are more persistent and useful in the process of decision making.Beneish and Vargus (2002) investigate whether insider trading is informative about earnings quality using earning persistence as a measure for the quality of earnings, they find that income-increasing accruals are significantly more persistent for firms with abnormal insider buying and significantly less persistent for firms with abnormal insider selling, relative to firms which there is no abnormal insider trading.Balsam et al. (2003) uses the level of discretionary accruals as a direct measurefor earning quality. The discretionary accruals model is based on a regression relationship between the change in total accruals as dependent variable and change in sales and change in the level of property, plant and equipment, change in cash flow from operations and change in firm size (total assets) as independent variables. If the regression coefficients in this model are significant that means that there is earning management in that firm and the earnings quality is low.This research presents an empirical study on using three different approaches of measuring the quality of earnings on different industry. The notion is; if there is a complete consistency among the three measures, a general assessment for the quality of earnings (high or low) can be reached and, if not, the quality of earnings is questionable and needs different other approaches for measurement and more investigations and analysis.The rest of the paper is divided into following sections: Earnings management incentives, Earnings management techniques, Model development, Sample and statistical results, and Conclusion.2. Earnings management incentives2.1 Meeting analysts’ expectationsIn general, analysts’ expectations and company predictions tend to address two high-profile components of financial performance: revenue and earnings from operations.The pressure to meet revenue expectations is particularly intense and may be the primary catalyst in leading managers to engage in earning management practices that result in questionable or fraudulent revenue recognition practices. Magrath and Weld (2002) indicate that improper revenue recognition practices were the cause of one-third of all voluntary or forced restatements of income filed with the SEC from 1977 to 2000.Ironically, it is often the companies themselves that create this pressure to meet the market’s earnings expec tations. It is common practice for companies to provide earnings estimates to analysts and investors. Management is often faced with the task of ensuring their targeted estimates are met.Several companies, including Coca-Cola Co., Intel Corp., and Gillette Co., have taken a contrary stance and no longer provide quarterly and annual earnings estimates to analysts. In doing so, these companies claim they have shifted their focus from meeting short-term earnings estimates to achieving their long-term strategies (Mckay and Brown, 2002).2.2 To avoid debt-covenant violations and minimize political costsSome firms have the incentive to avoid violating earnings-based debt covenants. If violated, the lender may be able to raise the interest rate on the debt or demand immediate repayment. Consequently, some firms may use earnings-management techniques to increase earnings to avoid such covenant violations. On the other hand, some other firms have the incentive to lower earnings in order to minimize political costs associated with being seen as too profitable. For example, if gasoline prices have been increasing significantly and oil companies are achieving record profit level, then there may be incentive for the government to intervene and enact an excess-profit tax or attempt to introduce price controls.2.3 To smooth earnings toward a long-term sustainable trendFor many years it has been believed that a firm should attempt to reduce the volatility in its earnings stream in order to maximize share price. Because a highly violate earning pattern indicates risk, therefore the stock will lose value compared to others with more stable earnings patterns. Consequently, firms have incentives to manage earnings to help achieve a smooth and growing earnings stream (Ortega and Grant, 2003).2.4 Meeting the bonus plan requirementsHealy (1985) provides the evidence that earnings are managed in the direction that is consistent with maximizing executives’ earnings-based bonus. When earnings will be below the minimum level required to earn a bonus, then earning are managed upward so that the minimum is achieved and a bonus is earned. Conversely, when earning will be above the maximum level at which no additional bonus is paid, then earnings are managed downward. The extra earnings that will not generate extra bonus this current period are saved to be used to earn a bonus in a future period.When earnings are between the minimum and the maximum levels, then earnings are managed upward in order to increase the bonus earned in the current period.2.5 Changing managementEarnings management usually occurs around the time of changing management, the CEO of a company with poor performance indicators will try to increase the reported earnings in order to prevent or postpone being fired. On the other hand, the new CEO will try shift part of the income to future years around the time when his/her performance will be evaluated and measured, and blame the low earning at the beginning of his contract on the acts of the previous CEO.3. Earnings management techniquesOne of the most common earnings management tools is reporting revenue before the seller has performed under the terms of a sales contract (SEC,SAB No. 101,1999).Another area of concern is where a company fails to comply with GAAP and inappropriately records restructuring charges and general reserves for future losses, reversing or relieving reserves in inappropriate periods, and recognizing or not recognizing an asset impairment charge in the appropriate period (SEC, SAB No. 100, 1999).Managers can influence reported expenses through assumptions and estimates such as the assumed rate of return on pension plan asset and the estimated useful lives of fixed assets, also they can influence reported earnings by controlling the timing of purchasing, deliveries, discretionary expenditures, and sale of assets.3.1 Big bath“Big Bath” charges are one-time restructuring charge. Current earnings will be decreased by overstating these one-time charges. By reversing the excessive reserve, future earnings will increase.Big bath charges are not always related to restructuring. In April 2001, Cisco Systems Inc. announced charges against earnings of almost $4 billion. The bulk of the charge, $2.5 billion, consisted of an inventory write down. Writing off more than a billion dollars from inventory now means more than a billion dollars of less cost in the future period. This an example of what ultra-conservative accounting in oneperiod makes possible in future periods.3.2 Abuse of materialityAnother area that might be used by accountants to manipulate the earning is the application of materiality principle in preparing the financial statements, this principle is very wide, flexible and has no specific range to determine where the item is material or not. SEC uses the interpretation ruled by the supreme court in identifying what is material; the supreme court has held that a fact is material if there is a substantial likelihood that the fact would have been viewed by reasonable investor as having significan tly altered the “total mix” of information made available (SEC, SAB No. 99, 1999).The SEC has also introduced some considerations for a quantitatively small misstatement of a financial statement item to be material:. whether the misstatement arises from an item capable of precise measurement or whether it arises from an estimate and, if so, the degree of imprecision inherent in the estimate;. whether the misstatement masks a change in earnings or other trends;.whether the misstatement hides a failure to meet analysts’ consensus expectations for the enterprise;. whether the misstatement changes a loss into income or vice versa;. whether the misstatement concerns a segment or other portion of the registrant’s business that has been identified as playing a significant role in the registrant’s operations or profitability; and. whether the misstatement involves concealment of an unlawful transaction.3.3 Cookie jar“Cookie jar” reserve –sometimes labeled rainy day reserve or contingency reserves, in periods of strong financial performance, cookie jar reserve enable to reduce earnings by overstating reserves, overstating expenses, and using one-time write-offs. In periods of weak financial performance, cookie jar reserves can be used to increase earnings by reversing accruals and reserves to reduce current period expenses (Kokoszka, 2003).The most famous example of use of cookie jar reserves is WorldCom Inc. In August 2002, an internal review revealed that the company had $2.5 billion reserves related to litigation, uncollectible and taxes. The company used most of them in a series of so-called reserve reversals in order to have higher earnings.Source: Khaled ElMoatasem Abdelghany,2005. “Measuring the quality of earnings”, Managerial Auditing Journal, vol.20, no.9, pp.1001 – 1015.译文:衡量盈利质量1、引言一般公认会计原则(GAAP)提供准备一定的灵活性的财务报表,给财务经理一定的自由空间进行选择会计政策和方案。
GE矩阵分析法范文

GE矩阵分析法范文GE矩阵分析法是一种常用的企业战略分析工具,在制定战略、评估业务部门绩效、选择投资项目等方面具有广泛应用。
本文将详细介绍GE矩阵分析法的概念、构建方法和具体应用案例,帮助读者更好地理解和运用该分析方法。
一、概念二、构建方法具体而言,GE矩阵分析法的构建方法包括以下步骤:1.选择评估指标:根据具体情况选择适合的评估指标,如市场份额、市场增长率、技术创新等。
2.设定评估标准:根据企业的战略目标和市场特点,设定评估的标准和权重,如市场增长率设定为20%,市场份额设定为30%等。
3.评估业务单元:根据评估指标和标准,对各个业务单元进行评估,获得得分。
4.综合评估:根据市场吸引力和竞争地位的得分,将业务单元放置在GE矩阵的相应位置。
5.制定战略目标:根据GE矩阵的结果,制定相应的战略目标和措施,如扩大市场份额、提高竞争力,调整或转型非优势业务等。
三、具体应用案例下面以一个虚构的制造业企业为例,来说明GE矩阵分析法的具体应用。
该企业有三个业务单元:A、B、C,分别从事家电、汽车和电子产品的生产和销售。
1.选择评估指标:选择市场规模、市场增长率、市场份额、技术创新等指标作为评估指标。
2.设定评估标准:设定市场规模权重为20%,市场增长率权重为30%,市场份额权重为30%,技术创新权重为20%。
3.评估业务单元:根据具体数据,对三个业务单元进行评估,得到如下得分:-业务单元A:市场规模得分为90分,市场增长率得分为70分,市场份额得分为80分,技术创新得分为60分;-业务单元B:市场规模得分为80分,市场增长率得分为90分,市场份额得分为50分,技术创新得分为70分;-业务单元C:市场规模得分为70分,市场增长率得分为80分,市场份额得分为70分,技术创新得分为80分。
4.综合评估:根据得分,将业务单元放置在GE矩阵的相应位置。
以市场吸引力为X轴,竞争地位为Y轴,分别为高、中、低三个等级,得到如下结果:-业务单元A:市场吸引力为高,竞争地位为中;-业务单元B:市场吸引力为中,竞争地位为高;-业务单元C:市场吸引力为中,竞争地位为中。
基于现金流量表的格力电器盈余质量分析
XIANDAIYINGXIAO 基于现金流量表的格力电器盈余质量分析岳彩虹(西藏民族大学财经学院陕西咸阳712082)摘要:在我国,会计盈余是所有企业和投资者都关心的部分,它关系到企业是否能获得融资,是否能长远发展。
盈余质量体现在公司的盈利能力上,企业的盈利能力又体现在利润和现金流上。
盈利能力的高低对企业的发展有着重要的影响,盈余质量的高低能综合反映一个企业的整体状况。
由于盈余信息的重要性,一些企业为了获取贷款等获取利益的缘由来调节盈余信息,一些企业管理人灵也会为了完成投资者对企业设定的目标而去篡改盈余信息。
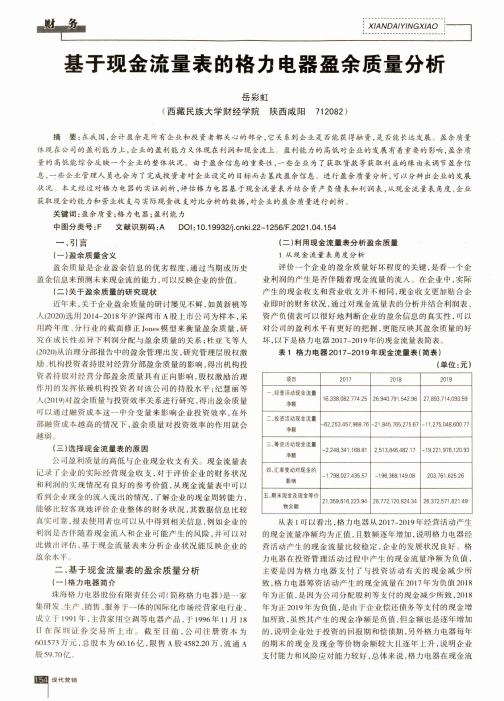
进行盈余质量分析,可以分辨出企业的发展状况;本文经过对格力电器的实证剖析,评估格力电器基于现金流量表并结合资产负债表和利润表,从现金流量表角度、企业获取现金的能力和营业收支与实际现金收支对比分析的数据,对企业的盈余质量进行剖析。
关键词:盈余质量;格力电器;盈利能力中图分类号:F文献识别码:A DOI:10.19932/ki.22-1256/F.2021.04.154_、弓I言(一) 盈余质量含义盈余质量是企业盈余信息的优劣程度,通过当期或历史 盈余信息来预测未来现金流的能力,可以反映企业的价值。
(二) 关于盈余质量的研究现状近年来,关于企业盈余质量的研讨屡见不鲜,如黄新桃等 人(2020)选用2014-2018年沪深两市A股上市公司为样本,采 用跨年度、分行业的截面修正Jones模型来衡量盈余质量,研 究在成长性差异下利润分配与盈余质量的关系;杜亚飞等人 (2020)从治理分部报告中的盈余管理出发,研究管理层股权激 励、机构投资者持股对经营分部盈余质量的影响,得出机构投 资者持股对经营分部盈余质量具有正向影响,股权激励治理 作用的发挥依赖机构投资者对该公司的持股水平;纪慧丽等 人(2019)对盈余质量与投资效率关系进行研究,得出盈余质量 可以通过融资成本这一中介变量来影响企业投资效率,在外 部融资成本越高的情况下,盈余质量对投资效率的作用就会 越弱3(三)选择现金流量表的原因公司盈利质量的高低与企业现金收支有关。
GE公司盈余质量分析课件

高质量盈余的定义
• 从实证研究角度进行的定义:储一昀、王安武(2000)从盈余与 经营现金流量联系的角度出发,考察了我国上市公司的盈余质量 问题。他们认为,盈余质量应当反映盈余的确认是否同时伴随相 应的现金流入,只有伴随现金流入的盈余才具有较高的质量,具 体表现为以应计制为基础计算的有关盈余指标数值与以现金制为 基础计算的有关盈余指标数值的差异程度。二者之间的差异越小, 表明盈余质量越高;王化成、佟岩(2006)也与程小可(2004) 持类似观点,认为盈余质量应当是指盈余信息使用者的决策相关 性,即根据当期盈余(或盈余变动情况)预测公司未来市场回报 的能力,并使用盈余反应系数来度量这种能力。
GE公司盈余质量分析
投资者为什么要看重高质量盈余
• 盈余质量对于公司的作用:
• 盈余质量与筹资成本:提高公司的盈余信息,能够从三个方面降 低企业的资本成本:首先,真实可靠的盈余信息能够反映企业的财 务状况,从而降低外部投资者和内部人之间存在的信息不对称, 有利于降低代理成本。其次,由于投资者往往以企业往年的盈余 信息为依据,进行企业风险(不可分散风险)的估计,较高的盈余 信息能够使企业获得更好的投资信息,从而降低投资风险。最后, 高质量的会计信息,能够降低风险溢价,从而降低企业的资本成 本。
GE公司盈余质量分析
GE公司盈余质量分析
展示进程
• Part 1: 高质量盈余 • Part 2: 通用电器简介 • Part 3: 盈余管理手段 • Part 4: 盈余质量分析
盈余质量研究综述
需要,量才用人。首先可以在企业内部实现人
四 、结 束 语
才的合理流动。不同部门需要的各种人才可以
对于矿业企业来说,拥有丰富的自然资源
通过双向选择在单位内不同部门之间进行流 和充足的资金固然重要,但若不重视人力资源
动,实现个人和岗位最优化匹配。企业内部无 在企业中的作用,没有合理的人力资源管理模
法满足人才需求状况时,可以采取社会公开招 式,也会造成重大的资源浪费和经济损失。矿
质量,该比值越高表示盈余质量越低。总 现金流量表所列示的各项财务数据为基
储一昀与王安武从盈余与经营现金
的来说,盈余中应计利润部分越少,特别 本依据,通过一系列现金流量指标的计 流量联系的角度出发,考察了我国上市公
是可操控性应计利润越少,经营现金流量 算,对公司盈利水平进一步修复与检验, 司的盈余质量问题。他们认为,盈余质量
Yohn 等则认为,会计盈余中的现金比应 量。”另外,秦志敏认为, “盈利质量是公司 则值得怀疑。主营业务利润占利润总额比
计利润具有更高的信息含量,并以应计利 盈利水平的内在揭示,是在盈利能力评价 重只是盈余持续性分析中的一个指标,以
润与经营现金净流量的比值来判断盈余 的基准上,以收付实现制为计算基础,以 此来估计盈余持续性,显然比较粗糙。
培训看作是一项看不见摸不着的消费性事情;
4、健全培训体系。培训是提高员工素质的
(2)技术理论知识与实践相脱节。不少技工虽 重要途径。在各种投资中,对人员的培训投资
然有丰富的实际操作经验,但很难在理论上得 是最有价值和最富远见的。矿业企业应针对不
到提升;(3)职工培训与实际工作相脱节。有些 同类型的员工给予不同内容和不同方式的培
企业喜欢用一年办了多少培训班、培训了多少 训。(1)对企业管理人员的培训。企业管理人员
盈余质量分析报告

盈余质量分析报告盈余质量分析报告一、引言盈余质量是指企业所报告的盈余是否真实、可靠和可持续。
通过对企业的盈余质量进行分析,可以帮助投资者评估企业的经营状况和财务健康,并作出投资决策。
本报告将针对某企业的盈余质量进行分析,并提供相关建议。
二、盈余质量分析1. 盈余质量指标(1)盈余稳定性:通过对企业过去几年的盈余情况进行分析,可以评估企业盈余的稳定性。
如果企业的盈余变动幅度较小,则说明企业具有较好的盈余稳定性。
(2)盈余质量:盈余质量可以通过净利润与现金流量的关系来衡量。
如果企业的净利润大部分可以转化为现金流量,则说明企业的盈余质量较高。
(3)财务透明度:财务透明度是指企业披露的财务信息是否充分、准确和透明。
如果企业披露的财务信息具有较高的可理解性和可比性,则说明企业具有较高的财务透明度。
2. 盈余质量分析方法(1)对比分析:通过对企业过去几年的财务数据进行对比分析,可以发现盈余变动的趋势和原因。
(2)现金流量分析:通过分析企业的现金流量表,可以评估企业的盈余质量。
如果企业的盈余能够转化为现金流入,则说明企业的盈余质量较高。
(3)财务报表分析:通过对企业的财务报表进行综合分析,可以发现盈余操纵的迹象,从而进一步评估盈余质量。
三、盈余质量分析结果通过对某企业的盈余质量进行分析,得出以下结论:1. 盈余稳定性较差:某企业的过去几年的盈余波动较大,没有明显的趋势。
这可能是由于企业所在行业的竞争激烈,导致盈余的不稳定。
2. 盈余质量较低:某企业的净利润与现金流量的关系较弱,大部分盈余不能转化为现金流入。
这可能是由于企业存在较多的坏账、存货堆积等问题,导致盈余质量较低。
3. 财务透明度较高:某企业披露的财务信息具有较高的可理解性和可比性,企业的财务透明度较高。
四、建议针对以上盈余质量分析结果,本报告提出以下建议:1. 提高盈余稳定性:某企业应加强内部控制,降低经营风险,提高盈余的稳定性。
例如,加强供应链管理,降低原材料成本,提高产品质量,提升客户满意度。
盈余质量的定量分析【外文翻译】

外文文献翻译一、外文原文原文:Quantitative analysis of earning quality Earnings quality analysis has long been known as the qualitative investment manager’s best defense against low quality financial reporting. While not widely known, recent academic and proprietary research shows that earnings quality metrics are also useful in generating alpha in the context of quantitative investment and trading strategies.The Gradient Analytics Earnings Quality Model (EQM) is the first quantitative factor that objectively measures earnings quality across a broad spectrum of companies for both longer-term (3-12 month) and shorter-term (1-3 month) holding periods. The model was developed using rigorous statistical methods to ensure a robust factor that generates excess returns on a standalone basis while also capturing a unique dimension of returns not captured by other quantitative factors. The end product is a highly unique factor with exceptional returns and low correlation in relation to other commonly used factors such as those derived from estimate revisions, earnings momentum, price momentum, cash flow, corporate insider, growth and value.The U.S. accounting profession and the Securities Exchange Commission (SEC) have worked diligently through the years to develop the most rigorous system of accounting procedures in the world. Nevertheless, there is still a significant gap (appropriately called the expectations gap) between what investors and creditors expect and what the accounting profession can deliver.The expectations gap exists in part because publicly traded companies have a great deal of discretion in choosing accounting principles and in making estimates that impact their reported financial results. Under Generally Accepted Accounting Principles (GAAP), the amount of discretion that a company has in preparing financial statements is controlled by two fundamental principles of accounting: conservatism and objectivity. However, in reality these two guiding principles are often stretched to the limit or ignored.When Conservatism or Objectivity is Impaired, Earnings Quality is CompromisedWhile, in theory, a firm’s accounting staff should employ procedures that are objective and conservative, in practice, management has many competing motivations that drive their choice of accounting policies and influence their periodic estimates. Because of these competing motivations, many companies manipulate accounting numbers in order to facilitate the financial reporting goals established by management. In this regard, virtually all firms working within the bounds of GAAP use minor accounting “gimmicks” to present financial results in a particular light (i.e., overstate or understate their true profitability or financial condition). Micro Strategy, Inc., for example, (1999-2000) was using an aggressive revenue recognition policy that, while not in violation of GAAP, tended to overstate the company’s true profitability. However, it wasn’t until the SEC mandated a change in the way that technology companies account for contract revenue that the market ascertained the extent of the overstatement (although access to earnings quality analysis –qualitative or quantitative –would have revealed the deception prior to the change in accounting rules). After the SEC mandated change, Micro Strategy was twice forced to restate its earnings and its shares fell over 98% in the ensuing 12-month period.While Micro Strategy’s treatment of contract revenues was very aggressive, arguably it was operating in a gray area of GAAP. In more extreme cases, however, some companies go so far as to commit fraudulent acts that materially misstate their financial statements in ways that do not conform to GAAP. For example, Enron used an extremely aggressive scheme of off-balance-sheet financing in order to hide mounting losses. The end result was arguably one of the most spectacular financial reporting disasters in history. Those unlucky enough to hold Enron shares during this period lost close to 100% of the value of their investment.Finally, while intentional manipulation of accounting numbers is common, earnings quality problems are not always the result of intentional acts by management. For example, the quality of inventories at Lucent Technologies (as reported in their first quarter 10Q filed May 2000) suggested an apparent backlog of inventory that indicated a possible slowdown on the horizon. In all likelihood, this was (at least initially) a case of earnings quality problems resulting from unintentional acts (slow sales). Nevertheless, Lucent’s earnings continu ed to disappoint and the stock was down more than 85% in the ensuing twelve months. (Subsequent evidence suggeststhat there may also have been some intentional misstatements on the part of lucent management in order to hide the magnitude of the sales slowdown.)How do companies manipulate earnings?Despite the efforts of the accounting profession to ensure objectivity and conservatism, it is still relatively easy to manipulate accounting numbers through either unethical (but not necessarily illegal) and/or fraudulent means. The list presented below provides a high level overview of how Management can manipulate accounting numbers.1. Recording fictitious transactions or amounts2. Recording transactions incorrectly3. Recording transactions early4. Recording transactions late5. Misstating percentages or amounts involved in a transaction6. Misstating the amounts of assets or liabilities7. Changing accounting methods or estimates for no substantive reason8. Using related party transactions to alter reported profitsAcademic Research on Earnings Quality and Future ReturnsIn addition to the anecdotal evidence provided by qualitative earnings quality services (i.e., those that use subjective evaluations of financial statements to render an earnings quality grade), academic research also supports the notion that quantitative models of earnings quality can be used to earn excess returns. The following brief review of the academic literature highlights some of the most important factors that form the basis for G radient’s approach to quantitatively modeling earnings quality and forecasting related excess returns.The very first studies to investigate issues related to earnings quality were conducted by G. Peter Wilson of Harvard University (1986, 1987) using an event study methodology. Wilson’s key conclusions are that operating cash flows and total accruals (i.e., changes in current accruals plus non current accruals) are differentially valued and that both are value relevant. That is, the market appears to react to the disclosure of detailed cash flow and accrual data (value relevance) and that cash flowsare more highly valued than accruals (differential valuation). Wilson’s basic findings are also supported by a number of studies that use an association methodology7, including Rayburn (1986), Bowen, Burgstahler and Daley (1987), Chariton and Katz (1990), Levant and Zeroing (1990), Vickers (1993), Ali (1994), Pfeiffer et al. (1998), and Vickers, Vickers and Betties (2000).The fact that the market values a dollar of cash flow more than a dollar of current or non current accruals implies that higher levels of accruals are indicative of lower quality of earnings. In other words, the degree to which a company must rely on accruals to boost net income results in lower quality earnings. Nevertheless, it is possible that the market “sees through” the deception and appropriately values companies based on some notion of baseline or sustainable earnings. However, the first studies to investigate this issue (Sloan, 1996 and Swanson and Vickers, 1997) find that, contrary to the efficient markets hypothesis, disaggregating earnings into cash flow and accrual components is useful in identifying securities that are likely to outperform (or under- perform) in the future. Thus, the results of these studies imply that security prices do not fully reflect the information contained in the cash flow and accrual components of earnings.Following in the path of Sloan (1996) and Swanson and Vickers (1997), academic researchers are currently focusing on the development of simple empirical models that objectively assess earnings quality in order to predict future return performance. (See, for example, Sloan, Solomon and Tuna, 2001; Chan, Chan, Legatees and Lakonishok, 2001; and Penman and Zang, 2001.) Table 1 below summarizes the results of recent academic working papers that focus on the predictive ability of simple earnings quality models. As shown in the table, these studies find that companies with relatively high (low) levels of accruals tend to under-perform (outperform) for periods of 12-36 months after the disclosure of detailed financial data. Specifically, the return spread between stocks with the highest level of accruals (lowest earnings quality) and the lowest level of accruals (highest earnings quality) ranges from 8.8% to 21.7%, depending on the approach used by the authors in forming portfolios. The implication is that measures of earnings quality can be used informing profitable investing and trading strategies.Gradient An alytics’ Earnings Quality ModelThe latest academic research demonstrates that the market does not fully impound information about earnings quality at the time that detailed financial statement data are released. That is, a statistically-based approach to analyzing earnings quality can yield profitable investment and trading strategies. Thus, the next step was to develop a robust model that is designed to optimize the excess returns that can be realized from an earnings quality strategy. The Gradient Analytics Earnings Quality Model (EQM) has been developed to achieve this goal.The Gradient EQM is the first quantitative factor that measures earnings quality across a broad spectrum of companies. The EQM provides two weekly scores ranging from 1 (strong sell) to 8 (strong buy) for each of the top 5000 companies ranked by market capitalization. The Long-Term Score provides a 1-8 ranking based on a stock’s expected future performance over a 3-12 month holding period. The Short-Term Score ranks each stock based on its expected future performance over a 1-3 month holding period.In contrast to competing, commercially-available earnings quality services, the output from the EQM is derived objectively –not subjectively –through statistical analysis of accrual and cash flow components of earnings. The model was developed using rigorous statistical methods to ensure a robust factor that generates excess returns on a standalone basis while also capturing a unique dimension of returns not captured by other quantitative factors. More specifically, the model was constructed using a multiple regression approach (including repressors from academic research and our own theoretically sound proprietary earnings quality constructs) estimated in pooled time series, cross section for 13 sector categories.8 Each separate sector model incorporates the most important dimensions of earnings quality for that segment of the market.9 When considered together, these dimensions or “sub-factors” provide a means of reliably ranking firms monotonically according to both their expected mean and median excess returns. The end product is a highly unique factor with exceptional returns and low correlation in relation to other commonly used factors.All Gradient models are developed using a disciplined scientific approach. Our approach can be characterized as follows:Variable Specification – We begin by carefully specifying each variable to ensureproper measurement and scaling. When more than one specification is defensible, we choose the simplest specification on the theory that simplicity will yield more generalizable results.Modeling Techniques –Each model is estimated using relatively simple linear and nonlinear regression techniques. Again, we believe that simplicity is the key to generalizability.Sensitivity Analyses –All models are subjected to sensitivity analyses to determine whether or not our results are impacted by outliers, changes in regimes, alternative variable specifications and modeling techniques, and so on.Proper Use of In-Sample and Out-of-Sample Periods – Each model is estimated using data from a strict in-sample period. The model is then tested (for generalizabity, stability, and so on) in an out-of-sample period.Control for Potential Threats to Internal and External Validity –Our research efforts are designs to control for common threats to internal and external validity in financial engineering studies (such as survivorship bias, hindsight bias, selection bias, and so on).ConclusionEarnings quality analysis is often regarded as the qualitative investment manager’s best defense against low quality financial reporting. The latest academic research also demonstrates that the market does not fully impound information about earnings quality at the time that detailed financial statement data are released. That is, a statistically-based approach to analyzing earnings quality can yield profitable investment and trading strategies. The Gradient Earnings Quality Model (EQM) has been developed to achieve this goal.The EQM is the first quantitative factor that objectively measures earnings quality for the purpose of forecasting future returns. The model was developed using rigorous statistical methods to ensure a robust factor that generates excess returns on a standalone basis while also capturing a unique dimension of returns not captured by other quantitative factors. The end product is a highly unique factor with exceptional returns and low correlation with other commonly used factors.The Earnings Quality Model has been extensively back-tested across a variety of stock universes and time periods in order to ensure optimal, generalizable results. The results presented in this white paper provide extremely strong evidence on the usefulness of the EQM. As shown in the results section of this document, the modelproduces highly significant excess returns, performs extremely well both in- and out-of-sample, and has a low correlation with other commonly used quantitative factors. And, in contrast to competing, commercially-available earnings quality services, the output from the EQM is derived objectively – not subjectively – through statistical analysis of accrual and cash flow components of earnings.Source: gradient analytics, 2005. “Quantitative analysis of earning quality”.[EB/OL] – website. March, pp.23-25.二、翻译文章译文:盈余质量的定量分析盈余质量分析长时间被认为是定性投资经理针对低质量财务报告的最佳防卫。
盈余质量的分析研究完整版

盈余质量的分析研究Document serial number【NL89WT-NY98YT-NC8CB-NNUUT-NUT108】中国上市公司盈余质量的分析研究1张瑶(中山大学管理学院会计学系 510275)[摘要]中国市场经济体系的不断完善使得会计信息越来越被其使用者关注,盈余作为会计信息的重要组成部分更是日益成为证券关注的焦点。
理性的使用者不仅应当关注盈余的数量,还应关注盈余的质量。
本文的研究目的在于分析我国上市公司盈余质量随时间变化有无提高。
笔者首先从理论上探讨了盈余质量的定义和属性,回顾了检验盈余质量的常用模型,并构建了一套衡量我国上市公司盈余质量的模型,然后对我国1994-2004年所有A股上市公司样本进行了回归分析和假设检验。
研究结果发现在我国资本市场盈余价值相关性不强;盈余的总体质量并没有随时间改变而展现出明显一致的提高趋势。
最后,本文对可能影响盈余质量变化的会计准则、宏观经济环境、法律环境等因素进行了讨论。
[关键词] 盈余盈余质量证券市场一、绪论(一)研究目的20世纪30年代以后,会计信息披露的中心由资产负债表转向了利润表,盈余(或收益,在本文中两者无区别)日益成为证券关注的焦点。
在针对会计盈余展开的大量研究中,许多实证研究都表明相对于其他公司经营业绩的衡量标准来说,投资者更多地依赖于盈余信息(Biddle et al. 1995;Francis et al. 2003;Liu et al. 2002)。
投资者通常根据会计盈余给股票定价,因为盈余水平和盈余变动可以反映投资者能够辨别并据以进行适当定价的、与公司目前及未来经济价值创造能力有关的信息(Hawkins,1998)。
管理者同样将盈余看作是投资者和分析师评估公司价值的关键尺度(Graham et al. 2003)。
在Hirst 和Hopins(2000)设计的一个研究分析师评估活动的有趣实验中,分析师对盈余信息的关注也是显着的,但是他们对盈余质量的关注并不显着,他们不能很好的识别盈余管理。
海尔跨国并购GE家电财务绩效分析及启示

1、市场份额扩大
通过并购GE家电,海尔迅速获得了在美国市场的渠道和品牌影响力。根据市 场研究机构的数据,海尔在美国家电市场的份额迅速上升,成为美国市场的重要 参与者。
2、技术创新能力提升
2、技术创新能力提升
并购后,海尔获得了许多先进的家电技术和专利,使其在家电领域的创新能 力得到显著提升。这使得海尔在家电市场竞争中更具优势,为其在国内外市场的 持续发展提供了有力支持。
参考内容
内容摘要
随着中国经济的快速发展和全球化的深入推进,越来越多的中国企业开始走 出国门,进行跨国并购。在家电行业,这一趋势同样明显。本次演示以海尔并购 GE家电为例,对中国家电企业跨国并购的动因及绩效进行分析。
一、海尔并购GE家电的动因
1、市场扩张需求
1、市场扩张需求
在国内市场竞争压力日益增大的背景下,中国家电企业寻找新的发展空间成 为必然选择。海外市场具有更广阔的市场空间和较高增长速度,成为我国家电企 业扩大市场份额的有利途径。海尔通过并购GE家电,迅速获得了进入美国市场的 渠道,扩大了其在国际市场的影响力。
2、并购后整合与协同的重要性
2、并购后整合与协同的重要性
并购完成后,海尔集团与通用电气家电业务进行了全面的整合和协同。这种 整合不仅包括财务指标的提升,更重要的是实现了企业文化、管理体系、品牌资 源、渠道资源等方面的协同效应。这种协同效应使得海尔集团在全球市场的竞争 力得到了显著提升。对于其他中国企业来说,在进行跨国并购时,不仅要注重并 购过程中的谈判和交易,更要重视并购后的整合与协同工作,以实现真正的价值 提升。
3、品牌影响力提升
3、品牌影响力提升
通过并购具有全球影响力的品牌,海尔迅速提升了自身在全球范围内的品牌 影响力。这使得海尔在国际市场上更容易被消费者接受和认可,为海尔的国际化 战略提供了有力支持。
GE矩阵案例范文
GE矩阵案例范文GE(通用电气)是一家跨国科技企业,提供范围广泛的产品和服务,涉及电力、航空、医疗、工业、金融等领域。
GE矩阵(也称为BCG矩阵)是一种常用的战略管理工具,用于分析公司业务组合,并确定哪些业务应该投资、哪些业务应该终止或剥离,以及哪些业务应该持续发展。
下面是一个关于GE矩阵的案例范文,以GE公司的业务为例,具体分析了其各个业务的市场增长率和市场份额,以及相应的战略建议。
GE公司是一家全球领先的多元化科技企业,拥有包括电力、航空、医疗、工业和金融等多个业务。
为了更好地管理其业务组合,我们可以使用GE矩阵来进行业务分析和制定相应的战略建议。
首先,我们需要确定每个业务的市场增长率和市场份额。
根据市场调研数据和公司内部数据,我们可以得到以下数据:业务市场增长率(%)市场份额(%)电力312航空510医疗88工业215金融120根据这些数据,我们可以在GE矩阵中将各个业务定位在不同的象限。
首先,将市场份额为横轴,市场增长率为纵轴,绘制出一个正方形的坐标系。
然后,在坐标系中,确定四个象限的分界线。
一般来说,横竖坐标轴交点的上半部分为“高增长高份额”象限,横坐标右半部分为“低增长高份额”象限,纵坐标上半部分为“高增长低份额”象限,下半部分为“低增长低份额”象限。
根据我们的数据,将各个业务的市场增长率和市场份额对应的点标注在矩阵中。
然后我们可以根据这些数据确定每个业务的定位。
根据数据和分析,我们可以得出以下结论:1.电力业务位于“低增长低份额”象限。
尽管电力是GE公司的核心业务之一,并且具有相对较高的市场份额,但市场增长率较低。
在这种情况下,我们建议继续保持电力业务的运营,并寻找增长机会,比如在可再生能源领域进行更多投资。
2.航空业务位于“低增长高份额”象限。
航空业务市场份额较高,但市场增长率也相对较低。
在这种情况下,我们建议继续巩固现有的市场份额,并加大研发和创新力度,以寻找新的增长机会。
3.医疗业务位于“高增长低份额”象限。
盈余质量研究探讨(上)——对Dechow-Ge-Schrand(2010)文献综述的评介
一
根 据 D S 的 定 义 , 较 高 的 盈 余 质 量 G “
、
引 言
是指 提 供 了 与特 定 决 策者 制定 的特定 决
策相 关 的关 于 企业 财 务业 绩特 征 的更 多
21 0 0年 1 2月 , e hw、 e和 S had D co G c rn
满 意一 诚 关 系 的影 响【】 理 世 界 ,0 6年 第 4期 忠 J. 管 20
4增强 信用卡 的安全性 .
安 全 性 也 是 青 年 人 群 比 较 关 注 的 属 性 。针 对 中 国 信 用 卡 市 场 尚 处 于 发 展 时 期 , 在 着 一 些 安 全 问 题 , 国 信 用 卡 市 场 应 该 摒 存 中
务 业 绩 以 及 反 映 了 财 务 业 绩 的 哪 些 特 征 。 因 为 报 告 盈 余 只 是 一 个 综 合 反 映 财
关 键词 : 盈余 质量 ; 盈余 管理 ; 失确 损
认 及 时 性 ; 余 反 应 系数 ; 务 重 述 盈 财
务业 绩 的数 字 ,但是 企 业 的财 务 业绩 却 包 括 许 多要 素和 特征 ,这 些要 素和 特 征
与 管 理 .9 6年 第 6期 19
3开发 免年费 的信用卡 产品 .
[] 菲利 普科特 勒. 3美. 营销 管理— —分 析 、 计划 、 执行 和控 制【 . M]上
海 : 海 人 民 出版 社 ,0 1 上 20
商业银行应该在其盈利性的基础上尽量满足消费者的需求,
青年人 群在如何 免年费这 个属 性上特 别看 重 , 商业 银行 应针青 年 人群开 发出免收 年费 的信用卡 , 以促进 潜在 的办卡 人群 办理使 用
盈余质量评价体系研究
盈余质量评价体系研究作者:张健来源:《财会学习》 2018年第9期摘要:我国投资者受到众多因素的干扰对上市公司盈余质量的识别不易,本文从盈余质量静态和动态两个状态结合为复杂状态指标,旨在建立传统盈余报酬模型下的主成因综合评价模型考察单体上市公司处于行业中的盈余质量水平。
关键词:盈余质量;基本信号;评价体系资本市场中上市公司的质量影响着资本市场资源配置效率,而会计盈余具有较高的经营信息含量已经得到了广泛的认可(Chen and Dodd,2001;Biddle etc,1997,1999;王化成等,2004),会计信息质量特别是盈余信息质量,对于那些使用财务报告用于签订契约或做出投资决策的人来说是非常重要的。
但是由于证券市场中的信息不对称性,外部投资者无法有效考察上市公司盈余质量而盲目借助于表面上的报告盈余数字做出决策导致产生非预期的财富转移,使得盈余数据具有了神奇的色彩。
这种现实既不利于投资者和其他有关利益集团的正确决策,也不利于证券市场资源的优化配置。
一、传统理论研究基础Coase(1937) 提出企业存在的本质就是对市场价格机制的代替,在市场中价格机制引导着资源的优化配置,但利益相关者的心理预期降低了企业作为一种半公共产品的选择性。
国内外相关学者对盈余质量评价的研究脉络大致经历了盈余质量定义阶段——盈余质量单一特征计量阶段——盈余质量经济后果计量阶段——盈余质量综合评价阶段。
对于盈余质量综合评价的研究经典代表作,J Ou and SH Penman(1989) 构造了一个由68 个财务变量组成的统计指标Pr( 未来盈余增加的概率)。
Lev andThiagarajan(1993) 从核心价值驱动因素( 盈余、风险、成长性和竞争力) 选取了12 个基本财务指标变量构建盈余质量的综合分析模型。
此后众多学者对这两篇典型的文献进一步引申研究,一类是事件研究法,即将盈余公告看成一个观察时窗,在公告日前后截取一个观察时窗,然后就这一时窗内的市场反应进行研究,判断盈余公告事件是否具有信息含量。
盈余质量:定义及衡量指标
盈余质量:定义及衡量指标摘要:本文通过对国外文献的综述整理了常见的盈余质量定义,并描述了常见的盈余质量衡量指标,如盈余持续性;应计项目;盈余反映系数(erc)或者将erc与其他构成如审计质量联系起来等。
同时考虑了未来可能的研究方向,为日后使用盈余质量进行实证研究打下了基础。
关键词:盈余质量;衡量指标;定义1.盈余质量的定义一些学者认为盈余质量是对经济交易和事项的准确陈述(即对企业业绩的如实表述)。
基于会计信息的决策有用性观点,美国fasb 的前主席katherine将盈余质量定义为公司报告盈余忠实于经济学盈余定义的程度。
patricia dechow , weilige,和catherine schrand认为高质量的盈余反映了更多与特定决策者做出的决策有关的企业财务表现的特征的信息。
schipper,vincent,chan和hodge 定义盈余质量是净收益与真实盈余的差别程度。
另一些学者则从盈余属性的角度充分考虑盈余质量的定义。
dechow和schrand(2004)认为,盈余的高质量必须具备满足以下三个条件:第一反映现在财务的运营状况;第二是采用未来运营指标来预测状况;第三是如实反映内在企业价值。
2.衡量指标2.1盈余持续性很多关于持续性的研究专注于盈余对投资者的有用性,并且建立了模型来对其进行估计。
sloan在1996年的研究中将模型一中的总盈余分解成了现金流和总应计两个部分,同时还证明现金流部分的盈余比总应计部分的盈余要稳定。
关于稳定性的其他研究有还有:lev在1983年的研究中将稳定性与产品类型、行业竞争、资本紧张与公司规模联系起来。
其他的类似研究包括研究一个采用差异化战略有着低利润和高营业额的企业是否会比采用成本导向型战略有着高利润低营业额的企业有更稳定的盈余。
总的说来利用技术来制造一个准入障碍使得行业内的企业可以以低成本来销售自己的产品比制造独一无二的产品来赚取高利润要更稳定。
成本导向型的优点依赖于企业在行业内的经营情况、竞争情况、成长情况以及成本比例。
盈余质量对投资者决策的影响研究
盈余质量对投资者决策的影响研究一. 引言盈余质量是财务报表中一个重要的指标,直接影响着投资者对于公司的评估和决策。
本文旨在探讨盈余质量对于投资者决策的影响,并提供一些研究结果和观点支持。
二. 盈余质量的定义与指标盈余质量泛指公司盈余的可靠性和可持续性。
颇具代表性的指标有盈余稳定性、盈余管理程度以及盈余质量。
盈余稳定性反映了公司盈余的波动程度,盈余管理程度则突出了公司在报告盈余时是否使用了合理的会计政策。
而盈余质量则综合了以上两个指标。
三. 盈余质量对投资者决策的影响3.1 影响投资决策的因素在投资决策过程中,投资者会综合考虑多种因素,如财务状况、业绩表现以及未来发展潜力等。
而盈余质量则是这些因素中的关键之一,其对于判断一个公司的健康程度和长远前景非常重要。
3.2 盈余质量与公司价值关系的研究研究表明,较高的盈余质量往往与较高的公司价值正相关。
这是因为盈余质量代表了公司披露的信息的可靠性,能够有效降低投资者的信息不对称,提高投资者的决策准确性和信心。
3.3 盈余质量与市场反应关系的研究一些学者通过实证研究发现,公司盈余质量的提高往往能够引起市场的积极反应。
高质量的盈余可以弥补投资者的信息不确定性,增强市场对于公司未来前景的乐观预期,从而推动股价上涨。
四. 盈余质量评估的方法与挑战4.1 盈余操纵的挑战由于财务报表的编制过程存在某些灵活性,公司可能会通过盈余操纵等手段来影响盈余质量的呈现。
因此,评估盈余质量时需要提高警惕,以防止受到虚假和不准确的信息干扰。
4.2 盈余质量评估方法的选择为了准确评估盈余质量,研究者们提出了多种评估方法,如盈余质量模型、财务比率分析等。
每种方法都有其优势和局限性,研究者应该根据实际情况选择适用的方法。
五. 盈余质量的可持续性分析5.1 盈余质量的变化趋势盈余质量的可持续性是投资者关注的重点之一。
通过对公司历史财务数据和未来展望的分析,可以预测和评估盈余质量的可持续性,并为投资者提供更准确的决策依据。
盈余质量不确定性与投资者短期回报
盈余质量不确定性与投资者短期回报摘要:文章利用2007年到2010年的上市公司数据,研究盈余质量的不确定性对投资者短期回报的影响。
研究发现,盈余质量不确定性越大,投资者盈余公告期累计超额回报越小。
研究进一步将盈余质量不确定性分为由经营环境不确定性引起的固有不确定性和由管理层操控引起的操控不确定性,发现固有不确定性对投资者短期回报的影响大于操控不确定性。
关键词:盈余质量不确定性;投资者短期回报;固有不确定性一、盈余质量不确定性的概念阐述Dechow等在其2010年发表的文献综述中提出了较为全面的盈余质量定义:高质量的盈余向决策者提供了更多的关于公司财务绩效相关的投资决策信息。
Lev(1989)针对资本市场的投资决策,将盈余质量定义为盈余信息预测投资者未来回报的能力。
由此可见,这些盈余质量的定义反映了现有研究主要关注盈余质量的期望值,并未考虑盈余质量的不确定性。
然而,在现实过程中,投资者判断盈余质量有时是非常困难的,主要有两点原因。
第一,判断盈余质量对投资者来说是一个极其困难的过程。
投资者需要根据之前对于公司盈余质量的了解,或者需要搜集和分析公司的盈余报告对公司的盈余质量予以判断。
但由于投资者获取的信息比较有限并且投资者对信息的分析能力不强,投资者都可能对盈余质量的判断存在不确定性。
第二,公司的盈余质量并不一定完全稳定,公司的盈余质量忽高忽低,使得投资者对盈余质量的判断存在不确定性。
以上两点说明,投资者在判断盈余质量的过程中存在不确定性。
因此,盈余质量就应当同时包括盈余质量水平和盈余质量不确定性两个因素。
与盈余质量不确定性相关的概念是信息不确定性(Zhang,2006;Jiang,Lee & Zhang,2005;于李胜和王艳艳,2006)。
信息不确定性主要是指预测企业未来价值的新信息所带来的不确定性,主要包括企业基本面的波动性和信息质量两个方面。
根据这一概念,Francis等(2007)提出,可以将盈余质量可以作为信息不确定性的替代变量,认为盈余质量越高,信息不确定性越小。
gep指标范文范文
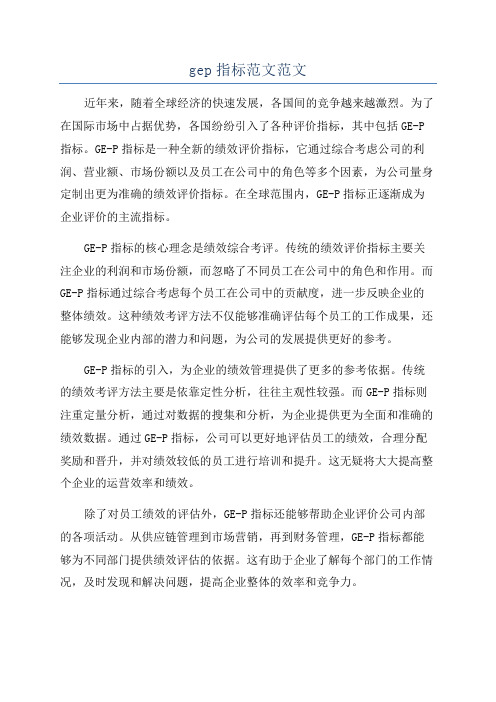
gep指标范文范文近年来,随着全球经济的快速发展,各国间的竞争越来越激烈。
为了在国际市场中占据优势,各国纷纷引入了各种评价指标,其中包括GE-P 指标。
GE-P指标是一种全新的绩效评价指标,它通过综合考虑公司的利润、营业额、市场份额以及员工在公司中的角色等多个因素,为公司量身定制出更为准确的绩效评价指标。
在全球范围内,GE-P指标正逐渐成为企业评价的主流指标。
GE-P指标的核心理念是绩效综合考评。
传统的绩效评价指标主要关注企业的利润和市场份额,而忽略了不同员工在公司中的角色和作用。
而GE-P指标通过综合考虑每个员工在公司中的贡献度,进一步反映企业的整体绩效。
这种绩效考评方法不仅能够准确评估每个员工的工作成果,还能够发现企业内部的潜力和问题,为公司的发展提供更好的参考。
GE-P指标的引入,为企业的绩效管理提供了更多的参考依据。
传统的绩效考评方法主要是依靠定性分析,往往主观性较强。
而GE-P指标则注重定量分析,通过对数据的搜集和分析,为企业提供更为全面和准确的绩效数据。
通过GE-P指标,公司可以更好地评估员工的绩效,合理分配奖励和晋升,并对绩效较低的员工进行培训和提升。
这无疑将大大提高整个企业的运营效率和绩效。
除了对员工绩效的评估外,GE-P指标还能够帮助企业评价公司内部的各项活动。
从供应链管理到市场营销,再到财务管理,GE-P指标都能够为不同部门提供绩效评估的依据。
这有助于企业了解每个部门的工作情况,及时发现和解决问题,提高企业整体的效率和竞争力。
然而,GE-P指标的推广和应用仍然面临一些困难和挑战。
首先,GE-P指标的数据收集和分析需要一定的专业知识和技术支持,企业可能需要花费较大的成本来建设和培养相关团队。
其次,GE-P指标的推广需要企业的高层管理人员的理解和支持,只有他们能够真正认识到GE-P指标对于企业绩效提升的重要性和价值,才能倡导和推动GE-P指标的应用。
因此,企业需要在推广GE-P指标之前,做好相关的准备工作和宣传。
- 1、下载文档前请自行甄别文档内容的完整性,平台不提供额外的编辑、内容补充、找答案等附加服务。
- 2、"仅部分预览"的文档,不可在线预览部分如存在完整性等问题,可反馈申请退款(可完整预览的文档不适用该条件!)。
- 3、如文档侵犯您的权益,请联系客服反馈,我们会尽快为您处理(人工客服工作时间:9:00-18:30)。
Page 11
GE盈余管理——看我72变
财务盈余管理 •1993年GE出售其航空航天部时,获得14.3亿美元的税前收入,又 以“在世界范围内关闭、缩小、调整一些产品、服务和管理设 备”为由借机10.1亿美元,而两者的税后金额都大约在6.8亿美元 左右。
1
运营盈余管理
•2003 年 10 月,通用电气连续收 购了: 10 月 8 日, GE 签署了出资 约 140 亿 美 元 收 购 Vivendi Universal 影视资产的最终 协议 。 10 月 9 日, GE 完成了斥资 23 亿美 元收购芬兰医疗设备制造商 Instru—mentariu 的交易。 l0 月 10日, GE又用 95 亿美元收购英国 一家医疗诊断和生物科技公司 Amersham。
该观点强调的是养老金计划的经济实质而非法 律形式。由于企业最终负有偿付养老金的义 务,因此在会计处理中,企业应该将基金资产 与养老金给付义务在会计报表中加以反映。职 工已提供的服务所产生的企业养老金给付义务 在各期期末的现值即为养老金负债,养老金负 债随各期养老金费用的确认而增加。而基金组 织向退休职工发放的养老金反映为企业基金资 产和养老金给付义务的同时减少。企业各期向 基金组织的提存额反映为基金资产的增加。
实现利润 稳定增长
会计盈余管理
战 略 盈 余 管 理
Page 12
• GE不断并购和重组形成了始终良 好搭配的三层面产业(业务)组 合:第一层面,核心业务:直接影 响近期业绩,提供现金流维持企业 存在的业务;第二层面,增长业 务:正在崛起的新业务,具有高成 长性,有代替第一层面的潜力,并 将最终代替第一层面;第三层面, 种子业务:需要重点选择,精心培 养的项目。
2. 会计盈余与企业未来净现金流量数额、时间的匹配程度,体现盈余信息的 预测价值;盈余质量高的含义,应具备以下几个方面的特性:盈余结构与企业 发展战略的符合性、主营业务的核心性、盈余自身结构的协调性、盈余结构与 资产结构的匹配性、盈余结构与对应的现金流量结构的趋同性。
Page 3
高质量盈余的定义
待遇确定型模式是指雇员退休后按照与雇主的 约定,按照一定计算公式领取固定数量的养老 金。待遇确定型养老金一般由雇主定期注资。 这种方法因为基金增值水平不确定,所以缴费 通常也是不确定的。如果投资收益率高,可以 降低注资水平;投资收益率低,则要上调注资 比例。具体的计算通过精算确定。
缴费确定型
缴费确定型模式一般由雇主和雇员共同缴费, 每次缴费金额相同,未来收益不确定。待雇员 退休后,该养老金账户中的本金及投资收益归 雇员所有。在对养老基金进行投资计划时,可 以外包给投资机构进行投资或者个人参与投资 决策。雇员承担收益风险。
GE盈利表现(2002-2011)
收入与净利润 关键财务指标
200,000.0 180,000.0 160,000.0 140,000.0 120,000.0 100,000.0 80,000.0 60,000.0 40,000.0 20,000.0 02 03 04 05 06 07 08 09 10 11
Page 10
盈余管理
战略盈余管理
•战略盈余管理是指通过通盘的战略考虑与规划,辅之以会计政策选 择、运营模式选择和财务安排等多种手段,达到盈余管理的目的。
会计盈余管理
通过会计政策的合理选择使会计报表呈现期望的 结果。
. 财务盈余管理
通过财务活动(筹资、投资、分配等)的合 理安排使会计报表呈现出期望的结果。
盈余管理——养老金会计
待遇确定型 养老金概念 • 当期服务费用:因为员工在这一年中的工作而需 要向养老基金支付的费用。 • 预计结付义务:是指按退休金给付公式计算,将 截止特定日的未来应支付的所有退休金给付,折 算至该特定日的精算现值。若考虑到与未来薪资 水准有关的退休时,其预计给付义务的估计应以 未来薪资水准为基础。养老金负债就是企业承担 的养老金给付义务。 • 利息费用:对预计结付义务在本年度内的利息费 用。 • 基金资产的实际报酬:养老金资产就是企业按计 划规定提拨给基金组织并由其管理运营的资产, 其相应的实际报酬actual return=plan asset ending balance-beginning balance(contributions-benefits paid)。 • 未确认的净损益:预期收益和实际收益的差值计 入unexpected gain or loss,累计金额计入 Unrecognized net gains/losses。如果该部分金额 大于预计结付义务的10%,则需要按照活跃雇员 的剩余工作年限进行摊销。
盈余质量与投资效率: 从理论分析来看,公司提高盈余质量,可以从以下几个方面提高投资者的投 资收益:首先,高质量的盈余信息、反映了企业真实的财务状况,能够降低管 理者和投资者之间的信息不对称,从而使投资者能以更低的投资回报将资金 投入企业中,降低企业的筹资成本,提高企业的盈余水平;其次,高质量的盈 余信息能够使管理层对投资项目进行更合理的选择,避免投资不足和过度投 资,从而不断提升企业价值;最后,高质量的盈余信息能够向投资者传递企业 真实的信息降低信息风险。
Other Adjustments Prior Ser Cost Net act gain Pension Liability 1617 -12594 1132 699 -16850 981
Prepaid Pension Assets 11377 Total Asset 437006
9397 405200
FASB IFRS
Page 14
FASB第87号公告中采用倾向于资本化的一种方法,因此,这也成为美国会计界比较公认的 一种处理方法。并对确认的金额没有这样的限制 在养老金资产确认上的限制上,IFRS规定确认的养老金资产不能超过未确认的过去服务成 本、精算损失以及从该计划返还资金或减少对计划的未来提存金供款而得到的经济利益的 现值之总净额。
Page 5
现实中投资者是否解读了盈余质量
Page 6
现实中投资者是否解读了
信念
自创立之初,GE就致力将研究工具结合创意灵感开创未来世 界。GE这一独创性传统为我们创造出一部引以为傲的丰厚历 史,我们乐于将此与世界分享
GE
项目
领导
组成
Charles A. Coffin --The Thomson-Houston Company Thomas Alva Edison --Edison General Electric Company 合成体在1892年
Effect on asset
2.60%
2.32%
由于GE的养老金资产大于养老金负债,在资产 负债表上体现为一个正的预付养老金资产,该 资产在2000年占到GE总资产的2.6%。
Page 13
养老金会计处理
非资本化观点
资本化观点
在FASB第87号公告发布以前,关于养老金计 划的会计遵循非资本化方法。企业将基金组织 视为一个外在的独立经济实体,基金组织的资 产和企业的养老金给付义务并不在企业会计报 表中反映。职工在提供服务的期间,企业确认 当期养老金费用。只有当企业向基金组织提存 的资金与当期确认的养老金费用不一致时,才 在资产负债表中反映为一项资产或负债。基金 组织负责向退休职工发放养老金时,由于并不 直接影响企业的资产和负债,因此企业也不作 任何正式的会计记录。
• Tue, 20 Nov 2012 Twenty six percent of online adults discuss health information online; privacy cited as the biggest barrier to entry • Tue, 20 Nov 2012 Production Starts on GE’s High-Efficiency Topload Washing Machines, Creating 150 New U.S. Jobs
VS
GE的养老金会计
养老金计算过程
in millions 2000 Fair Value of assets Balance 49757 1999 50243
对于利润的影响
PBO Balance -28535 -25522
利润表方面,由于GE的养老金资产回报较高, 高于当期产生的养老金成本,在利润表上体现 为一个负的费用,即增加了总利润。
GE公司盈余质量分析
展示进程
Part 1: 高质量盈余 Part 2: 通用电器简介
Part 3: 盈余管理手段
Part 4: 盈余质量分析
Page 2
高质量盈余的定义
2002年度美国会计学会(American accounting association,AAA)召开盈 余质量研讨会,并在《会计评论》(The accounting review)杂志刊登了一 期以盈余质量研究为主题的增刊。即便如此,至今学术界仍未能对“盈余质 量”形成一个统一的定义。就国内的研究成果来说,对盈余质量这一概念的 定义主要是从规范分析和实证分析两个角度来进行的。 从规范研究角度进行的定义:周浪波(2002)认为,盈余质量包含两层含义: 1. 会计盈余与真实盈余的匹配程度,它取决于会计计价基础的适当性和会计 盈余确认过程中会计人员职业判断的中立性和适当性。
运营盈余管理
运营盈余管理是指通过运营模式(包括交易方式、定价、企业合并等)合 理安排使会计报表呈现期望结果。通常的运营盈余管理实现手段包括委托 经营、合作经营、关联交易、资产转让,但这四种手段往往以非公允的交 易价格(或合同条款)为基础才能达到影响会计报表的目的,往往滑入 “操作利润”的深渊,也是监管部门重点关注和打击的领域。
从实证研究角度进行的定义:储一昀、王安武(2000)从盈余与经营现金流 量联系的角度出发,考察了我国上市公司的盈余质量问题。他们认为,盈余 质量应当反映盈余的确认是否同时伴随相应的现金流入,只有伴随现金流入 的盈余才具有较高的质量,具体表现为以应计制为基础计算的有关盈余指标 数值与以现金制为基础计算的有关盈余指标数值的差异程度。二者之间的差 异越小,表明盈余质量越高;王化成、佟岩(2006)也与程小可(2004)持 类似观点,认为盈余质量应当是指盈余信息使用者的决策相关性,即根据当 期盈余(或盈余变动情况)预测公司未来市场回报的能力,并使用盈余反应 系数来度量这种能力。