布鲁克红外opus软件快速入门手册
红外光谱软件(OPUS)的Introduction说明书
Quick Reference Guide1st updated edition, April 2007© 2007 BRUKER OPTIK GmbH, Rudolf-Plank-Straße 27, D-76275 Ettlingen, All rights reserved. No part of this manual may be reproduced or transmitted in any form or by any means including printing, photocopying, microfilm, electronic systems etc. without our prior written permission. Brand names, registered trademarks etc. used in this manual, even if not explicitly marked as such, are not to be considered unprotected by trademarks law. They are the property of their respective owner.The following publication has been worked out with utmost care. However, Bruker Optik GmbH does not accept any liability for the correctness of the information. Bruker Optik GmbH reserves the right to make changes to the products described in this manual without notice.This manual is the original documentation for the OPUS spectroscopic software.Table of Contents1Starting OPUS . . . . . . . . . . . . . . . . . . . 11.1OPUS Access Control . . . . . . . . . . . . . . . . . . . .51.2Register OPUS . . . . . . . . . . . . . . . . . . . . . . . . . .62Working with OPUS . . . . . . . . . . . . . . 92.1Acquiring a Spectrum . . . . . . . . . . . . . . . . . . . .92.1.1Using OPUS-OS/2 Configuration Files . . . . . . . . . . . .92.1.2Setting up the Spectrometer Components . . . . . . . . . .92.1.3Setting up the Measurement Parameters . . . . . . . . . .102.1.4Calibrating the Interferogram Peak . . . . . . . . . . . . . .122.1.5Advanced Settings . . . . . . . . . . . . . . . . . . . . . . . . . . .142.1.6Background Measurement . . . . . . . . . . . . . . . . . . . . .162.1.7Sample Measurement . . . . . . . . . . . . . . . . . . . . . . . . .172.2Baseline Correction . . . . . . . . . . . . . . . . . . . . .192.3Data File History . . . . . . . . . . . . . . . . . . . . . . .242.4Saving Spectra . . . . . . . . . . . . . . . . . . . . . . . . .252.5Loading a Spectrum . . . . . . . . . . . . . . . . . . . . .272.6Printing the Spectrum . . . . . . . . . . . . . . . . . . .293Plot Layout Editor (PLE) . . . . . . . . . 313.1Starting PLE . . . . . . . . . . . . . . . . . . . . . . . . . .313.2Installing a Printer for Windows . . . . . . . . . . .323.3Defining the Print Area . . . . . . . . . . . . . . . . . .323.4Loading and Displaying a Spectrum . . . . . . . .333.5Attaching a Logo or Bitmap . . . . . . . . . . . . . .373.6Attaching Graphic Elements and Text . . . . . .383.7Saving Plot Layouts . . . . . . . . . . . . . . . . . . . . .39Bruker Optik GmbH OPUS Quick Reference Guide 11Starting OPUSBefore starting the OPUS installation, read the attached documentation.To install OPUS, insert the OPUS installation CD into your CD drive. Normally, the installation starts automatically. If the Windows Autostart option is disabled, you have to start the installation manually by running the Setup program from your CD.The installation program will guide you step by step. You only need to follow the on-screen installation instructions shown in the different dialog boxes.At the end of the installation procedure you will be asked to restart the computer.Note that you need to restart your computer in order to complete the OPUS instal-lation. You may also be prompted to restart your computer when you install differ-ent program components. In such a case do not restart until the OPUS setup has been completed!When the installation has been finished, an OPUS program icon is displayed in the Windows Start menu. Click on this icon to start OPUS.The Login dialog box opens. Select your User ID from the drop-down list. OPUS provides an independent user account system which regulates the access. If you use OPUS for the first time, the User ID drop-down list includes the two pre-defined user records Default and Administrator. Select either one of them.Enter OPUS in the Password entry field. The password is case sensitive. Once you have assigned yourself a user record in OPUS, it is possible to determine your own User ID and Password.Figure 1: Windows Start MenuStarting OPUSFigure 2: OPUS LoginOPUS includes different accounts for operator and administrator rights. Users de-fined as Operator have limited access rights compared to users defined as Adminis-trator. The rights depend on the User ID selected.The Assigned Workspaces identify the user interface and access right. You can al-ways select those workspaces from the drop-down list which have been defined for your User ID. When you use OPUS for the first time, we recommend not to change the standard Default.ows workspace.Click on the Login button and the About OPUS window opens.This window shows the serial number of your OPUS copy and the name of the lic-ensee. Available OPUS packages can be selected from the drop-down list. The basic OPUS package integrates these additional licensed packages as an all-in-one appli-cation.2OPUS Quick Reference Guide Bruker Optik GmbHFigure 3: About OPUSClick on OK to open the OPUS user interface. The interface appearance depends on the screen settings and operating system used. Thus, the screen display of the fol-lowing dialog boxes may not show exactly the screen contents displayed on your screen.BRUKER recommends a minimum graphic resolution of 800x600 pixel and true color.Bruker Optik GmbH OPUS Quick Reference Guide 3Starting OPUS4OPUS Quick Reference Guide Bruker Optik GmbHThe OPUS user interface header shows the type and status of the operator currently logged in.A)Menu bar: the pull-down menus can be used to access all OPUS com-mands.B)Icon bar: can be configured to quickly access frequently-used com-mands.C)Browser window: files are displayed similar to the Windows Explorer.D)Spectrum window: for full views and zoom operations.E)Overview window: always displays the full frequency range of the se-lected data files.F)Online help: context sensitive.G)Status bar: indicates tasks which performs in the background.H)Instrument status:Gray: No spectrometer connectedGreen: Spectrometer connectedYellow: WarningRed: ErrorAll settings (menus or icons) are individually configurable and will be reloadedwhen you start OPUS next time.ABCDEF GHFigure 4: OPUS User InterfaceOPUS Access Control 1.1OPUS Access ControlOPUS has an access control mechanism which is shown in the graph below.Figure 5: OPUS Access Control DiagramThe OPUS User Database includes all User Records. The User Records comprise:•User ID•Password•Operator Name•User Group (Administrator, Operator)•Accessible WorkspacesThe Workspaces comprise:•Menu Contents•Toolbar Contents•Access Rights within OPUS•Other Settings (e.g. file increment mode, display limits)Details about the User Management functions to add, modify or remove users from the User Database are described in the OPUS Reference Manual.Bruker Optik GmbH OPUS Quick Reference Guide 5Starting OPUS6OPUS Quick Reference Guide Bruker Optik GmbH 1.2Register OPUSYou can test OPUS for 30 days without registering. After this trial period you have to register the OPUS copy used. Libraries and additional OPUS packages can only be used if you have registered the copy you use. You will find the personal registra-tion data on the OPUS CD. The registration has to be performed only once and is valid for all users.To register OPUS, select the Register OPUS command in the OPUS Setup menu .Fill in the entry fields by using the data which are written on the OPUS CD for the OPUS registration.Note: You only have to fill in those fields which you received reg-istration data for.The OPUS serial, package and library number consist of figures only, whereas the key consists of both figures and capital letters. When entering the key for the first time it is displayed in plain text, later it is hidden by "*".Activate the correct option button for your registration data in the Dialog mode group field. If you have registration data for OPUS 5.5 (or previous versions), acti-vate the corresponding option button. In this case a message pops up requiring to define the respective additional software packages from the drop-down list. These additional packages are defined as Extended packagesin your registration data.Figure 6: Registration DialogRegister OPUS To check whether the registration data are correct click on the Check Registration Data button. If they are correct, the selection field lists all available OPUS packages and libraries.The Select packages.... option button allows to deactivate single software packages and libraries. If you activate this option button, you can remove the check mark in front of the respective package or library. If you close the dialog, these packages or libraries will not be registered until you restart OPUS.Click on the OK button to have the data permanently registered.Starting OPUSAcquiring a Spectrum 2Working with OPUS2.1Acquiring a SpectrumDuring normal daily work you may frequently measure a single-channel reference spectrum (open beam spectrum without any sample in the optical path). This spec-trum is also called background spectra. In case of routine measurements you just have to change the samples, start measurement and evaluate the results. If you turn on the spectrometer for the first time, or if you have changed the hardware (e.g. beamsplitter or detector), you have to check the instrument settings before starting the measurement.All settings described in this section refer to the operation of a mid-infrared spec-trometer. Depending on the current configuration of your spectrometer, the follow-ing dialog boxes may be slightly different from the ones displayed on your screen.2.1.1Using OPUS-OS/2 Configuration FilesIf you already have a spectrometer and this OPUS version is an update of OPUS-OS/2, you can use your OPUS-OS/2 experiment files without having to convert them. You can leave out the setup procedure and continue with section2.1.6.2.1.2Setting up the Spectrometer ComponentsOpen the Measure menu and select Optic Setup and Service or use the icon in the icon bar to open the Optic Setup and Service dialog box. The Optics Setup parame-ters specify spectrometer components and parameters. Click on the Optical Bench tab and select the spectrometer connected. Define the setup of your instrument using the remaining tabs.Working with OPUSNormally, a BRUKER service engineer specifies and saves the initial settings. As these settings very much depend on the optics installed, they will not be further dis-cussed in this manual.Any changes made in these settings may impede the correct use of the instrument.Do not change the default device parameters before having read the appropriate sec-tion in the OPUS Reference Manual.2.1.3Setting up the Measurement ParametersBefore starting a measurement, you have to define certain parameters. Open theMeasurement dialog box by clicking on theMeasure menu or the icon. A dialog box will open, including the following tabs:Figure 7: Optic Setup and Service - Optical Bench tabFigure 8: Measurement menu tabsAcquiring a SpectrumIf you open theMeasure menu for the first time, some of the tabs may have error symbols (e.g.) attached.If the errorsymbol (A) appears on one or more tabs or if the symbol is displayed,you have to correct the erroneous settings first before being able to continue. In caseof General Warning it is still possible to save the configuration. If an entry field is marked red (C), the current value for that parameter is beyond its specified range or the value is missing. If you point the cursor to a red entry field, a suggestion box opens and provides an explanation.ABCFigure 9: Measurement menu tabs with error symbolFigure 10: Error suggestion boxWorking with OPUSIf a wrong value is selected from the drop-down list (B), the field is marked red. The requested parameter does not fit to the hardware used. For example, if an experi-ment requires an MCT detector, but according to the optics configuration a DTGS detector has been installed. In such a case the advice suggestion box will display the setting(s) allowed. Make sure that you correct potential errors before saving the set-tings.If properly configured, the Measurement dialog box is displayed without any warn-ings:2.1.4Calibrating the Interferogram PeakThe exact interferogram peak position MUST be determined and stored before the first measurement. You only have to repeat the peak position determination if there have been any changes in the hardware. Select the Check Signal tab in the Measure-ment dialog box. Make sure that you have checked the Interferogramoption button.Figure 11: Measurement menu tabs without warning symbolAcquiring a SpectrumIf no interferogram peak is displayed, you can move the scan region to the left or right using the arrow buttons to find the peak.Once the interferogram peak has been found, its position MUST be stored by click-ing on the Save Peak Position button. Later the peak position will be used to performFourier Transformation.Figure 12: Check Signal tab - Select interferogramFigure 13: Measurement - Interferogram calibrationWorking with OPUS2.1.5Advanced SettingsThe Advanced option allows to store all parameter settings into an experiment file. Click on the Advanced tab. You can define the number of scans in the entry fields Scan Time.In figure14 the number of scans has been set to 32 for sample and background. You can also select minutes instead of scans to exactly define the duration of your exper-iment. It is also possible to enter the data path defined for the automatic storing of the measurement. If you change this path, make sure that it does exist. You can browse the desired path by clicking on the button.Figure 14: Measurement - Advanced tabIt is recommended to select Absorbance as a common result spectrum.Figure 15: Measurement - Select result spectrum typeAcquiring a SpectrumIf you later want to work with a different kind of data type for the result spectrum,you can change the type of result spectrum at any time.In the Data blocks to be saved group field, you can select the kind of measurement data you want to save together with the spectrum. Each option selected will produce an additional data block. If you click on the Exit button, all options selected will be saved.It is highly recommended to repeatedly use the experiment files. They are indispens-able if you work with macros.Using the Acquisition tab you can define the data acquisition mode. The acquisition mode selected in the following window collects data on both the forward and re-verse mirror movement (Double Sided, Forward-Backward ). This acquisition mode yields the best signal-to-noise ratio. These values are normally set by default and do not have to be changed.Finally, you need to set the parameters for Fourier Transformation. Click on the FT tab. Normally, you can leave the default settings unchanged. For details on Phase Resolution and Zerofilling Factor,see the OPUS Reference Manual.Figure 16: Measurement - Acquisition tabWorking with OPUS2.1.6Background MeasurementExcept for emission, Raman, and single-channel measurements, it is always neces-sary to acquire a background spectrum before measuring the sample. This spectrum allows to take into account the effects that the spectrometer itself has on measured spectra, e.g. if the power of the light source varies at some frequencies, or the optics absorbs light stronger at a certain wavelength.To measure a background spectrum select the Optic tab and make sure that the ap-erture is set to the same value which you want to use to acquire a sample spectrum.To start the background measurement select the Basic tab and click on the Back-ground Single Channelbutton.Figure 17: Measurement - FT tabAcquiring a SpectrumFigure 18: Measurement - Background measurementThe status bar below the OPUS spectrum window indicates the measurement progress, the number of scans performed by the optical bench and the OPUS appli-cation which is currently running:Right click on the status bar to interrupt measurement. If the data acquisition has been finished, the status bar indicates that No Active Task is performed. Usually, the background spectrum data remains in the Acquisition Processor Unit. However, the spectrum can also be saved on hard disk. Check the appropriate data block option in the Advanced tab.2.1.7Sample MeasurementHaving measured the background spectrum, place the sample into the optical path. This procedure depends on your specific hardware setup. Enter the Sample Name and define the Sample Form in the Basic tab. This information will be stored togeth-er with your spectrum. Click on the Sample Single Channel button to start measure-ment. The Measurement Dialog Box is closed and the spectrum window displayed.Working with OPUSOnce again, you can monitor the progress of your measurement on the status bar at the bottom of the OPUS window. Having finished the measurement, the measured spectrum will be displayed in the spectrum window.Figure 19: Spectrum Window - Showing the spectrum measuredStrictly speaking, the spectrometer measures an interferogram rather than a spec-trum. Using Fourier Transformation this interferogram is transferred into a single-channel spectrum. On the basis of this single-channel spectrum and the background spectrum measured a resulting transmission spectrum will be calculated. This is done automatically and apart from short descriptions in the status line you will not notice any of these steps.Figure20 shows the single-channel spectrum, background spectrum and the calcu-lated transmission spectrum. Each data block is displayed by different icons. For further details on the icons, refer to the OPUS Reference Manual.Baseline Correction2.2Baseline CorrectionIf the baseline of your spectrum is sloped, curved or significantly below 100% trans-mission, the sample preparation might have been insufficient. Instead of preparing a new sample, try to correct the baseline automatically. In many cases, this willsolve the problem. The baseline correction can be started either from the Manipulate menu or by clicking on the icon. The following dialog box opens:TransmissionSpectrumSample Spectrum(single channel)Background Spectrum(single channel)Figure 20: Spectrum Window - Showing different types of spectraWorking with OPUSSelect the spectrum block in the browser window. Either by double clicking or drag-ging it from the OPUS browser to the File(s) to correct selection field while press-ing the left mouse button. Moving files in this way is called drag-and-drop . If you release the left mouse button, the file selected will be displayed in the File(s) to Cor-rectselection field:Figure 21: Baseline Correction - Select Files tabFigure 22: Baseline Correction with file selectedBaseline Correction The blue document symbol indicates that the file has not yet been manipulated. The spectrum block is displayed as a small icon next to the name and path of the file. To start the baseline correction click on the Correct button. If you want to define a par-ticular baseline correction method, click on the Select Method tab.A list of commonly used settings is displayed. Any changes you make will over-write the default settings. The Select Method field includes the Scattering correc-tion,Rubberband correction and Concave rubberband correction option buttons. Check either one of these options which will be explained in more detail in the OPUS Reference Manual.Figure 23: Baseline Correction - Select Method tabYou can also set the Number of Baseline Points. Click on the corresponding entry field and change the number. A value of 64 is generally recommended.It is also possible to exclude the CO2 range during baseline correction. Activate the Exclude CO2Bands check box.Click on the Correct button to immediately start the correction. Now, the OPUS browser window shows a red document symbol which indicates that the file has been manipulated. The red symbol is on top of the blue one (raw data).Working with OPUSAlternatively, double click onto the icon to correct the baseline of the active spectrum. A baseline correction for the currently selected spectrum will be per-formed using the standard settings. If you have finished the baseline correction, the spectrum has not yet been saved to disk and exists only as a temporary file. Store the file on the disk as a separate file to prevent the original from being overwritten.To undo baseline correction, use the right mouse button and click on the red docu-ment symbol. A menu pops up.Select the Undo all Manipulations command to open the following dialog box: Figure 24: File processed indicatorFigure 25: Pop-up menu used to undo functionBaseline CorrectionFigure 26: Undo all changes - Select Files tabClick on the Undo button and the red document symbol disappears in the OPUS browser window while the original blue symbol remains.The baseline correction is useful to manipulate spectra which could not have been measured very well due to the sample material. However, you should always try to obtain good spectra from your sample, instead of correcting them later.Figure27 shows an example of a baseline correction: the second spectrum is the original, whereas the first one is baseline corrected.Working with OPUS2.3Data File HistoryAny spectrum manipulations and measurement parameter changes are recorded in a non-editable, non-deletable history data file. Figure 28 shows a data file history with several spectrum manipulations performed:Figure 27: Spectrum Window - Baseline correction resultsFigure 28: Report window showing the data file historySaving SpectraThe first part of the data file history indicates the operator as well as the OPUS ver-sion and the spectrum name. All manipulations and their parameters are listed in the order of performance. Data information is always stored in a data block () together with the processed spectrum in one single spectrum file. This ensures that all data manipulations are re-corded, e.g. manipulation method, time and operator.2.4Saving Spectra The original spectrum is automatically saved in the path which you have defined insection 2.1.5. To save any spectra modifications, right-click on the red document symbol in the OPUS browser window. Select the Save File command from the pop-up menu. Alternatively, click on the Save icon or select Save File from the File menu.If you have selected a file to be stored, the spectrum will automatically be listed in the File(s) to save selection field. You can also drag and drop the file from the OPUS browser window to the File(s) to save field . If you click on the Save button ,the original file will be replaced and cannot be restored anymore.Figure 29: Save File - Select Files tabWorking with OPUSIf you want to save a file using a different file name, or in a different directory, usethe icon or select the Save File Ascommand from the File menu. The Save File As dialog pops up and OPUS automatically suggests a file name which you can modify, of course. If you want to save the file in a different directory, enter the path directly into the Path field. Alternatively, you can browse the directories by clicking on the Change Path button. If you want to overwrite a previous file, activate the Overwrite check box . Otherwise, an increment will be added to the file name. The Overwrite option is not available in validation mode. The increment extension is de-fined by the User Settings command in the Setup menu.The file is normally saved in OPUS format. However, the Mode and Data Point Ta-ble tabs allow to save the file in JCAMP-DX format, as a plain X-Y data table, in Pirouette (DAT) or in GALACTIC format (SPC).Figure 30: Save Spectrum - Select File tabLoading a Spectrum2.5Loading a SpectrumAn OPUS file can be loaded by either using the Load File option from the Filemenu or clicking on the icon in the icon bar. The following dialog box opens. As the appearance depends very much on the contents of each directory, your dialog box may look different..Figure 31: Save Spectrum - Mode tabFigure 32: Load Spectrum - No file selectedABWorking with OPUSThe title bar (A) shows the directory in which the file is located. Three parameters(B) of the OPUS file selected are shown by default. You can select the specific pa-rameters you want to have defined from the drop-down lists. Since no file has been selected yet in figure 32, the parameter abbreviations are shown.If you select a file, the Load Spectrum dialog will change as follows:A preview of the spectrum without the axes is displayed. The absorption data block () on the top left corner is displayed as a small icon. The spectrum parameters are now defined. As normally not all parameters have been specified for each file some of the parameters may be missing. Click on the Open button to load the spec-trum into the OPUS spectrum window.Figure 33: Load Spectrum - Active previewPrinting the SpectrumThe overview window (E in figure 34) shows the entire frequency range. As the spectrum is not displayed in full size within the spectrum window, you can scale the spectrum using the Scale icon (D).In the OPUS browser window a blue document symbol (A) is shown in front of the file name (B), indicating that the file has not yet been manipulated. A typical exam-ple of data manipulation is the so-called baseline correction which has already been described. Spectrum data blocks (C) are displayed as small icons.2.6Printing the SpectrumThere are two options to quickly and easily print your recorded spectra. If you click on the Quick Print icon in the icon bar, OPUS automatically selects an appropriate layout depending on the window type you are using at the moment.If you work in the normal display window, the spectrum will be printed within a frame. If you search a spectrum library, the results as well as a hit list, spectral in-formation and the structure of the product will be printed. For details on default set-tings available, refer to the OPUS Reference Manual.Another possibility to print spectral information is to use the Print Spectra com-mand in the Print menu. Using this command, enables you to define further basicprintout options, e.g. frames and frequency range.Figure 34: OPUS spectrum and browser windowAB CDEWorking with OPUSFigure 35: Print Spectra - Select Files tabFor details on printing data using the Plot Layout Editor (PLE), refer to chapter3.Starting PLE 3Plot Layout Editor (PLE)The Plot Layout Editor (PLE) tool allows to print customized pages which include spectra and additional information, e.g. measurement parameters. You can add de-scriptions as well as simple graphic elements (e.g. logos or bitmaps) to the plots. If you want to print a spectrum only, you can either use the Quick Print icon in the icon bar or the Print Spectra command from the Print menu. Using the Quick Print icon immediately sends data to the default printer, while the Print Spectra dialog al-lows you to define specific print parameters. For further information, see the OPUS Reference Manual.3.1Starting PLETo start PLE, select the New Layout option in the Print menu. The pull-down menus displayed in the menu bar have changed and the following icons which have previ-ously been hidden are now activated in the icon bar.The PLE layout window opens within the OPUS spectrum window.Figure 36: Plot Layout Editor (PLE) window。
布鲁克XRF荧光光谱仪说明书 2-应用SPECTRA plus作你的第一条回归曲线
应用SPECTRA plus作你的第一条校准曲线目录应用SPECTRA plus作你的第一条校准曲线简介建立校准曲线了解校准曲线工具箱开始作校准曲线Si KA1 HS-Min的校准曲线如何检查计算的浓度是否被接受P KA1-HS-Min 的校准曲线S KA1 HR-Min的校准曲线V KA1-HS-Min的校准曲线Cr KA1-HS-Min的校准曲线Mn KA1-HR-Min的校准曲线V KA1 HS-Min的校准曲线Ni KA1-HS-Min的校准曲线Cu-KA1-HS-Min的校准曲线漂移校正/重校正低合金未知样品的测量使用Results Monitor功能监视分析结果查询结果转移结果再评估测量数据结论简介本教学课程包括下列内容,以便使你熟悉制作校准曲线的过程:l建立校准曲线l组织材料l输入标准浓度到数据库l定义测量方法l了解校准曲线工具l校准已测量的低合金样品l用低合金曲线测量未知样品l使用结果管理器按照这一部分的介绍,你可以一步一步地制作你的第一条校准曲线。
使用一套BCS低合金标样,SPECTRA plus谱线库中预定义的谱线及扫描测量模式,你的任务是绘制低合金样品的校准曲线。
由于所有的样品已经在德国Bruker AXS 公司测量过,不需要在你的仪器上进行实际的测量。
为了得到所显示的相同结果,必须仔细地按照所有步骤进行。
建立校准曲线从SPECTRA plus程序或桌面打开Quantification Editor (FQuant) 程序。
图 1 桌面上的Spectra Plus程序文件夹选择 File > New.选择左侧(引导窗口一侧) "Materials" 。
在右侧出现一个对话框,并列出一个或多个预定义的材料。
图 2 材料页在"Material Groups" 材料组窗口中,选择"Tutorial"教学材料组(如果它不存在的话,请输入Tutorial并且点击新文件按钮(红圈), 见下面注解)。
布鲁克XRF荧光光谱仪说明书 3-Getting Started-总体介绍

目录1 安装SPECTRA plus2 使用 SPECTRA plus第一步2.1 连接2.2 无标样测量2.2.1 预装的测量方法2.2.2 特殊测量方法2.2.3 分析结果的重新评估2.3 绘制校准曲线2.4 特殊应用3 登录3.1 登录的目的3.2 操作人员管理3.3 登录和退出3.4 在不同的Windows 用户中登录1 安装SPECTRA plus安装必须在管理员界面里进行。
安装程序需以管理员权限进入,以安装某些动态资料库(DLL 文件),特别是这关系到数据库的管理,和某些注册钥匙,如在.DEFAULT 文件夹。
如果没有进入管理员界面,请询问网络管理员取得此资格。
安装时,请参考”Installation notes”(它是与SPECTRA plus分开的另一文件),和安装光盘里的READMEFIRST.TXT 文件、INSTALLATION.PDF 文件。
安装术语・ Recalibration data diskette 重校正数据软盘:是随光谱仪一起交付的软盘,包括与用户光谱仪相对应的特定文件:硬件配置文件和谱线库。
在首次安装时必须安装,但不要用于升级:因为在使用了一段时间后,谱线库里会加进用户自己定义的谱线,硬件配置文件也可能进行了修改,如果重新安装时再使用重校正数据软盘里的数据,仪器就回到了出厂时的状态,用户加进去的内容会被删除,。
・ Master diskette 母盘:是随初始SPECTRA plus软件包一起交付的软盘,内有信用证。
在第一次安装时信用证被转移到硬盘。
如果您想卸载软件,如,将软件安装至另一台电脑或其他目录,不要忘了把信用证转移回母盘,然后再转安装至其他地方。
如果只是软件升级,没有改变目录,建议把信用证留在硬盘以避免误操作。
信用证的管理,见L_WIZARD程序。
快捷键图标程序手册・章无L_WIZARD.EXE 11只是在安装或卸载SPECTRA plus软件时才需要转移信用证,在通常情况下不要安装或卸载SPECTRA plus软件,也就不要用L_WIZARD去转移信用证。
红外光谱 OPUS仪器操作规程
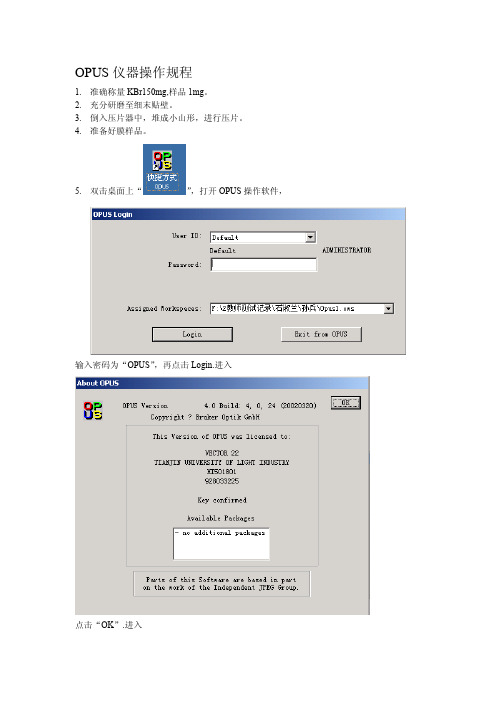
OPUS仪器操作规程1.准确称量KBr150mg,样品1mg。
2.充分研磨至细末贴壁。
3.倒入压片器中,堆成小山形,进行压片。
4.准备好膜样品。
5.双击桌面上“”,打开OPUS操作软件,输入密码为“OPUS”,再点击Login.进入点击“OK”.进入6.点,打开测试界面,点击,7.点击,选择教师8.在Filename处,修改“样品名日期(年月日)姓名”9.在Path处修改姓名10.将修改后filename的“样品名日期(年月日)姓名”复制粘贴到中的再返回advanced,点击”save”保存。
11.返回basic12.放入参比。
13.点击”Background Single Channel”.14.拿出参比,放入样品,点击”Sample Single Channel”.15.点击start measurement。
16.对图进行处理17.1校正基线:选中要处理的曲线,把其他不处理的图像抹掉,选中所要抹掉的曲线,右键单击选择Remove From display,点点击correct既可校正基线。
17.2选中所要处理的图,点,出现,然后点击,出现输入x坐标然后点击Generate即可去二氧化碳峰。
17.选中要处理的图,去掉其它图(点击右键remove from display),对一个图进行处理。
18.在要处理的图上右击图线→Shift Curve控制图线在10%~90%之间。
具体做法:先用whole把图上最高点控制在85%—90%之间,再右击图线→Shift Curve→Top和右击图线→Shift Curve→Bottom来进行微调。
19.右击图线→Change color,改成黑色。
20.点,标出峰值,具体做法:在下图中先点击start interactive mode进行微调(调节域值,把所有的峰都标出来),然后储存。
21.整理保存,打开桌面“测试结果存档”,找到老师,建立自己的文件夹,建立word文档,以日期命名,保存自己的图片。
Bruker红外光谱仪软件安装、使用步骤及注意事项(精)
Bruker 红外光谱仪软件安装、使用步骤及注意事项 1. OPUS软件需要工作在win2000/XP操作系统,显示器的最小分辨率要为 1024×768。
2. 需要一块 10M 或 10M/100M兼容网卡 (实际工作在 10M 模式 , 并安装好驱动程序及 TCP/IP协议。
网卡的 TCP/IP协议需要指定 IP 地址 , 一般设为 :10.10.0.100(最后一位为 2-255之间的任意整数。
子网掩码为 :255.0.0.0。
其它不用设置。
3. 仪器的初始 IP 地址是 10.10.0.1,可以在 IE 地址栏中键入 10.10.0.1打开仪器的硬件信息。
这步操作可以检查仪器与是否联通,在日常操作过程中不会用到, 只有当仪器出现异常时,在 BRUKER 工程师的电话指导下使用。
4. 仪器使用过程中任何时候 Internet Explorer中文件菜单下的脱机工作不能被选中,否则将导致仪器不能和电脑连接。
5. windows 系统如果要安装防火墙之类软件,请在使用本仪器前关闭 , 或设置成对本仪器 IP 地址是开放的状态。
6. 在使用仪器时, IE 上所有代理服务器设置应该取消,否则仪器与电脑不能正常通讯。
7. 必须以系统管理员的身份登陆 windows 系统,才能进行 OPUS 软件的安装, 并进行用户管理设置。
8. OPUS软件安装完毕后,需要重启电脑。
运行 OPUS 软件,可以点击桌面上的OPUS 图标,缺省的密码是 OPUS (大写 ,启动软件后可以更改登陆密码。
9. 每次开始测量时,点击个性化工具条的高级数据采集(或测量菜单下高级测量选项 ,检查(或调入事先设置好的实验参数文件(例如 c:\programfiles\opus\xpm\MIR_TR.XPM 文件后 , 切换到检查信号页面, 应该在几秒钟后看到红色十字架形干涉图。
新仪器的干涉图正常幅度(Amplitude 的绝对值应在 18000以上 (随仪器使用时间而减弱 , 位置 (position 范围应该在 58000-62000. 看见十字型干涉图之后点击保存峰位。
布鲁克红外opus软件快速入门手册
(b)
(c)
(d)
(e) (f) (g) Figure 4: OPUS User Interface
(a) OPUS 软件所有功能的下拉菜单。 (b) 自定义个性化的图标条。 (c) OPUS 文件管理器。 (d) 全频率谱图显示窗口。
(e) 概貌窗口总是显示所选文件的整个频率范围。
(f) 在线帮助。 (g) 显示所有在后台运行任务的条。
安装结束后, OPUS 图标将被加到 Windows 开始菜单中。用鼠标单击 OPUS 图标可进入该程序。
Figure 1: Windows Start Menu
在登录窗口从下拉列表中选出你的用户名。OPUS 提供独立分级的用户帐号 系统。如果是第一次运行 OPUS,用户名下拉表中有两个事先定义的用户记 录,Default 和 Administrator ;可任选一个。 在密码字段输入 OPUS,要用大写。密码大小写敏感。一旦在 OPUS 中建立 了自己的用户记录,就能够定义自己的用户名和密码。
只需点击该图标然后按住鼠标的左键拖到你想要的大小为止你释放完鼠标后你仍可以利用框架的边界调整框架的大打印模板编辑器ple30opusgettingstartedbrukeroptikgmbh为了将谱图插入到你设置的框架中在框架中单击鼠标的右键从弹出菜单中选择assign和spectrum一个谱图文件选择对话框让你选择你需要的谱图谱图显示在谱图框中包括坐标轴以及必要的符号
iii
1 启动 OPUS
安装 OPUS 前,请阅读所提供的文件。
将OPUS光盘放入光盘驱动器中。通常安装程序会自动运行。如果Windows 的“自动运行”被禁止,则必须用 Windows 资源管理器 , 并选择光盘驱动 器,运行安装程序。该程序将引导你安装,只要按提示做就行了。
布鲁克红外opus软件操作
4 编辑谱库 . . . . . . . . . . . . . . . . . . . . . . . . .37
4.1 谱库编辑器 . . . . . . . . . . . . . . . . . . . . . . . . . 37 4.1.1 编辑谱库 . . . . . . . . . . . . . . . . . . . . . . 38 4.1.2 谱库谱图 . . . . . . . . . . . . . . . . . . . . . . 39 4.1.3 信息设置内容 . . . . . . . . . . . . . . . . . . . . 41
用户手册
谱库检索
Version 6
目录
1 前言 . . . . . . . . . . . . . . . . . . . . . . . . . . . 1
1.1 谱库结构 . . . . . . . . . . . . . . . . . . . . . . . . . . 2
2 2 谱库检索 . . . . . . . . . . . . . . . . . . . . . . . . 5
.
8
OPUS/ 谱库检索
Bruker Optik GmbH
2.3.1 检索参数
谱图检索
Figure 6: 谱库检索 – 检索参数页
在谱库中每一化合物都有一个数字化的入口,也是在谱库中的地址。
每一入口有唯一的一张光谱,并附有从光谱图信息数据块 ( ) 中带来 的文字信息。这些文字信息部分是在创建谱库时产生的,并强制性要求输 入。
谱库应严格按同样光谱方法建立。例如,谱库可以由近红外,中红外或拉 曼光谱组成,但不能混合在一起。另外方法中也可以使用光谱文件中的 OPUS 参数。光谱图应在同一频率范围和同一数字化分辨率。然而,这并不 影响检索结果,因为在检索中总是使用原始光谱。
布鲁克核磁共振仪初学者入门手册

版本号 003本手册所包含信息的更新、变更不再进行通知BRUKER 不承担依照本手册进行操作所造成的一切后果。
BRUKER 不负责在安装或实验操作中由于本手册所包含的错误而导致的偶然损害。
严禁在未取得出版者书面许可的情况下,对手册全部或部分内容进行引用或者翻译。
作者:Eamonn Butler出版:Stanley J.Niles2003年12月12日翻译:高玉波 Yubo.Gao校对:2006年5月21日目录目录 (3)1 简介.............................................................................................................................................71.1可能的损害.......................................................................................................................71.1.1软件版本及命令语法...........................................................................................82 安全注意事项 (9)2.1简述 (9)2.2 关于磁性的安全注意事项 (9)2.2.1 内部区域安全注意事项 (10)2.2.2 外部区域安全注意事项 (11)2.3 关于深冷液体的安全注意事项 (11)2.4 关于电气的安全注意事项 (11)2.5 关于化学的安全注意事项 (11)2.6 关于CE认证 (11)3 理论及术语说明 (13)3.1 简介 (13)3.2 氯仿的NMR分析 (15)3.3 标样,赫兹,ppm (17)3.4 质子NMR——化学位移 (18)3.5苯的质子频谱 (19)3.6 乙酸苄酯(Benzylacetate)的质子频谱 (20)3.7 带自旋/自旋耦合的乙基苯质子频谱 (21)3.8 去耦 (23)3.9 FID和频谱 (24)4 系统介绍 (27)4.1 简介 (27)4.2 操作控制台及其连接 (27)4.3 机柜 (28)4.4 主机与AQS间的连接 (29)4.5 磁体、匀场系统、HPPR和探头 (29)4.6 磁体和磁体杜瓦 (31)4.6.1 室温腔管 (32)4.6.2 液氦腔 (32)4.6.3 液氮腔 (33)4.7 锁场系统简介 (33)4.8 探头 (34)4.8.1 双模13C/1H探头 (36)4.8.2 更换探头 (38)5 NMR样品 (39)5.1 简介 (39)5.2 溶剂选择 (39)5.3 样品管 (40)目录5.4 样品处理 (41)6 实验基本步骤 (43)6.1 简介 (43)6.2 BSMS键盘 (43)6.2.1保存一组匀场值(wsh命令) (44)6.2.2 读取一组匀场值(rsh命令) (44)6.2.3 BSMS功能 (45)6.2.4 样品控制功能 (45)6.2.5 手动锁场功能 (45)6.2.6 手动匀场功能 (46)6.2.7 液氦高度功能 (46)6.3 将样品管插入转子 (47)6.4 将带样品管的转子放入磁体 (47)6.5 旋转样品 (48)6.6 调谐和匹配探头 (49)6.6.1 使用wobble曲线进行调谐和匹配 (49)6.6.2 使用HPPR LED进行调谐和匹配 (51)6.6.3 对多个核进行调谐和匹配 (52)6.7 锁定样品 (53)6.7.1 锁场步骤 (54)6.8 匀场 (55)6.8.1 初始匀场 (56)6.8.2 常规匀场 (56)7准备采样——数据集, edasp、eda命令 (59)7.1 简介 (59)7.2 数据集 (59)7.3 创建数据集 (61)7.4 谱仪参数edasp (62)7.4.1 edasp窗口布局 (63)7.4.2 edasp窗口的一些特性 (65)7.5 基本采样参数:“eda”表 (65)7.5.1 发射、基础和偏移频率的数学解释 (72)8 脉冲程序 / ased命令 (75)8.1 脉冲程序“zg”和“zg30” (75)8.2 “zg30”程序详解 (75)8.3 命令“ased” (77)9 氢谱 (79)9.1 前言 (79)9.2 创建新数据集 (79)9.3 读取标准参数集 (80)9.3.1 “getprosol”表 (80)9.4 设置接收机增益 (80)9.5 进行采样 (81)9.6 傅立叶变换和谱图相位校正 (83)目录9.7 基本处理:傅立叶变换 (85)9.8 相位校正 (85)9.9 谱图的校准 (87)9.9.1 水平放大图谱 (88)9.9.2 图谱校准 (88)9.10 使用SW-SFO1功能调整谱宽 (89)9.10.1 调整cholesterylacetate谱图的SW (89)9.11 增加扫描次数 (90)10 不去耦的13C谱 (93)10.1 简介 (93)10.2 步骤 (93)11 去耦氢的13C谱 (97)11.1 简介 (97)11.2 详细步骤 (97)11.3 确定去耦频率 (98)11.4 调整去耦参数 (99)11.5 脉冲程序zgpg30 (99)12 基本故障排除 (103)12.1 简介 (103)12.2 打开和关闭谱仪 (103)12.3 谱仪开机 (103)12.4 谱仪关机 (104)12.4.1 在Windows系统运行Topspin (104)正文开始1 简介这本手册的目的是帮助一个几乎没有经验的用户学习进行一系列基础的一维高分辨率NMR实验。
红外线学习软件使用说明
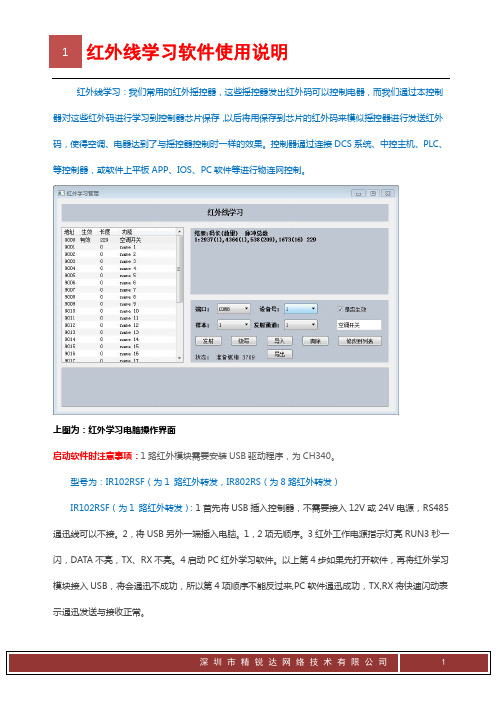
红外线学习:我们常用的红外摇控器,这些摇控器发出红外码可以控制电器,而我们通过本控制器对这些红外码进行学习到控制器芯片保存,以后将用保存到芯片的红外码来模似摇控器进行发送红外码,使得空调、电器达到了与摇控器控制时一样的效果。
控制器通过连接DCS系统、中控主机、PLC、等控制器,或软件上平板APP、IOS、PC软件等进行物连网控制。
上图为:红外学习电脑操作界面启动软件时注意事项:1路红外模块需要安装USB驱动程序,为CH340。
型号为:IR102RSF(为1 路红外转发,IR802RS(为8路红外转发)IR102RSF(为1 路红外转发):1首先将USB插入控制器,不需要接入12V或24V电源,RS485通迅线可以不接。
2,将USB另外一端插入电脑。
1,2项无顺序。
3红外工作电源指示灯亮RUN3秒一闪,DATA不亮,TX、RX不亮。
4启动PC红外学习软件。
以上第4步如果先打开软件,再将红外学习模块接入USB,将会通迅不成功,所以第4项顺序不能反过来,PC软件通迅成功,TX,RX将快速闪动表示通迅发送与接收正常。
IR802RS(为8路红外转发): 1首先将9-24V电源对控制器供电,2,将USB转RS485接入电脑上的USB接口,和8路红外学习模块RS485通迅接口,1,2项无顺序。
3红外工作电源指示灯亮,4启动PC红外学习软件。
以上第4步如果先打开软件,再插入USB转RS485连到红外模块,将会通迅不成功,所以第4项顺序不能反过来。
软件启动后,并与控制器正常通迅状态:会在中间下方显示“准备就绪”和不断与模块进行通迅,而上面的这些数据只是握手通迅的数据,并不是读红外数据。
1:操作功能键:通迅端口选择,设备号,发射通道,修改名称,是否将学习的红外启用,烧写红外数据到控制器,将红外数据保存文件,或导入红外码文件,测试发射等。
2:红外学习码展示区,这里只是显示一下做参考,每次学习这里会一行一行出现,其中有序列号,最多显示9行。
布鲁克TENSOR27 中红外用户培训手册

中红外用户培训手册布鲁克光谱仪器公司目录第一章 红外光谱的基本原理 (1)1.1光的性质 (1)1.2分子光谱的种类 (1)1.3分子的振动方式 (2)1.4吸收峰类型 (4)1.5吸收峰位置 (4)1.6吸收峰强度 (12)第二章 FTIR基本原理 (13)2.1FT-IR基本原理 (13)2.2FT-IR 光谱仪 (15)第三章 红外光谱的应用 (25)3.1化合物的鉴定 (25)3.2定性分析 (32)3.3定量分析 (33)3.4鉴定样品纯度和指导分离操作 (35)3.5研究化学反应中的问题 (35)第四章 红外光谱图的解析 (37)4.1红外光谱法的特点 (37)4.2样品的一般制备及特殊制样法 (37)4.3官能团的特征吸收与红外光谱图的解释 (41)第五章 红外样品常用制备技术和反射附件 (43)5.1 IR样品的制备技术 (43)5.2几种常用反射附件 (45)第六章 附录1 TENSOR仪器操作规程 (47)TENSOR 27红外光谱仪操作与维护规程 (47)TENSOR 37红外光谱仪操作与维护规程 (49)附录2 常见官能团红外吸收特征频率表 (52)附录3 仪器的维护 (66)取出并再生干燥剂 (66)更换激光器 (68)更换IR光源 (69)更换保险丝 (69)更换窗片 (70)第一章 红外光谱的基本原理1.1 光的性质光是一种电磁波,它在电场和磁场二个正交面内波动前进.二个波峰或波谷之间的距离为波长,以“ λ”表示。
电磁波包括波长短至0.1纳米的x射线到长达106厘米的无线电波.其中波长为0.75微米到200微米,即从可见光区外延到微波区的一段电磁波称红外光.红外光通常以微米为单位(μm).1微米等于10-4厘米(1μm=10-4cm),因此,红外光波长以厘米为单位时,其倒数就是1厘米内的波数(ν),所以波数的单位ν是厘米-1(cm-1).红外光既可以波长(λ),也可以波数(cm-1)表示,二者关系如(1-1)式所示:ν(cm-1)=104/λ(μm) (1-1)由于光的能量与频率有关,因此红外光也可以频率为单位.频率(f)是每秒内振动的次数.频率、波长和波数的关系是:f=c/λ=ν*c (1-2)式中:c为光速,是常数(3×10¹⁰厘米秒); λ是波长(微米);f是频率(秒-1);ν是波数(厘米-1).由于波数是频率被一个定值(光速)除的商值,因此红外光谱中常将波数称为频率.光既有波的性质,又有微粒的性质.可将一束光看作高速波动的粒子流,最小单位为光子.根据爱因斯坦—普朗克关系式,一定波长或频率的单色光束中每个光子具有能量E,E=hf=hcν=hc/λ (1-3)式中:h为普朗克常量,等于6.63×10⁻³⁴焦耳·秒.按(1-3)式可以算出波长2μm(5000厘米-1)的红外光子能量为6.63×10⁻³⁴ (焦耳·秒)x3x1010/2x10-4厘米=9.95x10-20焦耳.同理波长l0微米(1000厘米-1)的红外光子的能量仅1.99×10-20焦耳.可见波长短,能量大.波长长,能量小.1.2 分子光谱的种类有机分子同其他物质一样始终处于不停的运动之中。
OPUS快速入门
Figure 5: OPUS Access Control Diagram
OPUS 用户数据库 User Database 包含所有用户记录。
用户记录 Records 如下: • 用户 ID • 口令 • 操作者名称 • 用户组 (管理员、操作员) • 可使用的工作台
工作台包含: • 菜单内容 • 工具条内容 • 使用权限 • 其它设置 (如文件扩展名模式、显示范围)
3 打印版面编辑器 (PLE) . . . . . . . . . . . . . . . . . . . . . . . . . . . . . . . . . . . . . .27
3.1 打开 PLE . . . . . . . . . . . . . . . . . . . . . . . . . . . . . . . . . . . . . . . . . . . . . . . . . . . . 27 3.2 为 Windows NT 安装打印机 . . . . . . . . . . . . . . . . . . . . . . . . . . . . . . . . . . . . 28 3.3 定义打印区域 . . . . . . . . . . . . . . . . . . . . . . . . . . . . . . . . . . . . . . . . . . . . . . . . 28 3.4 调入和显示谱图 . . . . . . . . . . . . . . . . . . . . . . . . . . . . . . . . . . . . . . . . . . . . . . 29 3.5 连接一个徽标或位图 . . . . . . . . . . . . . . . . . . . . . . . . . . . . . . . . . . . . . . . . . . 32 3.6 连接图形元素和文字 . . . . . . . . . . . . . . . . . . . . . . . . . . . . . . . . . . . . . . . . . . 33 3.7 存贮打印模板 . . . . . . . . . . . . . . . . . . . . . . . . . . . . . . . . . . . . . . . . . . . . . . . . 34
布鲁克器EMX-Plus X带电子参磁共振(EPR)光学仪器操作指南说明书
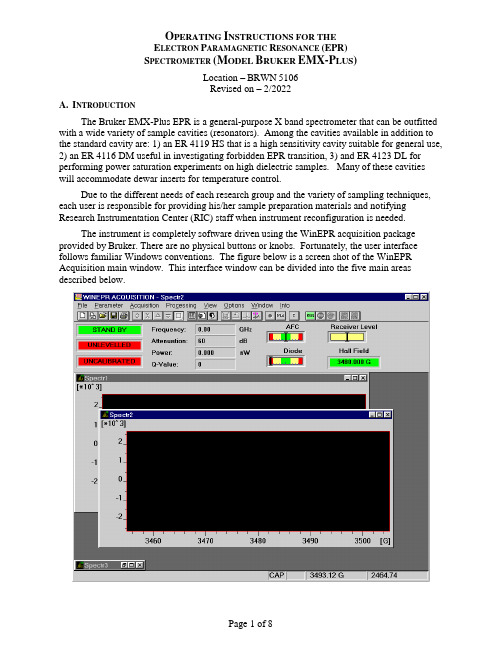
O PERATING I NSTRUCTIONS FOR THEE LECTRON P ARAMAGNETIC R ESONANCE (EPR)S PECTROMETER(M ODEL B RUKER EMX-P LUS)Location –BRWN5106Revised on – 2/2022A.I NTRODUCTIONThe Bruker EMX-Plus EPR is a general-purpose X band spectrometer that can be outfitted with a wide variety of sample cavities (resonators). Among the cavities available in addition to the standard cavity are: 1) an ER 4119 HS that is a high sensitivity cavity suitable for general use, 2) an ER 4116 DM useful in investigating forbidden EPR transition, 3) and ER 4123 DL for performing power saturation experiments on high dielectric samples. Many of these cavities will accommodate dewar inserts for temperature control.Due to the different needs of each research group and the variety of sampling techniques, each user is responsible for providing his/her sample preparation materials and notifying Research Instrumentation Center (RIC) staff when instrument reconfiguration is needed.The instrument is completely software driven using the WinEPR acquisition package provided by Bruker. There are no physical buttons or knobs. Fortunately, the user interface follows familiar Windows conventions. The figure below is a screen shot of the WinEPR Acquisition main window. This interface window can be divided into the five main areas described below.Menu Bar – Like all Windows programs, there is a Menu Bar at the top of the window used to access all other program features. All of the features listed in the other areas of the interface are directly accessible via the menu bar.Button Bar – This bar is located just below the Menu and can be toggled visible/invisible using the View option in the Menu bar. It is highly recommended to leave it visible since all spectrometer functions needed for data acquisitions are most easily accessed from the tool pallet. The table below shows each icon and lists its “tip strip”. The specif ic functions of many are discussed in the relevant sections below.New Spectrum Duplicate Spectrum Open Spectrum Save Spectrum Print Spectrum ExperimentalParametersExperimental OptionsComment ParametersRun / Stop ScriptRun AcquisitionStop AcquisitionStop Acquisition atEnd ScanTimes 2 Divide by 2 Expand Contract Change Center Fieldand Sweep WidthChange Center FieldChange Static FieldInteractive ReceiverLevelSend Spectrum toWinEPRSend Spectrum toSimfoniaReset Display Rectangular Zooming Cursor Moving Microwave Fine Tune Microwave Bridge ControlInteractive Spectrometer ControlInstrument Monitor – This area is located just below the Button Bar and shows the status of the microwave bridge and signal channel. The displays can be toggled visible/invisible by using the View option in the Menu bar.Data Area – This area fills the center of the screen and is populated by various windows. The windows can be any combination of spectra, parameters, and instrument control windows. Status Line – This is located at the bottom of the window and displays current instrument status and messages.B.O PERATION:S TARTUPFollow the procedure below to insure proper instrument operation. Although spectra can be obtained immediately after startup, waiting at least an hour for the magnet and electronic components to thermally stabilize before taking spectra is recommended.EMX S TARTUP1.Nitrogen Purge – Open the gas supply valve on the liquid nitrogen dewar. This will purgethe EPR cavity, waveguide, and microwave bridge of water vapor which absorbsmicrowave energy and oxygen which gives a signal since it is paramagnetic2.Cooling water – Open the two chilled water valves on the wall to the right of the computerdesk.3.Heat Exchanger –Use the rotary switch labeled “Heat Exchanger” located on the controlbox above the water filter. Be careful to not mistakenly push the Main power button.4.Magnet power supply – The magnet power supply not only controls current in the electromagnet but powers the console and microwave bridge as well. It is powered on in atwo-step process as detailed below.a.Press the ELECT. ON (Electronics) button in far left, upper corner. Wait for the fivered LED-warning lights on far right to extinguish before continuing. If the LEDs donot extinguish, confirm that the cooling water is on and repeat this step.b.Press POWER ON, which is located to the immediate right of the ELECT. ON switch.5.Console Power – Press the round button located in the lower, center of the cabinet. Thisalso provides power for the Microwave Bridge located on the top, left corner of the shelf above the electro magnet. The console houses: 1) Signal Channel – A phase sensitivedetector measuring the EPR signal by comparison with a signal of known frequency.2) Magnetic Field Controller – Controls both the magnitude and sweep rate of themagnetic field during a scan. 3) Modulation Amplifier – This unit provides the modulated reference signal for detection in the signal channel.NOTE –The console houses ~$150,000 of electronics.DO NOT set samples or your coffee on itC OMPUTER L OGONThe computer is usually left on and can be awakened by pressing any key on the keyboard. If the screen does not respond within 30 seconds of pressing a key, press the power button on the front of the case. At the Logon prompt e nter your “User Name” and “Password”. The “Domain” entry should be set to BoilerAD.Once logged on, WinEPR shortcuts are visible in the upper right-hand corner of the desktop. “WinEPR Acquisition” is the application used to run the spectrometer and obtain data. “WinEPR Processing” and “WinEPR SimFonia” are for analysis and simulation, respectively. This training document focuses only on the acquisition software and basic instrument operation.Launch the WinEPR Acquisition by double clicking its icon. It takes about 90 seconds for the software to fully launch. Once the window opens, click the Interactive Spectrometer Control button and click the “Calibrated” check box in the upper right of the window that opens.C. O PERATION:L OADING S AMPLESInserting / Changing Samples(Room Temperature)1.If the Microwave Bridge Controller window is not open, click on the Microwave Bridgebutton on the tool bar.2.Select the STANDBY or TUNE mode. See the image below.3.To avoid contaminating the cavity, clean the outside of the sample tube with a ChemWipe.4.Center the sample tube in the collet (loosen the collet ring if necessary) and gently slide itdown until either the sample is centered in the cavity or the tube is resting on the pedestal.Tighten the collet ring just enough to prevent the sample tube from moving.(Helium Variable temperature)1.If the Microwave Bridge Controller window is not open, click on the Microwave Bridgebutton on the tool bar.2.Select the STANDBY or TUNE mode. See the image below.3.Position the sample tube in the top-hat using the cavity gauge drawing to center the samplein the cavity. Tighten the top-hat ring so that the sample tube is snug.Notes – Do not over loosen or remove the upper portion of the top-hat.– The sample should be located in the center of the cavity for the best response.– Samples must be frozen prior to inserting them in the cavity!4.To avoid contaminating the cavity, clean the outside of the sample tube with a ChemWipe. Be sure to remove any frost.5.In as smooth and rapid a motion as possible remove the top-hat currently on the VT cavityand replace it with the new sample by carefully sliding the sample tube straight down into the cavity. Once the top-hat contacts the vent tube, apply gentle but firm pressure until the top-hat snaps into place.6.Tune the cavity and set parameters to the instrument as usual.7.Wait for the sample to thermally equilibrate (~10 minutes).Tuning the Microwave Cavity and Bridge1.If the Microwave Bridge Controller window is not open, click on the Microwave Bridgebutton on the tool bar.2.Select the TUNE mode. See the image below.e the pairs of up/down arrow keys set the attenuation to 25dB. The leftmost pairchanges in units of 10dB and the rightmost pair changes in 1dB units.e the right/left arrow buttons of the Frequency slider to center the tuning dip as shownabove. The system takes long fractions of a second to respond so do not click too fast.Use the right/left arrow buttons on the Signal Phase slider to adjust phase until the tuning dip is symmetrical as shown above. The system takes long fractions of a second torespond so do not click too fast.5.Either click the Up or Down arrow to start the cavity auto-tune process. The autotuneroutine will then adjust the frequency, phase, bias, and iris coupling for optimalperformance. Wait for this process to complete as indicated by the three green indicators in the left of the Instrument Monitor window.Note – If auto-tune fails, follow the procedure in Appendix C.6.Click the Microwave Bridge button to close the window.D. O PERATION:T AKING S PECTRASetting ParametersInstrument parameters may be loaded from disk by opening an existing spectrum, or set manually as described below. Whichever method is chosen it is important to verify that the cavity calibration file is loaded and is being used.1.Setting parameters manuallya.Click the New Spectrum button to ensure that a previously open spectrum is notaccidentally overwritten.b.Click the Experimental Parameters button and enter the desired parameters.Notesa)If looking for radicals centered around g = 2, check the box just above the “CenterField” numeric to automatically set the “Center Field” parameter.b)Microwave power – The range is 1 to 200 mW. Usual values are 1 to 20 mW.c)Modulation Amplitude – The range is 0.1 to ~20 (dependent on cavity) gauss. 5 to10 gauss is typical. The amplitude should be no higher than the width of thenarrowest line (in gauss) in the spectrum. See page 2-19 in the Bruker WinEPRacquisition manual for a discussion of over modulation.d)Receiver Gain – Typical range 100 to 5000.e)Conversion Time – This is the time allotted for the A/D process and directlyinfluences resolution in the Y-axis. This value multiplied by Resolution in X (# ofpoints collected across spectrum) yields the sweep time for the spectrum.f)Time constant – This value should be less than one tenth the time needed to scanthe narrowest line in the spectrum. See page 2-20 in the Bruker WinEPRacquisition manual for a discussion of using an excessively long time constant.g)If a single scan does not yield spectra with reasonable signal-to-noise, either of thetwo options below can help.a.Repetitive scanb.Increased time constant with either increased conversion time and/or Xresolution to slow the scan through the signal2.Loading/Verified cavity calibrationa.Click the Interactive Spectrometer Control button.b.Verify that the “Calibrated” check box in the upper right is checked.c.Click the “SCT Options” button at the lower right to open the Signal Channel Optio nsdialog shown below.d.Verify that the loaded calibration file in use matches the name of the cavity currentlyinstalled. See the table below for the calibration file names. If necessary, click the“Change File” button and select the proper file.Resonator Name Calibration FileER 4102 ST ST 0203.calER 4103 TM TM 9304.calER 4119 HS HS 0716.calER 4116 DM DM 0708.calER 4123 D D 0247.calAcquiring DataAfter setting the scan parameters, click the Run button to initiate data collection. Acquisition can be terminated immediately using the Stop Acquisition button or at the end of the current scan via the button. This latter operation is useful during averaging operations if the desired spectral quality has been achieved.E. I NSTRUMENT O PERATION:S HUTDOWN1.Set Microwave Bridge controller to STANDBYa.If the Microwave Bridge Controller window is not open, click on the MicrowaveBridge button on the tool bar.b.Select the STANDBY mode.2.Exit the WinEPR software.3.“Sign Out …” - Right click on your name at the top of the Windows “Start” menu.4.Remove the sample from the cavity and replace the cap.5.Power down in this order.a.Turn off the console by pressing the lit button in the center of the unit.b.Turn off the magnet power supply (PWR first and then ELECT).6.Turn off the Heat Exchanger – Be careful not to mistakenly push the Main power button.7.Close the chilled water valves.8.Close the nitrogen gas valve.9.Sign the logbook.F.C ONTACTSAdvance Methods Consultation Training and ServiceDr. Michael Everly Dr. Hartmut HedderichAmy Faculty, Director Snr. Instrumentation SpecialistDepartment of Chemistry Department of ChemistryOffice: BRWN 4151 Office: BRWN 4151Phone: 49-45232 Phone: 49-46543E-mail : ******************E-mail : *******************Appendix A – V ARIABLE T EMPERATURE O PERATION (C OLD E DGE) Using high purity helium as a coolant, sample temperature can be varied from 150 K to~5 K. This is done by flowing helium gas at the desired temperature through a dewar assembly installed within the cavity that surrounds the sample. The cold gas is generated by passing99.999% helium at room temperature through a heat exchanger connected to a Sumitomo closed-loop compressor system. This eliminates the need for using liquid helium and reduces the cost of operation by a factor of 10.Due to the extreme low temperatures, great care must be taken when inserting samples not to thermally stress the sample/cavity, contaminate the cavity with room temperature air, or crush the heater and thermocouple that sit just below the sample. To reduce the thermal shock, which usually results in broken sample tubes, all samples MUST be frozen in liquid nitrogen before placing them in the cavity. Prefreezing samples also greatly reduces the time needed for temperature equilibration. Sample tubes MUST be rigorously cleaned to avoid cavity contamination. Wash your sample tubes between uses with an appropriate solvent and wipe them off with a ChemWipe before inserting them in the cavity. System maintenance due to contamination by a carless user may be billed to the PI at a cost of $60/hr with a 4-hour minimum!P ROCEDURES–The procedures below are intended to be used as needed and are not listed sequentially.S TARTUP,C OOL-D OWN,S HUTDOWNDue to the complexity of the ColdEdge VT system, center staff will perform these operations. Users will need to coordinate startup and shutdown times with center staff.S ETTING T EMPERATUREThe Oxford Instruments Cryostat and LakeShore controller combination uses a heater to warm the flowing cold helium gas to the desired temperature. To set the temperature press the “Setpoint” button and enter the desired temperature and hit “Enter”. If you find that you have entered an incorrect value or menu that you didn’t want, simpl y press the cancel button.C HANGING/I NSERTING S AMPLES1.Place the Microwave Bridge Controller in STANDBY mode.2.With one hand, remove the sample/cap from the cavity. With the other hand, insert thenew sample.Notes – This must be done as quickly as possible to prevent room temperature air from entering the cavity.– Samples must be frozen prior to inserting them in the cavity!3.Tune the cavity and set parameters to the instrument as usual.4.Wait for the sample to thermally equilibrate (~10 minutes) and fine-tune the cavity.Appendix B – M ANUAL T UNING THE M ICROWAVE C AVITY In case the automatic tuning operation (in Part V. of the training outline) fails to properly tune the cavity and bridge, a message indicating this failure will be shown in the mode indicator in the center of the microwave bridge controller display.Some samples may be somewhat "lossy," i.e., the sample or solvent changes the conditions in the cavity to decrease the cavity absorption dip. If this effect is only minimal, it may still be possible to manually tune the cavity and bridge by the following procedure.If the sample is very "lossy," it may be impossible to observe a sufficient cavity dip for lock-on by the control system. If the control system cannot be stabilized as indicated by inability to center the LOCK OFFSET meter or the DIODE CURRENT meter, then a different (aqueous) cavity will need to be installed. Contact RIC staff to make this change.Manually Tuning Procedure (Summarized from section 5.1of the WinEPR acquisition manual)1.If the Microwave Bridge Controller window is not open, click on the Microwave Bridgebutton on the tool bar.2.Select the TUNE mode. See the image below.e the pairs of up/down arrow keys set the attenuation to 25dB. The leftmost pairchanges in units of 10dB and the rightmost pair changes in 1dB units.e the right/left arrow buttons of the Frequency slider to center the tuning dip as shownabove. The system takes long fractions of a second to respond so do not click too fast.5.The dip should cover come about 2/3 of the way to the baseline. If the dip is too small orlarge, decrease or increase, respectively the attenuation in 1dB steps.e the right/left arrow buttons of the Signal Phase slider to adjust phase until the tuningdip is symmetrical as shown above and is as deep as possible. If the dip points up, the phase is 180 degrees off. If it has positive and negative lobes, it is ~90 degrees off. The system takes long fractions of a second to respond so do not click too fast.7.Select the Operate mode and then fine-tune the Frequency to center the AFC indicator inthe Instrument Monitor window. Readjust as needed if the AFC drifts during subsequent steps.8.Set attenuation to 50dB and use the right/left arrow buttons of the Bias slider to center theDiode Current meter (200 µA) in the Instrument Monitor Window9.The steps below adjusting the iris (critical coupling) are iterative in nature.a.Lower the attestation by 10dB.e the Up/Down keys of the Iris, bring the diode current back to center.c.Repeat the steps above until reaching 10dB.Note – If the AFC lock drifts, center it by adjusting the frequency.10.While at 10dB of attenuation, adjust phase to achieve maximum Diode current.11.Cycle through 10, 20, 30, 40, 50 dB to verify that the Diode current remains constant. Ifnot, repeat the tuning process.12.Click the Microwave Bridge button to close the window.Page B2。
红外手册01
FTIR SPECTROMETER 用户培训教材2000年十二月FTIR 原理(略)Spectrum 3.0红外应用软件主菜单常用功能简介本简介是为了帮助记忆主菜单常用功能而写的,菜单功能的详细使用说明请参照使用说明书和在线帮助一、FILE 文件菜单Status…状态。
显示软件自动记录的光谱状态参数,包括时间、仪器和校正情况等。
Copy to Report 拷贝光谱到报告模板。
二、EDIT 编辑菜单。
剪切、复制和粘贴光谱到其他窗口或其他Windows应用软件三、VIEW 视图菜单Optima 优化显示Format View…显示格式,设定显示光谱纵、横坐标范围、颜色、字体等。
Overlay/Split Display 叠合/分列方式显示光谱Cursor 光标Vertical-Continuous 连续垂直光标Vertical-Peak 峰值垂直光标Horizontal 水平光标Radar Display 雷达光谱,窗口显示的光谱全图Previous Range 恢复前一显示范围Autorange X 自动优化X轴显示范围Autorange Y 自动优化Y轴显示范围Autoscale Y 自动优化Y轴标尺Cancer Autoscale 取消自动优化Y轴标尺Cancer Offset 取消重臵标尺Full Scale 自动全范围优化标尺显示Label Cursor 标记光标,在当前光标所在处标示纵、横坐标值。
Label peaks 标记峰值,标记吸收峰的纵、横坐标值。
Clear All Peak Labels 清除峰值标记Add/Edit Text 加入/编辑文字四、PROCESS 光谱处理菜单UndoDate turn-up 专家系统光谱处理,可包括基线校正、平滑处理和扣空白。
Absorbance 转换为吸光度Transmittance 转换为透过率Kubelka-Munk K-M漫反射校正转换Convert X…X轴坐标转换Difference 差谱Baseline Correction 基线校正。
BRUKE红外OPUS操作流程

1、Open the power behind the instrument and wait for the “Status” light on the panel turns green.打开仪器背后的电源,等待“Status”灯变绿。
2、Double click the icon of OPUS to open the software.双击OPUS图标打开软件。
3、The Login dialog box opens. Select your User ID from the drop-down list. If you use OPUS for the first time, the User ID drop-down list includes the two pre-defined user records Default and Administrator. Select either one of them. Enter OPUS in the Password entry field.在登录窗口从下拉列表中选出你的用户名。
如果是第一次运行OPUS,用户名下拉表中Default 和Administrator 可任选一个。
在密码字段输入OPUS,要用大写。
4、We recommend to sellect the standard Default.ows workspace.Click on the Login button and the About OPUS window opens.建议选择标准“”工作台设置。
单击登录钮,打开上面的OPUS 窗口。
5、Click on the Advanced tab in the Measurement dialog box., you can click“Load” button to load an XPM file(etc,).It is also possible to enter the data path defined for the automatic storing of the measurement. If you change this path, make sure that it does exist.在Measurement 对话框中点击Advanced ,在这个页面中再点击“Load”读取一个测量参数文件(例如文件)。
布鲁克红外仪器操作规程与维护规程
布鲁克红外仪器操作规程与维护规程BRUKER TENSOR 27 FT-IR仪器操作规程与维护规程1目的规范TENSOR27红外光谱仪的操作程序,正确使用仪器,保证检测工作顺利进行、操作人员人身安全和设备安全。
2适用范围适用于TENSOR27红外光谱仪的使用操作与日常维护。
3操作程序3.1安全操作注意事项和特别提示3.1.1该仪器必须由专人保管,专人使用,使用人员必须经过专门培训,并仔细阅读说明书,确保对仪器具有充分的认识。
3.1.2使用环境:电源电压:85~265V,47~65Hz温度范围:18~35℃湿度范围:小于70%仪器室须保持无尘,无腐蚀性气体,无强烈振动。
3.1.3严格遵守操作规程,如仪器出现故障,须立即退出检测状态,并向保管人或科室负责人报告,查明原因,及时处理,不得擅自“修理”,同时做好使用和故障情况登记及实验室记录。
3.1.4日常保养:当位于仪器的右上角的红色电子湿度指示灯闪烁时,应该立即更换干燥剂。
包括位于样品仓内的干燥剂及位于干涉仪仓内的干燥剂。
若仪器长期不用,则必须至少每两星期更换一次干燥剂并且每周至少开启主机一次,每次开机时间不低于4小时,样品仓内干燥剂为变色硅胶,再生按变色硅胶方法处理。
再生、更换干涉仪仓干燥剂步骤:(1)小心将失效干燥管从仪器中取出,并将已再生好的备用干燥管小心装入仪器;(2)打开失效干燥管密封盖,将干燥剂(分子筛,白色)倒出;(切(3)将倒出的干燥剂放入适当的容器,在干燥烘箱于150℃下再生不低于24小时;勿连同干燥管一起加热!))(4)在干燥气氛中冷却干燥剂至50℃以下,然后才能将干燥剂重新装入干燥管中,盖好密封盖,在干燥气氛中保存备用。
(切勿将高温干燥剂立即放入,否则会损坏红外光谱仪!)3.1.5样品测定完毕,须保持仪器样品仓的清洁,并将样品移出仪器室,关好仪器、电脑及水、电、门窗等。
3.2开机前的准备3.2.1检查确认电源插座上的电压是否在规定的范围内。
布鲁克Q2、Q4直读光谱仪软件详细安装教程
布鲁克Q2、Q4直读光谱仪软件安装教程本教程只适用于Windows7专业版系统!安装过程有问题可以联系QQ:183838231注:装此软件最好用Windows7专业版系统,XP系统不容易成功。
下载地址:Windows7专业版系统:下载地址:nt6 oem loader(win7专业版激活工具) V3.3.1 绿色版用迅雷下载好,系统用虚拟光驱或刻盘安装都可以安装。
一、软件卸载:1、打开控制面板,点击程序卸载一栏,依次卸载如下图五个程序。
2、删除C盘中文件和中的文件,若需要保留以前的数据,请先备份文件。
3、关闭电脑和仪器,拔掉仪器网口数据线和USB接口数据线。
二、软件安装:1、启动电脑,打开“控制面板”,在“系统和安全”里将操作中心内的用户账户控制设置为“从不通知”;将windows防火墙和自动更新“关闭”;将电源选项里计算机睡眠时间设为“从不”。
2、打开控制面板—网络和Internet—网络和共享中心—更改适配器设置—本地连接,在属性里将tcp/ipv4设置成192.168.10.1 ,子网掩码 255.255.255.0。
3、将安装光盘(Qmatrix setup3、X、X)放入光驱并打开,运行setup.exe,根据提示进行安装、下一步或者完成等操作,注意选择正确的仪器型号(Q2或者Q4:130/170/200(Q2默认130就可以了)),Restore Delivery Data(要打上钩)按照提示装完一系列软件,中途有选择时全部选择安装即可。
4、所有软件安装完成会提示是否重启系统,选择否,稍后手动重启。
5、打开控制面板“区域和语言”选项—管理—将语言改成英语(美国),点确定后自动重启。
6、电脑重启后不要进行任何操作,会自动弹出一个进度条安装DIA2000SE数据库,显示100%安装后点击确定。
在把电脑重启一下。
7、将光盘中的文件,拷贝到C:\Program Files 将原文件夹覆盖,若需要原来数据库内的数据,请将备份的文件复制到C盘进行覆盖。
IntroductionOPUS中文说明书
Spectroscopic Software快速入门Version 5I 26031© 2004 BRUKER OPTIK GmbH, Rudolf-Plank-Straße 27, D-76275 Ettlingen, The text, figures, and programs have been worked out with the utmost care. However, we do not accept legal responsibility or any liability for either incorrect statements which may remain or their consequences. The following publication is protected by copyright. All rights reserved. No part of this publication may be reproduced in any form by photocopy, microfilm or other procedures or transmitted in machine language, in particular for data processing systems, without our prior written authorization. The rights to distribution and to broadcasting as well as the rights to communication to the public are also reserved. The software and hardware descriptions referred to in this manual are in many cases registered trademarks and as such are subject to legal requirements.This manual is the original documentation for the OPUS spectroscopic software.Bruker Optik GmbH OPUS - Getting Started 11启动OPUS安装OPUS 前,请阅读所提供的文件。
- 1、下载文档前请自行甄别文档内容的完整性,平台不提供额外的编辑、内容补充、找答案等附加服务。
- 2、"仅部分预览"的文档,不可在线预览部分如存在完整性等问题,可反馈申请退款(可完整预览的文档不适用该条件!)。
- 3、如文档侵犯您的权益,请联系客服反馈,我们会尽快为您处理(人工客服工作时间:9:00-18:30)。
目录
1 启动 OPUS. . . . . . . . . . . . . . . . . . . . . . . . . . . . . . . . . . . . . . . . . . . . . . . . .1 2 使用 OPUS 软件 . . . . . . . . . . . . . . . . . . . . . . . . . . . . . . . . . . . . . . . . . . . .7
Figure 5: OPUS Access Control Diagram
OPUS 用户数据库 User Database 包含所有用户记录。
用户记录 Records 如下: • 用户 ID • 口令 • 操作者名称 • 用户组 (管理员、操作员) • 可使用的工作台
工作台包含: • 菜单内容 • 工具条内容 • 使用权限 • 其它设置 (如文件扩展名模式、显示范围)
3 打印版面编辑器 (PLE) . . . . . . . . . . . . . . . . . . . . . . . . . . . . . . . . . . . . . .27
3.1 打开 PLE . . . . . . . . . . . . . . . . . . . . . . . . . . . . . . . . . . . . . . . . . . . . . . . . . . . . 27 3.2 为 Windows NT 安装打印机 . . . . . . . . . . . . . . . . . . . . . . . . . . . . . . . . . . . . 28 3.3 定义打印区域 . . . . . . . . . . . . . . . . . . . . . . . . . . . . . . . . . . . . . . . . . . . . . . . . 28 3.4 调入和显示谱图 . . . . . . . . . . . . . . . . . . . . . . . . . . . . . . . . . . . . . . . . . . . . . . 29 3.5 连接一个徽标或位图 . . . . . . . . . . . . . . . . . . . . . . . . . . . . . . . . . . . . . . . . . . 32 3.6 连接图形元素和文字 . . . . . . . . . . . . . . . . . . . . . . . . . . . . . . . . . . . . . . . . . . 33 3.7 存贮打印模板 . . . . . . . . . . . . . . . . . . . . . . . . . . . . . . . . . . . . . . . . . . . . . . . . 34
(h) 仪器状态指示: 绿色 =OK 黄色 = 警告 红色 = 错误
所有配置 (菜单或图标)都是各自用户事先设置,下次启动 OPUS,程序 将会调用这些设置。
Bruker Optik GmbH
OPUS - Getting Started
3
启动 OPUS
OPUS 使用权的控制
OPUS 遵从如下图所示的使用权控制机制。
有关用户管理的详细功能(如从用户数据库中添加、修改或删除用户)tarted
Bruker Optik GmbH
注册
安装 OPUS 后你可以使用此程序 30 天而不用注册。试用期后注册 OPUS 软件。只有注册后你才能使用谱库和其它软件包。这些信息(密码和序列 号等)只能从 Bruker 得到。对该系统所有用户只须注册一次。你必须是 Windows 相当权限的用户时才能注册。从 Setup → Register OPUS... 进行注 册,进入后会看到如下对话框:
2.1 采集光谱 . . . . . . . . . . . . . . . . . . . . . . . . . . . . . . . . . . . . . . . . . . . . . . . . . . . . . 7 2.1.1 使用 OPUS-OS/2 设置文件 . . . . . . . . . . . . . . . . . . . . . . . . . . . . . . 7 2.1.2 设置仪器光学部件 . . . . . . . . . . . . . . . . . . . . . . . . . . . . . . . . . . . . . 7 2.1.3 设置测量参数 . . . . . . . . . . . . . . . . . . . . . . . . . . . . . . . . . . . . . . . . . 8 2.1.4 校准干涉仪峰位 . . . . . . . . . . . . . . . . . . . . . . . . . . . . . . . . . . . . . . 10 2.1.5 高级设置 . . . . . . . . . . . . . . . . . . . . . . . . . . . . . . . . . . . . . . . . . . . . 11 2.1.6 测量背景 . . . . . . . . . . . . . . . . . . . . . . . . . . . . . . . . . . . . . . . . . . . . 14 2.1.7 测量样品 . . . . . . . . . . . . . . . . . . . . . . . . . . . . . . . . . . . . . . . . . . . . . 15
iii
1 启动 OPUS
安装 OPUS 前,请阅读所提供的文件。
将OPUS光盘放入光盘驱动器中。通常安装程序会自动运行。如果Windows 的“自动运行”被禁止,则必须用 Windows 资源管理器 , 并选择光盘驱动 器,运行安装程序。该程序将引导你安装,只要按提示做就行了。
安装结束时程序会问是否要重新启动计算机。有时安装一些其它部件时也 可能会问该问题。在 OPUS 安装完成之前不必重新启动!
2.2 基线校正 . . . . . . . . . . . . . . . . . . . . . . . . . . . . . . . . . . . . . . . . . . . . . . . . . . . 17 2.3 数据文件历史 . . . . . . . . . . . . . . . . . . . . . . . . . . . . . . . . . . . . . . . . . . . . . . . . 21 2.4 存贮光谱图 . . . . . . . . . . . . . . . . . . . . . . . . . . . . . . . . . . . . . . . . . . . . . . . . . . 22 2.5 调入光谱图 . . . . . . . . . . . . . . . . . . . . . . . . . . . . . . . . . . . . . . . . . . . . . . . . . . 24 2.6 打印光谱图 . . . . . . . . . . . . . . . . . . . . . . . . . . . . . . . . . . . . . . . . . . . . . . . . . . 26
(a)
(b)
(c)
(d)
(e) (f) (g) Figure 4: OPUS User Interface
(a) OPUS 软件所有功能的下拉菜单。 (b) 自定义个性化的图标条。 (c) OPUS 文件管理器。 (d) 全频率谱图显示窗口。
(e) 概貌窗口总是显示所选文件的整个频率范围。
(f) 在线帮助。 (g) 显示所有在后台运行任务的条。
Bruker Optik GmbH
OPUS - Getting Started
1
启动 OPUS
Figure 2: OPUS Login Dialog
OPUS 中对操作者和管理员权限有不同的帐号。操作者的用户权限相对于管 理员是有限的。权限根据用户而不同。 给定的工作台与用户界面和权限是相关联的。你可以从下拉表中选择工作 台。 你第一次使用OPUS时,建议不要更改标准“Default”工作台的设置。 单击登录钮,打开上面的 OPUS 窗口。 显示你所注册的 OPUS 软件的序列号及用户名。OPUS 基本软件包集成了全 部的附加软件包于一体。
安装结束后, OPUS 图标将被加到 Windows 开始菜单中。用鼠标单击 OPUS 图标可进入该程序。
Figure 1: Windows Start Menu
在登录窗口从下拉列表中选出你的用户名。OPUS 提供独立分级的用户帐号 系统。如果是第一次运行 OPUS,用户名下拉表中有两个事先定义的用户记 录,Default 和 Administrator ;可任选一个。 在密码字段输入 OPUS,要用大写。密码大小写敏感。一旦在 OPUS 中建立 了自己的用户记录,就能够定义自己的用户名和密码。
Spectroscopic Software
Version 4.2
快速入门
© 2002 BRUKER OPTIK GmbH
The text, figures, and programs have been worked out with the utmost care. However, we cannot accept either legal responsibility or any liability for any incorrect statements which may remain, nor their consequences. The following publication is protected by copyright. All rights reserved. No part of this publication may be reproduced in any form by photocopy, microfilm or other procedures or transmitted in a usable language for machines, in particular data processing systems without our written authorization. The rights of reproduction through lectures, radio and television are also reserved. The software and hardware descriptions referred to in this manual are in many cases registered trademarks and as such are subject to legal requirements.
