crystal ball中英文教程
crystal_ball_软件教学

13-4
报童佛莱迪
➢ 佛莱迪在某大城市里主要市区经营一家报摊。
➢ 佛莱迪贩卖各类的报纸和杂志,其中最贵的报纸为财 经日报 。
➢ 财经日报相关的成本资料:
– 每份报纸的成本为1.50美元 – 每份报纸的售价为2.50美元 – 没售出的报纸,每份报纸可以获得0.50美元的偿还金
➢ 财经日报的销售资料:
– 佛莱迪每天的销售量介于40到70份之间。 – 销售数量介于40到70份之间任何数值的频率相同。
13-5
运用仿真之电子表格模式
13-6
CrystalBall的应用
➢ 利用CrystalBall来进行计算机仿真有四个步骤:
1. 定义随机输入栏。 2. 定义输出栏来预测。 3. 设定执行偏好。 4. 执行模拟。
某一事件发生次数之分配:二项分配
➢ 描述在固定试验次数内的事件发生次数(如:丢10次铜板出现正面的 次数)
➢ 每次试验只有二种可能结果 ➢ 试验相互独立 ➢ 每次试验的机率相同
13-62
直到某事件发生的试验次数:几何
➢ 描述事件发生前的试验次数(如在转轮盘赌局中获胜前的下注 次数)
➢ 每次试验的机率皆相同 ➢ 成功前不能停止 ➢ 试验次数不限定
13-56
具有三个参数的分配:韦伯分配
➢ 某数值(位置)以上的随机数值 ➢ Shape(形状参数)> 0(通常 ≤10) ➢ Shape < 3会太过正偏态较(小于平均值的机率较大),类似
指数分配(當Shape =1时与指数分配相等) ➢ 当Shape =3.25时为对称形,超过这个数值为负偏态 ➢ Scale(规模参数)定义宽度
13-53
一种常用集中趋势分配:对数常态分配
风险管理软件CrystalBall操作指南
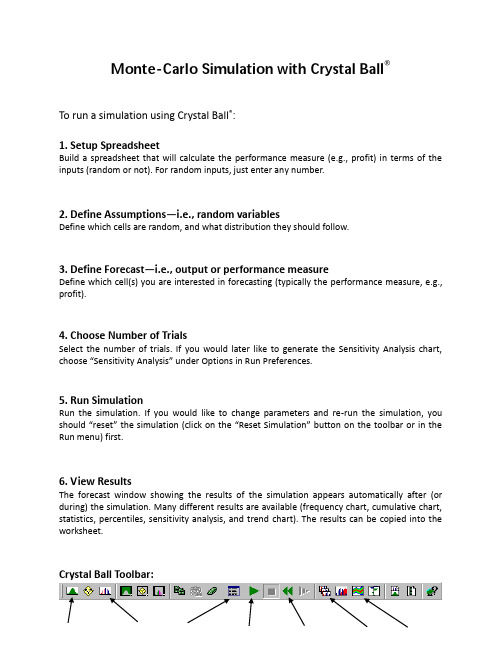
风险管理软件CrystalBall操作指南Monte-Carlo Simulation with Crystal Ball®To run a simulation using Crystal Ball®:1. Setup SpreadsheetBuild a spreadsheet that will calculate the performance measure (e.g., profit) in terms of the inputs (random or not). For random inputs, just enter any number.2. Define Assumptions—i.e., random variablesDefine which cells are random, and what distribution they should follow.3. Define Forecast—i.e., output or performance measureDefine which cell(s) you are interested in forecasting (typically the performance measure, e.g., profit).4. Choose Number of TrialsSelect the number of trials. If you would later like to generate the Sensitivity Analysis chart, choose 〝Sensitivity Analysis〞under Options in Run Preferences.5. Run SimulationRun the simulation. If you would like to change parameters and re-run the simulation, you should 〝reset〞 the simulation (click on the 〝Reset Simulation〞 button on the toolbar or in the Run menu) first.6. View ResultsThe forecast window showing the results of the simulation appears automatically after (orduring) the simulation. Many different results are available (frequency chart, cumulative chart, statistics, percentiles, sensitivity analysis, and trend chart). The results can be copied into the worksheet.Crystal Ball Toolbar:Define Define Run Start Reset Forecast Trend Assumptions Forecast Preferences Simulation Simulation Window ChartRecall the Walton Bookstore example: It is August, and they must decide how many of next year’s nature calendars to order. Each calendar costs the bookstore $7.50 and is sold for $10. After February, all unsold calendars are returned to the publisher for a refund of $2.50 per calendar. Suppose Walton predicts demand will be somewhere between 100 and 300 (discrete uniform).Demand = d ~ Uniform[100, 300]Order Quantity = Q (decision variable)Revenue = $10 * Min(Q, d)Cost = $7.50 * QRefund = $2.50 * Max(Q–d, 0)Profit = Revenue – Cost + RefundStep #1 (Setup Spreadsheet)Step #2 (Define Assumptions —i.e., random variables)—color code (blue):and click on the 〝Define Assumptions 〞 button in toolbar (or in the Cell menu):Select type of distribution:Provide parameters of distributions:Walton Bookstore Simulation with Crystal Ball®Step #3 (Define Forecast—i.e., output)click on the 〝Define Forecast〞 button in toolbar (or in the Cell menu),and fill in the Define Forecast dialogue box.Step #4 (Choose Number of Trials)Click on the 〝Run Preferences〞 button in toolbar (or in the Run menu):and select the number of trials to run.Walton Bookstore Simulation with Crystal Ball®Step #5 (Run Simulation)Click on the 〝Start Simulation〞 button in toolbar (or Run in the Run menu):Step #6 (View Results)The results of the simulation can be viewed in a variety of different ways (frequency chart, cumulative chart, statistics, and percentiles). Choose different options under the View menuin the forecast window.The results can be copied into a worksheet or Word document (choose Copy under the Edit menu in the simulation output window.Using Trend Charts to Find the Impact of Order Quantityon Potential ProfitDefine several forecast cells (G14:G18) for several possible order quantities (Q=100, 150, 200, 250, 300). Use the same random order quantity for each to compare them more equally (i.e., one assumption cell for demand—C14—with the rest set equal to C14).After running the simulation, choose 〝Open Trend Chart〞 in the Run menu. This chart gives 〝certainty bands〞 for the forecast cells. 10% of the time, the project duration will fall within the inner band (light blue), 25% of the time within the 2nd band (red), 50% of the time within the third band (green), and 90% of the time within the outside band (dark blue).Project Management—Global OilGlobal Oil is planning to move their credit card operation to Des Moines, Iowa from their home office in Dallas. The move involves many different divisions within the company. Real estate must select one of three available office sites. Personnel has to determine which employees from Dallas will move, how many new employees to hire, and who will train them. The systems group and treasurer’s office must organize the new operating procedure and make financial arrangements. The architects will have to design the interior space, and oversee needed structural improvements. Each site is an existing building with sufficient open space, but office partitions, computer facilities, furnishings, and so on, must all be provided.A complicating factor is that there is an interdependence of activities. In other words, some parts of the project cannot be started until other parts are completed. For example, Global cannot construct the interior of an office before it has been designed. Neither can it hire new employees until it has determined its personnel requirements.The necessary activities and their necessary predecessors (due to interdependence) are listed below. Three estimates are made for the completion time of each activity—the minimum time, most likely time, and maximum time.Start EndGlobal Oil Simulation with Crystal Ball®Step #1 (Setup Spreadsheet)Step #2 (Define Assumptions—i.e., random variables)Each of the random activity times (B, C, D, E, G, and I) is assumed to follow the triangular distribution.Global Oil Simulation with Crystal Ball®Step #3 (Define Forecast—i.e., output)Cell J15 is the forecast cell:Step #4 (Choose Number of Trials)500 trials were run. In addition, Sensitivity Analysis was enabled in the Options of the Run Preferences dialogue box. This allows for the generation of sensitivity analysis results later.Step #5 (Run Simulation)Step #6 (View Results)Additional Results Available with Crystal Ball®Slide the triangles below the histograms to determine the probability that the output (project duration) is less than a certain value (e.g., a deadline), greater than a certain value, or between any two values (by sliding both triangles).Alternatively, you can type in values for the lower bound or upper bound to determine the probability. You can also type in a probability (in 〝Certainty〞), and it will determine the range that has that probability.There is a 79% chance the project will be completed within 150 days.There is a 2.4% chance that the project will take more than 160 days.Sensitivity ChartChoose 〝Open Sensitivity Chart〞 in the Run menu. Note that this chart is only available ifyou selected the 〝Sensitivity Analysis〞 option under Run Preferences. This chart gives an indication as to which random variables (activity times) have the greatest impact on the output cell (project completion time).Variability in activity E has the greatest impact on overall project duration, followed by activity D, C, I, and B. Variability in activity G has almost no impact.Fitting a DistributionCrystal Ball can be used to 〝fit〞 a distribution to data.The following data has been collected for the previous 100 phone calls to a mail-order house:(80 rows have been hidden)Fitting Data to a DistributionUsing Crystal Ball® to fit data to a distribution1. Select a spreadsheet cell.2. Choose Define Assumption.3. Click the Fit button, then select the source of the fitted data.4. Click the Next button, then select the distributions to try to fit.5. Click OK.Interarrival TimeService Time。
crystalball实验操作过程

C r y s t a l B a l l实验操作过程(总7页)-CAL-FENGHAI.-(YICAI)-Company One1-CAL-本页仅作为文档封面,使用请直接删除Crystal Ball实验操作过程实验一:一、数据录入与导入双击CB快捷方式图标或直接打开Excel打开软件。
前面提到过Crystal Ball软件是在Excel里的一个插件,所以双击打开后是Excel的界面,如下图:图 1用户可以在该界面中直接录入数据,也可以左击右上角的符号,选择打开,将原有Excel表格中的数据直接导入到带有Crystal Ball插件的电子表格中。
二、拟合分布图2(1)对数据进行标准化处理(减少原数据相互间的距离对拟合分布的影响)通过Average计算每个分布工程样本数据的均值,然后各个样本数据除以相应的均值,对数据进行标准化处理。
(2)拟合分布选取表格区域,点击工具栏上“Run-Tools-Batch Fit”,如图3所示。
图3在操作对话框中,选择“next”,至图4对话框对相应命令进行选择,可得到拟合过程的相关数据。
图4注:对于卡方检验,水晶球软件计算p值,p值大于一般表示紧密拟合;对于科尔莫格洛夫-斯米尔诺夫检验,一般地,小于的K-S值表明良好拟合;对于安德森-达林检验,小于的计算值一般表明拟合优良。
实验二:一.按照实验一的操作,先将数据在Crystal Ball软件打开.二、假设单元格概率分布的定义及相关操作输入数据后,进行随机变量假设单元格概率分布的定义。
这里假设使用悲观时间的单元格来进行概率分布的定义。
(注:对于假设单元格的选择,并无太多的限制,因为定义各种概率的分布,是由相应的参数确定的,因此选择的假设单元格不同对结果并没有影响。
)有一点需要注意的是,选择假设单元格时,该单元格应当是一确定的数字,而不能是公式.选定单元格(如单元格I2)后,点击工具栏上的,随即弹出图5,CB 软件中提供22种不同的分布可供选择,根据实验任务书的要求,第一和第二项分部分项工程服从三参数beta分布,因此,选择BtaPERT分布,并填入相应参数,即可完成对“基坑支护挖土方”的定义,如图6所示。
风险管理软件Crystal_Ball使用指导中英文
Monte-Carlo Simulation with Crystal Ball®用水晶球软件进行蒙特卡洛模拟To run a simulation using Crystal Ball®:1.Setup Spreadsheet1.设定数据表Build a spreadsheet that will calculate the performance measure (e.g., profit) in terms of the inputs (random or not). For random inputs, just enter any number.通过建立数据表可以对输入数据(随机的,非随机)进行评估。
随机数据的输入,输入任意数即可。
2. Define Assumptions—i.e., random variablesDefine which cells are random, and what distribution they should follow.2.定义假设的前提—例如,随机变量确定那些单元格的数据时随机的,这些数据应该服从什么样的分布3. Define Forecast—i.e., output or performance measureDefine which cell(s) you are interested in forecasting (typically the performance measure, e.g., profit).3.预测结果的确定—例如,数据输出或者性能的测定确定哪些单元格的数据是你想预测的(典型的性能指标,例如,利润)4. Choose Number of TrialsSelect the number of trials. If you would later like to generate the Sensitivity Analysis chart, choose “Sensitivity Analysis”under Options in Run Preferences.4. 选择试验的次数选择试验的次数。
水晶球软件使用CrystalBall

➢ Ignore it ➢ Simplify problem to make it analytically
tractable, get solution, then ignore real-life complications ➢ Find a way to obtain an approximate solution to real-world problems
Let 1 represent “heads” and 2 represent “tails”. Consider the following RNG:
=IF(RAND( )<0.5,1,2)
Generating Random Numbers with Crystal Ball
Crystal Ball provides two different ways for creating Random Number Generators in spreadsheets
We can implement Random Number Generators for uncertain cells to allow us to sample from the distribution of values expected for different cells.
How Random Number Generators Work
This is easy to do and bounds the outcomes, but tells
us nothing about the distribution of possible
outcomes within the best and worst-case limits.
风险管理软件CrystalBall使用指导
Monte-Carlo Simulation with Crystal BallTo run a simulation using Crystal Ball:1. Setup SpreadsheetBuild a spreadsheet that will calculate the performance measure ., profit in terms of the inputs random or not. For random inputs, just enter any number.2. Define Assumptions—., random variablesDefine which cells are random, and what distribution they should follow.3. Define Forecast—., output or performance measureDefine which cells you are interested in forecasting typically the performance measure, ., profit.4. Choose Number of TrialsSelect the number of trials. If you would later like to generate the Sensitivity Analysis chart, choose “Sensitivity Analysis” under Options in Run Preferences.5. Run SimulationRun the simulation. If you would like to change parameters and re-run the simulation, you should “reset” the simulation click on the “Reset Simulation” button on the toolbar or in the Run menu first.6. View ResultsThe forecast window showing the results of the simulation appears automatically after or during the simulation. Many different results are available frequency chart, cumulative chart, statistics, percentiles, sensitivity analysis, and trend chart. The results can be copied into theworksheet.Crystal Ball Toolbar:Define Define Run Start Reset Forecast Trend Assumptions Forecast Preferences Simulation Simulation Window ChartWalton Bookstore Simulation with Crystal BallRecall the Walton Bookstore example: It is August, and they must decide how many of next year’s nature calendars to order. Each calendar costs the bookstore $ and is sold for $10. After February, all unsold calendars are returned to the publisher for a refund of $ per calendar. Suppose Walton predicts demand will be somewhere between 100 and 300 discrete uniform.Demand = d ~ Uniform100, 300Order Quantity = Q decision variableRevenue = $10 Min Q, dCost = $ QRefund = $ Max Q–d, 0Profit = Revenue – Cost + RefundStep 1 Setup SpreadsheetWalton Bookstore Simulation with Crystal BallStep 2 Define Assumptions —., random variables— color code blue:and click on the “Define Assumptions” button in toolbar or in the Cell menu:Select type of distribution:Provide parameters of distributions:Walton Bookstore Simulation with Crystal BallStep 3 Define Forecast—., outputclick on the “Define Forecast” button in toolbar or in the Cell menu,and fill in the Define Forecast dialogue box.Step 4 Choose Number of TrialsClick on the “Run Preferences” button in toolbar or in the Run menu:and select the number of trials to run.Walton Bookstore Simulation with Crystal BallStep 5 Run SimulationClick on the “Start Simulation” button in toolbar or Run in the Run menu:Step 6 View ResultsThe results of the simulation can be viewed in a variety of different ways frequency chart, cumulative chart, statistics, and percentiles. Choose different options under the View menu in the forecast window.The results can be copied into a worksheet or Word document choose Copy under the Edit menu in the simulation output window.Using Trend Charts to Find the Impact of Order Quantity on Potential ProfitDefine several forecast cells G14:G18 for several possible order quantities Q=100, 150, 200, 250, 300. Use the same random order quantity for each to compare them more equally ., one assumption cell for demand—C14—with the rest set equal to C14.After running the simulation, choose “Open Trend Chart” in the Run menu. This chart gives “certainty bands” for the forecast cells. 10% of the time, the project duration will fall within the inner band light blue, 25% of the time within the 2nd band red, 50% of the time within the third band green, and 90% of the time within the outside band dark blue.Project Management—Global OilGlobal Oil is planning to move their credit card operation to Des Moines, Iowa from their home office in Dallas. The move involves many different divisions within the company. Real estate must select one of three available office sites. Personnel has to determine which employees from Dallas will move, how many new employees to hire, and who will train them. The systems group and treasurer’s office must organize the new operating procedure and make financial arrangements. The architects will have to design the interior space, and oversee needed structural improvements. Each site is an existing building with sufficient open space, but office partitions, computer facilities, furnishings, and so on, must all be provided.A complicating factor is that there is an interdependence of activities. In other words, some parts of the project cannot be started until other parts are completed. For example, Global cannot construct the interior of an office before it has been designed. Neither can it hire new employees until it has determined its personnel requirements.The necessary activities and their necessary predecessors due to interdependence are listed below. Three estimates are made for the completion time of each activity—the minimum time, most likely time, and maximum time.Start EndGlobal Oil Simulation with Crystal BallStep 1 Setup SpreadsheetStep 2 Define Assumptions—., random variablesEach of the random activity times B, C, D, E, G, and I is assumed to follow the triangular distribution.Global Oil Simulation with Crystal BallStep 3 Define Forecast—., outputCell J15 is the forecast cell:Step 4 Choose Number of Trials500 trials were run. In addition, Sensitivity Analysis was enabled in the Options of the Run Preferences dialogue box. This allows for the generation of sensitivity analysis results later.Step 5 Run SimulationStep 6 View ResultsAdditional Results Available with Crystal BallSlide the triangles below the histograms to determine the probability that the output project duration is less than a certain value ., a deadline, greater than a certain value, or between any two values by sliding both triangles.Alternatively, you can type in values for the lower bound or upper bound to determine the probability. You can also type in a probability in “Certainty”, and it will determine the range that has that probability.There is a 79% chance the project will be completed within 150 days.There is a % chance that the project will take more than 160 days.Sensitivity ChartChoose “Open Sensitivity Chart” in the Run menu. Note that this chart isonly available if you selected the “Sensitivity Analysis” option under Run Preferences. This chart gives an indication as to which random variables activity times have the greatest impact on the output cell project completion time.followed by activity D, C, I, and B. Variability in activity G has almost no impact.Fitting a DistributionCrystal Ball c an be used to “fit” a distribution to data.The following data has been collected for the previous 100 phone calls to a mail-order house:80 rows have been hiddenFitting Data to a DistributionUsing Crystal Ball to fit data to a distribution1. Select a spreadsheet cell.2. Choose Define Assumption.3. Click the Fit button, then select the source of the fitteddata.4. Click the Next button, then select the distributions to try tofit.5. Click OK.Interarrival TimeService Time。
水晶球软件使用Crystal Ball
• Tradeoff between rigor and relevance
精选可编辑ppt
OPIM 5270 |Spring 2015
• Alternatives with the same expected value may involve very different levels of risk.
精选可编辑ppt
OPIM 5270 |Spring 2015
Methods of Risk Analysis
• Best-Case/Worst-Case Analysis • What-if Analysis • Simulation
精选可编辑ppt
OPIM 5270 |Spring 2015
Monte Carlo Simulation
• Monte Carlo simulation is a method by which approximate solutions are obtained to realistic (and therefore complicated) problems
Project Management Session 9 Crystal Ball
OPIM 5270
精选可编辑ppt
OPIM 5270 |Spring 2015
Session 9 Goals
Understand why risk must be analyzed Know pros / cons for three ways to analyze risk Identify random variables in models Know the four steps of a simulation process Generate random numbers with Crystal Ball Use the four steps of a simulation process Explain how Crystal Ball supports Proj. Mgmt.
crystal_ball_软件教学

© The McGraw-Hill Companies, Inc., 2009
模擬。 5. 描述當使用Crystal Ball時可以搭配電腦模擬的機率分配之特色。 6. 利用Crystal Ball程序辨識出符合歷史資料的連續分配。 7. 利用Crystal Ball的特色來產生一些幫助決策的決策表和趨勢圖。
© The McGraw-Hill Companies, Inc., 2009
13-14
步驟 4:執行模擬
➢ 若要開始執行電腦模擬,你只要點選「Start Simulation」 (開始模擬)按鈕就可以開始執行。
© The McGraw-Hill Companies, Inc., 2009
13-8
Crystal Ball 分配圖庫
© The McGraw-Hill Companies, Inc., 2009
13-9
Crystal Ball 均勻分配對話方塊
© The McGraw-Hill Companies, Inc., 2009
➢ 利用Crystal Ball來進行電腦模擬有四個步驟:
1. 定義隨機輸入欄。 2. 定義輸出欄來預測。 3. 設定執行偏好。 4. 執行模擬。
© The McGraw-Hill Companies, Inc., 2009
13-7
步驟 1:定義隨機輸入欄
➢ 隨機輸入欄是擁有隨機數值的輸入欄位 。
13-11
风险管理软件CrystalBall操作指南(英文版)(doc 16页)

风险管理软件CrystalBall操作指南(英文版)(doc 16页)Monte-Carlo Simulation with Crystal Ball®To run a simulation using Crystal Ball®:1. Setup SpreadsheetBuild a spreadsheet that will calculate the performance measure (e.g., profit) in terms of the inputs (random or not). For random inputs, just enter any number.2. Define Assumptions—i.e., random variablesDefine which cells are random, and what distribution they should follow.3. Define Forecast—i.e., output or performance measureDefine which cell(s) you are interested in forecasting (typically the performance measure, e.g., profit).4. Choose Number of TrialsSelect the number of trials. If you would later like to generate the Sensitivity Analysis chart, choose “Sensitivity Analysis” under Options in Run Preferences.5. Run SimulationRun the simulation. If you would like to change parameters and re-run the simulation, you should “reset” the simulation (click on the “Reset Simulation” button on the toolbar or in the Run menu) first.Walton Bookstore Simulation with Crystal Ball®Recall the Walton Bookstore example: It is August, and they must decide how many of next year’s nature calendars to order. Each calendar costs the bookstore $7.50 and is sold for $10. After February, all unsold calendars are returned to the publisher for a refund of $2.50 per calendar. Suppose Walton predicts demand will be somewhere between 100 and 300 (discrete uniform).Demand = d ~ Uniform[100, 300]Order Quantity = Q (decision variable)Revenue = $10 * Min(Q, d)Cost = $7.50 * QRefund = $2.50 * Max(Q–d, 0)Profit = Revenue – Cost + RefundStep #1 (Setup Spreadsheet)1 2 3 4 5 6 7 8 9 10 11 12 13 14 15 16 17A B C D E F Simulation of Walton's BookstoreD ataU ni t C ost =$7.50U ni t P rice =$10.00U ni t R ef und =$2.50D emand D is tribution (Uniform)M inim um =100M axi mum =300D ecis ion VariableOrder Quantity =200SimulationD em and R evenue C ost R efund P rof i t200$2,000.00$1,500.00$0.00$500.0015 16 17B C D E F SimulationD em and R evenue C ost R efund P rofi t 200=C5*M IN(C13,B17)=C4*C13=C6*M A X(C13-B17,0)=C17-D17+E17Walton Bookstore Simulation with Crystal Ball ®Step #2 (Define Assumptions —i.e., random variables)—color code (blue):1617B D emand 200and click on the “Define Assumptions” button in toolbar (or in the Cell menu):Select type of distribution:Provide parameters of distributions:8910B CD emand Distribution (U niform)M inim um =100M axi mum =300Walton Bookstore Simulation with Crystal Ball ®Step #3 (Define Forecast —i.e., output)1617F P rof i t$500.00click on the “Define Forecast” button in toolbar (or in the Cell menu),and fill in the Define Forecast dialogue box.Step #4 (Choose Number of Trials)Click on the “Run Preferences” button in toolbar (or in the Run menu):and select the number of trials to run.Walton Bookstore Simulation with Crystal Ball ®Step #5 (Run Simulation)Click on the “Start Simulation” button in toolbar (or Run in the Run menu):Step #6 (View Results)The results of the simulation can be viewed in a variety of different ways (frequency chart, cumulative chart, statistics, and percentiles). Choose different options under the View menu in the forecast window.The results can be copied into a worksheet or Word document (choose Copy under the Edit menu in the simulation output window.Using Trend Charts to Find the Impact of Order Quantityon Potential ProfitDefine several forecast cells (G14:G18) for several possible order quantities (Q=100, 150, 200, 250, 300). Use the same random order quantity for each to compare them more equally (i.e., one assumption cell for demand—C14—with the rest set equal to C14).1 2 3 4 5 6 7 8 9 10 11 12 13 14 15 16 17 18A B C D E F G Simulation of Walton's BookstoreD ataU ni t C ost =$7.50U ni t P rice =$10.00U ni t R ef und =$2.50D emand D is tribution (Uniform)M inim um =100M axim um =300SimulationOrder Quantity D em and R evenue C ost R efund P rof it 100200$1,000.00$750.00$0.00$250.00150200$1,500.00$1,125.00$0.00$375.00200200$2,000.00$1,500.00$0.00$500.00250200$2,000.00$1,875.00$125.00$250.00300200$2,000.00$2,250.00$250.00$0.0012 13 14 15 16 17 18B C D E F G SimulationOrder Quantity D em and R evenue C ost R efund P rofi t 100200=$C$5*M IN(B14,C14)=$C$4*B14=$C$6*M AX(B14-C14,0)=D14-E14+F14 150=$C$14=$C$5*M IN(B15,C15)=$C$4*B15=$C$6*M AX(B15-C15,0)=D15-E15+F15 200=$C$14=$C$5*M IN(B16,C16)=$C$4*B16=$C$6*M AX(B16-C16,0)=D16-E16+F16 250=$C$14=$C$5*M IN(B17,C17)=$C$4*B17=$C$6*M AX(B17-C17,0)=D17-E17+F17 300=$C$14=$C$5*M IN(B18,C18)=$C$4*B18=$C$6*M AX(B18-C18,0)=D18-E18+F18After running the simulation, choose “Open Trend Chart” in the Run menu. This chart gives “certainty bands” for the forecast cells. 10% of the time, the project duration will fall within the inner band (light blue), 25% of the time within the 2nd band (red), 50% of the time within the third band (green), and 90% of the time within the outside band (dark blue).Project Management—Global OilGlobal Oil is planning to move their credit card operation to Des Moines, Iowa from their home office in Dallas. The move involves many different divisions within the company. Real estate must select one of three available office sites. Personnel has to determine which employees from Dallas will move, how many new employees to hire, and who will train them. The systems group and treasurer’s office must organize the new operating procedure and make financial arrangements. The architects will have to design the interior space, and oversee needed structural improvements. Each site is an existing building with sufficient open space, but office partitions, computer facilities, furnishings, and so on, must all be provided.A complicating factor is that there is an interdependence of activities. In other words, some parts of the project cannot be started until other parts are completed. For example, Global cannot construct the interior of an office before it has been designed. Neither can it hire new employees until it has determined its personnel requirements.The necessary activities and their necessary predecessors (due to interdependence) are listed below. Three estimates are made for the completion time of each activity—the minimum time, most likely time, and maximum time.Immediate Time Estimates (days)Minimum Most Likely Maximum Activity Description PredecessorA Select Office Site —21 21 21B Create Org. & Fin. Plan —20 25 30C Determine Personnel Req. B 15 20 30D Design Facility A, C 20 28 42E Construct Facility D 40 48 66F Select Personnel to Move C 12 12 12G Hire New Employees F 20 25 32H Move Key Employees F 28 28 28 I Train New PersonnelE, G, H1015 24ABCDFGHIEStartEndGlobal Oil Simulation with Crystal Ball®Step #1 (Setup Spreadsheet)1 2 3 4 5 6 7 8 9 10 11 12 13 14 15A B C D E F G H I J Global Oil Relocation ProjectActivity Tim e (Triangular)Im m edi ate M ost Start Activity Finish Activity D escri ption P redecessors M inim um Likely M axi mum Tim e Tim e Tim eA Sel ect Site-21212102121B C reate Org. & Fin. P lan-20253002525C D eterm ine P ersonnel Req.B152030252045D D esign Facil ity A, C202842452873E C onstruct Facility D4048667348121F Sel ect Personnel to M ove C121212451257G H ire New Em ployees F202532572582H M ove Key E mployees F282828572885I Train N ew P ersonnel E, G, H10152412115136P roject C om pleti on Tim e =136.003456789101112131415H I JStart Activity FinishTim e Tim e Tim e021=H5+I5025=H6+I6=J620=H7+I7=M A X(J5,J7)28=H8+I8=J848=H9+I9=J712=H10+I10=J1025=H11+I11=J1028=H12+I12=M A X(J9,J11,J12)15=H13+I13P roject C ompleti on Tim e ==J13Step #2 (Define Assumptions—i.e., random variables)Each of the random activity times (B, C, D, E, G, and I) is assumed to follow the triangular distribution.Global Oil Simulation with Crystal Ball®Step #3 (Define Forecast—i.e., output)Cell J15 is the forecast cell:15G H I J Project Completion Time =136.00Step #4 (Choose Number of Trials)500 trials were run. In addition, Sensitivity Analysis was enabled in the Options of the Run Preferences dialogue box. This allows for the generation of sensitivity analysis results later.Step #5 (Run Simulation)Step #6 (View Results)Additional Results Available with Crystal Ball®Slide the triangles below the histograms to determine the probability that the output (project duration) is less than a certain value (e.g., a deadline), greater than a certain value, or between any two values (by sliding both triangles).Alternatively, you can type in values for the lower bound or upper bound to determine the probability. You can also type in a probability (in “Certainty”), and it will determine the range that has that probability.There is a 79% chance the project will be completed within 150 days.There is a 2.4% chance that the project will take more than 160 days.Sensitivity ChartChoose “Open Sensitivity Chart” in the Run menu. Note that this chart is only availableif you selected the “Sensitivity Analysis” option under Run Preferences. This chartgives an indication as to which random variables (activity times) have the greatest impact on the output cell (project completion time).Variability in activity E has the greatest impact on overall project duration, followed by activity D, C, I, and B. Variability in activity G has almost no impact.Fitting a DistributionCrystal Ball can be used to “fit” a distribution to data.The following data has been collected for the previous 100 phone calls to a mail-order house:1 2 3 4 5 6 7 8 9 10 11 12 13 14 15 16 17 18 19 99 100 101 102 103 104A B C D E F G H I Phone DataArrival Interarrival Length of Call Interarrival Length of Call Cus tomer #(minutes)Time(minutes)Time(minutes)18.228.22 3.77Averages 2.004 4.51212.25 4.03 4.53312.270.02 4.04416.26 3.98 3.70Simulation24518.06 1.81 5.38618.870.81 4.36723.46 4.58 4.41823.530.08 5.14928.73 5.20 4.761030.56 1.83 4.681132.36 1.80 5.061236.90 4.54 5.751343.30 6.40 4.061443.880.57 3.251545.17 1.29 3.5795194.020.28 4.2696195.48 1.46 3.3797195.870.38 4.4598196.840.98 5.0699197.810.97 5.20100200.43 2.61 4.25345G H IInterarrival Length of CallTime(minutes)Averages=AVERAGE(D5:D104)=AVERAGE(E5:E104)(80 rows have been hidden)Fitting Data to a DistributionUsing Crystal Ball® to fit data to a distribution1. Select a spreadsheet cell.2. Choose Define Assumption.3. Click the Fit button, then select the source of the fitted data.4. Click the Next button, then select the distributions to try to fit.5. Click OK.Interarrival TimeService Time。
风险管理软件Crystal Ball使用指导
Monte-Carlo Simulation with Crystal Ball®To run a simulation using Crystal Ball®:1. Setup SpreadsheetBuild a spreadsheet that will calculate the performance measure (e.g., profit) in terms of the inputs (random or not). For random inputs, just enter any number.2. Define Assumptions—i.e., random variablesDefine which cells are random, and what distribution they should follow.3. Define Forecast—i.e., output or performance measureDefine which cell(s) you are interested in forecasting (typically the performance measure, e.g., profit).4. Choose Number of TrialsSelect the number of trials. If you would later like to generate the Sensitivity Analysis chart, choose “Sensitivity Analysis” under Options in Run Preferences.5. Run SimulationRun the simulation. If you would like to change parameters and re-run the simulation, you should “reset” the simulation (click on the “Reset Simulation” button on the toolbar or in the Run menu) first.6. View ResultsThe forecast window showing the results of the simulation appears automatically after (or during) the simulation. Many different results are available (frequency chart, cumulative chart, statistics, percentiles, sensitivity analysis, and trend chart). The results can be copied into the worksheet.Crystal Ball Toolbar:Define Define Run Start Reset Forecast Trend Assumptions Forecast Preferences Simulation Simulation Window ChartRecall the Walton Bookstore example: It is August, and they must decide how many of next year’s nature calendars to order. Each calendar costs the bookstore $7.50 and is sold for $10. After February, all unsold calendars are returned to the publisher for a refund of $2.50 per calendar. Suppose Walton predicts demand will be somewhere between 100 and 300 (discrete uniform).Demand = d ~ Uniform[100, 300]Order Quantity = Q (decision variable)Revenue = $10 * Min(Q, d)Cost = $7.50 * QRefund = $2.50 * Max(Q–d, 0)Profit = Revenue – Cost + RefundStep #1 (Setup Spreadsheet)Step #2 (Define Assumptions —i.e., random variables)— color code (blue):and click on the “Define Assumptions” button in toolbar (or in the Cell menu):Select type of distribution:Provide parameters of distributions:Walton Bookstore Simulation with Crystal Ball®Step #3 (Define Forecast—i.e., output)click on the “Define Forecast” button in toolbar (or in the Cell menu),and fill in the Define Forecast dialogue box.Step #4 (Choose Number of Trials)Click on the “Run Preferences” button in toolbar (or in the Run menu):and select the number of trials to run.Walton Bookstore Simulation with Crystal Ball®Step #5 (Run Simulation)Click on the “Start Simulation” button in toolbar (or Run in the Run menu):Step #6 (View Results)The results of the simulation can be viewed in a variety of different ways (frequency chart, cumulative chart, statistics, and percentiles). Choose different options under the View menu inthe forecast window.The results can be copied into a worksheet or Word document (choose Copy under the Edit menu in the simulation output window.Using Trend Charts to Find the Impact of Order Quantity onPotential ProfitDefine several forecast cells (G14:G18) for several possible order quantities (Q=100, 150, 200, 250, 300). Use the same random order quantity for each to compare them more equally (i.e., one assumption cell for demand—C14—with the rest set equal to C14).After running the simulation, choose “Open Trend Chart” in the Run menu. This chart gives “certainty bands” for the forecast cells. 10% of the time, the project duration will fall within the inner band (light blue), 25% of the time within the 2nd band (red), 50% of the time within the third band (green), and 90% of the time within the outside band (dark blue).Project Management—Global OilGlobal Oil is planning to move their credit card operation to Des Moines, Iowa from their home office in Dallas. The move involves many different divisions within the company. Real estate must select one of three available office sites. Personnel has to determine which employees from Dallas will move, how many new employees to hire, and who will train them. The systems group and treasurer’s office must organize the new operating procedure and make financial arrangements. The architects will have to design the interior space, and oversee needed structural improvements. Each site is an existing building with sufficient open space, but office partitions, computer facilities, furnishings, and so on, must all be provided.A complicating factor is that there is an interdependence of activities. In other words, some parts of the project cannot be started until other parts are completed. For example, Global cannot construct the interior of an office before it has been designed. Neither can it hire new employees until it has determined its personnel requirements.The necessary activities and their necessary predecessors (due to interdependence) are listed below. Three estimates are made for the completion time of each activity—the minimum time, most likely time, and maximum time.Start EndGlobal Oil Simulation with Crystal Ball®Step #1 (Setup Spreadsheet)Step #2 (Define Assumptions—i.e., random variables)Each of the random activity times (B, C, D, E, G, and I) is assumed to follow the triangular distribution.Global Oil Simulation with Crystal Ball®Step #3 (Define Forecast—i.e., output)Cell J15 is the forecast cell:Step #4 (Choose Number of Trials)500 trials were run. In addition, Sensitivity Analysis was enabled in the Options of the Run Preferences dialogue box. This allows for the generation of sensitivity analysis results later. Step #5 (Run Simulation)Step #6 (View Results)Additional Results Available with Crystal Ball®Slide the triangles below the histograms to determine the probability that the output (project duration) is less than a certain value (e.g., a deadline), greater than a certain value, or between any two values (by sliding both triangles).Alternatively, you can type in values for the lower bound or upper bound to determine the probability. You can also type in a probability (in “Certainty”), and it will determine the range that has that probability.There is a 79% chance the project will be completed within 150 days.There is a 2.4% chance that the project will take more than 160 days.Sensitivity ChartChoose “Open Sensitivity Chart” in the R un menu. Note that this chart is only available if you selected the “Sensitivity Analysis” option under Run Preferences. This chart gives an indicationas to which random variables (activity times) have the greatest impact on the output cell (project completion time).Variability in activity E has the greatest impact on overall project duration, followed by activity D, C, I, and B. Variability in activity G has almost no impact.Fitting a DistributionCrystal Ball can be used to “fit” a distribution t o data.The following data has been collected for the previous 100 phone calls to a mail-order house:(80 rows have been hidden)Fitting Data to a DistributionUsing Crystal Ball® to fit data to a distribution1. Select a spreadsheet cell.2. Choose Define Assumption.3. Click the Fit button, then select the source of the fitted data.4. Click the Next button, then select the distributions to try to fit.5. Click OK.Interarrival TimeService Time。
魔术师玩水晶球作文
魔术师玩水晶球作文英文回答:Once upon a time, there was a magician named David who was famous for his incredible magic tricks. One day, he decided to perform a special trick using a crystal ball. The crystal ball was said to have magical powers and could reveal secrets about the future.David gathered a group of eager spectators and began his performance. He held the crystal ball in his hands and stared into it with a mysterious expression. As he gazed into the ball, he started speaking in a low, mesmerizing voice."Behold, ladies and gentlemen, the power of the crystal ball!" David exclaimed. "It can show us glimpses of what is yet to come."As David continued to speak, the crystal ball startedto glow and swirl with vibrant colors. The audience watched in awe as images and symbols appeared within the ball. David interpreted each vision with flair and drama, leaving the spectators on the edge of their seats.The first vision in the crystal ball showed a couple getting married on a beautiful beach. David explained that it represented love and happiness in the future. The audience gasped and whispered excitedly among themselves.Next, the crystal ball revealed an image of a businessman holding a briefcase and standing in front of a skyscraper. David explained that it symbolized success and wealth. The spectators clapped and cheered, imagining their own prosperous futures.As the performance went on, the crystal ball showed various other visions, including a family gathering, a tropical vacation, and even a surprise lottery win. Each vision brought a mix of emotions from the audience, ranging from excitement to envy.Finally, after what seemed like an eternity, David concluded his performance. He thanked the audience for their participation and applause. The spectators left the show feeling inspired and hopeful about their own futures.中文回答:从前有一个名叫大卫的魔术师,以他令人难以置信的魔术技巧而闻名。
魔术师玩水晶球作文
魔术师玩水晶球作文英文回答:As a magician, I have always been fascinated by the power of the crystal ball. This mystical object has the ability to reveal secrets, predict the future, and captivate audiences with its enchanting beauty. When I hold the crystal ball in my hands, I feel a surge of energy and a connection to the supernatural world.When I gaze into the crystal ball, I see a world filled with endless possibilities. It's like peering into a window to another dimension, where time and space are fluid and anything is possible. The crystal ball has the power to transport me to different places and times, allowing me to witness events that have yet to occur.One of the most amazing things about the crystal ball is its ability to provide insight and guidance. It acts as a conduit between the physical and spiritual realms,allowing me to tap into the collective wisdom of the universe. Through the crystal ball, I can receive messages and symbols that hold deep meaning and significance.For example, during one of my performances, I asked a volunteer from the audience to think of a question they wanted answered. As I held the crystal ball and closed my eyes, I could feel a strong energy emanating from it. When I opened my eyes, I saw a vivid image of a beach with crashing waves. I told the volunteer that the answer to their question could be found near the ocean. After the show, the volunteer approached me and shared that they had been contemplating a career change and had been considering moving to a coastal town. The image of the beach confirmed their intuition and gave them the courage to pursue their dreams.中文回答:作为一名魔术师,我对水晶球的力量一直充满了兴趣。
crystalball模拟基础教程
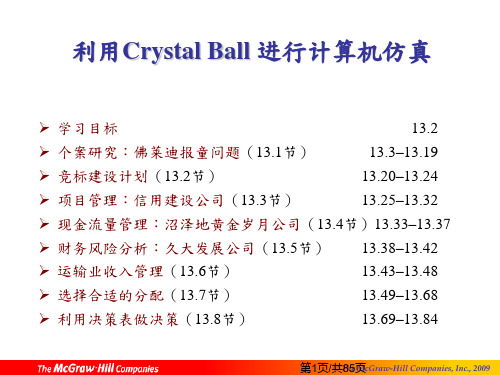
➢ 运输业收入管理(13.6节)
13.43–13.48
➢ 选择合适的分配(13.7节)
13.49–13.68
➢ 利用决策表做决策(13.8节)
13.69–13.84
第1页/共© T8h5e页McGraw-Hill Companies, Inc., 2009
13-2
学习目标
➢ 在读完本章后,你应该能够:
13-33
现金流量管理:沼泽地黄金岁月公司
➢ 面对了暂时性的业绩下滑以及一些现在和未来的建造 成本,所以公司在未来几年内将面临负现金流量。
➢ 财经日报的销售资料:
– 佛莱迪每天的销售量介于40到70份之间。 – 销售数量介于40到70份之间任何数值的频率相同。
第3页/共© T8h5e页McGraw-Hill Companies, Inc., 2009
13-4
运用仿真之电子表格模式
第4页/共© T8h5e页McGraw-Hill Companies, Inc., 2009
13-22
竞争者 2 之三角分配
第22页/©共T8he5M页cGraw-Hill Companies, Inc., 2009
13-23
信用公司竞标问题的结果
第23页/©共T8he5M页cGraw-Hill Companies, Inc., 2009
13-24
信用公司竞标问题的结果(续)
第24页/©共T8he5M页cGraw-Hill Companies, Inc., 2009
第6页/共© T8h5e页McGraw-Hill Companies, Inc., 2009
13-7
Crystal Ball 分配图库
第7页/共© T8h5e页McGraw-Hill Companies, Inc., 2009
经典睡前英语故事:水晶球的故事

经典睡前英语故事:水晶球的故事Once upon a time there was a witch, she had three sons, and the three brothers is by the strong sisterly partiality, but the witch did not trust them, always thought they would take her rights. Then she put her eldest brother becomes a goshawk, can only live in the cliff, people often see it soar constantly hovering in the air. Again she second into a whale, every day to live in the depths of the sea, people always see him from time to time out of the water spewed huge water column. The brothers can restore human one day only two hours. The younger son is he afraid of the witch into a beast, a bear, or a Wolf fled secretly. He had heard that the king's daughter in the magic, locked up in the gold sun palace, waiting for someone to save. Already 23 young adventure to save her, but were killed there. Now only one person can goto save her, who also can't go to the later. The young man by nature bold, he decided to go in search of the golden sun palace. He travel day and night without stopping, but didn't find it, even the shadow of the palace at last he into the a large forest. Suddenly he saw the two giants in the waved to him, and cast in the past. Giant said: "we are argued for a hat, because we both like strong, nobody who fights only, do not know who the hat the return. Small people always pretty smart, we let you say this hat the return to who?" "Youshould be at odds for a hat!" The young man said. "You don't know how good it is a baby, this is the best hat, who wear it ah, think of where can immediately to where." "Come on, give me a hat," the young man said, "I go for a while, and thencall you, you to race, who first to me, the hat will be who."Said he was wearing a hat to run, but his heart is always thinking of the princess, but forgot the two giants, hewalked straight on, and finally, from the bottom of my heart said with a sigh: "oh, I have much good if the golden sun palace!" But it just export, he stood in front of the door of the mountain.Young man walked into the door of each room, each one in the last one to find the princess. But when he looked at the princess, he was surprised how ah, see her dead grey face was covered with wrinkles, dim eyes, hair became red. "You arethe one that everyone praises her most beautiful princess in the world?" The young man cried out. "This is not my true nature, the human eye can only see my ugly appearance, you want to see my true appearance, can take a look at the mirror, it will show my true face to show you." She put the mirror to the young man's hands, he saw in the mirror image of the most beautiful girl in the world, also see how she sadly, tears streaming down her face. Then he said to the princess: "how can I save you, I what all not afraid." The princess said:"who can get the crystal ball, take it to a wizard in front, can break his magic, I also can restore original self." The princess and added, "is there are so many people died for it, you are very young, if there are if anything happens, call me. Where's your conscience?" "Who also stop me," he said, "tell me how to do it." The princess said: "you have to know that the palace is located in the mountains, go on from here witha spring, there will be a bull by waiting for you, you haveto fight it, if you're lucky to kill it, a Turkey will flyout from its body, its belly inside an egg, to red, egg yolkis hidden in the crystal ball. But the birds will not come tolay down their eggs, unless absolutely, if the egg fall to the ground, instantly lit fires burning, burning everything around, eggs will be melted, the inside of the crystal ballis not exceptional also, so that everything is in vain."Young people came to the spring after down the mountain, there are gasped in buffalo he roars. After a long struggle, the young man sword stab into the tripe, bison fell, in a twinkling flew out a fire in the body of the bird, the bird just want to fly away, the young man's eldest brother jump down from the clouds, it arrived at the sea side, beak it again, the bird had to reluctantly dropped the egg. But it did not fall in the sea, but fell on the roof of the fisherman on the beach on the roof. That house was on fire at once, on the verge of collapse, and then set off a wave, over the roof, got the fire under pressure. It was the second brother of the young, the a whale swam to set off a wave. Put out the fire, the young man lucky enough to find the haven't melted eggs, egg shell so a leaching has been cracked by cold water. He took out a crystal ball, he found it on condition.Young people holding a crystal ball, take it to the front of the wizard, the wizard said: "my magic has been broken, from now on you are the king of the golden sun palace; with this crystal ball, prototype or your brothers can be restored." Young people go to find the princess, he stepped into the door, found that she was standing there, radiant, beauty, the two exchanged rings cheerfully.从前有个女巫,她有三个儿子,这兄弟三人真是手足情深,可女巫却不信任他们,总以为他们会夺走她的权。
风险管理软件Crystal Ball使用指导

Monte-Carlo Simulation with Crystal Ball®To run a simulation using Crystal Ball®:1. Setup SpreadsheetBuild a spreadsheet that will calculate the performance measure (e.g., profit) in terms of the inputs (random or not). For random inputs, just enter any number.2. Define Assumptions—i.e., random variablesDefine which cells are random, and what distribution they should follow.3. Define Forecast—i.e., output or performance measureDefine which cell(s) you are interested in forecasting (typically the performance measure, e.g., profit).4. Choose Number of TrialsSelect the number of trials. If you would later like to generate the Sensitivity Analysis chart, choose “Sensitivity Analysis” under Options in Run Preferences.5. Run SimulationRun the simulation. If you would like to change parameters and re-run the simulation, you should “reset” the simulation (click on the “Reset Simulation” button onthe toolbar or in the Run menu) first.6. View ResultsThe forecast window showing the results of the simulation appears automatically after (or during) the simulation. Many different results are available (frequency chart, cumulative chart, statistics, percentiles, sensitivity analysis, and trend chart). The results can be copied into the worksheet.Crystal Ball Toolbar:Define Define Run Start Reset Forecast TrendAssumptions Forecast Preferences Simulation Simulation Window ChartWalton Bookstore Simulation with Crystal Ball®Recall the Walton Bookstore example: It is August, and they mu st decide how many of next year’s nature calendars to order. Each calendar costs the bookstore $7.50 and is sold for $10. After February, all unsold calendars are returned to the publisher for a refund of $2.50 per calendar. Suppose Walton predicts demand will be somewhere between 100 and 300 (discrete uniform).Demand = d ~ Uniform[100, 300]Order Quantity = Q (decision variable)Revenue = $10 * Min(Q, d)Cost = $7.50 * QRefund = $2.50 * Max(Q–d, 0)Profit = Revenue – Cost + Refund Step #1 (Setup Spreadsheet)Walton Bookstore Simulation with Crystal Ball®Step #2 (Define Assumptions—i.e., random variables)Select the cell that contains the random variable (B17) — color code (blue):and click on the “Define Assumptions” button in toolbar (or in the Cell menu):Select type of distribution:Provide parameters of distributions:Walton Bookstore Simulation with Crystal Ball®Step #3 (Define Forecast—i.e., output)Select the cell that contains the output variable to forecast (F17):click on the “Define Forecast” button in toolbar (or in the Cell menu),and fill in the Define Forecast dialogue box.Step #4 (Choose Number of Trials)Click on the “Run Preferences” button in toolbar (or in the Run menu):and select the number of trials to run.Walton Bookstore Simulation with Crystal Ball®Step #5 (Run Simulation)Click on the “Start Simulation” button in toolbar (or Run in the Run menu):Step #6 (View Results)The results of the simulation can be viewed in a variety of different ways (frequency chart, cumulative chart, statistics, and percentiles). Choose different options under the View menu in the forecast window.The results can be copied into a worksheet or Word document (choose Copy under the Edit menu in the simulation output window.Using Trend Charts to Find the Impact of Order Quantityon Potential ProfitDefine several forecast cells (G14:G18) for several possible order quantities (Q=100, 150, 200, 250, 300). Use the same random order quantity for each to compare them more equally (i.e., one assumption cell for demand—C14—with the rest set equal to C14).After running the simulation, choose “Open Trend Chart” in the Run menu. This chart gives “certainty bands” for the forecast cells. 10% of the time, the project duration will fall within the inner band (light blue), 25% of the time within the 2nd band (red), 50% of the time within the third band (green), and 90% of the time within the outside band (dark blue).Project Management—Global OilGlobal Oil is planning to move their credit card operation to Des Moines, Iowa from their home office in Dallas. The move involves many different divisions within the company. Real estate must select one of three available office sites. Personnel has to determine which employees from Dallas will move, how many new employees to hire, and who will train them. The systems group and treasurer’s office must organize the new operating procedure and make financial arrangements. The architects will have to design the interior space, and oversee needed structural improvements. Each site is an existing building with sufficient open space, but office partitions, computer facilities, furnishings, and so on, must all be provided.A complicating factor is that there is an interdependence of activities. In other words, some parts of the project cannot be started until other parts are completed. For example, Global cannot construct the interior of an office before it has been designed. Neither can it hire new employees until it has determined its personnel requirements.The necessary activities and their necessary predecessors (due to interdependence) are listed below. Three estimates are made for the completion time of each activity—the minimum time, most likely time, and maximum time.Start EndGlobal Oil Simulation with Crystal Ball®Step #1 (Setup Spreadsheet)Step #2 (Define Assumptions—i.e., random variables)Each of the random activity times (B, C, D, E, G, and I) is assumed to follow the triangular distribution.Global Oil Simulation with Crystal Ball®Step #3 (Define Forecast—i.e., output)Cell J15 is the forecast cell:Step #4 (Choose Number of Trials)500 trials were run. In addition, Sensitivity Analysis was enabled in the Options of the Run Preferences dialogue box. This allows for the generation of sensitivity analysis results later.Step #5 (Run Simulation)Step #6 (View Results)Additional Results Available with Crystal Ball®Slide the triangles below the histograms to determine the probability that the output (project duration) is less than a certain value (e.g., a deadline), greater than a certain value, or between any two values (by sliding both triangles).Alternatively, you can type in values for the lower bound or upper bound to determine the probability. You can also type in a probability (in “Certainty”), and it will determine the range that has that probability.There is a 79% chance the project will be completed within 150 days. There is a 2.4% chance that the project will take more than 160 days.Sensitivity ChartChoose “Open Sensitivity Chart” in the R un menu. Notethat this chart is only available if you selected the “Sensitivity Analysis” option under Run Preferences. This chart gives an indication as to which random variables (activity times) have the greatest impact on the output cell (project completion time).Variability in activity E has the greatest impact on overall project duration, followed by activity D, C, I, and B. Variability in activity G has almost no impact.Fitting a DistributionCrystal Ball can be used to “fit” a distribution t o data.The following data has been collected for the previous 100 phone calls to a mail-order house:(80 rows have been hidden)Fitting Data to a DistributionUsing Crystal Ball® to fit data to a distribution1. Select a spreadsheet cell.2. Choose Define Assumption.3. Click the Fit button, then select the source of the fitted data.4. Click the Next button, then select the distributions to try to fit.5. Click OK.Interarrival TimeService Time。
风险管理软件CrystalBall使用指导

Monte-Carlo Simulation with Crystal Ball®To run a simulation using Crystal Ball®:1. Setup SpreadsheetBuild a spreadsheet that will calculate the performance measure (e.g., profit) in terms of the inputs (random or not). For random inputs, just enter any number.2. Define Assumptions—i.e., random variablesDefine which cells are random, and what distribution they should follow.3. Define Forecast—i.e., output or performance measureDefine which cell(s) you are interested in forecasting (typically the performance measure, e.g., profit).4. Choose Number of TrialsSelect the number of trials. If you would later like to generate the Sensitivity Analysis chart, choose “Sensitivity Analysis” under Options in Run Preferences.5. Run SimulationRun the simulation. If you would like to change parameters and re-run the simulation, you should “reset” the simulation (click on the “Reset Simulation” button on the toolbar or in the Run menu) first.6. View ResultsThe forecast window showing the results of the simulation appears automatically after (or during) the simulation. Many different results are available (frequency chart, cumulative chart, statistics, percentiles, sensitivity analysis, and trend chart). The results can be copied into the worksheet.Crystal Ball Toolbar:Define Define Run Start Reset Forecast Trend Assumptions Forecast Preferences Simulation Simulation Window ChartWalton Bookstore Simulation with Crystal Ball®Recall the Walton Bookstore example: It is August, and they must decide how many of next year’s nature calendars to order. Each calendar costs the bookstore $7.50 and is sold for $10. After February, all unsold calendars are returned to the publisher for a refund of $2.50 per calendar. Suppose Walton predicts demand will be somewhere between 100 and 300 (discrete uniform).Demand = d ~ Uniform[100, 300]Order Quantity = Q (decision variable)Revenue = $10 * Min(Q, d)Cost = $7.50 * QRefund = $2.50 * Max(Q–d, 0)Profit = Revenue – Cost + RefundStep #1 (Setup Spreadsheet)Walton Bookstore Simulation with Crystal Ball ®Step #2 (Define Assumptions —i.e., random variables)—color code (blue):and click on the “Define Assumptions” button in toolbar (or in the Cell menu):Select type of distribution:Provide parameters of distributions:Walton Bookstore Simulation with Crystal Ball®Step #3 (Define Forecast—i.e., output)click on the “Define Forecast” button in toolbar (or in the Cell menu),and fill in the Define Forecast dialogue box.Step #4 (Choose Number of Trials)Click on the “Run Preferences” button in toolbar (or in the Run menu):and select the number of trials to run.Walton Bookstore Simulation with Crystal Ball®Step #5 (Run Simulation)Click on the “Start Simulation” button in toolbar (or Run in the Run menu):Step #6 (View Results)The results of the simulation can be viewed in a variety of different ways (frequency chart, cumulative chart, statistics, and percentiles). Choose different options under the View menuin the forecast window.The results can be copied into a worksheet or Word document (choose Copy under the Edit menu in the simulation output window.Using Trend Charts to Find the Impact of Order Quantityon Potential ProfitDefine several forecast cells (G14:G18) for several possible order quantities (Q=100, 150, 200, 250, 300). Use the same random order quantity for each to compare them more equally (i.e., one assumption cell for demand—C14—with the rest set equal to C14).After running the simulation, choose “Open Trend Chart” in the Run menu. This chart gives “certainty bands” for the forecast cells. 10% of the time, the project duration will fall within the inner band (light blue), 25% of the time within the 2nd band (red), 50% of the time within the third band (green), and 90% of the time within the outside band (dark blue).Project Management—Global OilGlobal Oil is planning to move their credit card operation to Des Moines, Iowa from their home office in Dallas. The move involves many different divisions within the company. Real estate must select one of three available office sites. Personnel has to determine which employees from Dallas will move, how many new employees to hire, and who will train them. The systems group and treasurer’s office must organize the new operating procedure and make financial arrangements. The architects will have to design the interior space, and oversee needed structural improvements. Each site is an existing building with sufficient open space, but office partitions, computer facilities, furnishings, and so on, must all be provided.A complicating factor is that there is an interdependence of activities. In other words, some parts of the project cannot be started until other parts are completed. For example, Global cannot construct the interior of an office before it has been designed. Neither can it hire new employees until it has determined its personnel requirements.The necessary activities and their necessary predecessors (due to interdependence) are listed below. Three estimates are made for the completion time of each activity—the minimum time, most likely time, and maximum time.Start EndGlobal Oil Simulation with Crystal Ball®Step #1 (Setup Spreadsheet)Step #2 (Define Assumptions—i.e., random variables)Each of the random activity times (B, C, D, E, G, and I) is assumed to follow the triangular distribution.Global Oil Simulation with Crystal Ball®Step #3 (Define Forecast—i.e., output)Cell J15 is the forecast cell:Step #4 (Choose Number of Trials)500 trials were run. In addition, Sensitivity Analysis was enabled in the Options of the Run Preferences dialogue box. This allows for the generation of sensitivity analysis results later.Step #5 (Run Simulation)Step #6 (View Results)Additional Results Available with Crystal Ball®Slide the triangles below the histograms to determine the probability that the output (project duration) is less than a certain value (e.g., a deadline), greater than a certain value, or between any two values (by sliding both triangles).Alternatively, you can type in values for the lower bound or upper bound to determine the probability. You can also type in a probability (in “Certainty”), and it will determine the range that has that probability.There is a 79% chance the project will be completed within 150 days.There is a 2.4% chance that the project will take more than 160 days.Sensitivity ChartChoose “Open Sensitivity Chart” in the R un menu. Note that this chart is only available ifyou selected the “Sensitivity Analysis” option under Run Preferences. This chart gives an indication as to which random variables (activity times) have the greatest impact on the output cell (project completion time).Variability in activity E has the greatest impact on overall project duration, followed by activity D, C, I, and B. Variability in activity G has almost no impact.Fitting a DistributionCrystal Ball can be used to “fit” a distribution t o data.The following data has been collected for the previous 100 phone calls to a mail-order house:(80 rows have been hidden)Fitting Data to a DistributionUsing Crystal Ball® to fit data to a distribution1. Select a spreadsheet cell.2. Choose Define Assumption.3. Click the Fit button, then select the source of the fitted data.4. Click the Next button, then select the distributions to try to fit.5. Click OK.Interarrival TimeService Time。
- 1、下载文档前请自行甄别文档内容的完整性,平台不提供额外的编辑、内容补充、找答案等附加服务。
- 2、"仅部分预览"的文档,不可在线预览部分如存在完整性等问题,可反馈申请退款(可完整预览的文档不适用该条件!)。
- 3、如文档侵犯您的权益,请联系客服反馈,我们会尽快为您处理(人工客服工作时间:9:00-18:30)。
Monte-Carlo Simulation with Crystal Ball®用水晶球软件进行蒙特卡洛模拟To run a simulation using Crystal Ball®:1.Setup Spreadsheet1.设定数据表Build a spreadsheet that will calculate the performance measure (e.g., profit) in terms of the inputs (random or not). For random inputs, just enter any number.通过建立数据表可以对输入数据(随机的,非随机)进行评估。
随机数据的输入,输入任意数即可。
2. Define Assumptions—i.e., random variablesDefine which cells are random, and what distribution they should follow.2.定义假设的前提—例如,随机变量确定那些单元格的数据时随机的,这些数据应该服从什么样的分布3. Define Forecast—i.e., output or performance measureDefine which cell(s) you are interested in forecasting (typically the performance measure, e.g., profit).3.预测结果的确定—例如,数据输出或者性能的测定确定哪些单元格的数据是你想预测的(典型的性能指标,例如,利润)4. Choose Number of TrialsSelect the number of trials. If you would later like to generate the Sensitivity Analysis chart, choose “Sensitivity Analysis” under Options in Run Preferences.4. 选择试验的次数选择试验的次数。
如果要生成敏感度分析图表,选择优先运行下的“敏感度分析”5. Run SimulationRun the simulation. If you would like to change parameters and re-run the simulation, you should “reset” the simulation (click on the “Reset Simulation” button on the toolbar or in the Run menu) first.运行模拟运行模拟。
如果要改变参数重新进行模拟,需要首先重置模拟(点击运行菜单工具栏或者运行菜单下的“重置模拟”按钮)。
6. View ResultsThe forecast window showing the results of the simulation appears automatically after (or during) the simulation. Many different results are available (frequency chart,cumulative chart, statistics, percentiles, sensitivity analysis, and trend chart). The results can be copied into the worksheet.查看结果在模拟最后或者运行的过程中,预测窗口会自动显示模拟的结果。
可以获得不同的结果(频率图,累计图,统计图,百分比图,模拟分析图和趋势图),结果可以复制到工作表中。
Crystal Ball Toolbar:(水晶球的工具栏)TrendRun Start Reset Forecast Define DefineAssumptions Forecast Preferences Simulation Simulation Window Chart(确定假设)确定预测结果优先运行开始模拟模拟重置预测窗口趋势图Walton Bookstore Simulation with Crystal Ball®水晶球在Walton书店模拟中的应用Recall the Walton Bookstore example: It is August, and they must decide how many of next year’s nature calendars to order. Each calendar costs the bookstore $7.50 and is sold for $10. After February, all unsold calendars are returned to the publisher for a refund of $2.50 per calendar. Suppose Walton predicts demand will be somewhere between 100 and 300 (discrete uniform).回想Walton书店的例子。
在八月份,书店需要确定订购的明年的日历的数量。
单个日历的进价是7.5美元,售价是10美元。
二月份之后,所有未售的日历将会以2.5美元的价格退还给出版商。
假设Walton 日历的销售量在100~300之间(离散型均匀分布)Demand = d ~ Uniform[100, 300]Order Quantity = Q (decision variable)Revenue = $10 * Min(Q, d)Cost = $7.50 * QRefund = $2.50 * Max(Q–d, 0)Profit = Revenue – Cost + Refund需求量= d ~ Uniform[100, 300]订购量= Q (随决定变化)收入 = $10 * Min(Q, d)成本 =$7.50 * Q退款 = $2.50 * Max(Q–d, 0)利润 =收入-成本+退款Step #1 (Setup Spreadsheet)第一步(制作电子表格)Walton Bookstore Simulation with Crystal Ball®用水晶球对Walton 书店进行模拟Step #2 (Define Assumptions—i.e., random variables) 第二步(定义假设-例如,随机变量)Select the cell that contains the random variable (B17) — color code (blue): 选择包含随机变量的单元(B17)—色标(蓝色)and click on the “Define Assumptions” button in toolbar (or in the Cell menu):、 点击在工具栏中(单元格菜单)的“定义假设”按钮选择分布类型Select type of distribution:提供分布的参数Provide parameters of distributions:Walton Bookstore Simulation with Crystal Ball®Step #3 (Define Forecast—i.e., output)第三步(确定预测—例如,输出量)Select the cell that contains the output variable to forecast (F17):F17)click on the “Define Forecast” button in toolbar (or in the Cell menu),在确定预测对话框中输入and fill in the Define Forecast dialogue box.Step #4 (Choose Number of Trials)第四步(选择试验的次数)Click on the “Run Preferences” button in toolbar (or in the Run menu):点击工具栏(或者运行菜单)中的“优先运行”按钮然后选择运行的次数并运行and select the number of trials to run.Walton Bookstore Simulation with Crystal Ball®Step #5 (Run Simulation)第五步(进行模拟)Click on the “Start Simulation” button in toolbar (or Run in the Run menu):点击工具栏(或者运行菜单栏)中的“开始模拟”按钮Step #6 (View Results)第六步(查看结果)可以通过不同的方法观察模拟结果(频率图,累计图,统计图及百分比图)。
在预测窗口中的查看菜单中进行不同的选择。
The results of the simulation can be viewed in a variety of different ways (frequency chart, cumulative chart, statistics, and percentiles). Choose different options under the View menu in the forecast window.The results can be copied into a worksheet or Word document (choose Copy under the Edit menu in the simulation output window.结果可以复制到工作表或者Word文档中(选择模拟输出窗口中编辑菜单下的复制)Using Trend Charts to Find the Impact of OrderQuantity on Potential Profit用趋势图找到订货量对利润的影响Define several forecast cells (G14:G18) for several possible order quantities (Q=100, 150, 200, 250, 300). Use the same random order quantity for each to compare them more equally (i.e., one assumption cell for demand—C14—with the rest set equal to C14).针对不同可能的订货量(Q=100, 150, 200, 250, 300),定义一些预测单元格(G14:G18),为了更为公平的对比,每次都使用相同的随机订货量After running the simulation, choose “Open Trend Chart” in the Run menu. This chart gives “certainty bands” for the forecast cells. 10% of the time, the project duration will fall within the inner band (light blue), 25% of the time within the 2nd band (red), 50% of the time within the third band (green), and 90% of the time within the outside band (dark blue).运行模拟之后,选择运行菜单下的“打开趋势图”。