雅思小作文piechart
雅思小作文饼图范文

雅思小作文饼图范文在雅思小作文中,饼图是一种常见的数据呈现方式。
接下来我们将会给大家提供一篇关于饼图范文的示例,希望能够帮助大家更好地理解和掌握这种写作方式。
饼图范文示例:The pie chart illustrates the proportion of different types of energy production in a certain country in 2018. Overall, it can be seen that the majority of energy production comes from fossil fuels, while renewable energy sources contribute a relatively small portion.Fossil fuels, including coal, natural gas, and oil, accounted for the largest share of energy production at 65%. Among them, oil was the most dominant, making up 35% of the total energy production. Natural gas and coal followed, with 20% and 10% respectively. This indicates that traditional energy sources still play a crucial role in meeting the country's energy demands.In contrast, renewable energy sources only contributed to 20% of the total energy production. Among them, hydroelectric power was the primary source, accounting for 15%. Meanwhile, wind and solar energy made up 3% and 2% respectively. Despite the growing global emphasis on renewable energy, it is clear that in this particular country, the reliance on fossil fuels remains significantly higher.Nuclear energy, on the other hand, made up the remaining 15% of the energy production. This suggests that while it is not as dominant as fossil fuels, nuclear energy still plays a substantial role in the country's energy mix.In conclusion, the pie chart provides a clear overview of the energy production composition in the given country. It highlights the dominance of fossil fuels, the relatively small contribution of renewable energy sources, and the significant role of nuclear energy. This information is crucial for policymakers and stakeholders in making informed decisions about the country's energy future.。
雅思小作文 饼状图

雅思小作文饼状图英文回答:The pie chart illustrates the percentage of various sources of energy consumed in a particular region during a specific year. The data is presented in a clear and concise manner, with each slice of the pie representing a different energy source.Upon examining the pie chart, it becomes evident that non-renewable energy sources dominate the region's energy consumption. Fossil fuels, including coal, natural gas, and oil, account for a substantial 80% of the total energy usage. This heavy reliance on non-renewable resources highlights the region's dependence on finite energy sources, which raises concerns about future energy security and environmental sustainability.In contrast, renewable energy sources play a relatively minor role in the region's energy mix. Solar and wind powercombined contribute a mere 10% to the total energy consumption. This low percentage suggests a lack of investment in renewable energy infrastructure and a reluctance to transition towards cleaner and more sustainable energy sources.Hydroelectricity stands out as the most significant renewable energy source, accounting for 5% of the region's energy consumption. However, this figure is stillrelatively low compared to the potential hydroelectric resources that the region may possess. The untapped potential of hydroelectricity presents an opportunity for the region to increase its reliance on renewable energy and reduce its dependence on fossil fuels.Overall, the pie chart provides valuable insights into the region's energy consumption patterns. The dominance of non-renewable energy sources raises concerns about the region's long-term energy security and environmental sustainability. The underutilization of renewable energy sources, particularly hydroelectricity, suggests a need for increased investment and a shift towards a more sustainableenergy future.中文回答:此饼状图展示了某个地区在某一年中各种能源消耗所占的百分比。
雅思写作小作文范文 雅思写作饼状图pie chart 宾馆服务满意度.doc

雅思写作小作文范文雅思写作饼状图pie chart 宾馆服务满意度今天我们雅思写作小作文范文的文章来研究下饼状图pie chart。
该题目包含两个图形,显示了某项调查问卷在2005年和2010年的结果。
该调查要求顾客对Parkway宾馆的客户服务给出评价,并将评价结果分为很差,差,满意,良好,优秀五个等级。
小编搜集了一篇相关的考官范文,以供大家参考。
雅思写作小作文题目The charts below show the results of a questionnaire that asked visitors to the Parkway Hotel how they rated the hotel’s customer service. The same questionnaire was given to 100 guests in the years 2005 and 2010.Summarise the information by selecting and reporting the main features, and make comparisons where relevant.雅思写作小作文范文The pie charts compare visitors’ responses to a survey about customer service at the Parkway Hotel in 2005 and in 2010.饼状图比较了2005年和2010年游客对Parkway宾馆客户服务满意度的调查结果。
It is clear that overall customer satisfaction increased considerably from 2005 to 2010. While most hotel guests rated customer service as satisfactory or poor in 2005, a clear majority described the hotel’s service as good or excellent in 2010.很明显,从2005年到2010年,整体的客户满意度有了很大的提升。
雅思写作Task1饼状图考官范文(4)

雅思写作Task1饼状图考官范文(4)The table below shows CO2 emissions for different forms of transport in the European Union. The Pie Chart shows the percentage of European Union funds being spent on different forms of transport.Write a report for a university lecturer describing the information in the graph below.Sample Answer:The given graphs provide information on the amount of Carbon dioxide emission per person from different vehicles in the European Union and also show the expenditures on different modes of transportations. As is observed from the given illustration, the highest amount of CO2 per person is emitted by the Air transports and European Union spends highest percentage of funds for the road transportation system.According to the bar graph, a single passenger of a personal cars emit around 130 gm of CO2 per kilometer while a passenger in a bus contribute to 65 gm of emission per kilometer. Coaches, maritime and rail passengers emit the lowest amount of CO2which is about 50 grams per passenger in a kilometer. Finally a single passenger of airplane contributes to 370 km of CO2 per kilo which is the highest amount of CO2 emission among the given transportations.Based on the pie chart, the European Union spent the highest amount (52%) on the road transportation system while spent only 1% or 2% on ports, waterway airport intermodal and other transport systems. They spent 31% on rail system and 10% on public transportation system. This indicates the European Union spent the majority of the budget on public transportations.In summary, Airplanes and personal car using passengers per person cause more CO2 emission than other mode of public transportation and European Union spend more on road and railways than other mode of transports.(Approximately 238 words)( This model answer can be followed as an example of a very good answer. However, please note that this is just one example out of many possible approaches.)。
饼图雅思英语作文
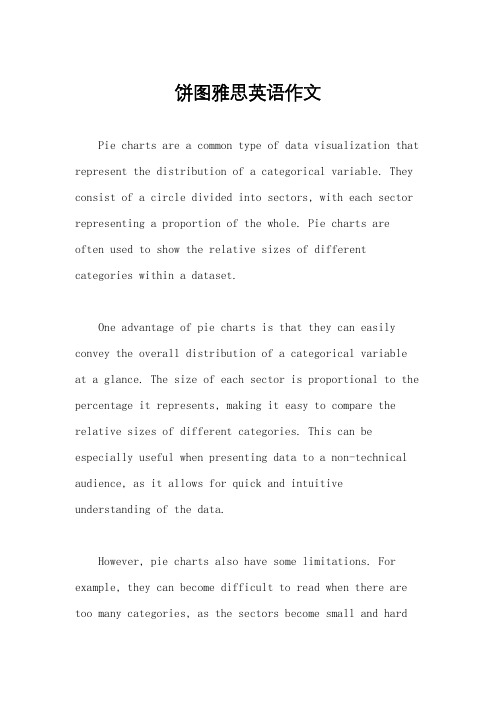
饼图雅思英语作文Pie charts are a common type of data visualization that represent the distribution of a categorical variable. They consist of a circle divided into sectors, with each sector representing a proportion of the whole. Pie charts are often used to show the relative sizes of different categories within a dataset.One advantage of pie charts is that they can easily convey the overall distribution of a categorical variable at a glance. The size of each sector is proportional to the percentage it represents, making it easy to compare the relative sizes of different categories. This can be especially useful when presenting data to a non-technical audience, as it allows for quick and intuitive understanding of the data.However, pie charts also have some limitations. For example, they can become difficult to read when there are too many categories, as the sectors become small and hardto distinguish. In addition, it can be challenging to accurately compare the sizes of different sectors, especially when they are similar in size. This can make it difficult to accurately interpret the data, especially when the differences between categories are small.In conclusion, pie charts are a useful tool forvisually representing the distribution of categorical data. They provide a quick and intuitive way to understand the relative sizes of different categories within a dataset. However, they also have limitations, such as difficulty in comparing small differences and becoming cluttered with too many categories. As with any data visualization, it's important to consider the specific characteristics of the data and the audience when deciding whether to use a pie chart.。
两个时间的饼图雅思小作文
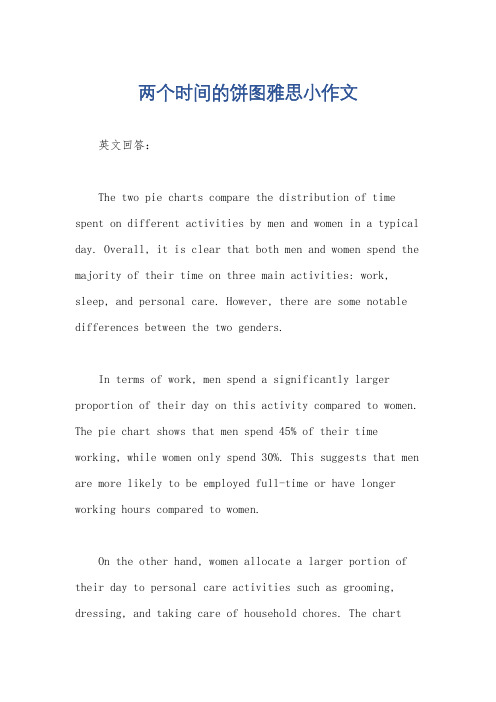
两个时间的饼图雅思小作文英文回答:The two pie charts compare the distribution of time spent on different activities by men and women in a typical day. Overall, it is clear that both men and women spend the majority of their time on three main activities: work, sleep, and personal care. However, there are some notable differences between the two genders.In terms of work, men spend a significantly larger proportion of their day on this activity compared to women. The pie chart shows that men spend 45% of their time working, while women only spend 30%. This suggests that men are more likely to be employed full-time or have longer working hours compared to women.On the other hand, women allocate a larger portion of their day to personal care activities such as grooming, dressing, and taking care of household chores. The chartreveals that women spend 35% of their time on personal care, whereas men only spend 25%. This indicates that women tendto take on more responsibilities related to maintaining the household and their personal appearance.When it comes to sleep, both genders allocate a similar amount of time for rest. Men spend 30% of their day sleeping, while women spend 28%. This suggests that both men and women prioritize getting enough rest and recognize the importance of sleep for their overall well-being.中文回答:这两个饼图比较了男性和女性在一天中不同活动上所花费的时间分配。
雅思写作小作文范文雅思写作饼状图piechart健康饮食.doc
雅思写作小作文范文雅思写作饼状图piechart健康饮食.doc雅思写作小作文范文雅思写作饼状图pie chart 健康饮食今天我们雅思写作小作文范文的文章来研究下饼状图pie chart。
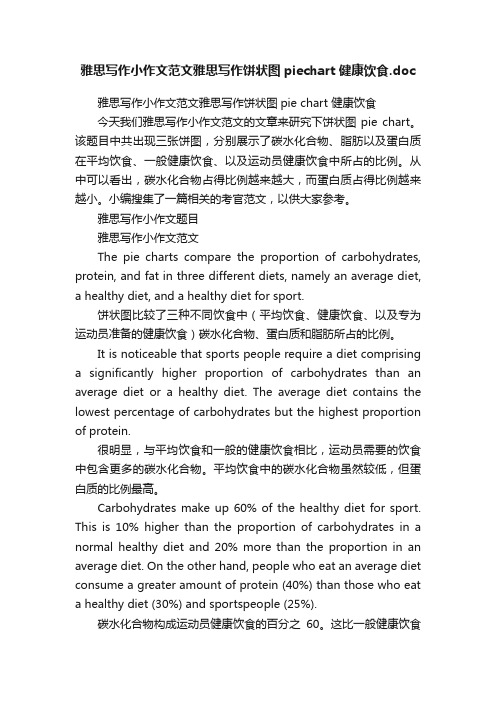
该题目中共出现三张饼图,分别展示了碳水化合物、脂肪以及蛋白质在平均饮食、一般健康饮食、以及运动员健康饮食中所占的比例。
从中可以看出,碳水化合物占得比例越来越大,而蛋白质占得比例越来越小。
小编搜集了一篇相关的考官范文,以供大家参考。
雅思写作小作文题目雅思写作小作文范文The pie charts compare the proportion of carbohydrates, protein, and fat in three different diets, namely an average diet, a healthy diet, and a healthy diet for sport.饼状图比较了三种不同饮食中(平均饮食、健康饮食、以及专为运动员准备的健康饮食)碳水化合物、蛋白质和脂肪所占的比例。
It is noticeable that sports people require a diet comprising a significantly higher proportion of carbohydrates than an average diet or a healthy diet. The average diet contains the lowest percentage of carbohydrates but the highest proportion of protein.很明显,与平均饮食和一般的健康饮食相比,运动员需要的饮食中包含更多的碳水化合物。
平均饮食中的碳水化合物虽然较低,但蛋白质的比例最高。
Carbohydrates make up 60% of the healthy diet for sport. This is 10% higher than the proportion of carbohydrates in a normal healthy diet and 20% more than the proportion in an average diet. On the other hand, people who eat an average diet consume a greater amount of protein (40%) than those who eat a healthy diet (30%) and sportspeople (25%).碳水化合物构成运动员健康饮食的百分之60。
雅思小作文pie chart
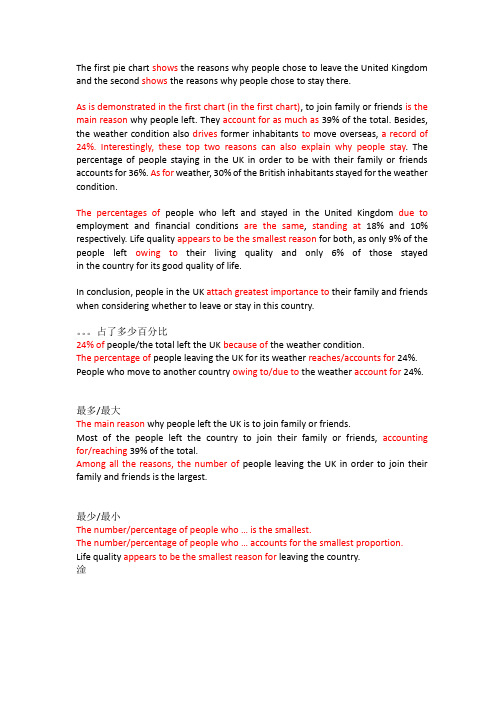
The first pie chart shows the reasons why people chose to leave the United Kingdom and the second shows the reasons why people chose to stay there.As is demonstrated in the first chart (in the first chart), to join family or friends is the main reason why people left. They account for as much as 39% of the total. Besides, the weather condition also drives former inhabitants to move overseas, a record of 24%. Interestingly,these top two reasons can also explain why people stay. The percentage of people staying in the UK in order to be with their family or friends accounts for 36%. As for weather, 30% of the British inhabitants stayed for the weather condition.The percentages of people who left and stayed in the United Kingdom due to employment and financial conditions are the same, standing at18% and 10% respectively. Life quality appears to be the smallest reason for both, as only 9% of the people left owing to their living quality and only 6% of those stayed in the country for its good quality of life.In conclusion, people in the UK attach greatest importance to their family and friends when considering whether to leave or stay in this country.。
雅思写作小作文范文 雅思写作饼状图pie chart 学校花费.doc
雅思写作小作文范文雅思写作饼状图pie chart 学校花费今天我们雅思写作小作文范文的文章来研究下饼状图pie chart。
跟以前咱们见过的题目不同,这次有三个图形。
如此一来,数据就显得非常多和杂乱,十分考验大家挑选关键信息并进行比较的能力。
小编搜集了一篇相应的考官范文,以供大家参考。
雅思写作小作文题目The three pie charts below show the changes in annual spending by a particular UK school in 1981, 1991 and 2001.Summarise the information by selecting and reporting the main features, and make comparisons where relevant.雅思写作小作文范文The pie charts compare the expenditure of a school in the UK in three different years over a 20-year period.饼状图比较了一所英国学校在20年的时间跨度中三年的花费。
It is clear that teachers’ salaries made up the largest proportion of the school’s spending in all three years (1981, 1991 and 2001). By contrast, insurance was the smallest cost each year.很明显,教师的工资在所有三个年份(1981年,1991年和2001年)中占据学校花费的最大部分。
相比之下,保险在每一年里都是最小的花费。
In 1981, 40% of the school’s budget went on teachers’ salaries. This figure rose to 50% in 1991, but fell again by 5% in 2001. The proportion of spending on other workers’ wages fell steadily over the 20-year period, from 28% of the budget in 1981 to only 15% in 2001.1981年,学校预算的百分之四十用于教师的薪酬纸上。
雅思小作文饼状图技巧

雅思小作文饼状图技巧雅思小作文饼状图技巧在雅思的学术类小作文中我们经常会遇到饼状图写作,不要看着一张一张的图,就退缩了,但是相对来说,这个题型还是比较容易写的一种图形,不过学生们也一定不要当做这是一件简单的事情,想要拿高分还是需要努力的。
以下是店铺整理的雅思小作文饼状图技巧,欢迎阅读。
You should spend about 20 minutes on this task.The pie charts show the main reasons for migration to and from the UK in 2007.Summarize the information by selecting and reporting the main features and make comparisons where relevant.Write at least 150 wordsSample AnswerThe pie charts illustrate the primary reasons that people came to and left the UK in 2007.At first glance it is clear that the main factor influencing this decision was employment. Having a definite job accounted for 30 per cent of immigration to the UK, and this figure was very similar for emigration, at 29%. A large number of people, 22%, also emigrated because they were looking for a job, though the proportion of people leaving the UK for this purpose was noticeably lower at less than a fifth. Another major factor influencing a move to the UK was for formal study, with over a quarter of people immigrating for this reason. However, interestingly, only a small minority, 4%, left for this.The proportions of those moving to join a family member were quite similar for immigration andemigration, at 15% and 13% respectively. Although asignificant number of people (32%) gave ‘other’ reasons or did not give a reason why they emigrated, this accounted for only 17% with regards to immigration.通过上面的这道题以及给出的,可以看出饼状图的文章是很好模仿的,或者说是有一个模板的下面是一些如何组织语句的要点:1、选择最重要的一个点放在第一个写从范文中可以看出,换工作,找工作和读书是作者首先提到的,因为这是选择搬家的主要原因。
2021雅思小作文-Pie Chart饼状图攻略及范文汇总
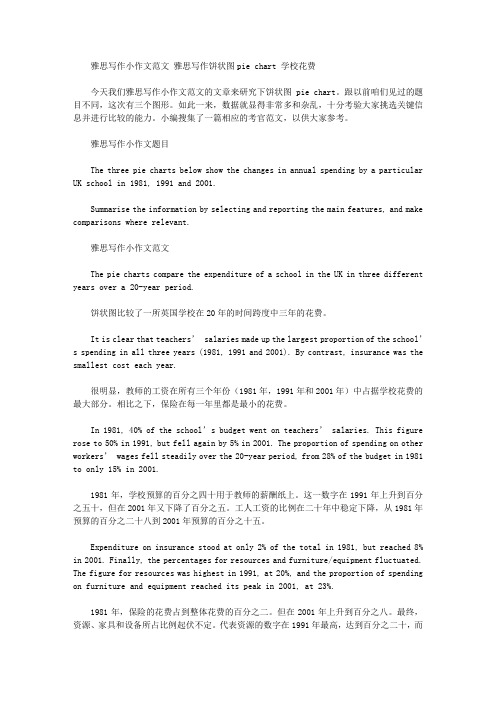
1. 饼状图主体段写法第一句话:说明饼状图的组成部分第二句话:说明占比例最大的部分第三句话以后:说明占比例第二的部分(或者:把剩下的几部分分类,把比例相同的部分捏合到一起说明)第一句:It can be seen from the pie chart that the electricity is used for four purposes.主体段第一句开头“由图可见”的常用表达:It can be clearly seen from the chart that…As can be clearly seen from the chart,We can see clearly from the chart that…According to the… chart,It is apparent/ obvious / evident / manifest from the…. chart that…主体段第一句和第二句的过渡句:To be more exact, = More exactly,To be more precise, = More precisely,To be more specific, = More specifically,To be more detailed, = More detailedly第二句开始:To be more precise, heating rooms and water accounts for the largest proportion (52.5%) of the electricity used, while the demand of ovens, kettles and washing machines occupies the 17.5% of the total need of electricity. Lighting, TV andradio represent the same percentage(15%) as do vacuum cleaners, food mixers and electric tools.饼状图写作要点:1.介绍各扇面及总体的关系2.各个扇面之间的比较,同类扇面在不同时间,不同地点的比较3.重点突出特色最明显的扇面:最大的,最小的,互相成倍的描写句式:1.It is clear that the most +adj. + 主题词is A, which accounts for ___% of all 主题词.2. B is the next largest + 主题词, ___% lower than A of all 主题词and followedclosely by C.3.The above three items of 主题词altogether take about ___%.4.By contrast, D, E and F make the smallest percentage of total 主题词, which are___%, ___% and ___% respectively.模仿例句:In 1950, the urban population represented less than 13% of the total. It is now about 40% and is expected to reach 60% by 2030. (摘自BBC)表示占据的动词或动词短语:form; comprise; make up; occupy; constitute; cover; represent; account for; be shared by倍数和比例的表达:a quarter of ……; half of ……; a majority of ……double (这三个词都可以做名词,动词和形容词); triple; quadruple… be twice as adj. as ……例句:The dining-room is twice as big as the kitchen. … more than ___ times as adj. as …… 例句:There are more than twice as many kangaroos as people in Australia.He is more than three times as rich as I.A has something in common with BA shares some similarity with BThe difference between A and B lies in ……Sentence Patterns:Introduction:The (two) pie charts show (reveal, suggest, illustrate, demonstrate, indicate, describe, relate) the proportion (percentage) of A and B…in (7) (categories), divided into…and…(one is…, another is…)Comparison:1、The biggest difference between (2) groups is in …, where A makes up % while (whereas) B constitutes % (makes up=constitutes=accounts for)the highest percentage / amount of A, which was approximately %, was for…. (=in) /was found in2、The percentage of A in …is more than twice the percentage of B, the ration is % to % (% compared to %)3、In…, while there is (not) a great deal of difference between the percentage of A and B (the former is % and the latter is %).in …, while a greater percentage of A than B are found in…(the former is % and the latter is %).4、There are more A (in …), reaching %, compared with % of B5、By contrast, A has increased (declined), from % in …to % in ….Compared with B, A …Conclusion:To sum up/ In conclusion / It appears that…/ The two charts clearly show…饼状图一例Many women want or need to continue working after they have children. The chart below shows the working after they have children. The chart below shows the working pattern of mothers with young children.the introduction can be written like this:Even just after having a child, a large number women return to work. As the child grows older, the percentage of mothers who choose or need to continue working rises. At least until the child is ten, the larger number of working mothers take part-time occupations. When the child is ten years or older, the number of the full-timers more than doubles while that of the part-timers decrease.Each chart entails / contains instruction, which illustrates what the chart involves rather than the over trends.Paragraph 1:When the youngest child is at most 2 years old, 30% of the women return to work. 19% full-time, and 11% as part-timers.Paragraph 2:The percentage of full timers remains the same until the child turns five and increased slightly to 14% when the child is at most 9 years old, but the percentage of part-time working mothers grows dramatically to 35 and continues growing to 48% by the time the child is 9.Paragraph 3:A change occurs after the child grows to ten. The number of full-time working mothers doubles in percentage to 29, while that of the part-timers is reduced slightly to by 3% to 45%.Conclusion:It appears that, when the child turns to ten, women have much fewer maternal responsibilities than the years before.You should spend about 20 minutes on this task. Write a report for a university lecturer describing the information shown below. You should write at least 150 words.In this analysis we will examine three pie charts. The first one is headed ‘World Spending.’ The second is ‘World Population’ and the third is ‘Consumption ofResources.’In the first chart we can see that people spend most of their income (24%) on food. Transport and then housing are the next major expenses at 18% and 12% respectively. Only 6% of income is spent on clothing.In the second chart entitled ‘World Population’, it is not surprising to find that 57% of people live in Asia. Europe and the Americans account for nearly 30% of the total, whilst 10% of people live in Africa.Finally, the third chart reveals that the USA and Europe consume a huge 60% of the world’s resource.To sum up, the major expenditure is on food, the population figures are the highest for Asia and the major consumers are the USA and Europe. (182 words)范文参考The two graphs show that oil was the major energy source in the USA in both 1980 and 1990 and that coal, natural gas and hydroelectric power remained in much the same proportions. On the other hand, there was a dramatic rise in nuclear power,which doubled its percentage over the ten years.Oil supplied the largest percentage of energy, although the percentage decreased from 42% in 1980 to 33% in 1990. Coal in 1990 was the second largest source of energy, increasing its proportion to 27% from 22% in the previous decade. Natural gas, the second largest source in 1980 at 26%, decreased its share very slightly to provide 25% of America’s energy ten years later. There was no change in the percentage supplied by hydroelectric power which remained at 5% of the total energy used. Nuclear power the greatest change: in 1990 it was 10%, twice that of the 1980s.(152 words)句型套路让“饼图”写作华彩绽放许多考生觉得饼图十分简单,也就是一些百分比及数字的列举,对该类图表不太重视,准备并不充分。
雅思写作小作文范文 雅思写作饼状图pie chart 城市用水.doc

雅思写作小作文范文雅思写作饼状图pie chart 城市用水今天我们雅思写作小作文范文的相关文章来研究下饼状图,pie chart。
按照惯例,我们给大家准备了一篇考官范文。
不过与以往不同的是,这道题目中有三张图片,都是关于城市用水的。
大家可以参考下文章是如何选取数据并进行比较的。
雅思写作小作文题目The pie charts below compare water usage in San Diego, California and the rest of the world.Summarise the information by selecting and reporting the main features, and make comparisons where relevant.雅思写作小作文范文The pie charts give information about the water used for residential, industrial and agricultural purposes in San Diego County, California, and the world as a whole.这些饼图给出了圣地亚哥、加利福尼亚以及整个世界居民用水、工业用水和农业用水的信息。
It is noticeable that more water is consumed by homes than by industry or agriculture in the two American regions. This article is from Laokaoya website. Do not copy or repost it. By contrast, agriculture accounts for the vast majority of water used worldwide.显而易见,在两个美国地区,相比于工业和农业用水,家庭消耗掉的水要更多一些。
雅思范文——精选推荐

雅思范⽂ 篇⼀:雅思⼩作⽂饼状图 You should spend about 20 minutes on this task. Write a report for a university lecturer describing the information shown below. You should write at least 150 words. In this analysis we will examine three pie charts. The first one is headed ‘World Spending.’ The second is ‘World Population’ and the third is ‘Consumption of Resources.’ In the first chart we can see that people spend most of their income (24%) on food. In some countries this percentage would obviously be much higher. Transport and then housing are the next major expenses at 18% and 12% respectively. Only 6% of income is spent on clothing. In the second chart entitled ‘World Population’, it is not surprising to find that 57% of people live in Asia. In fact China and India are two of the most populated countries in the world and they are both situated on this continent. Europe and the Americans account for nearly 30% of the total, whilst 10% of people live in Africa. Finally, the third chart reveals that the USA and Europe consume a huge 60% of the world’s resource. To sum up, the major expenditure is on food, the population figures are the highest for Asia and the major consumers are the USA and Europe. The two graphs show that oil was the major energy source in the USA in both 1980 and 1990. It is manifest from the pie charts that coal, natural gas and hydroelectric power remained in much the same proportions. On the other hand, there was a dramatic rise in nuclear power, which doubled its percentage over the ten years. Oil supplied the largest percentage of energy, although the percentage decreased from 42% in 1980 to 33% in 1990. Coal in 1990 was the second largest source of energy, increasing its proportion to 27% from 22% in the previous decade. Natural gas, the second largest source in 1980 at 26%, decreased its share very slightly to provide 25% of America’s energy ten years later. There was no change in the percentage supplied by hydroelectric power which remained at 5% of the total energy used. Nuclear power the greatest change: in 1990 it was 10%, twice that of the 1980s. 篇⼆:雅思⼩作⽂饼状图范⽂ This lesson will provide you with tips and advice on how to write an IELTS pie chart for task one. To begin, take a look at the pie chart below and the model answer. You should spend about 20 minutes on this task. The pie charts show the main reasons for migration to and from the UK in 2007. Summarize the information by selecting and reporting the main features and make comparisons where relevant. Write at least 150 words Sample Answer The pie charts illustrate the primary reasons that people came to and left the UK in 2007. At first glance it is clear that the main factor influencing this decision was employment.Having a definite job accounted for 30 per cent of immigration to the UK, and this figure was very similar for emigration, at 29%. A large number of people, 22%, also emigrated because they were looking for a job, though the proportion of people leaving the UK for this purpose was noticeably lower at less than a fifth. Another major factor influencing a move to the UK was for formal study, with over a quarter of people immigrating for this reason. However, interestingly, only a small minority, 4%, left for this. The proportions of those moving to join a family member were quite similar for immigration and emigration, at 15% and 13% respectively. Although a significant number of people (32%) gave ‘other’ reasons or did not give a reason why they emigrated, this accounted for only 17% with regards to immigration. 篇三:雅思写作⼩作⽂饼图真题句⼦练习Pie Sentences Pie chart In 1980 Australia used coal as the main electricity source(50 units) and the remainder was produced from natural gas, hydro power(each producing 20 units) and oil,which produced only 10 units. 在1980年,澳⼤利亚使⽤煤作为主要的电⼒来源(50 units),剩下的电⼒由天然⽓,氢能(两者各产⽣20 units)和⽯油,它仅仅只产⽣10 units。
IELTS writing pie_chart 雅思写作 饼图

The pie charts provide some information relevant to the proportion of employment in 6 main categories in U.K. in 1992.Overall, for female, manual pattern made up more proportion than non-manual with a 69 percent employee rate while for male the two patterns nearly accounted for equal proportion, with 48 percent in manual.More specific, managerial and professional, clerical or related and other manual contributed asubstantial part of all female employee, at 87 percent. However, for male employee managerial and professional, craft or similar and other manual had a significant percentage in the pie chart, at 86 percent.Apparently, managerial and professional and other manual had a great proportion in all employed persons. And the biggest difference between two genders was in clerical or related pattern and craft or similar pattern because only 6 percent of men chosen clerical or related pattern while there were approximately 5 times of women chosen it. When there were a quarter of man do craft or similar pattern, just 3 percent female did these.There were some small percentages of both men and women who employed in other non-manual job, craft or similar job, respectively in 9 percent and 3 percent. As for male employee, clerical or related and other non-manual jobs share the same small proportion with 6 percent. General laborers pattern is the least popular job pattern with only 1 percent women chosen it and 2 percent men chosen .。
雅思写作小作文范文 雅思写作饼状图pie chart 英国景点数据统计.doc
Looking at the information in more detail, we can see that 38% of the surveyed visitors went to a theme park, and 37% of them went to a museum or gallery. By contrast, the translation is from Laokaoya website, historic houses and monuments were visited by only 16% of the sample, while wildlife parks and zoos were the least popular of the four types of the tourist attraction, with only 9% of visitors.
It is clear that theme parks and museums/galleries were the two most popular types of tourist attraction in that year. Blackpool Pleasure Beach received by far the highest proportion of visitors in the theme park sector.
更加详细的看一下所给信息。我们可以看到被调查的游客中有百分之三十八去了主题公园,还有百分之三十七去了博物馆或者画廊。相比之下,该样本中只有百分之十六的人去了历史房屋或者遗址,而野生动物公园或者动物园是四类旅游景点中最不受欢迎的那个,只有百分之九的游客前往。
雅思小作文9分-饼状图

2001 2002These two pie charts show how attitudes of visitors towards this museum changed in these two years before and after the museum redecorated, and the paragraph shows the whole number of visitors in these two years.The table demonstrates the exact number of visitors to Ashdown museum throughout the year before and the year after it was redecorated. Two pie charts illustrate the outcomes of questionaires interviewing visitors how satisfied they were with their trip, during the same two periods.Interviewing visitors how satisfied they were with their trip, questionaires were conducted successfully. Least/mostFrom the first pie chart that shows the opinion/visitors’ opinions before the museum redecorated, the number of people who felt dissatisfied was the most/largest, accounting for 40%. This was followed by the attitude/group of the satisfied and the very satisfied, representing 30% and 15% respectively. The figure/number of citizens who felt very dissatisfied took up the percentage of 10%, and the rest of no response, 5% collectively.It has been observed from two pie charts that in terms of the survey conducted the year before renovation, 40% of respondents were dissatisfied, while only 15% of them were very satisfied. The year after the museum was redecorated indicate that the number of dissatisfied visitors declined and became 15%. Followed by the precentage of respondents who were very dissatisfied, which dropped from 10% to 5%. Comparing the percentage of satisfied visitors, we can see an upward trend. Respondents/interviewees Upward trend, (we can see a postive pattern) downward trend (negative pattern)The second chart shows the views after refurbishing. The number of whom felt satisfied took/accounted for40%. The opinion of very satisfied was 35%, and the following group is the figure of who were dissatisfied, took the number of 15%.That of no response section/group and people who felt very dissatisfied were the same, took thenumber of 5%.We can see that after redecorating, there are more people feel better than before.To sum up, we can say that the redecoration that has been done to attract new visitors to the museum has reached its aim.Refurbishment, renovation, dedecoration。
雅思小作文饼状图范文
刚刚结束的12月21日雅思考试中,小作文考到了柱状图和饼状图,很多同学对于饼状图的写作并不是很有把握,让我们一起来看看上海环球雅思写作老师给出的小作文饼状图范文,希望能对2014年准备考试的同学有所帮助。
Describing an IELTS Pie ChartThis lesson will provide you with tips and advice on how to write an IELTS pie chart for task one. To begin, take a look at the pie chart below and the model answer.You should spend about 20 minutes on this task.The pie charts show the main reasons for migration to and from the UK in 2007.Summarize the information by selecting and reporting the main features and make comparisons where relevant.Write at least 150 wordsSample AnswerThe pie charts illustrate the primary reasons that people came to and left the UK in 2007.At first glance it is clear that the main factor influencing this decision was employment.Having a definite job accounted for 30 per cent of immigration to the UK, and this figure was very similar for emigration, at 29%. A large number of people, 22%, also emigrated because they were looking for a job, though the proportion of people leaving the UK for this purpose was noticeably lower at less than a fifth. Another major factor influencing a move to the UK was for formal study, with over a quarter of people immigrating for this reason. However, interestingly, only a small minority, 4%, left for this.The proportions of those moving to join a family member were quite similar for immigration and emigration, at 15% and 13% respectively. Although a significant number of people (32%) gave ‘other’reasons or did not give a reason why they emigrated, this accounted for only 17% with regards to immigration.。
雅思写作task 1 饼状图 Pie Chart
P3
• In contrast, France used coal as a source for only 25 units of electricity in 1980, which was matched by natural gas. • The remaining 40 units were produced largely from oil and nuclear power, with hydro contributing only 5 units. • But by 2000 nuclear power, which was not used at all in Australia, had developed into the main source, producing almost 75% of electricity, at 126 units, while coal and oil together produced only 50 units. Other sources were no longer significant.
练习
• 女生的数量大约是男生的三倍 • The number of girls is about 3 times that of boys • The number of girls is about 3 times as high as boys • The number of girls is about twice higher than boys
写作步骤
• 先审题,在看图
• 几张饼,几种馅
• 哪个馅儿多,哪个馅儿少
• 数字,比率
整体+局部
• The following two pie charts illustrate the energy use in the U.S.A. • Write a report for a university lecturer describing the information given in the pie charts below.
雅思小作文pie chart

表余下的:the rest =the remainder/ remaining (adj.)
表相同:be similar to/ be equal to/share the same percentage at (+具体比例)
倍数的表达:倍数+that of +名词
倍数+as….as
倍数+比较级+ than
According to the second pie chart, it clearly shows that heating and air conditioning account for the largest proportion (62%) in the residential energy use while the small appliances makes up the least proportion (10%). The heating water and miscellaneous ( including cooking) constitutes 15% and 13% respectively.
被动: 42% of the people (largest portion) were employed in the industrial sector.
分 词 表 被 动 : The people employed in the industrial sector covered 42% of the total. 定语从句: The percentage of the people who chose to work in the industrial sector / were employed in the industrial sector covered 42%.
- 1、下载文档前请自行甄别文档内容的完整性,平台不提供额外的编辑、内容补充、找答案等附加服务。
- 2、"仅部分预览"的文档,不可在线预览部分如存在完整性等问题,可反馈申请退款(可完整预览的文档不适用该条件!)。
- 3、如文档侵犯您的权益,请联系客服反馈,我们会尽快为您处理(人工客服工作时间:9:00-18:30)。
.
12
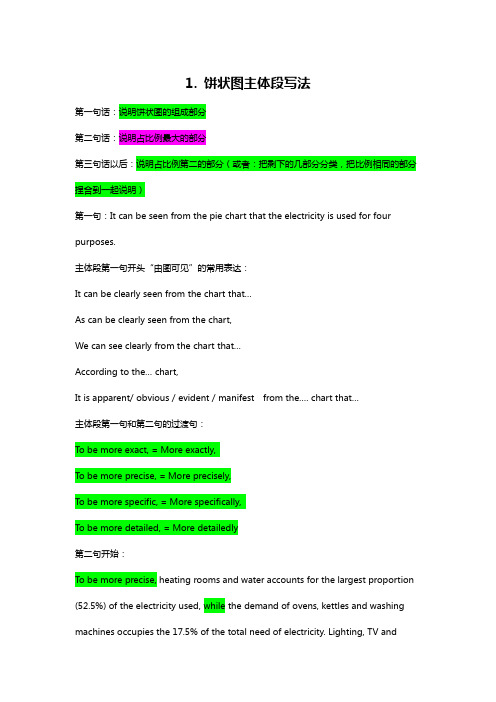
Fast Food Preferences of Teenagers in the USA
7%
3%
9%
33%
22%
26% Hamburgers Pizza French Fries Fried Chicken Tacos Sushi
The pie chart shows the fast foods that teenagers prefer in the USA.
.
10
• 主动:in 1932, 42% of the people (largest portion) worked in the industrial sector.
• 42% of the people chose to work in the industrial sector, which was the largest portion of the total labor force.
• 定语从句:The percentage of the people who chose to work in the industrial sector / were employed in the industrial sector covered 42%.
.
11
• Comparatively, working in the industrial sector would be most people’s choice (42%) among all the sectors in 1932..ຫໍສະໝຸດ 13.14
•The following two graphs display the distribution of workforce between the ages of 16 and 65 in 1932 and 1992 in Great Britain.
OR •The two pie charts illustrate the distributional situation of labor force from 16 years old to 65 in two different years in the UK.
• 变换词性(n. v. adj. adv.) • 变换主语 • 变换语态(主动/被动) • 使用从句 • 同义词替换
.
9
Examples of Paraphrase
• 表达目标:1932,工业部门,(劳动力)人数,最多, 42%
(1)In 1932, most of the people (42%) worked in the industrial sector.
2. Body: describe the graph in details
3. Conclusion
.
6
Tense
• 文章的起始句作为全文的介绍,说的是图表告诉 (show, indicate, demonstrate, illustrate)我们什么, 所以用一般现在时;
• 在文章的主体部分,时态的选择根据图表给出的时间 信息具体决定是一般现在时态、一般过去、还是一般 将来。
.
1
Pie Chart
.
2
图表‘口诀’
.
3
Overview
• 20 mins • 150 words • 静态饼图与动态饼图
.
4
写作步骤
• 先审题,在看图 • 几张饼,几种馅 • 哪个馅儿多,哪个馅儿少 • 数字,比率,变化
.
5
Structure
一般分为三个部分 1. Introduction: paraphrase
.
17
Body之单饼
• 可先按照扇形面积大小从大到小排列数据。主体段在 描写各个扇形数据的时候,要注意详略,即最大和第 二大的扇形要重点描述。
• Relatively, the industrial sector attracted the largest amount of workforce (42%) in 1932.
• 1932 witnessed the fact that working in the industrial sector became most people’s choice (42%).
• 被动: 42% of the people (largest portion) were employed in the industrial sector.
• 分词表被动:The people employed in the industrial sector covered 42% of the total.
.
15
注意:
• 若遇到饼图中有总数的描述,宜在开头先写,for example:
.
16
Overall, Coca-cola sold a total of 17.1 billion cases of their fizzy drink product worldwide in the year 2000. OR Overall, a total of 17.1 billion cases of Coca-cola fizzy drink were sold worldwide in the year 2000.
(2)There were 42% of the people (largest portion) working in the industrial sector.
( 3 ) The people working in the industrial sector occupied 42 % of the total labor force, which was the most significant part of all.
.
7
Introduction
• Sentence patterns:
• The pie chart(s) shows/ illustrates/ reveals/suggests/ demonstrates/ indicates/ describes…
• Or
.
8
Introduction
• How to paraphrase: