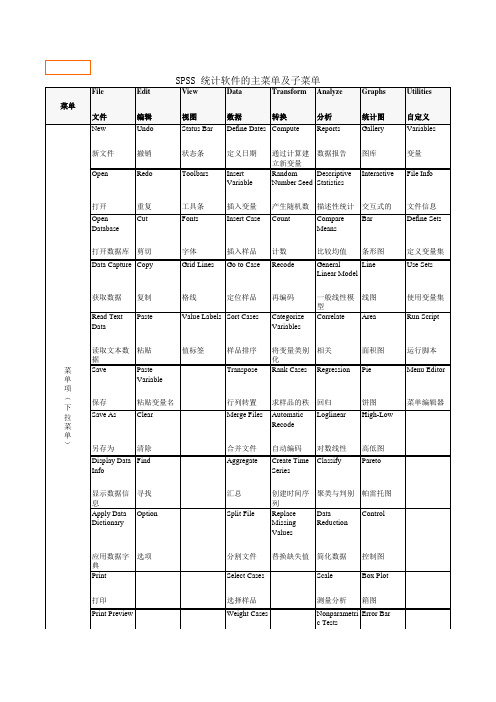
spss各模块菜单含义
SPSS菜单命令详解剖析

purchase:选
Compare effectiveness of campaigns(control Package Test):比较活动效果〔把握包装检验〕
Apply scores from a model File:应用来自模型文 件的得分
1.6.9 Graphs菜单
Chart Builder 图形生成器
Graphboard Template Chooser 图形模板选择
1Bar
条形图
3-D Bar
三维条形图
Line
线图
Area
面积图
Pie
饼图
High-Low 凹凸图
Box Plot
箱图
Error Bar
误差条图
Population Pyramid 人口金字塔图
Scatter/Dot 散点图
Histogram 直方图
状态栏显示 工具条栏显示 菜单编辑器 字体 显示/隐蔽格线 显示/隐蔽变量值标签 标记错误数据 查看自变量 变量定义窗口和数据编辑
窗口转换
1.6.5 Data菜单
Define Variable Properties
定义变量属性
Set Measurement Level for Unknown 设置未知测量级别
SPSS帮助主题 用户指南 统计辅导学习 统计训练指导 语句命令参考
研发中心 关于SPSS版本信息 算法 SPSS官方主页 版本更新检查
1.7 SPSS中英文界面的转换
当首次安装软件时,SPSS界面为英文显示,此时可以承受如 下方法将其转换为中文界面。
1. 选择菜单栏中的【Edit(编辑)】菜单中的【Option(选项)】 命令。
数据汇总 正交设计 复制数据集 分割文件 选择观测量 观ompute Variable Count Values within Cases Shift Values Recode into Same Variables Recode into Different Variables Automatic Recode Visual Binning Optimal Binning
Spss软件常用菜单含义与功能介绍
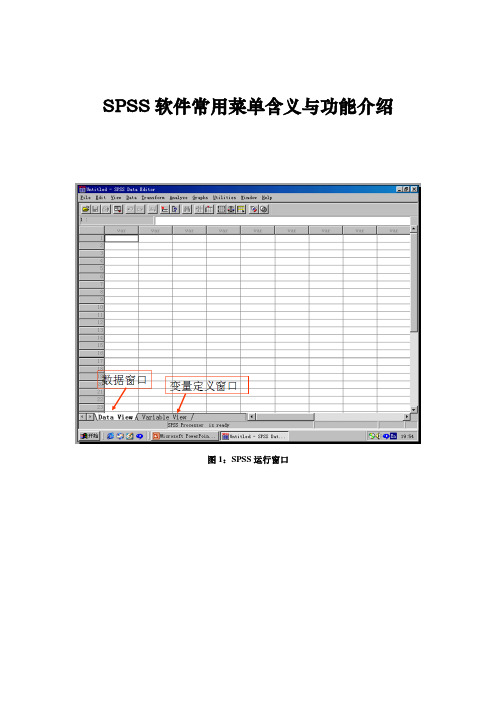
SPSS软件常用菜单含义与功能介绍图1:SPSS运行窗口1、计算产生变量根据已经存在的变量,经过函数计算后,建立新变量或替换员原量的值。
图2:计算产生变量图3:分类汇总1、描述性统计(1)频数分布分析:通过频数分布表、直方图,以及集中趋势和离散趋势的各种统计量,描述数据的分布特征。
(2)描述性统计分析:计算描述数据的集中趋势和离散趋势的各种统计量,还可以做标准化变换(变成均值为0,方差为1的数据)。
(3)探索性分析:判断数据有无离群点(outliers),极端值(extreme values);进行正态分布检验和方差齐性检验;了解数据指标之间差异的特征。
(1)双变量相关分析:分析两个变量之间是否存在相关关系。
(2)偏相关分析:剔除其他变量的影响的情况下,计算两变量之间的相关系数。
3、聚类分析与判别分析(1)系统聚类:最常用的聚类方法。
(2)判别分析:判别所研究的对象属于哪一类的统计方法。
(1)线性回归:一个因变量(dependent )与多个自变量(independents )之间存在线性数量关系。
(2)曲线拟合:可以完成11种曲线的自动拟合(根据需要进行选择),并进行参数估计与检验,绘制拟合图形等。
自变量(independent )只能选一个或者使用时间作为自变量(time: 即使用1,2,3,…,),即只能做一元函数的曲线拟合。
因变量(dependent )可以选多个,将分别做多个一元函数的拟合。
模型Models 模型名称 模型表达式Linear 线性模型 01*y b b x =+ Logarithmic对数模型01*ln y b b x =+Inverse 逆模型 01/y b b x =+ Quadratic 二次模型 2012**y b b x b x =++ Cubic 三次模型 230123***y b b x b x b x =+++Compound 复合模型 01*x y b b =Power 幂模型 10*b y b x = S S 型模型 01/b b x y e +=Growth 生长模型 01*b b x y e += Exponential 指数模型 1*0*b x y b e =LogisticLogistic 模型011/(1)b b x y e --=+一般可以先选择所有的11种模型,再根据结果选择最佳模型。
spss各模块菜单含义
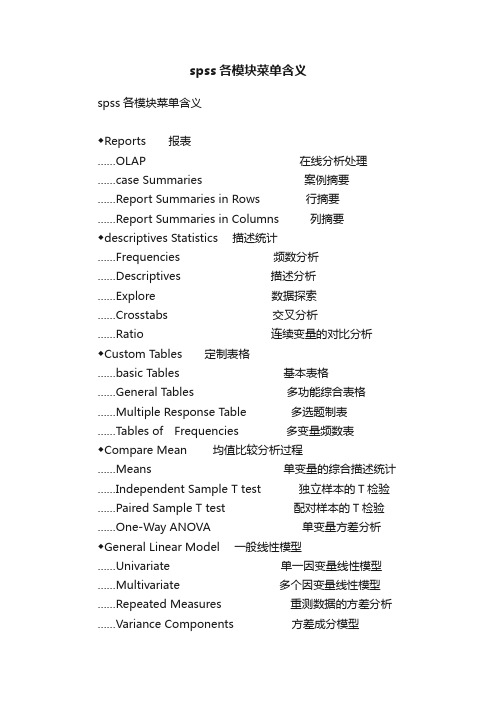
spss各模块菜单含义spss各模块菜单含义◆Reports报表……OLAP在线分析处理……case Summaries案例摘要……Report Summaries in Rows行摘要……Report Summaries in Columns列摘要◆descriptives Statistics描述统计……Frequencies频数分析……Descriptives描述分析……Explore数据探索……Crosstabs交叉分析……Ratio连续变量的对比分析◆Custom Tables定制表格……basic Tables基本表格……General Tables多功能综合表格……Multiple Response Table多选题制表……Tables of Frequencies 多变量频数表◆Compare Mean均值比较分析过程……Means单变量的综合描述统计……Independent Sample T test独立样本的T检验……Paired Sample T test配对样本的T检验……One-Way ANOVA 单变量方差分析◆General Linear Model一般线性模型……Univariate单一因变量线性模型……Multivar iate 多个因变量线性模型……Repeated Measures重测数据的方差分析……Variance Components方差成分模型◆Mixed Models混合线性模型……linear线性模型◆Correlate 相关分析……Bivariate Pearson/ Kendall/Spearman非参数相关分析……Partial双变量相关分析……Distance相似性、非相似性分析◆Regression 回归分析……Liner线性回归分析……Curve Estimation曲线估计……Binary Logistic二分变量回归分析……Multinomial Logistic 多项类别变量回归分析……Ordinal序数的回归分析……Probit 概率分析……Nonlinear 非线性回归分析……Weight Estimation 不同权数的线性回归分析……2-stage Least Squares 二阶最小平方回归分析……Optimal Scaling最优尺度分析◆Loglinear 对数线性回归分析……General 一般对数线性回归分析……Logit单因变量多自变量回归分析……Model Selection分层对数线性模型◆Classify聚类和判别分析……K-means Cluster 快速聚类分析(指定分类数聚类分析)……Hierarchical Cluster系统聚类分析(未知分类数聚类分析)……Discriminent 判别分析◆Data Reduction 数据浓缩(降维)处理……Factor因子分析……Correspondence对应分析……Optimal Scaling最优尺度分析◆Scale项目分析……Reliability Ananlysis可靠性分析……Multidimensional Scaling多维等级分析……Multidimensional Scaling(POXSCAL)◆Nonparametric T ests 非参数统计……Chi-Square 相对比例假设检验……Binomial特定时间发生概率检验……Run随即序列检验……1-Sample Kolmogorov Smirnov 样本分布检验……2-Independent Samples 双不相关组分布分析……K Independent Samples多不相关组分布分析……2 Related Samples双相关变量分布分析……K Related Samples相关变量分布分析◆Time Series时间序列……Exponential Smoothing 平衡序列的随机分量……Autoregression一阶自回归误差线性方差检验……ARIMA综合自回归移动平均分析……Seasonal Decomposition对时间序列增倍和加性季节因子分析◆Survival生存分析……Life Tables 生命表分析……Kaplan-Meier 双事件分布检验……Cox Regression事件与时间变量相互分析……Cox w/Time Dep cov时间函数Cox分析◆Multiple Response多选题处理……Define sets多选题变量定义……Frequencies多选题频数分析……Crosstabs多选题交叉分析◆Missing value Analysis 缺失值分析。
SPSS菜单说明

Hierarchical Cluster 样本聚类和变量聚类 Discriminate 判别分析
Statistics统计
Data Reduction——Factor 因子分析 Scale——Reliability Analysis可靠性分析
P-P图 Q-Q图
转置数据库时注意首先打开SPSS软件, 然后新建
New Nonparametric Tests 非参数检验
——Chi-Square 卡方经验
Graphs图
Gallery图形转换 Interactive交互式图——Bar条图
Dot点图 Line 线图 Ribbon条带图 Drop-Line垂线图 Pie饼图
Graphs图
Bar条图 Line线图 Area面积图 Pie饼图 Scatter散点图 Histogram直方图
Statistics统计
Custom tables表格组——Basic tables基本表 General tables总表
Multiple response tables多重反应表 Tables of frequencies频率表
Statistics统计
Compare means比较平均值—Means平均值 One-Sample T Test一维样本T检验
Independent-Samples T Test独立样本T检验 Paired-Samples T Test配对样本T检验 One-Way ANOVA一维方差分析
Statistics统计
General Linear Model——Univariable单因变量 方差分析
SPSS菜单说明

Analyze统计
General Linear Model——Univariable 单因变量方差分析
Correlate相关——Bivariate 双变量相关 Regression回归分析——Linear 线性回归
Curve Estimation曲线预测模型 Scale——Reliability Analysis可靠性分析
File 文件
New新建——Data 数据库 Open打开 Save 保存 Save as 另存 Print 打印
Edit 编辑
Undo撤消 Cut 剪切 Copy复制 Paste粘贴 Clear清除
Data数据
Define variable定义变量 Insert variable插入变量 Insert case插入案例 Go to case查找 Sort cases排序 Transpose 转置 Select cases选择案例
Transform转化
Compute 生成新变量 Recode转化成新变量
Analyze统计
Summarize概括数据——Frequencies频率 Descriptives描述 Explore探索 Crosstabs交叉表格
Analyze统计
Tables表格组——Basic tables基本表 General tables总表
Multiple response tables多重反应表 Tables of frequencies频率表
Analyze统计
Compare means比较平均值—Means平均值 One-Sample T Test一维样本T检验
Independent-Samples T Test 独立样本T检验 Paired-Samples T Test配对样本T检验 Nhomakorabea(信度分析)
spss菜单

位小数 5. Lable栏:定义变量名标签,该处可使用中文
6. Values栏:定义变量值标签 7. Missing栏:定义变量缺失值。SPSS默认缺失值用 “.”表示,一般用默认的 8. Columns栏:定义显示列宽,使用很少。实际使用
时,可直接拖动改变列宽
6. Analyze(统计菜单):一系列统计方法的应用 7. Graphs(作图菜单):统计图的制作 8. Utilities(用户选项菜单):命令解释、字体选择、 文件信息、定义输出标题、窗口设计等 9:Windows(窗口管理菜单):窗口的排列、选择、 显示等 10. Help(求助菜单):帮助文件的调用、查寻、显 示等 点击菜单选项即可激活菜单,并弹出下拉式子 菜单,可根据自己的需求再点击子菜单的选项, 完成所需的功能
(三)数据录入
1. 直接录入 若数据量较少、处理方法单一时可将数据直接 录入SPSS中 2.从其它数据库中引入 先用Excel建立数据库,再用复制粘贴的方式从 Excel中将数据转入SPSS 逐一选取File——Open——Data可打开已保存 的SPSS数据文件或其他类型的数据文件。单击 “文件类型”下拉菜单,选择要打开的数据文件 类型
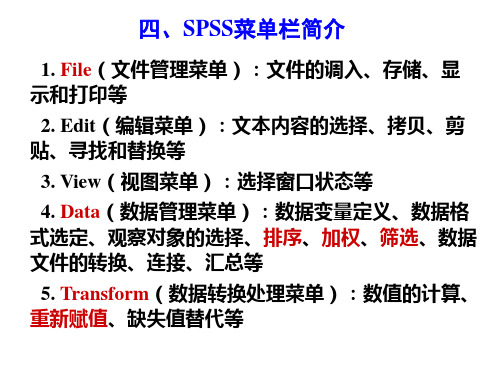
四、SPSS菜单栏简介
1. File(文件管理菜单):文件的调入、存储、显 示和打印等
2. Edit(编辑菜单):文本内容的选择、拷贝、剪 贴、寻找和替换等
3. View(视图菜单):选择窗口状态等 4. Data(数据管理菜单):数据变量定义、数据格 式选定、观察对象的选择、排序、加权、筛选、数 据文件的转换、连接、汇总等 5. Transform(数据转换处理菜单):数值的计算、 重新赋值、缺失值替代等
五、分析数据准备 (一)变量定义
spss菜单介绍
6. Analyze(统计菜单):一系列统计方法的应用 7. Graphs(作图菜单):统计图的制作 8. Utilities(用户选项菜Байду номын сангаас):命令解释、字体选择、 文件信息、定义输出标题、窗口设计等 9:Windows(窗口管理菜单):窗口的排列、选择、 显示等 10. Help(求助菜单):帮助文件的调用、查寻、显 示等 点击菜单选项即可激活菜单,并弹出下拉式子 菜单,可根据自己的需求再点击子菜单的选项, 完成所需的功能
四、SPSS菜单栏简介
1. File(文件管理菜单):文件的调入、存储、显 示和打印等
2. Edit(编辑菜单):文本内容的选择、拷贝、剪 贴、寻找和替换等
3. View(视图菜单):选择窗口状态等 4. Data(数据管理菜单):数据变量定义、数据格 式选定、观察对象的选择、排序、加权、筛选、数 据文件的转换、连接、汇总等 5. Transform(数据转换处理菜单):数值的计算、 重新赋值、缺失值替代等
Spss菜单解释【VIP专享】
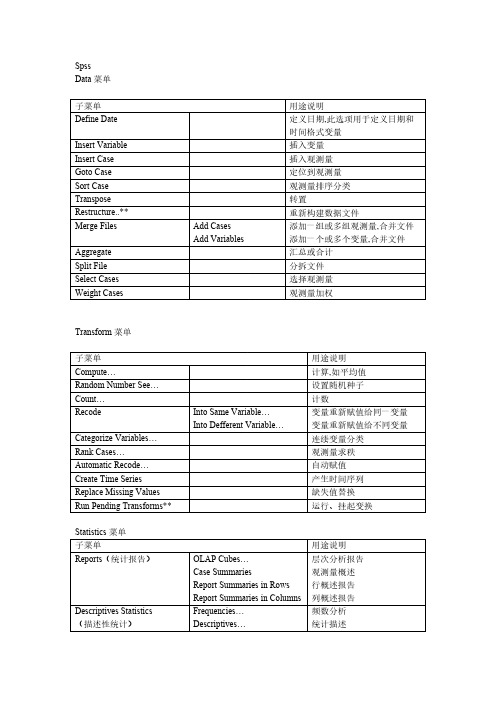
SpssData菜单子菜单用途说明Define Date定义日期,此选项用于定义日期和时间格式变量Insert Variable插入变量Insert Case插入观测量Goto Case定位到观测量Sort Case观测量排序分类Transpose转置Restructure..**重新构建数据文件Merge Files Add CasesAdd Variables 添加一组或多组观测量,合并文件添加一个或多个变量,合并文件Aggregate汇总或合计Split File分拆文件Select Cases选择观测量Weight Cases 观测量加权Transform菜单子菜单用途说明Compute…计算,如平均值Random Number See…设置随机种子Count…计数Recode Into Same Variable…Into Defferent Variable…变量重新赋值给同一变量变量重新赋值给不同变量Categorize Variables…连续变量分类Rank Cases…观测量求秩Automatic Recode…自动赋值Create Time Series产生时间序列Replace Missing Values缺失值替换Run Pending Transforms**运行、挂起变换Statistics菜单子菜单用途说明Reports(统计报告)OLAP Cubes…Case SummariesReport Summaries in RowsReport Summaries in Columns 层次分析报告观测量概述行概述报告列概述报告Descriptives Statistics (描述性统计)Frequencies…Descriptives…频数分析统计描述Explore…Crosstabs…Ratio…数据探索交叉表,或列联表比率统计Compare Means(均值比较)Means…One-Sample T Test…Independent-Sample T Test…Paired-Sample T Test…One-Way ANOVA 均值比较单样本T检验独立样本T检验配对样本T检验单因素方差分析General Linear Model(一般线形模型)Univariate通用线形因子分析Correlate(相关分析)BivariatePartialDistances 二元相关过程偏相关过程距离分析过程Regression(回归分析)LinearCurve estimation 线形回归分析曲线估计Classify(聚类和判断分析)k-means clusterhierarchical clusterdiscriminant K-均值聚类分析层次分析判别分析Data Reduction(数据简化)Factor因子分析Scale**(比例分析)Reliability AnalysisMultidimensional Scaling 可靠性分析多维比例分析Nonparametric Tests (非参数检验)Chi-sqaureBinomialRuns1-sample K-S2 independent samplesK independent samples2 Related samplesK related samples卡方检验法二项检验法游程检验法单个样本的K-S检验两个独立样本的K-S检验K个独立样本的K-S检验两个相关样本的检验K个相关样本的检验Multiple Response**(多重响应)Define setErequenciesCrosstabs定义多重响应集多重响应频数表多重响应交叉表Accuracy 精确度,actual frequency 实际频数,adjusted value 校正值,alternative hypothesis 备选假设,analysis of convariance 协方差分析,analysis of variance, ANOVA 方差分析,arithmetic mean 算数均数,asymmetric distribution 非对称分布,autocorrelation 自相关,censored data 截尾数据,censoring 删失失访终检,central limit theorem 中心极限定理,central tendency 集中趋势,chance error 随机误差,class mid-value 组中值,cluster analysis 聚类分析,cluster sampling 整群抽样,coding 编码,coefficient of contingency 列联系数,coefficient of correlation 相关系数,bar chart 条图,bayes theorem 贝叶斯定理,bias 偏性,binomial distribution 二项分布,bivariate normal distribution 双变量正态分布,block 区组,box plot 箱图,canonical correlation 典型相关,case-control study 病例一一对照研究,categorical variable 分类变量,cell 单元,coefficient ofdetermination 决定系数,coefficient of partial correlation 偏相关系数,coefficient of product-moment correlation 积差相关系数,coefficient of rank correlation 等级相关系数,coefficient of regression 回归系数,coefficient of variation 变异系数,coefficient of skewness 偏度系数,cohort study 队列研究,communality variance 公共方差,comparability 可比性,complete association 完全相关,complete random design 完全随机设计,degree of freedom 自由度,conditional likelihood 条件似然,conditional probability 条件概率,confidence interval CI 可信(置信)区间,confidence limit CL 可信(置信)限,confirmatory factor analysis 验证性因子分析,confirmatory research 验证性研究,degree of reliability 可靠度,density function 密度函数,dependent variable 因变量,deviation 离差,discrete variable 离散变量,discriminant analysis 判别分析,conjoint analysis 联合分析,consistency test 一致性检验,constraint 约束,contingency table 列联表,contribution rate 贡献率,control 对照控制,controlled experiments 对照实验,correction 校正,correction for continuity 连续性校正,correlation 相关,correlation analysis 相关分析,correlation coefficient 相关系数,distribution 分布,distribution-free method 任意分布方法分布自由方法,dose response curve 剂量反应曲线,dummy variable 哑变量虚拟变量,eigenvalue 特征值特征根,eigenvector 特征向量,equivariance 等方差,error 误差,error of estimate 估计误差,estimated value 估计值,correspondence analysis 对应分析,counts 计数频数,covariance 协方差,Cox regression Cox回归,criteria for fitting 拟合准则,critical value 临界值,cross-over design 交叉设计,cross-section analysis 横断面分析, eigenvalue特征值,特征根eigenvector特征向量equivariance等方差error误差error of estimate估计误差estimated value估计值euclidean distance欧氏距离event事件expected values期望值design of experiment实验设计exploratory data analysis探索性数据分析exponential curve指数曲线extrapolation外推法extremes极端值,极值,forecast预测fourfold table四格表frequency频数frequency distribution频数分布general linear model, GLM一般线性模型generalized linear model广义线性模型geometric mean几何均数goodness of fit拟合优度,half-life半衰期harmonic mean调和均数hazard function风险函数,hazard rate风险率heterogeneity异质heterogeneity of variance方差不齐heteroscedasticity 方差不齐hierarchical clustering method分层聚类法histogram直方图homogeneity同质,齐性,homogeneity of variance同方差性homogeneity test齐性检验homoscedasticity方差齐性hypothesis test假设检验, independence独立性independent variable自变量initial mean vectors初始凝聚点interaction交互效应intercept截距interpolation插值inter-quartile range四分位数间距,interval estimation区间估计inverse matrix逆矩阵iteration迭代, K-means method K-均值聚类法Kaplan-Merier curve Kaplan-Merier曲线kendall srank correlationKendall等级相关Kolmogorov-Smirnov test K-S检验Kruskal and Wallis test K-W检验,H检验kurtosis峰度L lack offit拟合劣度,失拟Latin square design拉丁方设计least square method最小二乘法legend图例level水平level of significance统计意义水平,life table寿命表likelihood function似然函数likelihood ratio test似然比检验line graph线图linear线性linear correlation直线相关linear equation线性方程linear programming线性规划linear regression线性回归,linear trend线性趋势loading载荷log-rank test时序检验logarithmic scale对数尺度logistic regression logistic回归logit transformation logit转换loglinear model对数线性模型M main effect主效应matched data配对资料matching匹配maximum likelihood method最大似然法maximum likelihood ratio test似然比检验,mean均值mean square,MS均方measurement bias测量性偏倚median中位数median effective dose半数效量median lethal dose半数致死量median survival time中位生存时间median test中位数检验M-estimators M估计量minimumlethal dose最小致死量missing value缺失值multidimensional scaling analysis, MDS多维尺度分析,multinomial distribution多项分布multiple comparison多重比较multiple correlation复相关,多重相关multiple covariance多元协方差multiple linear regression多重线性回归multiple response多重应答,多选题multistage sampling多级抽样multivariate regression多元回归multivariate statistical analysis多变量统计分析,多元统计分析, negative correlation负相关no statistical significance无统计学意义nominal variable名义变量nonlinear regression非线性回归nonparametric statistics非参数统计nonparametric test非参数检验normal distribution正态分布null hypothesis原假设,无效假设numerical variable数值变量O observation unit观察单位observed value观测值odds ratio,OR优势比,比数比,one-sided test单侧检验one-way ANOVA单因素方差分析optimum allocation最优分配order statistics顺序统计量ordered categories有序分类orthogonal experimental design正交试验设计outlier异常值,离群值overall survey普查P paired design配对设计paired(matched)t-test配对t检验parameter参数,parametric statistics参数统计parametric test参数检验partial correlation偏相关partial likelihood偏似然函数partial regression coefficient偏回归系数path analysis路径分析percent bar graph百分条图percentage百分比,百分数percentile百分位数,位点periodicity周期性pie graph饼图,圆图,placebo安慰剂point estimation点估计Poisson distribution Poisson分布polynomial curve多项式曲线population总体population mean总体均值positive correlation正相关posterior distribution后验分布power ofa test检验效能power ofstatistics检验效能precision精度principal component analysis主成分分析prior distribution先验分布product moment乘积矩,协方差,product-limit method乘积极限法proportion构成比prospective study前瞻性研究P-value P值Q qualitative evaluation定性评价qualitative method定性方法quantile-quantile plot Q-Q图quantitative analysis定量分析quantitative evaluation定量评价quartile四分位数questionnaire问卷quick cluster 快速聚类, random event随机事件random sampling随机抽样randomization随机化randomized allocation随机分配randomized block design随机区组设计randomized control trial随机对照试验randomized double blind control trial随机双盲对照试验range极差,全距rank correlation等级(秩)相关rank sum test秩和检验,ranked data等级资料rate率ratio比raw data原始资料regression analysis回归分析regression coefficient回归系数regression SS回归平方和relative number相对数relative risk,RR相对危险度reliability可靠度,信度replacement level更替水平,residual 残差residual standard deviation 剩余标准差,residual sum of square残差平方和ridge trace岭迹ridit analysis Ridit分析risk ratio危险比,风险比rotation旋转r×c table r×c表S sample样本sample size样本量sampling error抽样误差sampling fraction抽样比sampling study抽样研究sampling survey抽样调查,scale测量尺度scatter diagram散点图score test比分检验screening筛检selection bias选择性偏倚semilogarithmic line graph半对数线图sequential design序贯设计sign test符号检验signed rank符号秩significance level显著性水准significance test显著性检验simple correlation简单相关simple regression简单回归,skewness偏度slope斜率spearman rank correlationspearman等级相关spherical distribution球型分布standard deviation,SD标准差,标准离差standard error,SE标准误,标准误差standard normal distribution标准正态分布standardization标准化standardized partial regression coefficient标准化偏回归系数statistic统计量statistical control统计控制,statistical graph统计图statistical inference统计推断statistical significance统计学意义statistical table统计表stem and leaf graph茎叶图step-wise method逐步法strata层(复数)stratification分层stratified cluster sampling分层整群抽样stratified sampling分层抽样structural equation modeling结构方程模型sum ofsquares离差平方和sum ofsquares of deviations from mean 离均差平方和,survey调查survival analysis生存分析survival curve生存曲线survival probability生存概率survival rate生存率survival time生存时间symmetry对称synthetic index综合指数synthetical evaluation综合评价systematic error系统误差,systematic sampling系统抽样T t-distribution t分布tendency of dispersion离散趋势test statistic检验统计量testing of hypotheses假设检验theoretical frequency理论频数time series analysis时间序列分析,t-test t检验two-sided test双侧检验two-stage least squares method二阶段最小二乘法two-stage sampling二阶段抽样two-step cluster两步聚类法two-tailed probability双尾概率two-tailed test双侧检验two-way ANOVA两因素方差分析two-way table双向表type I error I类错误type II error II类错误, unbiased estimate无偏估计uniform distribution均匀分布upper limit上限u-test u检验V variable变量variance方差variance component estimation方差分量估计varimax orthogonal rotation方差最大化正交旋转, weight权重weighted linear regressionmethod加权直线回归weighting method加权法Z zero correlation零相关z-transformation标准正态(z)变换,各种情形下最常用统计检验方法索引1 单变量连续但样本t检验有序多分类单样本秩和检验无序多分类单样本x2检验二分类二项分布确切概率法2 因变量:连续变量单个自变量:连续相关分析,回归分析有序多分类单因素方差分析,结果解释时利用有序信息无序多分类单因素方差分析二分类两样本检验多个自变量:连续变量为主线形回归模型分类变量为主方差分析模型,和回归模型实际上等价3 因变量:有序分类变量单个自变量:连续有序分类的Logistic回归有序多分类秩相关分析、CMH x2无序多分类多样本秩和检验(H检验)二分类两样本秩和检验(W检验)多个自变量:连续变量为主有序分类的判别分析,有序分类的Logistic回归分类变量为主有序分类的Logistic回归4 因变量:无序分类变量单个自变量:连续无序分类的Logistic回归有序多分类可将自因变量交换后分析无序多分类x2检验,深入分析可用对数线性模型二分类x2检验多个自变量:连续变量为主判别分析、无序分类的Logistic回归分类变量为主无序分类的Logistic回归5 因变量:二分类变量单个自变量:连续二分类Logistic回归有序多分类可将自/因变量交换后分析无序多分类x2检验,二分类的Logistic回归二分类四格表x2检验,确切概率法多个自变量:连续变量为主判别分析、二分类Logistic回归、两法结果实际等价分类变量为主二分类Logistic回归6 多元分析方法考察的特征需要由多个因素量来表示,同时研究多个自变量对他们的影响:多元方差分析模型、多元回归模型。
spss菜单中文解释
打开 Open Database 打开数据库
重复 Cut
工具条 Fonts
交互式的 Bar
文件信息 Define Sets
剪切
字体 Grid Lines
插入样品 Go to Case
计数 Recode
条形图
定义变量集 Use Sets
Data Capture Copy
General Line Linear Model 一般线性模 型 Correlate 线图 Area
值标签
样品排序 Transpose
相关 Regression
面积图 Pie
运行脚本 Menu Editor
菜 单 项 (
保存 Save As 菜 单 ) 另存为
行列转置 Merge Files
求样品的秩 Automatic Recode 自动编码 Create Time Series 创建时间序 列 Replace Missing Values 替换缺失值
统计
File 菜单 文件 New 新文件 Open 编辑 Undo 撤销 Redo 视图 Status Bar 状态条 Toolbars Edit View
件的
Data 数据
菜单
菜单
Analyze 分析 Reports Graphs 统计图 Gallery 图库 Interactive Utilities 自定义 Variables 变量 File Info
获取数据 Read Text Data 读取文本数 据 Save
复制 Paste
格线
定位样品
再编码 Categorize Variables 将变量类别 化 Rank Cases
使用变量集 Run Script
spss各模块菜单含义

Absolute deviationAbsolute numberAbsolute residualsAcceleration arrayAcceleration in an arbitrary direction Acceleration normalAcceleration space dimension Acceleration tangentialAcceleration vectorAcceptable hypothesisAccumulationAccuracyAcrossActual frequencyAdaptive estimatorAdditionAddition theoremAdditivityAdjusted rateAdjusted valueAdmissible errorAggregationAlternative hypothesisAmong groupsAmountsAnalysis of correlationAnalysis of covarianceAnalysis of regressionAnalysis of time seriesAnalysis of varianceAngular transformationANOVA (analysis of variance)ANOVA ModelsArcingArcsine transformationArea under the curveAREGARIMAArithmetic grid paperArithmetic meanArrhenius relationAssessing fitAssociative lawsAsymmetric distributionAsymptotic biasAsymptotic efficiencyAsymptotic varianceAttributable riskAttribute dataAttributionAutocorrelationAutocorrelation of residualsAverageAverage confidence interval length Average growth rateBar chartBar graphBase periodBayes' theoremBell-shaped curveBernoulli distributionBest-trim estimatorBiasBinary logistic regressionBinomial distributionBisquareBivariate CorrelateBivariate normal distributionBivariate normal populationBiweight intervalBiweight M-estimatorBlockBMDP(Biomedical computer programs) BoxplotsBreakdown boundCanonical correlationCaptionCaptionCase-control studyCategorical variableCatenaryCauchy distributionCause-and-effect relationshipCellCellCensoringCenter of symmetryCentering and scalingCentral tendencyCentral valueCHAID -χ2 Automatic Interaction Detector ChanceChance errorChance variableCharacteristic equationCharacteristic rootCharacteristic vectorChebshev criterion of fitChernoff facesChi-square testCholeskey decompositionCircle chartClass intervalClass mid-valueClass upper limitClassified variableCluster analysisCluster samplingCodeCoded dataCodingCoefficient of contingencyCoefficient of determinationCoefficient of multiple correlation Coefficient of partial correlation Coefficient of production-moment correlation Coefficient of rank correlationCoefficient of regressionCoefficient of skewnessCoefficient of variationCohort studyColumnColumn effectColumn factorCombination poolCombinative tableCommon factorCommon regression coefficientCommon valueCommon varianceCommon variationCommunality varianceComparabilityComparison of bathesComparison valueCompartment modelCompassionComplement of an eventComplete associationComplete dissociationComplete statisticsCompletely randomized designComposite eventComposite eventsConcavityConditional expectationConditional likelihoodConditional probabilityConditionally linearConfidence intervalConfidence limitConfidence lower limitConfidence upper limitConfirmatory Factor Analysis Confirmatory researchConfounding factorConjointConsistencyConsistency checkConsistent asymptotically normal estimate Consistent estimateConstrained nonlinear regression ConstraintContaminated distributionContaminated GausssianContaminated normal distribution ContaminationContamination modelContingency tableContourContribution rateControlControlled experimentsConventional depthConvolutionCorrected factorCorrected meanCorrection coefficientCorrectnessCorrelation coefficientCorrelation indexCorrespondenceCountingCountsCovarianceCovariantCovariateCox RegressionCriteria for fittingCriteria of least squaresCritical ratioCritical regionCritical valueCross-over designCross-section analysisCross-section surveyCrosstabsCross-tabulation tableCube rootCumulative distribution function Cumulative probabilityCurvatureCurvatureCurve fitCurve fittingCurvilinear regression Curvilinear relationCut-and-try methodCycleCyclistD testData acquisitionData bankData capacityData deficienciesData handlingData manipulationData processingData reductionData setData sourcesData transformationData validityData-inData-outDead timeDegree of freedomDegree of precisionDegree of reliability DegressionDenominatorDensity functionDensity of data points Dependent variableDependent variableDerivative matrixDerivative-free methodsDesignDeterminacyDeterminantDeterminantDeviationDeviation from averageDiagnostic plotDichotomies CountedDichotomous variableDifferential equationDirect standardizationDiscrete variableDISCRIMINANTDiscriminant analysisDiscriminant coefficient Discriminant functionDispersionDisproportionalDisproportionate sub-class numbers Distribution freeDistribution shapeDistribution-free method Distributive lawsDisturbanceDose response curveDouble blind methodDouble blind trialDouble exponential distribution Double logarithmicDownDownward rankDual-space plotDUDDuncan's new multiple range method EffectEigenvalueEigenvectorEllipseEmpirical distributionEmpirical probabilityEnumeration dataEqual sun-class numberEqually likelyEquivarianceError of estimateError type IError type IIEstimandEstimated error mean squares Estimated error sum of squares Euclidean distanceEventEventExceptional data point Expectation planeExpectation surfaceExpected valuesExperimentExperimental sampling Experimental unitExplanatory variable Exploratory data analysis Explore SummarizeExponential curveExponential growth EXSMOOTHExtended fitExtra parameterExtrapolationExtreme observationExtremesF distributionF testFactorFactor analysisFactor AnalysisFactor scoreFactorialFactorial designFalse negativeFalse negative errorFamily of distributionsFamily of estimatorsFanningFatality rateField investigationField surveyFinite populationFinite-sampleFirst derivativeFirst principal componentFirst quartileFisher informationFitted valueFitting a curveFixed baseFixed FactorsFluctuationFootnoteForecastFour fold tableFourthFraction blowFractional errorFrequencyFrequency polygonFrontier pointFunction relationshipGamma distributionGauss incrementGaussian distributionGauss-Newton incrementGeneral censusGENLOG (Generalized liner models) Geometric meanGini's mean differenceGLM (General liner models) Goodness of fitGradient of determinantGraeco-Latin squareGrand meanGross errorsGross-error sensitivityGroup averagesGrouped dataGuessed meanHalf-lifeHampel M-estimators HappenstanceHarmonic meanHazard functionHazard rateHeadingHeavy-tailed distribution Hessian arrayHeterogeneityHeterogeneity of varianceHierarchical classification Hierarchical clustering method High-leverage point HILOGLINEARHingeHistogramHistorical cohort studyHolesHOMALSHomogeneity of variance Homogeneity testHuber M-estimatorsHyperbolaHypothesis testing Hypothetical universe Impossible event IndependenceIndependent variableIndexIndirect standardization IndividualInertiaInference bandInfinite populationInfinitely greatInfinitely smallInfluence curveInformation capacityInitial conditionInitial estimateInitial levelInteractionInteraction termsInterceptInterpolationInterquartile rangeInterval estimationIntervals of equal probability Intrinsic curvatureInvarianceInverse matrixInverse probabilityInverse sine transformation IterationJacobian determinantJoint distribution function Joint probabilityJoint probability distributionK means methodKaplan-MeierKaplan-Merier chartKendall's rank correlationKineticKolmogorov-Smirnove testKruskal and Wallis testKurtosisLack of fitLadder of powersLagLarge sampleLarge sample testLatin squareLatin square designLayerLeakageLeast favorable configuration Least favorable distributionLeast significant differenceLeast square methodLeast-absolute-residuals estimates Least-absolute-residuals fitLeast-absolute-residuals line LegendL-estimatorL-estimator of locationL-estimator of scaleLevelLife expectanceLife tableLife table methodLight-tailed distribution Likelihood functionLikelihood ratioline graphLinear correlationLinear equationLinear programmingLinear regressionLinear RegressionLinear trendLoadingLocation and scale equivariance Location equivarianceLocation invarianceLocation scale familyLog rank testLogarithmic curveLogarithmic normal distribution Logarithmic scaleLogarithmic transformationLogic checkLogistic distributionLogit transformationLOGLINEARLognormal distributionLost functionLow correlationLower limitLowest-attained varianceLSDLurking variableMain effectMajor headingMarginal density function Marginal probabilityMarginal probability distribution Matched dataMatched distributionMatching of distribution Matching of transformation Mathematical expectation Mathematical modelMaximum L-estimatorMaximum likelihood methodMeanMean squares between groupsMean squares within groupMeans (Compare means)MedianMedian effective doseMedian lethal doseMedian polishMedian testMinimal sufficient statistic Minimum distance estimation Minimum effective doseMinimum lethal doseMinimum variance estimator MINITABMinor headingMissing dataModel specificationModeling StatisticsModels for outliersModifying the modelModulus of continuityMorbidityMost favorable configuration Multidimensional Scaling (ASCAL) Multinomial Logistic Regression Multiple comparisonMultiple correlationMultiple covarianceMultiple linear regression Multiple responseMultiple solutionsMultiplication theorem MultiresponseMulti-stage samplingMultivariate T distribution Mutual exclusiveMutual independenceNatural boundaryNatural deadNatural zeroNegative correlationNegative linear correlation Negatively skewedNewman-Keuls methodNK methodNo statistical significance Nominal variableNonconstancy of variability Nonlinear regression Nonparametric statistics Nonparametric test Nonparametric testsNormal deviateNormal distributionNormal equationNormal rangesNormal valueNuisance parameterNull hypothesisNumeratorNumerical variableObjective functionObservation unitObserved valueOne sided testOne-way analysis of variance Oneway ANOVAOpen sequential trialOptrimOptrim efficiencyOrder statisticsOrdered categoriesOrdinal logistic regression Ordinal variableOrthogonal basisOrthogonal design Orthogonality conditions ORTHOPLANOutlier cutoffsOutliersOVERALSOvershootPaired designPaired samplePairwise slopesParabolaParallel testsParameterParametric statistics Parametric testPartial correlationPartial regressionPartial sortingPartials residualsPatternPearson curvesPeelingPercent bar graph PercentagePercentilePercentile curvesPercentile ValuesPeriodicityPermutationP-estimatorPie graphPitman estimatorPivotPlanarPlanar assumptionPLANCARDSPoint estimationPoisson distributionPolishingPolled standard deviationPolled variancePolygonPolynomialPolynomial curvePopulationPopulation attributable riskPositive correlationPositively skewedPosterior distributionPower of a testPrecisionPredicted valuePreliminary analysisPrincipal component analysisPrior distributionPrior probabilityProbabilistic modelprobabilityProbability densityProduct momentProfile traceProportionProportion allocation in stratified random sampling ProportionateProportionate sub-class numbersProspective studyProximitiesPseudo F testPseudo modelPseudosigmaPurposive samplingQR decompositionQuadratic approximationQualitative classificationQualitative methodQuantile-quantile plotQuantitative analysisQuartileQuick ClusterRadix sortRandom allocationRandom blocks designRandom eventRandom Factors RandomizationRangeRank correlationRank sum testRank testRanked dataRateRatioRaw dataRaw residualRayleigh's testRayleigh's ZReciprocalReciprocal transformation RecordingRedescending estimators Reducing dimensionsRe-expressionReference setRegion of acceptance Regression coefficient Regression sum of square Rejection pointRelative dispersion Relative numberReliability Reparametrization ReplicationReport SummariesResidual sum of square ResistanceResistant lineResistant techniqueR-estimator of location R-estimator of scale Retrospective studyRidge traceRidit analysisRotationRoundingRowRow effectsRow factorRXC tableSampleSample regression coefficient Sample sizeSample standard deviation Sampling errorSAS(Statistical analysis system ) ScaleScatter diagramSchematic plotScore testScreeningSEASONSecond derivativeSecond principal componentSEM (Structural equation modeling) Semi-logarithmic graphSemi-logarithmic paperSensitivity curveSeparateSequential analysisSequential data setSequential designSequential methodSequential testSerial testsShort-cut methodSigmoid curveSign functionSign testSigned rankSignificance testSignificant figureSimple cluster samplingSimple correlationSimple random samplingSimple regressionsimple tableSine estimatorSingle-valued estimateSingular matrixSingular ValueSkewed distributionSkewnessSlash distributionSlopeSmirnov testSource of variationSpearman rank correlationSpecific factorSpecific factor varianceSpectraSpherical distributionSpreadSPSS(Statistical package for the social science) Spurious correlationSquare root transformationStabilizing varianceStandard deviationStandard errorStandard error of differenceStandard error of estimateStandard error of rateStandard normal distributionStandardizationStarting valueStatisticStatistical controlStatistical graphStatistical inferenceStatistical tableSteepest descentStem and leaf displayStep factorStepwise regressionStorageStrataStratified samplingStratified samplingStrengthStringencyStructural relationshipStudentized residualSub-class numbersSubdividingSufficient statisticSum of productsSum of squaresSum of squares about regressionSum of squares between groupsSum of squares of partial regressionSummarySure eventSurveySurvivalSurvival rateSuspended root gramSymmetrySystematic errorSystematic samplingTagsTail areaTail lengthTail weightTangent lineTarget distributionTaylor seriesTendency of dispersionTesting of hypothesesTheoretical frequencyTime seriesTitleTolerance intervalTolerance lower limitTolerance upper limitTorsionTotal sum of squareTotal variationTransformationTreatmentTrendTrend of percentageTrialTrial and error methodTuning constantTwo sided testTwo-stage least squaresTwo-stage samplingTwo-tailed testTwo-way analysis of varianceTwo-way tableType I errorType II errorUMVUUnbiased estimateUnconstrained nonlinear regressionUnequal subclass numberUngrouped dataUniform coordinateUniform distributionUniformly minimum variance unbiased estimate UnitUnordered categoriesUpper limitUpward rankVague conceptValidityVARCOMP (Variance component estimation) VariabilityVariableVarianceVariationVarimax orthogonal rotationVolume of distributionW testWeibull distributionWeightWeighted Chi-square testWeighted linear regression method Weighted meanWeighted mean squareWeighted sum of squareWeighting coefficientWeighting methodW-estimationW-estimation of locationWidthWilcoxon paired testWild pointWild valueWinsorized meanWithdrawWLSYouden's indexZ testZero correlationZ-transformationPCT OF CASEPCT OF RESPONSEMODE绝对离差绝对数绝对残差加速度立体阵任意方向上的加速度法向加速度加速度空间的维数切向加速度加速度向量可接受假设累积准确度报表中列控制变量 COLUMN实际频数自适应估计量相加加法定理可加性调整率校正值容许误差聚集性备择假设组间总量相关分析协方差分析回归分析时间序列分析方差分析角转换方差分析方差分析模型弧/弧旋反正弦变换曲线面积评估从一个时间点到下一个时间点回归相关时的误差季节和非季节性单变量模型的极大似然估计算术格纸算术平均数艾恩尼斯关系拟合的评估结合律非对称分布渐近偏倚渐近效率渐近方差归因危险度属性资料属性自相关残差的自相关平均数平均置信区间长度平均增长率条形图条形图基期Bayes定理钟形曲线伯努力分布最好切尾估计量偏性二元逻辑斯蒂回归二项分布双平方二变量相关双变量正态分布双变量正态总体双权区间双权M估计量区组/配伍组BMDP统计软件包箱线图/箱尾图崩溃界/崩溃点典型相关纵标目说明病例对照研究分类变量悬链线柯西分布因果关系单元表单元终检对称中心中心化和定标集中趋势中心值卡方自动交互检测机遇随机误差随机变量特征方程特征根特征向量拟合的切比雪夫准则切尔诺夫脸谱图卡方检验/χ2检验乔洛斯基分解圆图组距组中值组上限分类变量聚类分析整群抽样代码编码数据编码列联系数决定系数多重相关系数偏相关系数积差相关系数等级相关系数回归系数偏度系数变异系数队列研究列列效应列因素合并组合表共性因子公共回归系数共同值公共方差公共变异共性方差可比性批比较比较值分部模型伸缩补事件完全正相关完全不相关完备统计量完全随机化设计联合事件复合事件凹性条件期望条件似然条件概率依条件线性置信区间置信限置信下限置信上限验证性因子分析证实性实验研究混杂因素联合分析相合性一致性检验相合渐近正态估计相合估计受约束非线性回归约束污染分布污染高斯分布污染正态分布污染污染模型列联表边界线贡献率对照对照实验常规深度卷积校正因子校正均值校正系数正确性相关系数相关指数对应计数计数/频数协方差共变协变量 必须为连续型数值变量Cox回归拟合准则最小二乘准则临界比拒绝域临界值交叉设计横断面分析横断面调查交叉表复合表立方根分布函数累计概率曲率/弯曲曲率曲线拟和曲线拟合曲线回归曲线关系尝试法周期周期性D检验资料收集数据库数据容量数据缺乏数据处理数据处理数据处理数据缩减数据集数据来源数据变换数据有效性数据输入数据输出停滞期自由度精密度可靠性程度递减分母密度函数数据点的密度应变量/依变量/因变量因变量深度导数矩阵无导数方法设计确定性行列式决定因素离差离均差诊断图多项式二分法二分变量微分方程直接标准化法离散型变量判断判别分析判别系数判别值散布/分散度不成比例的不成比例次级组含量分布无关性/免分布分布形状任意分布法分配律随机扰动项剂量反应曲线双盲法双盲试验双指数分布双对数报表中行控制变量 ROW 降秩对偶空间图无导数方法新复极差法/Duncan新法实验效应特征值特征向量椭圆经验分布经验概率单位计数资料相等次级组含量等可能同变性估计误差第一类错误第二类错误被估量估计误差均方估计误差平方和欧式距离事件事件异常数据点期望平面期望曲面期望值实验试验抽样试验单位说明变量探索性数据分析探索-摘要指数曲线指数式增长指数平滑方法扩充拟合附加参数外推法末端观测值极端值/极值F分布F检验因素/因子因子分析因子分析因子得分阶乘析因试验设计假阴性假阴性错误分布族估计量族扇面病死率现场调查现场调查有限总体有限样本一阶导数第一四分位数费雪信息量拟合值曲线拟合定基固定因素变量 必须为分类变量随机起伏表下注预测四格表四分点左侧比率相对误差频率频数多边图界限点泛函关系伽玛分布高斯增量高斯分布/正态分布高斯-牛顿增量全面普查广义线性模型几何平均数基尼均差一般线性模型拟和优度/配合度行列式的梯度希腊拉丁方总均值重大错误大错敏感度分组平均分组资料假定平均数半衰期汉佩尔M估计量偶然事件调和均数风险均数风险率标目重尾分布海森立体阵不同质方差不齐组内分组系统聚类法高杠杆率点多维列联表的层次对数线性模型折叶点直方图历史性队列研究空洞多重响应分析方差齐性齐性检验休伯M估计量双曲线假设检验假设总体不可能事件独立性自变量指标/指数间接标准化法个体特征根推断带无限总体无穷大无穷小影响曲线信息容量初始条件初始估计值最初水平交互作用交互作用项截距内插法四分位距区间估计等概率区间固有曲率不变性逆矩阵逆概率反正弦变换迭代雅可比行列式分布函数联合概率联合概率分布逐步聚类法评估事件的时间长度Kaplan-Merier图Kendall等级相关动力学柯尔莫哥洛夫-斯米尔诺夫检验Kruskal及Wallis检验/多样本的秩和检验/H检验峰度失拟幂阶梯滞后大样本大样本检验拉丁方拉丁方设计表层泄漏最不利构形最不利分布最小显著差法最小二乘法最小绝对残差估计最小绝对残差拟合最小绝对残差线图例L估计量位置L估计量尺度L估计量水平预期期望寿命寿命表生命表法轻尾分布似然函数似然比线图直线相关线性方程线性规划直线回归线性回归线性趋势载荷位置尺度同变性位置同变性位置不变性位置尺度族时序检验对数曲线对数正态分布对数尺度对数变换逻辑检查逻辑斯特分布Logit转换多维列联表通用模型对数正态分布损失函数低度相关下限最小可达方差最小显著差法的简称潜在变量主效应主辞标目边缘密度函数边缘概率边缘概率分布配对资料匹配过分布分布的匹配变换的匹配数学期望数学模型极大极小L估计量最大似然法均数组间均方组内均方均值-均值比较中位数半数效量半数致死量中位数平滑中位数检验最小充分统计量最小距离估计最小有效量最小致死量最小方差估计量统计软件包宾词标目缺失值模型的确定模型统计离群值模型模型的修正连续性模发病率最有利构形多维尺度/多维标度多项逻辑斯蒂回归多重比较复相关多元协方差多元线性回归多重选项多解乘法定理多元响应多阶段抽样多元T分布互不相容互相独立自然边界自然死亡自然零负相关负线性相关负偏q检验q检验无统计意义名义变量变异的非定常性非线性相关非参数统计非参数检验非参数检验正态离差正态分布正规方程组正常范围正常值多余参数/讨厌参数无效假设分子数值变量目标函数观察单位观察值单侧检验单因素方差分析单因素方差分析开放型序贯设计优切尾优切尾效率顺序统计量有序分类序数逻辑斯蒂回归有序变量正交基正交试验设计正交条件正交设计离群值截断点极端值多组变量的非线性正规相关迭代过度配对设计配对样本成对斜率抛物线平行试验参数参数统计参数检验偏相关偏回归偏排序偏残差模式皮尔逊曲线退层百分条形图百分比百分位数百分位曲线分位值周期性排列P估计量饼图皮特曼估计量枢轴量平坦平面的假设生成试验的计划卡点估计泊松分布平滑合并标准差合并方差多边图多项式多项式曲线总体人群归因危险度正相关正偏后验分布检验效能精密度预测值预备性分析主成分分析先验分布先验概率概率模型概率概率密度乘积矩/协方差截面迹图比/构成比按比例分层随机抽样成比例成比例次级组含量前瞻性调查亲近性近似F检验近似模型伪标准差有目的抽样QR分解二次近似属性分类定性方法分位数-分位数图/Q-Q图定量分析四分位数快速聚类基数排序随机化分组随机区组设计随机事件随机因素变量 必须为分类变量随机化极差/全距等级相关秩和检验秩检验等级资料比率比例原始资料原始残差雷氏检验雷氏Z值倒数倒数变换记录回降估计量降维重新表达标准组接受域回归系数回归平方和拒绝点相对离散度相对数可靠性重新设置参数重复报告摘要剩余平方和耐抗性耐抗线耐抗技术位置R估计量尺度R估计量回顾性调查岭迹Ridit分析旋转舍入行行效应行因素RXC表样本样本回归系数样本量样本标准差抽样误差SAS统计软件包尺度/量表散点图示意图/简图计分检验筛检季节分析二阶导数第二主成分结构化方程模型半对数图半对数格纸敏感度曲线报表中表控制变量 SEPARATE 贯序分析顺序数据集贯序设计贯序法贯序检验法系列试验简捷法S形曲线正负号函数符号检验符号秩显著性检验有效数字简单整群抽样简单相关简单随机抽样简单回归简单表正弦估计量单值估计奇异矩阵奇异值偏斜分布偏度斜线分布斜率斯米尔诺夫检验变异来源斯皮尔曼等级相关特殊因子方差频谱球型正态分布展布SPSS统计软件包假性相关平方根变换稳定方差标准差标准误差别的标准误标准估计误差率的标准误标准正态分布标准化起始值统计量统计控制统计图统计推断统计表最速下降法茎叶图步长因子逐步回归存层(复数)分层抽样分层抽样强度严密性结构关系学生化残差/t化残差次级组含量分割充分统计量积和离差平方和回归平方和组间平方和偏回归平方和报表中汇总变量必然事件调查生存分析生存率对称系统误差系统抽样标签尾部面积尾长尾重切线目标分布泰勒级数离散趋势假设检验理论频数时间序列标题容忍区间容忍下限容忍上限扰率总平方和总变异转换处理趋势百分比趋势试验试错法细调常数双向检验二阶最小平方二阶段抽样双侧检验双因素方差分析双向表一类错误/α错误二类错误/β错误方差一致最小无偏估计简称无偏估计无约束非线性回归不等次级组含量不分组资料均匀坐标均匀分布方差一致最小无偏估计单元无序分类上限升秩模糊概念有效性方差元素估计变异性变量方差变异方差最大正交旋转容积W检验威布尔分布权数加权卡方检验/Cochran检验加权直线回归加权平均数加权平均方差加权平方和权重系数加权法W估计量位置W估计量宽度威斯康星配对法/配对符号秩和检验野点/狂点野值/狂值缩尾均值失访加权变量尤登指数Z检验零相关Z变换复选次数占个案数的比例复选次数占总次数的比例众数。
SPSS-03-主要窗口与菜单-精品文档

例:请将例3-7.sav中用三条记录来表示三科成绩 的方式改变为用一条记录来表示。
Spss-cyu-zxc
Identifier Variable(s):指定被重复测量个体的 ID变量。
Index Variable(s):指定用于区分测量次数的 索引(Index)变量。
二级对话框元素介绍
(1)单选框
(2)复选框
(3)下拉列表框
(4)文本框
Spss-cyu-zxc
三 对话框常用操作技巧
【同时选入多个变量】
按住Ctrl键时选择变量,可选中不连续 的多个变量。 按住Shift键,可选中多个连续的变量。
用鼠标拖动的方式也可选择连续的变量。
【在操作对话框的同时浏览数据】
在结果窗口调用Analyze菜单命令,这 样数据表就不会被遮挡。
Spss-cyu-zxc
【Match cases on key variables in sorted file】
▶Both files provide cases:纳入两个
数据文件所有的记录。
▶External file is keyed table:以当前 数据库的记录为主纳入外部文件的变量。 ▶Working data File is keyed table: 以外部数据库的记录为主纳入当前文件 的变量。
建立新变量以标示记录来源
课堂练习:请将例3-8-3.sav文件中的记
录和例3-8-4.sav中的记录进行合并。
Spss-cyu-zxc
添加个案对话框
Spss-cyu-zxc
不匹配变量
Spss-cyu-zxc
Add Variables:合并变量
SPSS的主要菜单与基础统计
SPSS的主要菜单与基础统计1. 简介SPSS(Statistical Package for Social Sciences)是一款用于统计分析和数据管理的软件。
它提供了一系列的统计工具和功能,方便用户进行数据分析、建模和可视化等操作。
本文将介绍SPSS的主要菜单和一些基础统计方法。
2. 主要菜单SPSS的主要菜单位于顶部菜单栏,包括文件(File)、编辑(Edit)、数据(Data)、转换(Transform)、分析(Analyze)、图表(Graphs)、窗口(Windows)和帮助(Help)等菜单。
2.1 文件(File)菜单在文件(File)菜单中,用户可以新建、打开或保存SPSS数据文件。
此外,还可以对数据文件进行导入、导出和打印等操作。
2.2 编辑(Edit)菜单编辑(Edit)菜单提供了一系列编辑数据的选项。
用户可以在此菜单中进行数据的复制、粘贴、删除和查找等操作。
2.3 数据(Data)菜单数据(Data)菜单提供了对数据进行预处理和数据管理的功能。
用户可以在此菜单中对数据进行排序、逻辑运算和缺失值处理等操作。
2.4 转换(Transform)菜单转换(Transform)菜单包含了一些数据转换和重构的功能。
用户可以在此菜单中进行数据的合并、拆分和重编码等操作。
2.5 分析(Analyze)菜单分析(Analyze)菜单是SPSS最主要的功能菜单之一,包含了各种统计分析方法和模型。
用户可以在此菜单中进行描述统计、方差分析、回归分析等各类统计方法。
2.6 图表(Graphs)菜单图表(Graphs)菜单提供了多种可视化图表的绘制功能。
用户可以在此菜单中绘制柱状图、折线图、散点图等各种统计图表。
2.7 窗口(Windows)菜单窗口(Windows)菜单用于管理SPSS界面的窗口和视图。
用户可以在此菜单中打开、关闭或排列各个窗口。
2.8 帮助(Help)菜单帮助(Help)菜单提供了SPSS的帮助文档和在线资源的访问。
Spss菜单解释

SpssData菜单Transform菜单Accuracy 精确度,actual frequency 实际频数,adjusted value 校正值,alternative hypothesis 备选假设,analysis of convariance 协方差分析,analysis of variance, ANOV A 方差分析,arithmetic mean 算数均数,asymmetric distribution 非对称分布,autocorrelation 自相关,censored data 截尾数据,censoring 删失失访终检,central limit theorem 中心极限定理,central tendency 集中趋势,chance error 随机误差,class mid-value 组中值,cluster analysis 聚类分析,cluster sampling 整群抽样,coding 编码,coefficient of contingency 列联系数,coefficient of correlation 相关系数,bar chart 条图,bayes theorem 贝叶斯定理,bias 偏性,binomial distribution 二项分布,bivariate normal distribution 双变量正态分布,block 区组,box plot 箱图,canonical correlation 典型相关,case-control study 病例一一对照研究,categorical variable 分类变量,cell 单元,coefficient of determination 决定系数,coefficient ofpartial correlation 偏相关系数,coefficient of product-moment correlation 积差相关系数,coefficient of rank correlation 等级相关系数,coefficient of regression 回归系数,coefficient of variation 变异系数,coefficient of skewness 偏度系数,cohort study 队列研究,communality variance 公共方差,comparability 可比性,complete association 完全相关,complete random design 完全随机设计,degree of freedom 自由度,conditional likelihood 条件似然,conditional probability 条件概率,confidence interval CI 可信(置信)区间,confidence limit CL 可信(置信)限,confirmatory factor analysis 验证性因子分析,confirmatory research 验证性研究,degree of reliability 可靠度,density function 密度函数,dependent variable 因变量,deviation 离差,discrete variable 离散变量,discriminant analysis 判别分析,conjoint analysis 联合分析,consistency test 一致性检验,constraint 约束,contingency table 列联表,contribution rate 贡献率,control 对照控制,controlled experiments 对照实验,correction 校正,correction for continuity 连续性校正,correlation 相关,correlation analysis 相关分析,correlation coefficient 相关系数,distribution 分布,distribution-free method 任意分布方法分布自由方法,dose response curve 剂量反应曲线,dummy variable 哑变量虚拟变量,eigenvalue 特征值特征根,eigenvector 特征向量,equivariance 等方差,error 误差,error of estimate 估计误差,estimated value 估计值,correspondence analysis 对应分析,counts 计数频数,covariance 协方差,Cox regression Cox回归,criteria for fitting 拟合准则,critical value 临界值,cross-over design 交叉设计,cross-section analysis 横断面分析,eigenvalue特征值,特征根eigenvector 特征向量equivariance等方差error误差error of estimate估计误差estimated value估计值euclidean distance欧氏距离event事件expected values期望值design of experiment实验设计exploratory data analysis探索性数据分析exponential curve指数曲线extrapolation外推法extremes极端值,极值,forecast预测fourfold table四格表frequency频数frequency distribution 频数分布general linear model, GLM一般线性模型generalized linear model广义线性模型geometric mean几何均数goodness of fit拟合优度,half-life半衰期harmonic mean调和均数hazard function风险函数,hazard rate风险率heterogeneity异质heterogeneity of variance方差不齐heteroscedasticity 方差不齐hierarchical clustering method分层聚类法histogram直方图homogeneity同质,齐性,homogeneity of variance同方差性homogeneity test齐性检验homoscedasticity方差齐性hypothesis test假设检验,independence独立性independent variable自变量initial mean vectors初始凝聚点interaction交互效应intercept截距interpolation 插值inter-quartile range四分位数间距,interval estimation区间估计inverse matrix逆矩阵iteration迭代,K-means method K-均值聚类法Kaplan-Merier curve Kaplan-Merier 曲线kendall srank correlationKendall等级相关Kolmogorov-Smirnov test K-S检验Kruskal and Wallis test K-W检验,H检验kurtosis峰度L lack offit拟合劣度,失拟Latin square design拉丁方设计least square method最小二乘法legend图例level水平level of significance统计意义水平,life table寿命表likelihood function似然函数likelihood ratio test似然比检验line graph线图linear线性linear correlation直线相关linear equation线性方程linear programming线性规划linear regression线性回归,linear trend线性趋势loading载荷log-rank test时序检验logarithmic scale对数尺度logistic regression logistic回归logit transformation logit转换loglinear model对数线性模型M main effect主效应matched data配对资料matching匹配maximum likelihood method最大似然法maximum likelihood ratio test似然比检验,mean均值mean square,MS均方measurement bias测量性偏倚median中位数median effective dose半数效量median lethal dose半数致死量median survival time中位生存时间median test中位数检验M-estimators M估计量minimumlethal dose最小致死量missing value缺失值multidimensional scaling analysis, MDS多维尺度分析,multinomial distribution多项分布multiple comparison多重比较multiple correlation复相关,多重相关multiple covariance多元协方差multiple linear regression多重线性回归multiple response多重应答,多选题multistage sampling多级抽样multivariate regression多元回归multivariate statistical analysis多变量统计分析,多元统计分析,negative correlation负相关no statistical significance无统计学意义nominal variable名义变量nonlinear regression非线性回归nonparametric statistics非参数统计nonparametric test非参数检验normal distribution正态分布null hypothesis原假设,无效假设numerical variable数值变量O observation unit 观察单位observed value观测值odds ratio,OR优势比,比数比,one-sided test单侧检验one-way ANOV A单因素方差分析optimum allocation最优分配order statistics顺序统计量ordered categories有序分类orthogonal experimental design正交试验设计outlier异常值,离群值overall survey普查P paired design配对设计paired(matched)t-test配对t检验parameter参数,parametric statistics参数统计parametric test参数检验partial correlation 偏相关partial likelihood偏似然函数partial regression coefficient偏回归系数path analysis路径分析percent bar graph百分条图percentage百分比,百分数percentile百分位数,位点periodicity周期性pie graph饼图,圆图,placebo安慰剂point estimation点估计Poisson distribution Poisson分布polynomial curve多项式曲线population总体population mean 总体均值positive correlation正相关posterior distribution后验分布power ofa test检验效能power ofstatistics检验效能precision精度principal component analysis主成分分析prior distribution先验分布product moment乘积矩,协方差,product-limit method乘积极限法proportion构成比prospective study前瞻性研究P-value P值Q qualitative evaluation定性评价qualitative method定性方法quantile-quantile plot Q-Q图quantitative analysis定量分析quantitative evaluation定量评价quartile四分位数questionnaire问卷quick cluster 快速聚类,random event随机事件random sampling随机抽样randomization随机化randomized allocation随机分配randomized block design随机区组设计randomized control trial随机对照试验randomized double blind control trial随机双盲对照试验range极差,全距rank correlation等级(秩)相关rank sum test秩和检验,ranked data等级资料rate率ratio比raw data原始资料regression analysis回归分析regression coefficient 回归系数regression SS回归平方和relative number相对数relative risk,RR相对危险度reliability可靠度,信度replacement level更替水平,residual 残差residual standard deviation 剩余标准差,residual sum of square残差平方和ridge trace岭迹ridit analysis Ridit 分析risk ratio危险比,风险比rotation旋转r×c table r×c表S sample样本sample size 样本量sampling error抽样误差sampling fraction抽样比sampling study抽样研究sampling survey抽样调查,scale测量尺度scatter diagram散点图score test比分检验screening筛检selection bias选择性偏倚semilogarithmic line graph半对数线图sequential design序贯设计sign test符号检验signed rank符号秩significance level显著性水准significance test显著性检验simple correlation简单相关simple regression简单回归,skewness偏度slope斜率spearman rank correlationspearman等级相关spherical distribution球型分布standard deviation,SD标准差,标准离差standard error,SE标准误,标准误差standard normal distribution标准正态分布standardization标准化standardized partial regression coefficient标准化偏回归系数statistic统计量statistical control统计控制,statistical graph统计图statistical inference统计推断statistical significance统计学意义statistical table统计表stem and leaf graph茎叶图step-wise method逐步法strata层(复数)stratification分层stratified cluster sampling分层整群抽样stratified sampling分层抽样structural equation modeling结构方程模型sum ofsquares离差平方和sum ofsquares of deviations from mean 离均差平方和,survey调查survival analysis生存分析survival curve生存曲线survival probability生存概率survival rate生存率survival time生存时间symmetry对称synthetic index综合指数synthetical evaluation综合评价systematic error 系统误差,systematic sampling系统抽样T t-distribution t分布tendency of dispersion 离散趋势test statistic检验统计量testing of hypotheses假设检验theoretical frequency理论频数time series analysis时间序列分析,t-test t检验two-sided test双侧检验two-stage least squares method二阶段最小二乘法two-stage sampling二阶段抽样two-step cluster 两步聚类法two-tailed probability双尾概率two-tailed test双侧检验two-way ANOV A两因素方差分析two-way table双向表type I error I类错误type II error II类错误,unbiased estimate无偏估计uniform distribution均匀分布upper limit上限u-test u检验V variable变量variance方差variance component estimation方差分量估计varimax orthogonal rotation方差最大化正交旋转,weight权重weighted linear regressionmethod 加权直线回归weighting method加权法Z zero correlation零相关z-transformation标准正态(z)变换,各种情形下最常用统计检验方法索引1 单变量连续但样本t检验有序多分类单样本秩和检验无序多分类单样本x2检验二分类二项分布确切概率法2 因变量:连续变量单个自变量:连续相关分析,回归分析有序多分类单因素方差分析,结果解释时利用有序信息无序多分类单因素方差分析二分类两样本 检验多个自变量:连续变量为主线形回归模型分类变量为主方差分析模型,和回归模型实际上等价3 因变量:有序分类变量单个自变量:连续有序分类的Logistic回归有序多分类秩相关分析、CMH x2无序多分类多样本秩和检验(H检验)二分类两样本秩和检验(W检验)多个自变量:连续变量为主有序分类的判别分析,有序分类的Logistic回归分类变量为主有序分类的Logistic回归4 因变量:无序分类变量单个自变量:连续无序分类的Logistic回归有序多分类可将自因变量交换后分析无序多分类x2检验,深入分析可用对数线性模型二分类x2检验多个自变量:连续变量为主判别分析、无序分类的Logistic回归分类变量为主无序分类的Logistic回归5 因变量:二分类变量单个自变量:连续二分类Logistic回归有序多分类可将自/因变量交换后分析无序多分类x2检验,二分类的Logistic回归二分类四格表x2检验,确切概率法多个自变量:连续变量为主判别分析、二分类Logistic回归、两法结果实际等价分类变量为主二分类Logistic回归6 多元分析方法考察的特征需要由多个因素量来表示,同时研究多个自变量对他们的影响:多元方差分析模型、多元回归模型。
spss软件的菜单及所有单词中英文翻译大全
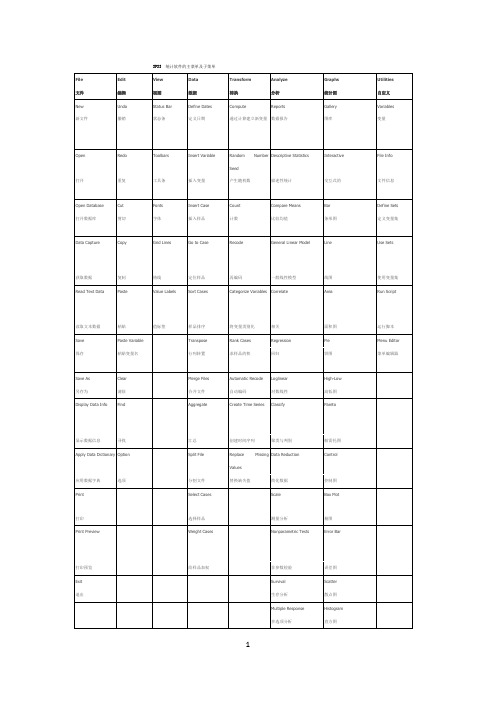
SPSS 统计软件的主菜单及子菜单spss软件的中英文翻译Absolute deviation, 绝对离差Absolute number, 绝对数Absolute residuals, 绝对残差Acceleration array, 加速度立体阵Acceleration in an arbitrary direction, 任意方向上的加速度Acceleration normal, 法向加速度Acceleration space dimension, 加速度空间的维数Acceleration tangential, 切向加速度Acceleration vector, 加速度向量Acceptable hypothesis, 可接受假设Accumulation, 累积Accuracy, 准确度Actual frequency, 实际频数Adaptive estimator, 自适应估计量Addition, 相加Addition theorem, 加法定理Additivity, 可加性Adjusted rate, 调整率Adjusted value, 校正值Admissible error, 容许误差Aggregation, 聚集性Alternative hypothesis, 备择假设Among groups, 组间Amounts, 总量Analysis of correlation, 相关分析Analysis of covariance, 协方差分析Analysis of regression, 回归分析Analysis of time series, 时间序列分析Analysis of variance, 方差分析Angular transformation, 角转换ANOVA (analysis of variance), 方差分析ANOVA Models, 方差分析模型Arcing, 弧/弧旋Arcsine transformation, 反正弦变换Area under the curve, 曲线面积AREG , 评估从一个时间点到下一个时间点回归相关时的误差ARIMA, 季节和非季节性单变量模型的极大似然估计Arithmetic grid paper, 算术格纸Arithmetic mean, 算术平均数Arrhenius relation, 艾恩尼斯关系Assessing fit, 拟合的评估Associative laws, 结合律Asymmetric distribution, 非对称分布Asymptotic bias, 渐近偏倚Asymptotic efficiency, 渐近效率Asymptotic variance, 渐近方差Attributable risk, 归因危险度Attribute data, 属性资料Attribution, 属性Autocorrelation, 自相关Autocorrelation of residuals, 残差的自相关Average, 平均数Average confidence interval length, 平均置信区间长度Average growth rate, 平均增长率Bar chart, 条形图Bar graph, 条形图Base period, 基期Bayes' theorem , Bayes定理Bell-shaped curve, 钟形曲线Bernoulli distribution, 伯努力分布Best-trim estimator, 最好切尾估计量Bias, 偏性Binary logistic regression, 二元逻辑斯蒂回归Binomial distribution, 二项分布Bisquare, 双平方Bivariate Correlate, 二变量相关Bivariate normal distribution, 双变量正态分布Bivariate normal population, 双变量正态总体Biweight interval, 双权区间Biweight M-estimator, 双权M估计量Block, 区组/配伍组BMDP(Biomedical computer programs), BMDP统计软件包Boxplots, 箱线图/箱尾图Breakdown bound, 崩溃界/崩溃点Canonical correlation, 典型相关Caption, 纵标目Case-control study, 病例对照研究Categorical variable, 分类变量Catenary, 悬链线Cauchy distribution, 柯西分布Cause-and-effect relationship, 因果关系Cell, 单元Censoring, 终检Center of symmetry, 对称中心Centering and scaling, 中心化和定标Central tendency, 集中趋势Central value, 中心值CHAID -χ2 Automatic Interaction Detector, 卡方自动交互检测Chance, 机遇Chance error, 随机误差Chance variable, 随机变量Characteristic equation, 特征方程Characteristic root, 特征根Characteristic vector, 特征向量Chebshev criterion of fit, 拟合的切比雪夫准则Chernoff faces, 切尔诺夫脸谱图Chi-square test, 卡方检验/χ2检验Choleskey decomposition, 乔洛斯基分解Circle chart, 圆图Class interval, 组距Class mid-value, 组中值Class upper limit, 组上限Classified variable, 分类变量Cluster analysis, 聚类分析Cluster sampling, 整群抽样Code, 代码Coded data, 编码数据Coding, 编码Coefficient of contingency, 列联系数Coefficient of determination, 决定系数Coefficient of multiple correlation, 多重相关系数Coefficient of partial correlation, 偏相关系数Coefficient of production-moment correlation, 积差相关系数Coefficient of rank correlation, 等级相关系数Coefficient of regression, 回归系数Coefficient of skewness, 偏度系数Coefficient of variation, 变异系数Cohort study, 队列研究Column, 列Column effect, 列效应Column factor, 列因素Combination pool, 合并Combinative table, 组合表Common factor, 共性因子Common regression coefficient, 公共回归系数Common value, 共同值Common variance, 公共方差Common variation, 公共变异Communality variance, 共性方差Comparability, 可比性Comparison of bathes, 批比较Comparison value, 比较值Compartment model, 分部模型Compassion, 伸缩Complement of an event, 补事件Complete association, 完全正相关Complete dissociation, 完全不相关Complete statistics, 完备统计量Completely randomized design, 完全随机化设计Composite event, 联合事件Composite events, 复合事件Concavity, 凹性Conditional expectation, 条件期望Conditional likelihood, 条件似然Conditional probability, 条件概率Conditionally linear, 依条件线性Confidence interval, 置信区间Confidence limit, 置信限Confidence lower limit, 置信下限Confidence upper limit, 置信上限Confirmatory Factor Analysis , 验证性因子分析Confirmatory research, 证实性实验研究Confounding factor, 混杂因素Conjoint, 联合分析Consistency, 相合性Consistency check, 一致性检验Consistent asymptotically normal estimate, 相合渐近正态估计Consistent estimate, 相合估计Constrained nonlinear regression, 受约束非线性回归Constraint, 约束Contaminated distribution, 污染分布Contaminated Gausssian, 污染高斯分布Contaminated normal distribution, 污染正态分布Contamination, 污染Contamination model, 污染模型Contingency table, 列联表Contour, 边界线Contribution rate, 贡献率Control, 对照Controlled experiments, 对照实验Conventional depth, 常规深度Convolution, 卷积Corrected factor, 校正因子Corrected mean, 校正均值Correction coefficient, 校正系数Correctness, 正确性Correlation coefficient, 相关系数Correlation index, 相关指数Correspondence, 对应Counting, 计数Counts, 计数/频数Covariance, 协方差Covariant, 共变Cox Regression, Cox回归Criteria for fitting, 拟合准则Criteria of least squares, 最小二乘准则Critical ratio, 临界比Critical region, 拒绝域Critical value, 临界值Cross-over design, 交叉设计Cross-section analysis, 横断面分析Cross-section survey, 横断面调查Crosstabs , 交叉表Cross-tabulation table, 复合表Cube root, 立方根Cumulative distribution function, 分布函数Cumulative probability, 累计概率Curvature, 曲率/弯曲Curvature, 曲率Curve fit , 曲线拟和Curve fitting, 曲线拟合Curvilinear regression, 曲线回归Curvilinear relation, 曲线关系Cut-and-try method, 尝试法Cycle, 周期Cyclist, 周期性D test, D检验Data acquisition, 资料收集Data bank, 数据库Data capacity, 数据容量Data deficiencies, 数据缺乏Data handling, 数据处理Data manipulation, 数据处理Data processing, 数据处理Data reduction, 数据缩减Data set, 数据集Data sources, 数据来源Data transformation, 数据变换Data validity, 数据有效性Data-in, 数据输入Data-out, 数据输出Dead time, 停滞期Degree of freedom, 自由度Degree of precision, 精密度Degree of reliability, 可靠性程度Degression, 递减Density function, 密度函数Density of data points, 数据点的密度Dependent variable, 应变量/依变量/因变量Dependent variable, 因变量Depth, 深度Derivative matrix, 导数矩阵Derivative-free methods, 无导数方法Design, 设计Determinacy, 确定性Determinant, 行列式Determinant, 决定因素Deviation, 离差Deviation from average, 离均差Diagnostic plot, 诊断图Dichotomous variable, 二分变量Differential equation, 微分方程Direct standardization, 直接标准化法Discrete variable, 离散型变量DISCRIMINANT, 判断Discriminant analysis, 判别分析Discriminant coefficient, 判别系数Discriminant function, 判别值Dispersion, 散布/分散度Disproportional, 不成比例的Disproportionate sub-class numbers, 不成比例次级组含量Distribution free, 分布无关性/免分布Distribution shape, 分布形状Distribution-free method, 任意分布法Distributive laws, 分配律Disturbance, 随机扰动项Dose response curve, 剂量反应曲线Double blind method, 双盲法Double blind trial, 双盲试验Double exponential distribution, 双指数分布Double logarithmic, 双对数Downward rank, 降秩Dual-space plot, 对偶空间图DUD, 无导数方法Duncan's new multiple range method, 新复极差法/Duncan新法Effect, 实验效应Eigenvalue, 特征值Eigenvector, 特征向量Ellipse, 椭圆Empirical distribution, 经验分布Empirical probability, 经验概率单位Enumeration data, 计数资料Equal sun-class number, 相等次级组含量Equally likely, 等可能Equivariance, 同变性Error, 误差/错误Error of estimate, 估计误差Error type I, 第一类错误Error type II, 第二类错误Estimand, 被估量Estimated error mean squares, 估计误差均方Estimated error sum of squares, 估计误差平方和Euclidean distance, 欧式距离Event, 事件Event, 事件Exceptional data point, 异常数据点Expectation plane, 期望平面Expectation surface, 期望曲面Expected values, 期望值Experiment, 实验Experimental sampling, 试验抽样Experimental unit, 试验单位Explanatory variable, 说明变量Exploratory data analysis, 探索性数据分析Explore Summarize, 探索-摘要Exponential curve, 指数曲线Exponential growth, 指数式增长EXSMOOTH, 指数平滑方法Extended fit, 扩充拟合Extra parameter, 附加参数Extrapolation, 外推法Extreme observation, 末端观测值Extremes, 极端值/极值F distribution, F分布F test, F检验Factor, 因素/因子Factor analysis, 因子分析Factor Analysis, 因子分析Factor score, 因子得分Factorial, 阶乘Factorial design, 析因试验设计False negative, 假阴性False negative error, 假阴性错误Family of distributions, 分布族Family of estimators, 估计量族Fanning, 扇面Fatality rate, 病死率Field investigation, 现场调查Field survey, 现场调查Finite population, 有限总体Finite-sample, 有限样本First derivative, 一阶导数First principal component, 第一主成分First quartile, 第一四分位数Fisher information, 费雪信息量Fitted value, 拟合值Fitting a curve, 曲线拟合Fixed base, 定基Fluctuation, 随机起伏Forecast, 预测Four fold table, 四格表Fourth, 四分点Fraction blow, 左侧比率Fractional error, 相对误差Frequency, 频率Frequency polygon, 频数多边图Frontier point, 界限点Function relationship, 泛函关系Gamma distribution, 伽玛分布Gauss increment, 高斯增量Gaussian distribution, 高斯分布/正态分布Gauss-Newton increment, 高斯-牛顿增量General census, 全面普查GENLOG (Generalized liner models), 广义线性模型Geometric mean, 几何平均数Gini's mean difference, 基尼均差GLM (General liner models), 通用线性模型Goodness of fit, 拟和优度/配合度Gradient of determinant, 行列式的梯度Graeco-Latin square, 希腊拉丁方Grand mean, 总均值Gross errors, 重大错误Gross-error sensitivity, 大错敏感度Group averages, 分组平均Grouped data, 分组资料Guessed mean, 假定平均数Half-life, 半衰期Hampel M-estimators, 汉佩尔M估计量Happenstance, 偶然事件Harmonic mean, 调和均数Hazard function, 风险均数Hazard rate, 风险率Heading, 标目Heavy-tailed distribution, 重尾分布Hessian array, 海森立体阵Heterogeneity, 不同质Heterogeneity of variance, 方差不齐Hierarchical classification, 组内分组Hierarchical clustering method, 系统聚类法High-leverage point, 高杠杆率点HILOGLINEAR, 多维列联表的层次对数线性模型Hinge, 折叶点Histogram, 直方图Historical cohort study, 历史性队列研究Holes, 空洞HOMALS, 多重响应分析Homogeneity of variance, 方差齐性Homogeneity test, 齐性检验Huber M-estimators, 休伯M估计量Hyperbola, 双曲线Hypothesis testing, 假设检验Hypothetical universe, 假设总体Impossible event, 不可能事件Independence, 独立性Independent variable, 自变量Index, 指标/指数Indirect standardization, 间接标准化法Individual, 个体Inference band, 推断带Infinite population, 无限总体Infinitely great, 无穷大Infinitely small, 无穷小Influence curve, 影响曲线Information capacity, 信息容量Initial condition, 初始条件Initial estimate, 初始估计值Initial level, 最初水平Interaction, 交互作用Interaction terms, 交互作用项Intercept, 截距Interpolation, 内插法Interquartile range, 四分位距Interval estimation, 区间估计Intervals of equal probability, 等概率区间Intrinsic curvature, 固有曲率Invariance, 不变性Inverse matrix, 逆矩阵Inverse probability, 逆概率Inverse sine transformation, 反正弦变换Iteration, 迭代Jacobian determinant, 雅可比行列式Joint distribution function, 分布函数Joint probability, 联合概率Joint probability distribution, 联合概率分布K means method, 逐步聚类法Kaplan-Meier, 评估事件的时间长度Kaplan-Merier chart, Kaplan-Merier图Kendall's rank correlation, Kendall等级相关Kinetic, 动力学Kolmogorov-Smirnove test, 柯尔莫哥洛夫-斯米尔诺夫检验Kruskal and Wallis test, Kruskal及Wallis检验/多样本的秩和检验/H检验Kurtosis, 峰度Lack of fit, 失拟Ladder of powers, 幂阶梯Lag, 滞后Large sample, 大样本Large sample test, 大样本检验Latin square, 拉丁方Latin square design, 拉丁方设计Leakage, 泄漏Least favorable configuration, 最不利构形Least favorable distribution, 最不利分布Least significant difference, 最小显著差法Least square method, 最小二乘法Least-absolute-residuals estimates, 最小绝对残差估计Least-absolute-residuals fit, 最小绝对残差拟合Least-absolute-residuals line, 最小绝对残差线Legend, 图例L-estimator, L估计量L-estimator of location, 位置L估计量L-estimator of scale, 尺度L估计量Level, 水平Life expectance, 预期期望寿命Life table, 寿命表Life table method, 生命表法Light-tailed distribution, 轻尾分布Likelihood function, 似然函数Likelihood ratio, 似然比line graph, 线图Linear correlation, 直线相关Linear equation, 线性方程Linear programming, 线性规划Linear regression, 直线回归Linear Regression, 线性回归Linear trend, 线性趋势Loading, 载荷Location and scale equivariance, 位置尺度同变性Location equivariance, 位置同变性Location invariance, 位置不变性Location scale family, 位置尺度族Log rank test, 时序检验Logarithmic curve, 对数曲线Logarithmic normal distribution, 对数正态分布Logarithmic scale, 对数尺度Logarithmic transformation, 对数变换Logic check, 逻辑检查Logistic distribution, 逻辑斯特分布Logit transformation, Logit转换LOGLINEAR, 多维列联表通用模型Lognormal distribution, 对数正态分布Lost function, 损失函数Low correlation, 低度相关Lower limit, 下限Lowest-attained variance, 最小可达方差LSD, 最小显著差法的简称Lurking variable, 潜在变量Main effect, 主效应Major heading, 主辞标目Marginal density function, 边缘密度函数Marginal probability, 边缘概率Marginal probability distribution, 边缘概率分布Matched data, 配对资料Matched distribution, 匹配过分布Matching of distribution, 分布的匹配Matching of transformation, 变换的匹配Mathematical expectation, 数学期望Mathematical model, 数学模型Maximum L-estimator, 极大极小L 估计量Maximum likelihood method, 最大似然法Mean, 均数Mean squares between groups, 组间均方Mean squares within group, 组内均方Means (Compare means), 均值-均值比较Median, 中位数Median effective dose, 半数效量Median lethal dose, 半数致死量Median polish, 中位数平滑Median test, 中位数检验Minimal sufficient statistic, 最小充分统计量Minimum distance estimation, 最小距离估计Minimum effective dose, 最小有效量Minimum lethal dose, 最小致死量Minimum variance estimator, 最小方差估计量MINITAB, 统计软件包Minor heading, 宾词标目Missing data, 缺失值Model specification, 模型的确定Modeling Statistics , 模型统计Models for outliers, 离群值模型Modifying the model, 模型的修正Modulus of continuity, 连续性模Morbidity, 发病率Most favorable configuration, 最有利构形Multidimensional Scaling (ASCAL), 多维尺度/多维标度Multinomial Logistic Regression , 多项逻辑斯蒂回归Multiple comparison, 多重比较Multiple correlation , 复相关Multiple covariance, 多元协方差Multiple linear regression, 多元线性回归Multiple response , 多重选项Multiple solutions, 多解Multiplication theorem, 乘法定理Multiresponse, 多元响应Multi-stage sampling, 多阶段抽样Multivariate T distribution, 多元T分布Mutual exclusive, 互不相容Mutual independence, 互相独立Natural boundary, 自然边界Natural dead, 自然死亡Natural zero, 自然零Negative correlation, 负相关Negative linear correlation, 负线性相关Negatively skewed, 负偏Newman-Keuls method, q检验NK method, q检验No statistical significance, 无统计意义Nominal variable, 名义变量Nonconstancy of variability, 变异的非定常性Nonlinear regression, 非线性相关Nonparametric statistics, 非参数统计Nonparametric test, 非参数检验Nonparametric tests, 非参数检验Normal deviate, 正态离差Normal distribution, 正态分布Normal equation, 正规方程组Normal ranges, 正常范围Normal value, 正常值Nuisance parameter, 多余参数/讨厌参数Null hypothesis, 无效假设Numerical variable, 数值变量Objective function, 目标函数Observation unit, 观察单位Observed value, 观察值One sided test, 单侧检验One-way analysis of variance, 单因素方差分析Oneway ANOVA , 单因素方差分析Open sequential trial, 开放型序贯设计Optrim, 优切尾Optrim efficiency, 优切尾效率Order statistics, 顺序统计量Ordered categories, 有序分类Ordinal logistic regression , 序数逻辑斯蒂回归Ordinal variable, 有序变量Orthogonal basis, 正交基Orthogonal design, 正交试验设计Orthogonality conditions, 正交条件ORTHOPLAN, 正交设计Outlier cutoffs, 离群值截断点Outliers, 极端值OVERALS , 多组变量的非线性正规相关Overshoot, 迭代过度Paired design, 配对设计Paired sample, 配对样本Pairwise slopes, 成对斜率Parabola, 抛物线Parallel tests, 平行试验Parameter, 参数Parametric statistics, 参数统计Parametric test, 参数检验Partial correlation, 偏相关Partial regression, 偏回归Partial sorting, 偏排序Partials residuals, 偏残差Pattern, 模式Pearson curves, 皮尔逊曲线Peeling, 退层Percent bar graph, 百分条形图Percentage, 百分比Percentile, 百分位数Percentile curves, 百分位曲线Periodicity, 周期性Permutation, 排列P-estimator, P估计量Pie graph, 饼图Pitman estimator, 皮特曼估计量Pivot, 枢轴量Planar, 平坦Planar assumption, 平面的假设PLANCARDS, 生成试验的计划卡Point estimation, 点估计Poisson distribution, 泊松分布Polishing, 平滑Polled standard deviation, 合并标准差Polled variance, 合并方差Polygon, 多边图Polynomial, 多项式Polynomial curve, 多项式曲线Population, 总体Population attributable risk, 人群归因危险度Positive correlation, 正相关Positively skewed, 正偏Posterior distribution, 后验分布Power of a test, 检验效能Precision, 精密度Predicted value, 预测值Preliminary analysis, 预备性分析Principal component analysis, 主成分分析Prior distribution, 先验分布Prior probability, 先验概率Probabilistic model, 概率模型probability, 概率Probability density, 概率密度Product moment, 乘积矩/协方差Profile trace, 截面迹图Proportion, 比/构成比Proportion allocation in stratified random sampling, 按比例分层随机抽样Proportionate, 成比例Proportionate sub-class numbers, 成比例次级组含量Prospective study, 前瞻性调查Proximities, 亲近性Pseudo F test, 近似F检验Pseudo model, 近似模型Pseudosigma, 伪标准差Purposive sampling, 有目的抽样QR decomposition, QR分解Quadratic approximation, 二次近似Qualitative classification, 属性分类Qualitative method, 定性方法Quantile-quantile plot, 分位数-分位数图/Q-Q图Quantitative analysis, 定量分析Quartile, 四分位数Quick Cluster, 快速聚类Radix sort, 基数排序Random allocation, 随机化分组Random blocks design, 随机区组设计Random event, 随机事件Randomization, 随机化Range, 极差/全距Rank correlation, 等级相关Rank sum test, 秩和检验Rank test, 秩检验Ranked data, 等级资料Rate, 比率Ratio, 比例Raw data, 原始资料Raw residual, 原始残差Rayleigh's test, 雷氏检验Rayleigh's Z, 雷氏Z值Reciprocal, 倒数Reciprocal transformation, 倒数变换Recording, 记录Redescending estimators, 回降估计量Reducing dimensions, 降维Re-expression, 重新表达Reference set, 标准组Region of acceptance, 接受域Regression coefficient, 回归系数Regression sum of square, 回归平方和Rejection point, 拒绝点Relative dispersion, 相对离散度Relative number, 相对数Reliability, 可靠性Reparametrization, 重新设置参数Replication, 重复Report Summaries, 报告摘要Residual sum of square, 剩余平方和Resistance, 耐抗性Resistant line, 耐抗线Resistant technique, 耐抗技术R-estimator of location, 位置R估计量R-estimator of scale, 尺度R估计量Retrospective study, 回顾性调查Ridge trace, 岭迹Ridit analysis, Ridit分析Rotation, 旋转Rounding, 舍入Row, 行Row effects, 行效应Row factor, 行因素RXC table, RXC表Sample, 样本Sampleregression coefficient, 样本回归系数Sample size, 样本量Sample standard deviation, 样本标准差Sampling error, 抽样误差SAS(Statistical analysis system ), SAS统计软件包Scale, 尺度/量表Scatter diagram, 散点图Schematic plot, 示意图/简图Score test, 计分检验Screening, 筛检SEASON, 季节分析Second derivative, 二阶导数Second principal component, 第二主成分SEM (Structural equation modeling), 结构化方程模型Semi-logarithmic graph, 半对数图Semi-logarithmic paper, 半对数格纸Sensitivity curve, 敏感度曲线Sequential analysis, 贯序分析Sequential data set, 顺序数据集Sequential design, 贯序设计Sequential method, 贯序法Sequential test, 贯序检验法Serial tests, 系列试验Short-cut method, 简捷法Sigmoid curve, S形曲线Sign function, 正负号函数Sign test, 符号检验Signed rank, 符号秩Significance test, 显著性检验Significant figure, 有效数字Simple cluster sampling, 简单整群抽样Simple correlation, 简单相关Simple random sampling, 简单随机抽样Simple regression, 简单回归simple table, 简单表Sine estimator, 正弦估计量Single-valued estimate, 单值估计Singular matrix, 奇异矩阵Skewed distribution, 偏斜分布Skewness, 偏度Slash distribution, 斜线分布Slope, 斜率Smirnov test, 斯米尔诺夫检验Source of variation, 变异来源Spearman rank correlation, 斯皮尔曼等级相关Specific factor, 特殊因子Specific factor variance, 特殊因子方差Spectra , 频谱Spherical distribution, 球型正态分布Spread, 展布SPSS(Statistical package for the social science), SPSS统计软件包Spurious correlation, 假性相关Square root transformation, 平方根变换Stabilizing variance, 稳定方差Standard deviation, 标准差Standard error, 标准误Standard error of difference, 差别的标准误Standard error of estimate, 标准估计误差Standard error of rate, 率的标准误Standard normal distribution, 标准正态分布Standardization, 标准化Starting value, 起始值Statistic, 统计量Statistical control, 统计控制Statistical graph, 统计图Statistical inference, 统计推断Statistical table, 统计表Steepest descent, 最速下降法Stem and leaf display, 茎叶图Step factor, 步长因子Stepwise regression, 逐步回归Storage, 存Strata, 层(复数)Stratified sampling, 分层抽样Stratified sampling, 分层抽样Strength, 强度Stringency, 严密性Structural relationship, 结构关系Studentized residual, 学生化残差/t化残差Sub-class numbers, 次级组含量Subdividing, 分割Sufficient statistic, 充分统计量Sum of products, 积和Sum of squares, 离差平方和Sum of squares about regression, 回归平方和Sum of squares between groups, 组间平方和Sum of squares of partial regression, 偏回归平方和Sure event, 必然事件Survey, 调查Survival, 生存分析Survival rate, 生存率Suspended root gram, 悬吊根图Symmetry, 对称Systematic error, 系统误差Systematic sampling, 系统抽样Tags, 标签Tail area, 尾部面积Tail length, 尾长Tail weight, 尾重Tangent line, 切线Target distribution, 目标分布Taylor series, 泰勒级数Tendency of dispersion, 离散趋势Testing of hypotheses, 假设检验Theoretical frequency, 理论频数Time series, 时间序列Tolerance interval, 容忍区间Tolerance lower limit, 容忍下限Tolerance upper limit, 容忍上限Torsion, 扰率Total sum of square, 总平方和Total variation, 总变异Transformation, 转换Treatment, 处理Trend, 趋势Trend of percentage, 百分比趋势Trial, 试验Trial and error method, 试错法Tuning constant, 细调常数Two sided test, 双向检验Two-stage least squares, 二阶最小平方Two-stage sampling, 二阶段抽样Two-tailed test, 双侧检验Two-way analysis of variance, 双因素方差分析Two-way table, 双向表Type I error, 一类错误/α错误Type II error, 二类错误/β错误UMVU, 方差一致最小无偏估计简称Unbiased estimate, 无偏估计Unconstrained nonlinear regression , 无约束非线性回归Unequal subclass number, 不等次级组含量Ungrouped data, 不分组资料Uniform coordinate, 均匀坐标Uniform distribution, 均匀分布Uniformly minimum variance unbiased estimate, 方差一致最小无偏估计Unit, 单元Unordered categories, 无序分类Upper limit, 上限Upward rank, 升秩Vague concept, 模糊概念Validity, 有效性VARCOMP (Variance component estimation), 方差元素估计Variability, 变异性Variable, 变量Variance, 方差Variation, 变异Varimax orthogonal rotation, 方差最大正交旋转Volume of distribution, 容积W test, W检验Weibull distribution, 威布尔分布Weight, 权数Weighted Chi-square test, 加权卡方检验/Cochran检验Weighted linear regression method, 加权直线回归Weighted mean, 加权平均数Weighted mean square, 加权平均方差Weighted sum of square, 加权平方和Weighting coefficient, 权重系数Weighting method, 加权法W-estimation, W估计量W-estimation of location, 位置W估计量Width, 宽度Wilcoxon paired test, 威斯康星配对法/配对符号秩和检验Wild point, 野点/狂点Wild value, 野值/狂值Winsorized mean, 缩尾均值Withdraw, 失访Youden's index, 尤登指数Z test, Z检验Zero correlation, 零相关Z-transformation, Z变换21。
SPSS主要菜单及功能一览表

主要菜单及功能一览表SPSS讲座大纲一、SPSS简介二、SPSS基本统计分析1.频数分析2.方差分析三、SPSS曲线拟合应用举例(一)、SPSS 概述SPSS 是英文Statistical Package for the Social Science(社会科学统计软件包)的缩写。
20 世纪60 年代末,美国斯坦福大学的三位研究生研制开发了最早的统计分析软件SPSS,同时成立了SPSS 公司,并于1975 年在芝加哥组建了SPSS 总部。
20 世纪80年代以前,SPSS统计软件主要应用于企事业单位。
1984年SPSS 总部首先推出了世界第一个统计分析软件微机版本SPSS/PC+,开创了SPSS 微机系列产品的开发方向,极大地扩充了它的应用范围,并使其能很快地应用于自然科学、技术科学、社会科学的各个领域,世界上许多有影响的报刊杂志纷纷就SPSS 的自动统计绘图、数据的深入分析、使用方便、功能齐全等方面给予了高度的评价与称赞。
SPSS 名为社会科学统计软件包,这是为了强调其在社会科学应用的一面(因为社会科学研究中的许多现象都是随机的,要使用统计学来进行研究),而实际上广泛应用于经济学、社会学、生物学、教育学、心理学、医学以及体育、工业、农业、林业、商业和金融等各个领域。
SPSS 的基本功能包括数据管理、统计分析、图表分析、输出管理等等。
SPSS 统计分析过程包括描述性统计、均值比较、一般线性模型、相关分析、回归分析、对数线性模型、聚类分析、数据简化、生存分析、时间序列分析、多重响应等几大类,每类中又分好几个统计过程,比如回归分析中又分线性回归分析、曲线估计、Logistic 回归、Probit 回归、加权估计、两阶段最小二乘法、非线性回归等多个统计过程,而且每个过程中又允许用户选择不同的方法及参数。
SPSS 也有专门的绘图系统,可以根据数据绘制各种图形。
(二)SPSS 的主界面启动SPSS 后,出现SPSS 主界面(数据编辑器)。
- 1、下载文档前请自行甄别文档内容的完整性,平台不提供额外的编辑、内容补充、找答案等附加服务。
- 2、"仅部分预览"的文档,不可在线预览部分如存在完整性等问题,可反馈申请退款(可完整预览的文档不适用该条件!)。
- 3、如文档侵犯您的权益,请联系客服反馈,我们会尽快为您处理(人工客服工作时间:9:00-18:30)。
spss各模块菜单含义
◆Reports报表
……OLAP在线分析处理……case Summaries案例摘要……Report Summaries in Rows行摘要
……Report Summaries in Columns列摘要
◆descriptives Statistics描述统计
……Frequ encies频数分析……Descriptives描述分析
……Explore数据探索……Crosstabs交叉分析
……Ratio连续变量的对比分析
◆Custom Tables定制表格
……basic Tables基本表格
……Gen eral Tables多功能综合表格……Multiple Response Table多选题制表……Tables of Frequencies多变量频数表
◆Compare Mean均值比较分析过程
……Means单变量的综合描述统计……Independent Sample T test独立样本的T检验……Paired Sample T te st配对样本的T检验……One-Way ANOVA单变量方差分析
◆General Linear Model一般线性模型
……Univariate单一因变量线性模型……Multivariate多个因变量线性模型……Repeated Measures重测数据的方差分析……Variance Components方差成分模型
◆Mixed Models混合线性模型
……linear线性模型
◆Correlate 相关分析
……Bivariate Pearson/ Kendall/Spearman非参数相关分析……Partial双变量相关分析……Distance相似性、非相似性分析
◆Regression 回归分析
……Liner线性回归分析……Curve Estimation曲线估计
……Binary Logistic二分变量回归分析……Multinomial Logistic多项类别变量回归分析……Ordinal序数的回归分析……Probit 概率分析
……Nonlinear 非线性回归分析……Weight Estimation 不同权数的线性回归分析……2-stage Least Squares 二阶最小平方回归分析
……Optimal Scaling最优尺度分析
◆Loglinear 对数线性回归分析
……General 一般对数线性回归分析
……Logit单因变量多自变量回归分析
……Model Selection分层对数线性模型
◆Classify聚类和判别分析
……K-means Cluster 快速聚类分析(指定分类数聚类分析)……Hierarchical Cluster系统聚类分析(未知分类数聚类分析)……Discriminent 判别分析
◆Data Reduction 数据浓缩(降维)处理
……Factor因子分析
……Correspondence对应分析
……Optimal Scaling最优尺度分析
◆Scale项目分析
……Reliability Ananlysis可靠性分析
……Multidimensional Scaling多维等级分析
……Multidimensional Scaling(POXSCAL)
◆Nonparametric Tests 非参数统计
……Chi-Square 相对比例假设检验
……Binomial特定时间发生概率检验
……Run随即序列检验
……1-Sample Kolmogorov Smirnov 样本分布检验
……2-Independent Samples双不相关组分布分析
……K Independent Samples多不相关组分布分析
……2 Related Samples双相关变量分布分析
……K Related Samples相关变量分布分析
◆Time Series时间序列
……Exponential Smoothing 平衡序列的随机分量……Autoregression一阶自回归误差线性方差检验……ARIMA综合自回归移动平均分析……Seasonal Decomposition对时间序列增倍和加性季节因子分析◆Survival生存分析
……Life Tables 生命表分析
……Kaplan-Meier 双事件分布检验
……Cox Regression事件与时间变量相互分析
……Co x w/Time Dep cov 时间函数Cox分析
◆Multiple Response多选题处理
……Define sets多选题变量定义
……Frequencies多选题频数分析
……Crosstabs多选题交叉分析
◆Missing value Analysis 缺失值分析。