噪声系数测量--三种方法
噪声系数的测量方法
噪声系数的测量方法噪声系数是指放大器输入信号与输出信号之间的信噪比的比值。
在电子系统中,噪声系数是衡量放大器噪声性能的重要指标。
下面将介绍几种常用的测量噪声系数的方法。
1.级联噪声法:级联噪声法是最常用的测量噪声系数的方法之一、它利用级联放大器的总噪声系数计算出前面的放大器的噪声系数。
具体的步骤如下:a.在待测放大器之前设置一个已知的参考放大器,并测量此参考放大器的噪声系数。
b.将待测放大器与参考放大器级联,并测量级联放大器的总输入输出电压和噪声功率。
c.利用总放大器的输入输出电压和已知的参考放大器的噪声系数计算出内嵌放大器的噪声系数。
2.可变增益噪声法:可变增益噪声法是另一种测量噪声系数的常用方法。
它通过调整放大器的增益,使其与一个已知参考噪声源声压相等,从而测量出待测放大器的噪声系数。
具体的步骤如下:a.在待测放大器的输入端接入一个参考噪声源,并调整其声压使其与待测放大器的输出噪声相等。
b.测量参考噪声源的声压和待测放大器的输入输出电压。
c.利用已知的参考噪声源的噪声功率和声压计算出待测放大器的噪声功率和噪声系数。
3.热噪声法:热噪声法是一种常用的测量噪声系数的方法,特别适用于宽频带和高频段的放大器。
热噪声法利用了热噪声在环境温度下的特性,通过直接测量输出噪声电压和环境温度来计算噪声系数。
具体的步骤如下:a.测量放大器的输出噪声电压并记录。
b.测量环境温度并记录。
c.利用热噪声公式计算出放大器的噪声功率。
d.利用输入信号和已知的电阻值计算出放大器的输入信号功率。
e.利用已知的输入信号功率和噪声功率计算出放大器的噪声系数。
除了上述传统的测量方法之外,还有一些新的测量噪声系数的方法正在不断涌现,如矢量分析器法、差分噪声法、噪声大师法等。
这些方法在特定的应用场景下有着更高的测量精度和更广的测量范围。
总结起来,测量噪声系数的常用方法有级联噪声法、可变增益噪声法、热噪声法等。
根据不同的应用场景和要求,选择合适的方法来测量噪声系数,有助于评估放大器的噪声性能,进而提高信号传输的质量。
噪声系数的三种测量方法及对比

。
图2 只要频谱分析仪允许, 增益法可适用于任 何频率范围内。最大的限制来自于频谱分析仪的 噪声基底。在公式中可以看到, 当噪声系数较低 ( 小 于 10dB) 时 ,( POUTD- 增 益 ) 接 近 于 - 170dBm/Hz, 通常 LNA 的增益约为 20dB。这样我 们需要测量- 150dBm/Hz 的噪声功率谱密度, 这 个值低于大多数频谱仪的噪声基底。这样系统增
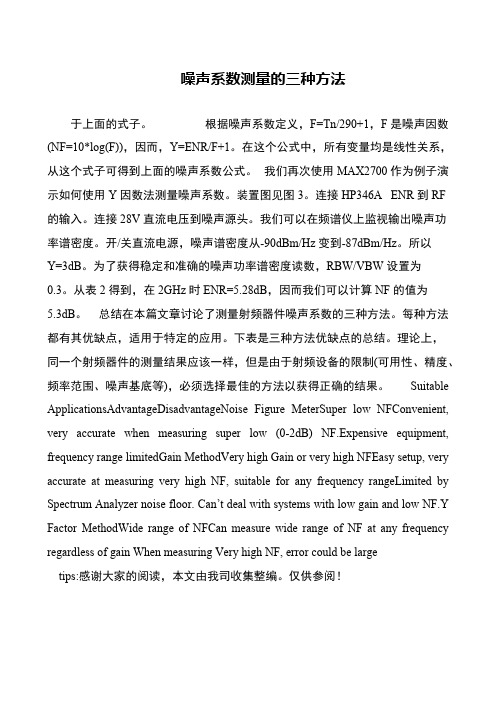
这就是 Y 因数法, 名字来源于上面的式子。 结束语: 文章讨论了测量射频器件噪声系数 的三种方法。每种方法都有其优缺点, 适用于特 定的应用。下表是三种方法优缺点的总结。理论 上, 同一个射频器件的测量结果应该一样, 但是 由于射频设备的限制( 可用性、精度、频率范围、 噪声基底等) , 必须选择最佳的方法以获得正确 的结果。
关键词: 噪声系数; 测量方法; 对比
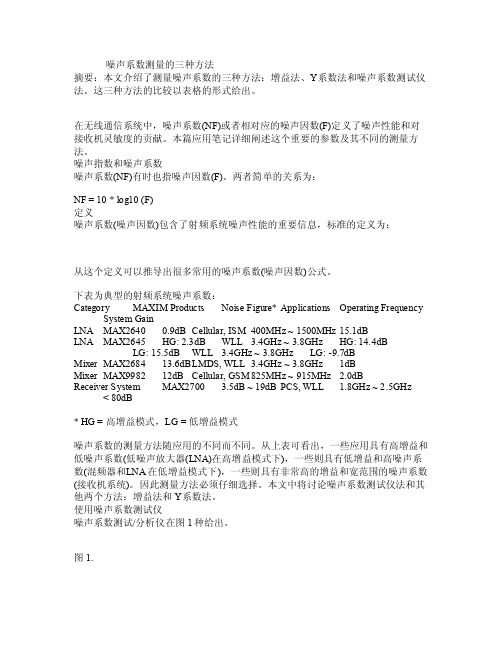
1 概述 噪声系数( NF) 有时也指噪声因数( F) 。两者 简单的关系为: NF=10*log10( F) 噪声系数( 噪声因数) 包含了射频系统噪声 性能的重要信息, 标准的定义为: 噪声因数( F) =
输出端总噪声功率 外部噪声在输出端呈现的噪声功率
从这个定义可以推导出很多常用的噪声系 数( 噪声因数) 公式。噪声系数的测量方法随应用 的不同而不同。一些应用具有高增益和低噪声系 数( 低噪声放大器( LNA) 在高增益模式下) , 一些 则具有低增益和高噪声系数 ( 混频器和 LNA 在 低增益模式下) , 一些则具有非常高的增益和宽 范围的噪声系数( 接收机系统) 。因此测量方法必 须仔细选择。下面将讨论噪声系数测试仪法和其 他两个方法: 增益法和 Y 因数法。
益非常高, 因
表1
而大多数频谱
仪均可准确测
量噪声系数。
频谱仪测噪声系数测试方法
频谱仪测噪声系数测试方法
频谱仪测噪声系数是一种可以衡量电器设备噪声水平的测试方法。
噪声系数通常用于衡量信号电路中信号与噪声的比值。
如下是频谱仪测噪声系数的测试方法。
1. 计算输入功率与输出功率之比
首先,在测试过程中,必须确定测试电路的输入功率和输出功率。
输入功率和输出功率之比是计算噪声系数的关键。
在某些情况下,输入功率与输出功率可能需要进行校准。
2. 连接频谱仪
将频谱仪连接到测试电路的输入和输出端口。
确保测试电路的噪声源已关闭,并且频谱仪已正确配置和校准。
3. 设置频谱仪
根据测试电路的特定需要,设置频谱仪的参数。
这包括频率跨度、频率分辨率、RBW(分辨带宽)和VBW(视频带宽)等参数。
4. 测量输出功率噪声
在没有输入信号的情况下,测量测试电路的输出噪声功率。
在某些情
况下,需要在输出端口使用负载以测量噪声功率。
5. 注入输入电信号
在测试电路的输入端注入一个准确的电信号,并测量频谱仪的输出。
将输出功率与测量输出噪声功率的结果进行比较,可以计算出噪声系数。
6. 计算噪声系数
通过将输出功率与测量输出噪声功率之比除以输入功率与输出功率之比,可以计算出噪声系数。
通常,噪声系数表示为dB。
在完成测试后,可以对测试结果进行数据分析和报告编制。
这样,测试人员可以将测试结果以可读的形式呈现给客户或其他利益相关者。
噪声系数测量
6.1 噪声系数测量
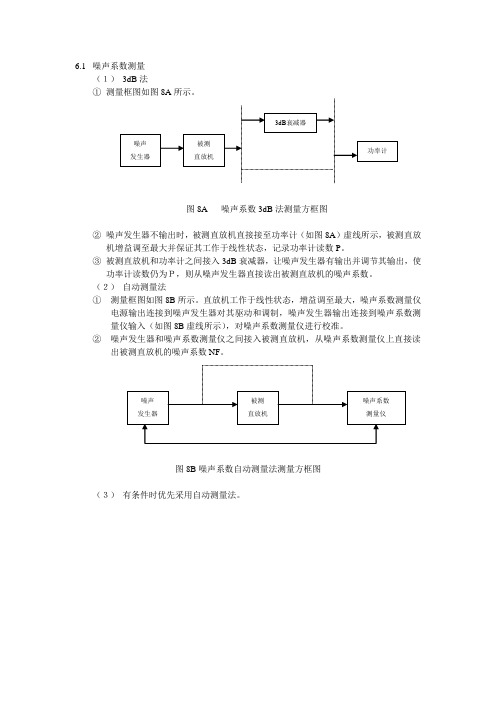
(1) 3dB 法
① 测量框图如图8A 所示。
图8A 噪声系数3dB 法测量方框图
② 噪声发生器不输出时,被测直放机直接接至功率计(如图8A )虚线所示,被测直放
机增益调至最大并保证其工作于线性状态,记录功率计读数P 。
③ 被测直放机和功率计之间接入3dB 衰减器,让噪声发生器有输出并调节其输出,使
功率计读数仍为P,则从噪声发生器直接读出被测直放机的噪声系数。
(2) 自动测量法
① 测量框图如图8B 所示。
直放机工作于线性状态,增益调至最大,噪声系数测量仪
电源输出连接到噪声发生器对其驱动和调制,噪声发生器输出连接到噪声系数测量仪输入(如图8B 虚线所示),对噪声系数测量仪进行校准。
② 噪声发生器和噪声系数测量仪之间接入被测直放机,从噪声系数测量仪上直接读
出被测直放机的噪声系数NF 。
图8B 噪声系数自动测量法测量方框图
(3) 有条件时优先采用自动测量法。
噪声 发生器 被测 直放机 功率计 3dB 衰减器 噪声 发生器 噪声系数 测量仪 被测 直放机。
不同仪器对噪声系数测量的方法

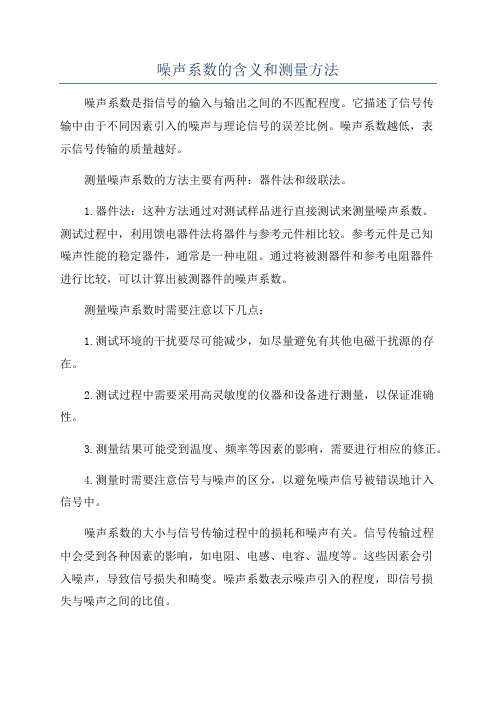
图1了射 频系统 噪声性 能的重要信 息 , 它通 常 被 定 义 为 网 络 的输 入 信 噪 比 S / N与输 出信噪 比 S / N 的 比值
F= = / NI
‘
式( 1 ) 假设 网络的功率增益 为 G, 内部噪声功率 为 N , 那 式( 2 ) 表明, 噪声系数是功 率增益 G
么( 1 ) 可 以简化为
的函数 , 测量时应保持功率增益不 变。 2 三 种 仪器 分 别 对 噪 声 系 数 的测 试 方 法 2 . 1 噪声系数分析仪测量噪声 系数 测量框 图为 图 1 。 噪声系数常用的测试方法有噪声源法和信 号源法 。 但 由于实际 应 用时不能严格地工作在线性 区域 ,因此信号源法测试误差较大 , 所 以 工作 中大 多 采 用 噪 声 源 法 。 噪声系数分析仪是一 台高灵敏 度 、 低 噪声 接收机 , 是一 台采用 频率变换后再在 中频上处理信号 的超外差接收机。 使用噪声系数分 析仪在 大多数情况下测量噪声系数是最直接也 是最准确 的。 噪声系 图 3 数分析仪能够 同时显示增益和噪声系数来进行测量 。 噪声 系数分析 室温 )时环境噪声 的功率谱密度 , B W 是分辨率带宽 , G a i n 是 系统 仪测试噪声系数的核心是 Y因子法。噪声系数分析仪是 一台接收 ( 机, 可 以用来测试输入 的噪声功率 。噪声系数分析仪需要控制一个 的增益 , N F 是 D U T的噪声 系数 。 公式 中每个变量均为对数 , 故简化 噪 声 源 的加 电和 不 加 电这 两 种 状 态 对 被 测 件 ( D U T ) 进行测试 , 这 两 公式 , 可以直接测量输 出噪声的功率谱密度 ( d B m / H z ) 。 N F = P N O U T + 1 7 4 d B m / H z — G a i n ) 式( 4 ) 次功率 的比值就是 Y因子。使用噪声系数分析仪对被测 件进行噪 声系数测试 时 , 先要对 噪声 系数 分析仪进行校准 , 从而消 除或 减少 频谱 分析仪测 量噪声系数 的最 大局 限性来 自频谱 分析仪 的噪 小噪声 系数 的被测件 , 其输 出端的 P o u t 会很小 , 低 仪表接收机 自身带入 的影响。 在测试具有混频功能的被测件时还可 底。因为低增 益、 于频谱分析仪 的噪底 , 这样信号会被 淹没在噪声之 中 , 导致无 法测 以通过设置测试仪表对( 本振 ) 信 号的频率进行控制。 如A g i l e n t 公司 的 N 8 9 7 5 A噪声 系数分析仪 ,产生 2 8 V D C脉冲 量。一般使用频谱分析仪( 增益法 ) 准确测量 噪声 系数 , 要满足待测 信号驱动噪声源 ( 3 4 6 A / B) 。先将噪声 源 3 4 6 A / B的超噪 比输入噪声 系统的输 出噪声密度要比频谱分析仪 的噪底高 2 0 d B以上 。为获得 B W ( 分辨 率带宽 ) 与 系数分 析仪 中 ,再将噪声源和 噪声 系数 分析仪连接在一 起进行校 稳定和准确 的噪声密度读数 ,选择最优 的 R B W( 视频 带宽 ) 即R B W/ V B W= 0 . 3 , 为使频 谱 , 尤其是 基底 噪声看 准, 等校准完毕后确认整个频段被校平再将 噪声源产生噪声驱动待 V 测器件 ( D U T ) , 使用噪声系数分析仪测量待测件 的输 出。噪声系数 起来比较干净 。 视频带宽越小 , 频谱分析仪显示 的基底噪声越小。 只 分析 仪通过将 噪声 源的输 入噪声 和信 噪 比可 计算 D U T的噪 声系 要频谱分析仪 的噪声底的指标好 ,这种方法适 用于任何频率 范围。 数。 对于系统增益非 常高 、 噪声 系数 非常高的场合 , 这种方法也 非常准 确。 2 . 2 用频谱分析仪测量噪声系数 测量框图为图 2 。 例如( 频谱法测试 混频 电路 的噪声系数 ) a. 将测试 系统按 照电路 图进行连接 ,并将 电源电压 V 图中的接收机是测试 中的待测件。 首先 利用点频信号发生器发 C C调 到 3 V; 射点频信号 , 在频谱分析仪上读取 功率值来测试 接收机 的增益 。然 3. b . 设置 R F信 号源 的频率为 F R F X MH z , 输出功率 为 一 9 0 d B m; 后关掉信号发生器 , 直接通过频谱 分析 仪读 出接 收机输 出端 的噪声 c. 功 率谱密度值 。通过这两个值就可 以算出噪声 因子 。 设置 L O信 号源 的频率 为 F L O Y MH z , 输 出功率 为 2 d B m( 以 ; 由噪声系数 的定义 可知 N F = P N O U T -( - 1 7 4 d B m/ Hz - + 2 0 1 g ( B W) 加到芯片本振端 口的实际功率计算 ) d . 从频谱仪上找到 I F的信号 ; + G a i n ) 式( 3 ) e . 设置频谱仪 的参考 电平为 一 4 0 d B m,带宽为 ( 下转 8 2页) 式中: P N O U T是已测的总输 出噪声 功率 , 一 1 7 4 d B m / Hz 是2 9 0 K
噪声系数的含义和测量方法
噪声系数的含义和测量方法
噪声系数是指信号的输入与输出之间的不匹配程度。
它描述了信号传
输中由于不同因素引入的噪声与理论信号的误差比例。
噪声系数越低,表
示信号传输的质量越好。
测量噪声系数的方法主要有两种:器件法和级联法。
1.器件法:这种方法通过对测试样品进行直接测试来测量噪声系数。
测试过程中,利用馈电器件法将器件与参考元件相比较。
参考元件是已知
噪声性能的稳定器件,通常是一种电阻。
通过将被测器件和参考电阻器件
进行比较,可以计算出被测器件的噪声系数。
测量噪声系数时需要注意以下几点:
1.测试环境的干扰要尽可能减少,如尽量避免有其他电磁干扰源的存在。
2.测试过程中需要采用高灵敏度的仪器和设备进行测量,以保证准确性。
3.测量结果可能受到温度、频率等因素的影响,需要进行相应的修正。
4.测量时需要注意信号与噪声的区分,以避免噪声信号被错误地计入
信号中。
噪声系数的大小与信号传输过程中的损耗和噪声有关。
信号传输过程
中会受到各种因素的影响,如电阻、电感、电容、温度等。
这些因素会引
入噪声,导致信号损失和畸变。
噪声系数表示噪声引入的程度,即信号损
失与噪声之间的比值。
测量噪声系数的目的是为了评估信号传输的质量,找出信号传输过程
中引入的噪声和损耗。
这样可以针对噪声源采取相应的优化和改善措施,
提高信号传输系统的性能。
对于需要高质量信号的应用领域,如通信系统、射频系统等,噪声系数的测量和优化具有重要的意义。
噪声系数测量的三种方法
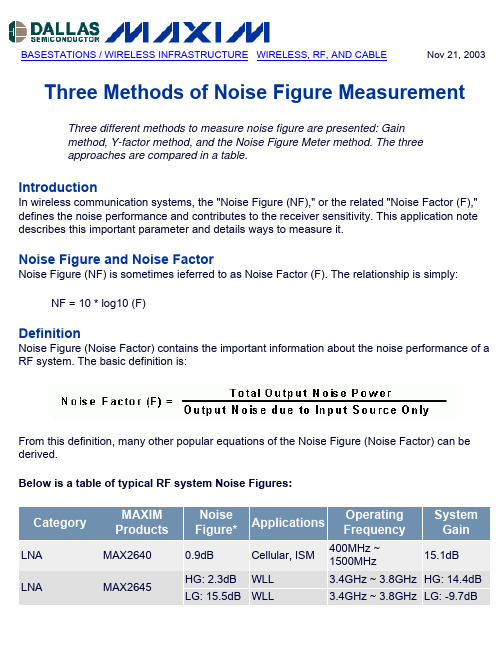
Maxim > App Notes > BASESTATIONS / WIRELESS INFRASTRUCTURE WIRELESS, RF, AND CABLEKeywords: rf, rfic, wireless, noisefigure measurement, gain, meter, y factor, rf ics, rfics Nov 21, 2003 APPLICATION NOTE 2875Three Methods of Noise Figure MeasurementAbstract: Three different methods to measure noise figure are presented: Gain method, Y-factor method, and the Noise Figure Meter method. The three approaches are compared in a table.IntroductionIn wireless communication systems, the "Noise Figure (NF)," or the related "Noise Factor (F)," defines the noise performance and contributes to the receiver sensitivity. This application note describes this important parameter and details ways to measure it.Noise Figure and Noise FactorNoise Figure (NF) is sometimes referred to as Noise Factor (F). The relationship is simply:NF = 10 * log10 (F)DefinitionNoise Figure (Noise Factor) contains the important information about the noise performance of a RF system. The basic definition is:From this definition, many other popular equations of the Noise Figure (Noise Factor) can be derived.Below is a table of typical RF system Noise Figures:Category MAXIM Products Noise Figure*Applications Operating Frequency System GainLNA MAX26400.9dB Cellular, ISM400MHz ~ 1500MHz15.1dBLNA MAX2645HG: 2.3dB WLL 3.4GHz ~ 3.8GHz HG: 14.4dB LG: 15.5dB WLL 3.4GHz ~ 3.8GHz LG: -9.7dBMixer MAX268413.6dB LMDS, WLL 3.4GHz ~ 3.8GHz1dBMixer MAX998212dB Cellular, GSM825MHz ~ 915MHz 2.0dBReceiver System MAX2700 3.5dB ~ 19dB PCS, WLL 1.8GHz ~ 2.5GHz< 80dB* HG = High Gain Mode, LG = Low Gain ModeMeasurement methods vary for different applications. As shown in the table above, some applications have high gain and low noise figure (Low Noise Amplifiers under HG mode), some have low gain and high noise figure (mixers and LNAs under LG mode), some have very high gain and wide range of noise figure (receiver systems). Measurement methods have to be chosen carefully. In this article, a Noise Figure Meter as well as two other popular methods - "gain method" and "Y factor method" - will be discussed.Using a Noise Figure MeterNoise Figure Meter/Analyzer is employed as shown in Figure 1.Figure 1.The noise figure meter, such as Agilent N8973A Noise Figure Analyzer, generates a 28VDC pulse signal to drive a noise source (HP346A/B), which generates noise to drive the device under test (DUT). The output of the DUT is then measured by the noise figure analyzer. Since the input noise and Signal-to-Noise ratio of the noise source is known to the analyzer, the noise figure of the DUT can be calculated internally and displayed. For certain applications (mixers and receivers), a LO signal might be needed, as shown in Figure 1. Also, certain parameters need to be set up in the Noise Figure Meter before the measurement, such as frequency range, application (Amplifier/Mixer), etc.Using a noise figure meter is the most straightforward way to measure noise figure. In most cases it is also the most accurate. An engineer can measure the noise figure over a certain frequency range, and the analyzer can display the system gain together with the noise figure to help the measurement. A noise figure meter also has limitations. The analyzers have certain frequency limits. For example, the Agilent N8973A works from 10MHz to 3GHz. Also, when measuring high noise figures, e.g., noise figure exceeding 10dB, the result can be very inaccurate. This method requires very expensive equipment.Gain MethodAs mentioned above, there are other methods to measure noise figure besides directly using a noise figure meter. These methods involve more measurements as well as calculations, but under certain conditions, they turn out to be more convenient and more accurate. One popular method is called "Gain Method", which is based on the noise factor definition given earlier:In this definition, "Noise" is due to two effects. One is the interference that comes to the input of a RF system in the form of signals that differ from the desired one. The second is due to the random fluctuation of carriers in the RF system (LNA, mixer, receiver, etc). The second effect is a result of Brownian motion, It applies in thermal equilibrium to any electronic device, and the available noise power from the device is:P NA = kT∆F,Where k = Boltzmann's Constant (1.38 * 10-23 Joules/∆K),T = Temperature in Kelvin,∆F = Noise Bandwidth (Hz).At room temperature (290∆K), the noise power density P NAD = -174dBm/Hz.Thus we have the following equation:NF = P NOUT - (-174dBm/Hz + 10 * log10(BW) + Gain)In the equation, P NOUT is the measured total output noise power. -174dBm/Hz is the noise density of 290°K ambient noise. BW is the bandwidth of the frequency range of interest. Gain is the system gain. NF is the noise figure of the DUT. Everything in the equation is in log scale. To make the formula simpler, we can directly measure the output noise power density (in dBm/Hz), and the equation becomes:NF = P NOUTD + 174dBm/Hz - GainTo use the "Gain Method" to measure the noise figure, the gain of the DUT needs to be pre-determined. Then the input of the DUT is terminated with the characteristic impedance (50Ω for most RF applications, 75Ω for video/cable applications). Then the output noise power density is measured with a spectrum analyzer.The setup for Gain Method is shown in Figure 2.Figure 2.As an example, we measure the noise figure of the MAX2700. At a specified LNA gain setting and V AGC, the gain is measured to be 80dB. Then, set up the device as show above, and terminate the RF input with a 50Ωtermination. We read the output noise density to be -90dBm/Hz. To get a stable and accurate reading of the noise density, the optimum ratio of RBW (resolution bandwidth) and VBW (video bandwidth) is RBW/VBW = 0.3. Thus we can calculate the NF to be:-90dBm/Hz + 174dBm/Hz - 80dB = 4.0dB.The "Gain Method" can cover any frequency range, as long as the spectrum analyzer permits. The biggest limitation comes from the noise floor of the spectrum analyzer. As shown in the equations, when Noise Figure is low (sub 10dB), (P OUTD - Gain) is close to -170dBm/Hz. Normal LNA gain is about 20dB. In that case, we need to measure a noise power density of -150dBm/Hz, which is lower than the noise floor of most spectrum analyzers. In our example, the system gain is very high, thus most spectrum analyzers can accurately measure the noise figure. Similarly, if the Noise Figure of the DUT is very high (e.g., over 30dB), this method can also be very accurate.Y Factor MethodY Factor method is another popular way to measure Noise Figure. To use the Y factor method, an ENR (Excess Noise Ratio) source is needed. It is the same thing as the noise source we mentioned earlier in the "Noise Figure Meter" section. The setup is shown in the Figure 3:Figure 3.The ENR head usually requires a high DC voltage supply. For example, HP346A/B noise sources need 28VDC. Those ENR heads works are a very wide band (e.g.10MHz to 18GHz for the HP346A/B) and they have a standard noise figure parameter of their own at specified frequencies. An example table is given below. The noise figures at frequencies between those markers are extrapolated.Table 1. Example of ENR of Noise HeadsHP346A HP346BFrequency (Hz)NF (dB)NF (dB)1G 5.3915.052G 5.2815.013G 5.1114.864G 5.0714.825G 5.0714.81Turning the noise source on and off (by turning on and off the DC voltage), an engineer measures the change in the output noise power density with a spectrum analyzer. The formula to calculate noise figure is:In which ENR is the number given in the table above. It is normally listed on the ENR heads. Y is the difference between the output noise power density when the noise source is on and off.The equation comes from the following:An ENR noise head provides a noise source at two "noise temperatures": a hot T = TH (when a DC voltage is applied) and a cold T = 290°K. The definition of ENR of the noise head is:The excess noise is achieved by biasing a noisy diode. Now consider the ratio of power out from the amplifier (DUT) from applying the cold T = 290°K, followed by applying the hot T = T H as inputs:Y = G(Th + Tn)/G(290 + Tn) = (Th/290 + Tn/290)/(1 + Tn/290).This is the Y factor, from which this method gets its name.In terms of Noise figure, F = Tn/290+1, F is the noise factor (NF = 10 * log(F))Thus, Y = ENR/F+1. In this equation, everything is in linear regime, from this we can get the equation above.Again, let's use MAX2700 as an example of how to measure noise figure with the Y-factor method. The set up is show above in Figure 3. Connect a HP346A ENR noise head to the RF input. Connect a 28V DC supply voltage to the noise head. We can monitor the output noise density on a spectrum analyzer. By Turning off then turning on the DC power supply, the noise density increased from -90dBm/Hz to -87dBm/Hz. So Y = 3dB. Again to get a stable and accurate reading of the noise density, RBW/VBW is set to 0.3. From Table 1, at 2GHz, we get ENR = 5.28dB. Thus we can calculate the NF to be 5.3dB.SummaryIn this article, three methods to measure the noise figure of RF devices are discussed. They each have advantages and disadvantages and each is suitable for certain applications. Below is a summary table of the pros and cons. Theoretically, the measurement results of the same RF device should be identical, but due to limitations of RF equipment (availability, accuracy, frequency range, noise floor, etc), we have to carefully choose the best method to get the correct results.Suitable Applications Advantage DisadvantageNoise FigureMeter Super low NF Convenient, veryaccurate when measuringsuper low (0-2dB) NF.Expensive equipment, frequencyrange limitedGain Method Very high Gain or very highNF Easy setup, very accurateat measuring very highNF, suitable for anyfrequency rangeLimited by Spectrum Analyzernoise floor. Can't deal withsystems with low gain and lowNF.Y Factor Method Wide range of NF Can measure wide rangeof NF at any frequencyregardless of gainWhen measuring Very high NF,error could be large.Application Note 2875: /an2875More InformationFor technical support: /supportFor samples: /samplesOther questions and comments: /contactAutomatic UpdatesWould you like to be automatically notified when new application notes are published in your areas of interest? Sign up for EE-Mail.Related PartsMAX2640:QuickView-- Full (PDF) Data Sheet-- Free Samples MAX2641:QuickView-- Full (PDF) Data Sheet-- Free Samples MAX2642:QuickView-- Full (PDF) Data Sheet-- Free Samples MAX2643:QuickView-- Full (PDF) Data Sheet-- Free Samples MAX2645:QuickView-- Full (PDF) Data Sheet-- Free Samples MAX2648:QuickView-- Full (PDF) Data SheetMAX2649:QuickView-- Full (PDF) Data SheetMAX2654:QuickView-- Full (PDF) Data Sheet-- Free Samples MAX2655:QuickView-- Full (PDF) Data Sheet-- Free Samples MAX2656:QuickView-- Full (PDF) Data Sheet-- Free Samples MAX2684:QuickView-- Full (PDF) Data Sheet-- Free Samples MAX2700:QuickView-- Full (PDF) Data Sheet-- Free Samples MAX9982:QuickView-- Full (PDF) Data Sheet-- Free SamplesAN2875, AN 2875, APP2875, Appnote2875, Appnote 2875 Copyright © by Maxim Integrated ProductsAdditional legal notices: /legal。
噪声系数测量--三种方法
噪声系数测量的三种方法摘要:本文介绍了测量噪声系数的三种方法:增益法、Y系数法和噪声系数测试仪法。
这三种方法的比较以表格的形式给出。
在无线通信系统中,噪声系数(NF)或者相对应的噪声因数(F)定义了噪声性能和对接收机灵敏度的贡献。
本篇应用笔记详细阐述这个重要的参数及其不同的测量方法。
噪声指数和噪声系数噪声系数(NF)有时也指噪声因数(F)。
两者简单的关系为:NF= 10* log10 (F)定义噪声系数(噪声因数)包含了射频系统噪声性能的重要信息,标准的定义为:从这个定义可以推导出很多常用的噪声系数(噪声因数)公式。
下表为典型的射频系统噪声系数:Cate goryMAXIM Prod uctsNoise Figu re* A pplic ation s Ope ratin g Fre quenc y Sys tem G ainL NA MA X26400.9d B Cel lular, ISM400M Hz ~1500M Hz 15.1dBLNA M AX2645 HG: 2.3d B WLL 3.4G Hz ~3.8GH z HG: 14.4dB LG: 15.5dB WLL 3.4GH z ~ 3.8GHz LG:-9.7d BMix er MA X268413.6dB LM DS, W LL 3.4GHz~ 3.8GHz 1dBMi xer M AX9982 12d B Cel lular, GSM825M Hz ~915MH z 2.0dBRe ceive r Sys tem M AX2700 3.5dB ~19dBPCS,WLL 1.8GHz ~ 2.5GHz< 80d B*HG =高增益模式,LG =低增益模式噪声系数的测量方法随应用的不同而不同。
噪声系数的测量方法研究
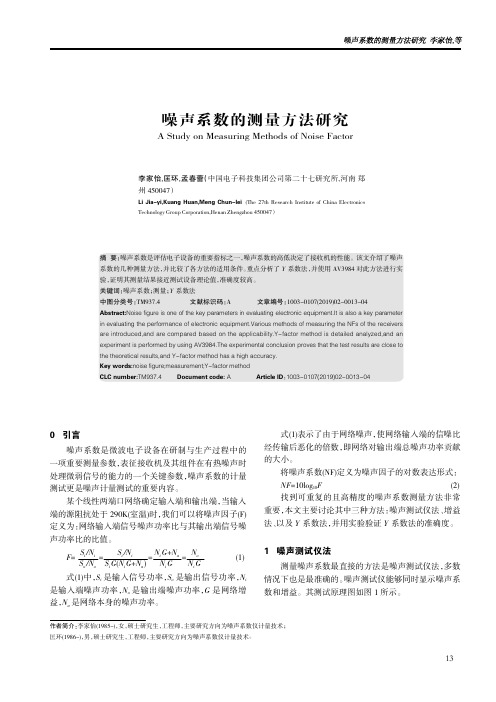
0引言噪声系数是微波电子设备在研制与生产过程中的一项重要测量参数,表征接收机及其组件在有热噪声时处理微弱信号的能力的一个关键参数,噪声系数的计量测试更是噪声计量测试的重要内容。
某个线性两端口网络确定输入端和输出端,当输入端的源阻抗处于290K(室温)时,我们可以将噪声因子(F)定义为:网络输入端信号噪声功率比与其输出端信号噪声功率比的比值。
F=S i /N i S o /N o =S i /N i S i G (N i G+N a )=N i G+N a N i G =N oN i G(1)式(1)中,S i 是输入信号功率,S o 是输出信号功率,N i是输入端噪声功率,N o 是输出端噪声功率,G 是网络增益,N a 是网络本身的噪声功率。
式(1)表示了由于网络噪声,使网络输入端的信噪比经传输后恶化的倍数,即网络对输出端总噪声功率贡献的大小。
将噪声系数(NF)定义为噪声因子的对数表达形式:NF =10log 10F(2)找到可重复的且高精度的噪声系数测量方法非常重要,本文主要讨论其中三种方法:噪声测试仪法、增益法、以及Y 系数法,并用实验验证Y 系数法的准确度。
1噪声测试仪法测量噪声系数最直接的方法是噪声测试仪法,多数情况下也是最准确的。
噪声测试仪能够同时显示噪声系数和增益。
其测试原理图如图1所示。
作者简介院李家怡(1985-),女,硕士研究生,工程师,主要研究方向为噪声系数仪计量技术;匡环(1986-),男,硕士研究生,工程师,主要研究方向为噪声系数仪计量技术。
噪声系数的测量方法研究A Study on Measuring Methods of Noise Factor李家怡,匡环,孟春蕾(中国电子科技集团公司第二十七研究所,河南郑州450047)Li Jia-yi,Kuang Huan,Meng Chun-lei (The 27th Research Institute of China Electronics Technology Group Corporation,Henan Zhengzhou 450047)摘要:噪声系数是评估电子设备的重要指标之一,噪声系数的高低决定了接收机的性能。
噪声系数测量方法
噪声系数测量的三种方法摘要:本文介绍了测量噪声系数的三种方法:增益法、Y系数法和噪声系数测试仪法。
这三种方法的比较以表格的形式给出。
前言在无线通信系统中,噪声系数(NF)或者相对应的噪声因数(F)定义了噪声性能和对接收机灵敏度的贡献。
本篇应用笔记详细阐述这个重要的参数及其不同的测量方法。
噪声指数和噪声系数噪声系数(NF)有时也指噪声因数(F)。
两者简单的关系为:NF = 10 * log10 (F)定义噪声系数(噪声因数)包含了射频系统噪声性能的重要信息,标准的定义为:式1从这个定义可以推导出很多常用的噪声系数(噪声因数)公式。
下表为典型的射频系统噪声系数:Category MAXIMProductsNoise Figure*Applications Operating Frequency System GainLNA MAX2640Cellular, ISM400MHz ~ 1500MHzLNA MAX2645HG: WLL~ HG: LG: WLL~ LG:Mixer MAX2684LMDS, WLL~ 1dBMixer MAX998212dB Cellular, GSM825MHz ~ 915MHzReceiverSystemMAX2700~ 19dB PCS, WLL~ < 80dB* HG = 高增益模式,LG = 低增益模式噪声系数的测量方法随应用的不同而不同。
从上表可看出,一些应用具有高增益和低噪声系数(低噪声放大器(LNA)在高增益模式下),一些则具有低增益和高噪声系数(混频器和LNA在低增益模式下),一些则具有非常高的增益和宽范围的噪声系数(接收机系统)。
因此测量方法必须仔细选择。
本文中将讨论噪声系数测试仪法和其他两个方法:增益法和Y系数法。
使用噪声系数测试仪噪声系数测试/分析仪在图1种给出。
图1.噪声系数测试仪,如Agilent的N8973A噪声系数分析仪,产生28VDC脉冲信号驱动噪声源(HP346A/B),该噪声源产生噪声驱动待测器件(DUT)。
噪声系数测量的三种方法
噪声系数测量的三种方法噪声系数是指在电子设备或电路中测量的信号质量衰减与理想条件下信号质量衰减之间的比值。
噪声系数越低,表示设备或电路产生的噪声越少,信号质量损失越小。
噪声系数的测量对于评估设备性能和优化电路设计至关重要。
下面介绍三种常用的测量噪声系数的方法。
1. 热噪声法(Hot Noise)热噪声法是一种直接测量噪声系数的方法,常用于微波器件和射频(RF)电路的噪声性能测量。
该方法的基本原理是通过在待测器件或电路输入端引入一个加热元件,使其在高温状态下工作,将加热元件所产生的热噪声和待测器件的输出噪声进行对比测量。
具体步骤如下:-在待测器件或电路的输入端插入一个短截线,将其与噪声发生器连接。
-在待测器件的输出端接上一个噪声功率测量装置。
-通过调节噪声发生器的输出功率,使得待测器件的输出功率与加热元件产生的热噪声功率相等。
-测量并记录加热元件的功率和待测器件的输出功率。
通过以上步骤可以得到待测器件的热噪声功率和输出功率,从而计算出噪声系数。
2. 对比法(Noise Figure Meter)对比法是一种间接测量噪声系数的方法,适用于比较不同器件或电路的噪声性能。
该方法通过测量两个不同器件或电路的输出噪声功率和输入信号功率的比值,进而计算出噪声系数。
具体步骤如下:-将待测器件和参考器件分别与噪声源相连。
-将两个器件的输出端与噪声功率测量装置相连。
-分别测量并记录待测器件和参考器件的输出噪声功率和输入信号功率。
通过以上步骤可以得到待测器件和参考器件的输出噪声功率和输入信号功率,从而计算出噪声系数。
3. 增益-噪声法(Gain-Noise Method)增益-噪声法是一种常用的测量噪声系数的方法,适用于放大器和无源器件的噪声性能测量。
该方法通过测量待测器件的增益和噪声指标,进而计算出噪声系数。
具体步骤如下:-将待测器件的输入端与信号源相连,输出端与噪声功率测量装置相连。
-测量并记录待测器件的输出噪声功率和输入信号功率。
噪声系数测量的三种方法
噪声系数测量的三种方法于上面的式子。
根据噪声系数定义,F=Tn/290+1,F是噪声因数(NF=10*log(F)),因而,Y=ENR/F+1。
在这个公式中,所有变量均是线性关系,从这个式子可得到上面的噪声系数公式。
我们再次使用MAX2700作为例子演示如何使用Y因数法测量噪声系数。
装置图见图3。
连接HP346A ENR到RF的输入。
连接28V直流电压到噪声源头。
我们可以在频谱仪上监视输出噪声功率谱密度。
开/关直流电源,噪声谱密度从-90dBm/Hz变到-87dBm/Hz。
所以Y=3dB。
为了获得稳定和准确的噪声功率谱密度读数,RBW/VBW设置为0.3。
从表2得到,在2GHz时ENR=5.28dB,因而我们可以计算NF的值为5.3dB。
总结在本篇文章讨论了测量射频器件噪声系数的三种方法。
每种方法都有其优缺点,适用于特定的应用。
下表是三种方法优缺点的总结。
理论上,同一个射频器件的测量结果应该一样,但是由于射频设备的限制(可用性、精度、频率范围、噪声基底等),必须选择最佳的方法以获得正确的结果。
Suitable ApplicationsAdvantageDisadvantageNoise Figure MeterSuper low NFConvenient, very accurate when measuring super low (0-2dB) NF.Expensive equipment, frequency range limitedGain MethodVery high Gain or very high NFEasy setup, very accurate at measuring very high NF, suitable for any frequency rangeLimited by Spectrum Analyzer noise floor. Can’t deal with systems with low gain and low NF.Y Factor MethodWide range of NFCan measure wide range of NF at any frequency regardless of gain When measuring Very high NF, error could be large tips:感谢大家的阅读,本文由我司收集整编。
接收机噪声系数测试方法
接收机噪声系数测试方法接收机的噪声系数是衡量其信号接收能力的重要指标之一、噪声系数表示接收机输入信号与输出信号之间的信噪比损失。
噪声系数越小,接收机的信噪比损失越小,其性能越好。
为了保证接收机的正常工作,需要定期对其噪声系数进行测试。
接收机的噪声系数测试可通过外参考源法或内参考源法来进行。
一、外参考源法:使用外部噪声源作为参考源来测试接收机的噪声系数。
一般情况下,可以使用陶瓷电阻、热电偶和大气热噪声等作为外参考源。
1.陶瓷电阻法:陶瓷电阻法是一种常用的测试方法,其原理是使用陶瓷电阻作为产生噪声的源,通过测量输出信号的功率和输入信号的功率来计算噪声系数。
测试步骤如下:1)将陶瓷电阻与接收机的输入端相连接;2)打开接收机,通过调节陶瓷电阻的阻值,使得接收机输出的信号功率达到最大;3)测量陶瓷电阻的阻值、接收机输出信号的功率和输入信号的功率;4)根据功率的大小计算噪声系数。
2.热电偶法:热电偶法是利用热电偶作为外参考源,通过测量输出信号的功率和热电偶的温度来计算噪声系数。
测试步骤如下:1)将热电偶与接收机的输入端相连接;2)打开接收机,通过调节热电偶的温度,使得接收机输出的信号功率达到最大;3)测量热电偶的温度、接收机输出信号的功率和输入信号的功率;4)根据功率和温度的大小计算噪声系数。
3.大气热噪声法:大气热噪声法是利用地球大气的热噪声作为外参考源,通过测量输出信号的功率和大气热噪声的温度来计算噪声系数。
测试步骤如下:1)将天线与接收机的输入端相连接;2)选取一个没有无线电源干扰的地点进行测量;3)打开接收机,测量接收机输出信号的功率和大气热噪声的温度;4)根据功率和温度的大小计算噪声系数。
使用外参考源法进行噪声系数测试的优点是测试结果准确,可靠性高。
但同时需要提前准备好相应的外参考源。
二、内参考源法:使用接收机自身内部的参考源来进行噪声系数测试,常用的内参考源包括内部噪声源、参考输入端口和本地参考振荡器等。
噪声系数测量的三种方法
BASESTATIONS / WIRELESS INFRASTRUCTURE WIRELESS, RF, AND CABLE Nov 21, 2003 Three Methods of Noise Figure Measurement Three different methods to measure noise figure are presented: Gainmethod, Y-factor method, and the Noise Figure Meter method. The threeapproaches are compared in a table.IntroductionIn wireless communication systems, the "Noise Figure (NF)," or the related "Noise Factor (F)," defines the noise performance and contributes to the receiver sensitivity. This application note describes this important parameter and details ways to measure it.Noise Figure and Noise FactorNoise Figure (NF) is sometimes ieferred to as Noise Factor (F). The relationship is simply: NF = 10 * log10 (F)DefinitionNoise Figure (Noise Factor) contains the important information about the noise performance of a RF system. The basic definition is:From this definition, many other popular equations of the Noise Figure (Noise Factor) can be derived.Below is a table of typical RF system Noise Figures:CategoryMAXIMProductsNoiseFigure*ApplicationsOperatingFrequencySystemGainLNA MAX26400.9dB Cellular, ISM 400MHz ~1500MHz15.1dBLNA MAX2645HG: 2.3dB WLL 3.4GHz ~ 3.8GHz HG: 14.4dB LG: 15.5dB WLL 3.4GHz ~ 3.8GHz LG: -9.7dBMixer MAX268413.6dB LMDS, WLL 3.4GHz ~ 3.8GHz1dBMixer MAX998212dB Cellular, GSM 825MHz ~915MHz2.0dBReceiver System MAX27003.5dB ~19dBPCS, WLL 1.8GHz ~ 2.5GHz<80dBReceiver System MAX210511.5dB~15.7dBDBS, DVB950MHz ~2150MHz<60dB* HG = High Gain Mode, LG = Low Gain ModeMeasurement methods vary for different applications. As shown in the table above, some applications have high gain and low noise figure (Low Noise Amplifiers under HG mode), some have low gain and high noise figure (mixers and LNAs under LG mode), some have very high gain and wide range of noise figure (receiver systems). Measurement methods have to be chosen carefully. In this article, a Noise Figure Meter as well as two other popular methods - "gain method" and "Y factor method" - will be discussed.Using a Noise Figure MeterNoise Figure Meter/Analyzer is employed as shown in Figure 1.Figure 1.The noise figure meter, such as Agilent N8973A Noise Figure Analyzer, generates a 28VDC pulse signal to drive a noise source (HP346A/B), which generates noise to drive the device under test (DUT). The output of the DUT is then measured by the noise figure analyzer. Since the input noise and Signal-to-Noise ratio of the noise source is known to the analyzer, the noise figure of the DUT can be calculated internally and displayed. For certain applications (mixers and receivers), a LO signal might be needed, as shown in Figure 1. Also, certain parameters need to be set up in the Noise Figure Meter before the measurement, such as frequency range, application (Amplifier/Mixer), etc.Using a noise figure meter is the most straightforward way to measure noise figure. In most cases it is also the most accurate. An engineer can measure the noise figure over a certain frequency range, and the analyzer can display the system gain together with the noise figure to help the measurement. A noise figure meter also has limitations. The analyzers have certain frequency limits. For example, the Agilent N8973A works from 10MHz to 3GHz. Also, when measuring high noise figures, e.g., noise figure exceeding 10dB, the result can be very inaccurate. This method requires very expensive equipment.Gain MethodAs mentioned above, there are other methods to measure noise figure besides directly using a noise figure meter. These methods involve more measurements as well as calculations, but under certain conditions, they turn out to be more convenient and more accurate. One popular method is called "Gain Method", which is based on the noise factor definition given earlier:In this definition, "Noise" is due to two effects. One is the interference that comes to the input of a RF system in the form of signals that differ from the desired one. The second is due to the random fluctuation of carriers in the RF system (LNA, mixer, receiver, etc). The second effect is a result of Brownian motion, It applies in thermal equilibrium to any electronic device, and the available noise power from the device is: P NA = kT F,Where k = Boltzmann's Constant (1.38*10-23 Joules/K),T = Temperature in Kelvin,F = Noise Bandwidth (Hz).At room temperature (290K), the noise power density P NAD = -174dBm/Hz.Thus we have the following equation:NF = P NOUT - ( -174dBm/Hz + 20 * log10(BW) + Gain )In the equation, P NOUT is the measured total output noise power. -174dBm/Hz is the noise density of 290°K ambient noise. BW is the bandwidth of the frequency range of interest. Gain is the system gain. NF is the noise figure of the DUT. Everything in the equation is in log scale. Tomake the formula simpler, we can directly measure the output noise power density (in dBm/Hz), and the equation becomes:NF = P NOUTD + 174dBm/Hz - GainTo use the "Gain Method" to measure the noise figure, the gain of the DUT needs to be pre-determined. Then the input of the DUT is terminated with the characteristic impedance (50 for most RF applications, 75 for video/cable applications). Then the output noise power density is measured with a spectrum analyzer.The setup for Gain Method is shown in Figure 2.Figure 2.As an example, we measure the noise figure of the MAX2700. At a specified LNA gain setting and V AGC, the gain is measured to be 80dB. Then, set up the device as show above, and terminate the RF input with a 50 termination. We read the output noise density to be -90dBm/Hz. To get a stable and accurate reading of the noise density, the optimum ratio of RBW (resolution bandwidth) and VBW (video bandwidth) is RBW/VBW=0.3. Thus we can calculate the NF to be:-90dBm/Hz + 174dBm/Hz - 80dB = 4.0dB.The "Gain Method" can cover any frequency range, as long as the spectrum analyzer permits. The biggest limitation comes from the noise floor of the spectrum analyzer. As shown in theequations, when Noise Figure is low (sub 10dB), (P OUTD - Gain) is close to -170dBm/Hz. Normal LNA gain is about 20dB. In that case, we need to measure a noise power density of -150dBm/Hz, which is lower than the noise floor of most spectrum analyzers. In our example, the system gain is very high, thus most spectrum analyzers can accurately measure the noise figure. Similarly, if the Noise Figure of the DUT is very high (e.g., over 30dB), this method can also be very accurate.Y Factor MethodY Factor method is another popular way to measure Noise Figure. To use the Y factor method, an ENR (Excess Noise Ratio) source is needed. It is the same thing as the noise source we mentioned earlier in the "Noise Figure Meter" section. The setup is shown in the Figure 3:Figure 3.The ENR head usually requires a high DC voltage supply. For example, HP346A/B noise sources need 28VDC. Those ENR heads works are a very wide band (e.g.10MHz to 18GHz for the HP346A/B) and they have a standard noise figure parameter of their own at specified frequencies. An example table is given below. The noise figures at frequencies between those markers are extrapolated.Table 1: Example of ENR of Noise HeadsNF (dB)NF (dB)1G 5.3915.052G 5.2815.013G 5.1114.864G 5.0714.825G 5.0714.81Turning the noise source on and off (by turning on and off the DC voltage), an engineer measures the change in the output noise power density with a spectrum analyzer. The formula to calculate noise figure is:In which ENR is the number given in the table above. It is normally listed on the ENR heads. Y is the difference between the output noise power density when the noise source is on and off. The equation comes from the following:An ENR noise head provides a noise source at two "noise temperatures": a hot T=TH (when a DC voltage is applied) and a cold T=290°K. The definition of ENR of the noise head is:The excess noise is achieved by biasing a noisy diode. Now consider the ratio of power out from the amplifier (DUT) from applying the cold T=290°K, followed by applying the hot T=T H as inputs:Y=G(Th+Tn)/G(290+Tn)=(Th/290+Tn/290)/(1+Tn/290).This is the Y factor, from which this method gets its name.In terms of Noise figure, F=Tn/290+1, F is the noise factor (NF=10*log(F)) Thus, Y=ENR/F+1. In this equation, everything is in linear regime, from this we can get the equation above.Again, let's use MAX2700 as an example of how to measure noise figure with the Y-factor method. The set up is show above in Figure 3. Connect a HP346A ENR noise head to the RF input. Connect a 28V DC supply voltage to the noise head. We can monitor the output noise density on a spectrum analyzer. By Turning off then turning on the DC power supply, the noise density increased from -90dBm/Hz to -87dBm/Hz. So Y=3dB. Again to get a stable and accurate reading of the noise density, RBW/VBW is set to 0.3. From Table 1, at 2GHz, we getENR=5.28dB. Thus we can calculate the NF to be 5.3dB.SummaryIn this article, three methods to measure the noise figure of RF devices are discussed. They each have advantages and disadvantages and each is suitable for certain applications. Below is a summary table of the pros and cons. Theoretically, the measurement results of the same RF device should be identical, but due to limitations of RF equipment (availability, accuracy, frequency range, noise floor, etc), we have to carefully choose the best method to get the correct results.Super low NF Convenient, veryaccurate whenmeasuring super low(0-2dB) NF.Expensive equipment,frequency range limitedVery high Gain or very high NF Easy setup, veryaccurate at measuringvery high NF, suitablefor any frequencyrangeLimited by SpectrumAnalyzer noise floor. Can'tdeal with systems with lowgain and low NF.Wide range of NF Can measure widerange of NF at anyfrequency regardlessof gainWhen measuring Very highNF, error could be large.More InformationMAX2105:QuickView-- Full (PDF) Data Sheet-- Free Samples MAX2640:QuickView-- Full (PDF) Data Sheet-- Free Samples MAX2641:QuickView-- Full (PDF) Data Sheet-- Free Samples MAX2642:QuickView-- Full (PDF) Data Sheet-- Free Samples MAX2643:QuickView-- Full (PDF) Data Sheet-- Free Samples MAX2645:QuickView-- Full (PDF) Data Sheet-- Free Samples MAX2648:QuickView-- Full (PDF) Data Sheet-- Free Samples MAX2649:QuickView-- Full (PDF) Data Sheet-- Free Samples MAX2654:QuickView-- Full (PDF) Data Sheet-- Free SamplesMAX2655:QuickView-- Full (PDF) Data Sheet-- Free Samples MAX2656:QuickView-- Full (PDF) Data Sheet-- Free Samples MAX2684:QuickView-- Full (PDF) Data Sheet-- Free Samples MAX2700:QuickView-- Full (PDF) Data SheetMAX9982:QuickView-- Full (PDF) Data Sheet-- Free Samples。
噪声系数测量方法

噪声系数测量方法
噪声系数是衡量信号与噪声之间的关系的一个重要参数,对于电子设
备的设计和性能评估非常关键。
测量噪声系数的方法有很多种,下面将介
绍几种常用的测量方法。
1.前后噪声对比法:
这是一种最常见的测量噪声系数的方法。
该方法基于一个简单的原理:在测量系统的输入端加上一个噪声发生器,将测量系统的输出与加入噪声
的输入进行对比。
根据对比结果可以计算出噪声系数。
2.两温度法:
该方法基于系统的噪声和两个不同温度的噪声源之间的关系。
首先将
测量系统连接到一个标准噪声源,将噪声标准化到一个已知的温度(通常
为290K),得到一个已知噪声源的噪声系数。
然后将测量系统连接到一
个更热的噪声源(比如一个高温电阻器),再次测量噪声系数。
最终可以
通过这两个噪声系数的比值计算出测量系统的噪声系数。
3.热噪声法:
4.经验法:
这是一种基于经验公式或计算模型来估计噪声系数的方法。
该方法适
用于对于特定类型的电子设备,已经有了较为准确的计算模型,可以通过
模型计算出噪声系数。
需要注意的是,不同的测量方法适用于不同的噪声特性和测量对象。
在进行噪声系数测量时需要考虑设备的工作频率范围、输入输出阻抗匹配
等因素,并选择适当的测量方法。
同时,测量误差也是不可避免的,因此需要在测量过程中采取一些校准和补偿措施来提高测量精度。
噪声测量三种方法
噪声测量三种方法
噪声测量是评估环境或设备所产生的噪音水平和特征的一种方法。
噪声测量可以用于工业环境、建筑工地、交通道路和居民区等场所,以评估噪音对人类健康和环境的潜在影响。
以下是三种常见的噪声测量方法:
1.等效声级测量法(L_eq)
等效声级测量法是评估噪声源在一定时间范围内产生的等效声级的方法。
该方法通常使用声级计进行测量。
测量时,声级计将收集到的声压值转换为分贝(dB)。
然后,根据噪声在一定时间内的持续程度,通过时间加权平均计算出等效声级。
等效声级是将短时间内的噪声测量结果综合为一个长时间范围内的平均声级。
这种方法特别适用于评估工业厂房、机械设备和交通噪音等源。
2. 峰值声级测量法(L_peak)
峰值声级测量法是衡量短时间内噪声突变和尖峰的声级的方法。
峰值声级常用于评估突发性噪声、爆炸声、声音冲击和机械振动等情况。
该方法通过测量噪声源瞬间最大峰值来评估噪声的最大音压水平。
峰值声级是测量瞬时噪声峰值的分贝值,通常用于工作安全和噪声事件的监测。
3.频谱分析测量法
综上所述,等效声级测量法、峰值声级测量法和频谱分析测量法是三种常见的噪声测量方法。
它们通过不同的途径评估噪声源的噪声水平和特征,为噪声控制和监测提供重要依据。
噪声系数测量方法

噪声系数测量方法噪音系数(Noise Coefficient)是衡量噪声传输性能的一个参数,通常用来评估信号与噪声之间的比例。
在通信系统中,噪音系数是评估系统噪声引入程度的重要指标,一般用于评估接收端信噪比的好坏。
噪音系数的测量方法可以分为两类:直接测量法和间接测量法。
一、直接测量法1.热噪声法:该方法利用热噪声的大小与电阻的关系进行测量。
通过将输入电阻与输出电阻相等的简单电路(如电阻、电容、电容-电阻等组合)与待测系统串联,测量电路两端的噪声电压和电流。
根据热噪声计算公式和电路参数计算噪音系数。
2.互相关法:该方法利用信号与噪声的互相关进行测量。
首先,将一个固定频率的标准信号与待测噪声信号输入待测系统,通过互相关算法计算噪声信号与标准信号的相关系数。
根据相关系数与输入和输出信号的功率计算噪音系数。
3.声音法:该方法利用声音在传输过程中受到噪声的影响程度进行测量。
通过将声音传输系统与一个已知信号源相连,测量信号源与被测系统产生的声音之间的功率比值以及噪声功率,根据声音传输系统的增益和噪声功率计算噪音系数。
二、间接测量法1.带宽测量法:该方法利用系统的信号带宽和噪声带宽来计算噪音系数。
首先,通过测量信号源输入系统后输出的信号功率,再通过测量信号源在系统中的发射功率,以及测量系统的噪声功率和噪声带宽,计算系统的噪音系数。
2.信噪比测量法:该方法利用信号与噪声的信噪比进行测量。
首先,将待测系统与一个已知信号源相连,测量输入信号与输出信号的功率比值;然后,测量系统的噪声功率。
根据信号功率比值和噪声功率计算噪音系数。
3.互信息测量法:该方法利用信号与噪声之间的互信息进行测量。
通过测量输入信号和输出信号的互信息,以及测量系统的噪声功率,计算噪音系数。
以上是常用的噪音系数测量方法,每种方法都有其适用的场景和测量条件,在具体应用中需要根据实际情况选择合适的方法。
噪声系数测量手册part2
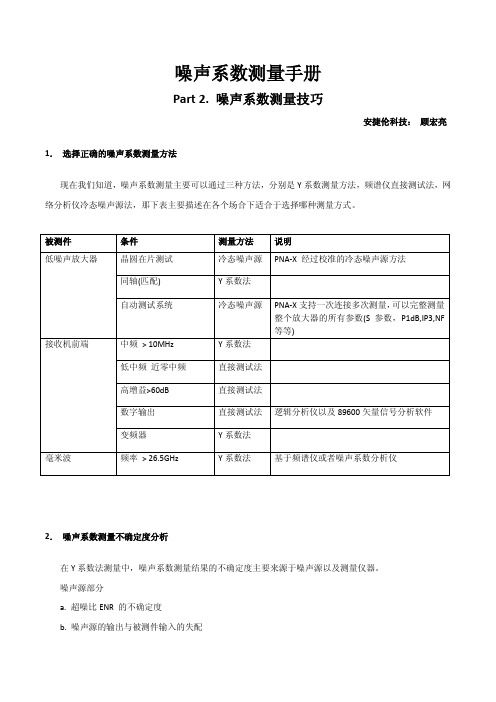
噪声系数测量手册Part 2. 噪声系数测量技巧安捷伦科技:顾宏亮1.选择正确的噪声系数测量方法现在我们知道,噪声系数测量主要可以通过三种方法,分别是Y系数测量方法,频谱仪直接测试法,网络分析仪冷态噪声源法,那下表主要描述在各个场合下适合于选择哪种测量方式。
2.噪声系数测量不确定度分析在Y系数法测量中,噪声系数测量结果的不确定度主要来源于噪声源以及测量仪器。
噪声源部分a. 超噪比ENR 的不确定度b. 噪声源的输出与被测件输入的失配仪器部分a.噪声系数测量不确定度b.增益测量不确定度c.仪表自身噪声系数d.仪表输入端失配Agilent在噪声系数测量不确定度分析上提供给免费的软件可以供用户使用。
具体地址如下所示/noisefigure/NFUcalc.html举例说明如下图所示3.校准完后噪声系数不等于零如果你使用过网络分析仪,那么当你做完直通校准后仪表的S21测量结果一定是0dB。
同样在噪声系数分析仪校准后,因为没有接入任何器件,理论上这个时候显示的噪声系数应该是0dB,增益为0dB。
但是事实上,经常看到校准完之后不为0.根据Y系数法测量的理论,仪表的测量结果如下述公式所示F meas = F DUT + (F NFA– 1)/G DUT当校准完后,没有接入任何器件,这个时候测量得到的F meas= F NFA,G DUT=1。
F NFA = F DUT + (F NFA– 1)/1F DUT = F NFA - (F NFA– 1)/1F DUT = 1 = 0dB现在假设增益测量的抖动为0.01dB,那么转换为线性值为10(0.01/10) =1.00231.同时假设仪表的噪声系数为10dB,转换为线性值为10(10/10) =10,这样计算式为如下所示:F DUT = 10 – (10 – 1)/1.00231=1.02074F DUT = 0.089 dB如果增益的抖动为0.05dB,,那么转换为线性值为10(0.05/10) =1.01158,这种情况下F DUT = 10 – (10 – 1)/ 1.01158=1.10303F DUT = 0.426 dB从上述的关系式可以看到,在校准完后未接入被测件时,只要增益的测量发生一点点变化。
噪声系数的计算及测量方法(三)
噪声系数的计算及测量⽅法(三)下⾯我们将了解下三毫⽶单⽚集成电路的噪声系数测量3 mm由于其波长短,在军事应⽤中有许多优点,因此被⼴泛⽤于精确制导和点到点通信中。
作为各种军⽤电⼦装备其接收端的灵敏度是关键技术指标,⽽接收机灵敏度主要取决于接收机的噪声电平、因此,测量系统的噪声系数是评估电⼦装备系统的关键参数之⼀。
军事预研的3 mm 低噪声单⽚放⼤电路,需要测量其噪声系数。
建⽴3 mm噪声系数测量系统,研究其测量⽅法,实现准确测量是当务之急。
为此本⽂建⽴了92~97 GHz在⽚噪声系数测量系统。
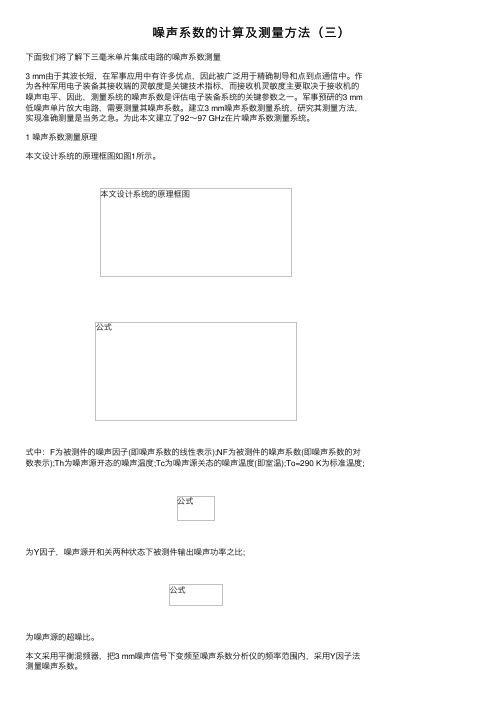
1 噪声系数测量原理本⽂设计系统的原理框图如图1所⽰。
本⽂设计系统的原理框图公式式中:F为被测件的噪声因⼦(即噪声系数的线性表⽰);NF为被测件的噪声系数(即噪声系数的对数表⽰);Th为噪声源开态的噪声温度;Tc为噪声源关态的噪声温度(即室温);To=290 K为标准温度;公式为Y因⼦,噪声源开和关两种状态下被测件输出噪声功率之⽐;公式为噪声源的超噪⽐。
本⽂采⽤平衡混频器,把3 mm噪声信号下变频⾄噪声系数分析仪的频率范围内,采⽤Y因⼦法测量噪声系数。
2 系统设计⽅案2.1 系统构成本设计的系统框图和实物照⽚如图2和图3所⽰。
本设计的系统框图实物照⽚2.2 关键技术(1)加偏置的平衡混频器技术本⽂采⽤平衡混频器,⽤基波混频的⽅式,把3 mm噪声信号变成中频信号。
但⼀般的3 mm平衡混频器的变频损耗在10 dB左右,⽽且要求本振信号达到+13 dBm。
由于3 mm信号发⽣器的技术指标是输出⼤于+3 dBm,因此,很难使混频器正常⼯作,在这样的电平下,混频器的变频损耗增⼤了很多,将⼤于15 dB。
固态噪声源的ENR均⼩于15 dB,因此系统⽆法正常⼯作。
为此,考虑给混频器的本振端⽤直流信号加偏置,以减⼩对本振信号功率电平的要求。
解决了本振信号功率⼩,⽆法⼯作的难题。
同时,平衡混频器还具有端⼝隔离度好的优点,使本振相位噪声的影响也减⼩了。
- 1、下载文档前请自行甄别文档内容的完整性,平台不提供额外的编辑、内容补充、找答案等附加服务。
- 2、"仅部分预览"的文档,不可在线预览部分如存在完整性等问题,可反馈申请退款(可完整预览的文档不适用该条件!)。
- 3、如文档侵犯您的权益,请联系客服反馈,我们会尽快为您处理(人工客服工作时间:9:00-18:30)。
Y = G(Th + Tn)/G(290 + Tn) = (Th/290 + Tn/290)/(1 + Tn/290
这就是Y因数法,名字来源于上面的式子。
根据噪声系数定义,F = Tn/290+1,F是噪声因数(NF = 10 * log(F)),因而,Y = ENR/F+1。在这个公式中,所有变量均是线性关系,从这个式子可得到上面的噪声系数公式。
Y因数法
Y因数法是另外一种常用的测量噪声系数的方法。为了使用Y因数法,需要ENR (冗余噪声比) 源。这和前面噪声系数测试仪部分提到的噪声源是同一个东西。装置图见图3:
图3.
ENR头通常需要高电压的DC电源。比如HP346A/B噪声源需要28VDC。这些ENR头能够工作在非常宽的频段(例如HP346A/B为10MHz至18GHz),在特定的频率上本身具有标准的噪声系数参数。下表给出具体的数值。在标识之间的频率上的噪声系数可通过外推法得到。
在公式中,PNOUT是已测的总共输出噪声功率,-174dBm/Hz是290°K时环境噪声的功率谱密度。BW是感兴趣的频率带宽。增益是系统的增益。NF是DUT的噪声系数。公式中的每个变量均为对数。为简化公式,我们可以直接测量输出噪声功率谱密度(dBm/Hz),这时公式变为:
NF = PNOUTD + 174dBm/Hz - 增益
增益法
前面提到,除了直接使用噪声系数测试仪外还可以采用其他方法测量噪声系数。这些方法需要更多测量和计算,但是在某种条件下,这些方法更加方便和准确。其中一个常用的方法叫做“增益法”,它是基于前面给出的噪声因数的定义:
在这个定义中,噪声由两个因素产生。一个是到达射频系统输入的干扰,与需要的有用信号不同。第二个是由于射频系统载波的随机扰动(LNA,混频器和接收机等)。第二种情况是布朗运动的结果,应用于任何电子器件中的热平衡,器件的可利用的噪声功率为:
噪声系数测量的三种方法
摘要:本文介绍了测量噪声系数的三种方法:增益法、Y系数法和噪声系数测试仪法。这三种方法的比较以表格的形式给出。
在无线通信系统中,噪声系数(NF)或者相对应的噪声因数(F)定义了噪声性能和对接收机灵敏度的贡献。本篇应用笔记详细阐述这个重要的参数及其不同的测量方法。
噪声指数和噪声系数
噪声系数(NF)有时也指噪声因数(F)。两者简单的关系为:
NF = 10 * log10 (F)
定义
噪声系数(噪声因数)包含了射频系统噪声性能的重要信息,标准的定义为:
从这个定义可以推导出很多常用的噪声系数(噪声因数)公式。
下表为典型的射频系统噪声系数:
在这个式子中,ENR为上表给出的值。通常ENR头的NF值会列出。Y是输出噪声功率谱密度在噪声源开启和关闭时的差值。
这个公式可从以下得到:
ENR噪声头提供两个噪声温度的噪声源:热温度时T = TH (直流电压加电时)和冷温度T = 290°K。ENR噪声头的定义为:
冗余噪声通过给噪声二极管加偏置得到。现在考虑在冷温度T = 290°K时与在热温度T = TH时放大器(DUT)功率输出比:
PNA = kTΔF,
这里的k = 波尔兹曼常量(1.38 * 10-23焦耳/ΔK),
T = 温度,单位为开尔文
ΔF = 噪声带宽(Hz)
在室温(290ΔK)时,噪声功率谱密度PNAD = -174dBm/Hz。
因而我们有以下的公式:
NF = PNOUT - (-174dBm/Hz + 20 * log10(BW) + 增益)
-90dBm/Hz + 174dBm/Hz - 80dB = 4.0dB
只要频谱分析仪允许,增益法可适用于任何频率范围内。最大的限制来自于频谱分析仪的噪声基底。在公式中可以看到,当噪声系数较低(小于10dB)时,(POUTD - 增益)接近于-170dBm/Hz,通常LNA的增益约为20dB。这样我们需要测量-150dBm/Hz的噪声功率谱密度,这个值低于大多数频谱仪的噪声基底。在我们的例子中,系统增益非常高,因而大多数频谱仪均可准确测量噪声系数。类似地,如果DUT的噪声系数非常高(比如高于30dB),这个方法也非常准确。
Category MAXIM Products Noise Figure* Applications Operating Frequency System Gain
LNA MAX2640 0.9dB Cellular, ISM 400MHz ~ 1500MHz 15.1dB
LNA MAX2645 HG: 2.3dB WLL 3.4GHz ~ 3.8GHz HG: 14.4dB
Receiver System MAX2700 3.5dB ~ 19dB PCS, WLL 1.8GHz ~ 2.5GHz < 80dB
* HG = 高增益模式,LG = 低增益模式
噪声系数的测量方法随应用的不同而不同。从上表可看出,一些应用具有高增益和低噪声系数(低噪声放大器(LNA)在高增益模式下),一些则具有低增益和高噪声系数(混频器和LNA在低增益模式下),一些则具有非常高的增益和宽范围的噪声系数(接收机系统)。因此测量方法必须仔细选择。本文中将讨论噪声系数测试仪法和其他两个方法:增益法和Y系数法。
总结
在本篇文章讨论了测量射频器件噪声系数的三种方法。每种方法都有其优缺点,适用于特定的应用。下表是三种方法优缺点的总结。理论上,同一个射频器件的测量结果应该一样,但是由于射频设备的限制(可用性、精度、频率范围、噪声基底等),必须选择最佳的方法以获得正确的结果。
使用噪声系数测试仪是测量噪声系数的最直接方法。在大多数情况下也是最准确地。工程师可在特定的频率范围内测量噪声系数,分析仪能够同时显示增益和噪声系数帮助测量。分析仪具有频率限制。例如,Agilent N8973A可工作频率为10MHz至3GHz。当测量很高的噪声系数时,例如噪声系数超过10dB,测量结果非常不准确。这种方法需要非常昂贵的设备。
使用噪声系数测试仪
噪声系数测试/分析仪在图1种给出。
图1.
噪声系数测试仪,如Agilent的N8973A噪声系数分析仪,产生28VDC脉冲信号驱动噪声源(HP346A/B),该噪声源产生噪声驱动待测器件(DUT)。使用噪声系数分析仪测量待测器件的输出。由于分析仪已知噪声源的输入噪声和信噪比,DUT的噪声系数可以在内部计算和在屏幕上显示。对于某些应用(混频器和接收机),可能需要本振(LO)信号,如图1所示。当然,测量之前必须在噪声系数测试仪中设置某些参数,如频率范围、应用(放大器/混频器)等。
为了使用增益法测量噪声系数,DUT的增益需要预先确定的。DUT的输入需要端接特性阻抗(射频应用为50Ω,视频/电缆应用为75Ω)。输出噪声功率谱密度可使用频谱分析仪测量。 来自增益法测量的装置见图2。
图2.
作为一个例子,我们测量MAX2700噪声系数的。在指定的LNA增益设置和VAGC下测量得到的增益为80dB。接着,如上图装置仪器,射频输入用50Ω负载端接。在频谱仪上读出输出噪声功率谱密度为-90dBm/Hz。为获得稳定和准确的噪声密度读数,选择最优的RBW (解析带宽)与VBW (视频带宽)为RBW/VBW = 0.3。计算得到的NF为:
LG: 15.5dB WLL 3.4GHz ~ 3.8GHz LG: -9.7dB
Mixer MAX2684 13.6dB LMDS, WLL 3.4GHz ~ 3.8GHz 1dB
Mixer MAX9982 12dB Cellular, GSM 825MHz ~ 915MHz 2.0dB
表1. 噪声头的ENR
HP346A HP346B
Frequency (Hz) NF (dB) NF (dB)
1G 5.39 15.05
2G 5.28 15.01
3G 5.11 14.86
4G 5.07 14.82
5G 5.07 14.81
开启或者关闭噪声源(通过开关DC电压),工程师可使用频谱分析仪测量输出噪声功率谱密度的变化。计算噪声系数的公式为:
我们再次使用MAX2700作为例子演示如何使用Y因数法测量噪声系数。装置图见图3。连接HP346A ENR到RF的输入。连接28V直流电压到噪声源头。我们可以在频谱仪上监视输出噪声功率谱密度。开/关直流电源,噪声谱密度从-90dBm/Hz变到-87dBm/Hz。所以Y = 3dB。为了获得稳定和准确的噪声功率谱密度读数,RBW/VBW设置为0.3。从表2得到,在2GHz时ENR = 5.28dB,因而我们可以计算NF的值为5.3dB。