McKinseySolutions_OHI
能效提升方案
设置密码,密码必须符合以下条件
▪ ▪ ▪ ▪
至少8位字元 至少一位数字 包含至少一个下列的特别符号:&, #, -, @, + , =, $, %, !, *, _ 至少一位大写字母
例如:Abcd_00000 收藏或保存RedE网址
https:///uers/sign_in
SOURCE:
McKinsey & Company
| 15
获取更多信息和支持
查询 整个应用里有多处帮助按钮,在任何部分点击帮助都能找 到详细的功能解释和选项
访问帮助中心 从这里开始导航搜索RedE的最佳使用方法以及各项功能介 绍的最新文件和视频
联络我们
向RedE支援团队提供反馈或请求说明 rede_operations@mckin
步骤
1 设置
主要活动
输入工厂基本数据; 公用 事业消耗和主要设备单元 选择相关的经济可行的建 议杠杆 用具体的运行数据更新每 个杠杆的商业案例 确定项目时间计划, 实施 和更新已知的资本投资 基于实际运行数据的更新 的节约 无:项目完成,节约确认
本步骤的杠杆: None
可查看的信息: N/A 基于市场参考的、潜在可实施的项目 数量和价值 一线用户所选择的、无实际运行数据 的适用项目的数量和效果 基于运营数据,无更新的资本投资数 据的、正在运行的项目数量和效果 已完成项目的数量和效果, 等待实施后的 实际运行数据更新项目成效。 已完成项目的数量和效果 真实节约, 效率, 和在同行中的表现, 汇集 到项目业主和仪表板
由于高资本 RedE中工 支出和低投 厂实施的 资回报率而 杠杆数量 抛弃的杠杆 数量 0.6 1.2
2.9
0.8
0.3
0.9
迈陶科学美国:超自动蒸馏WG270水净化器产品说明书

Yamato Scientific AmericaInnovating Science for Over 125 YearsYamato Scientific America Inc.113CATV1-201701Yamato Scientific America Inc.Water PurifierHigh purity water purifiers with various water treatment processes and production volume for different laboratory needsPure water and ultra pure waterHigh purity water purifier can meet wide range of laboratory needsBesides H 2O, tap water contains various impurities which need to be removed to prevent interfering with research and experiment operations. Water in which impurities such as inorganic ions and organic substances remain are expressed in mg / L (ppm) or less, and is referred to as pure water. Water which is further purified is expressed in units of ppb, ppt and is referred to as ultra pure water.For example, Type1 / A4 level pure water can cover all applications from Type1 to Type4 (ASTM D 1193) / A1 to A4 (JIS K 0557) levels.Yamato Scientific's water purifier is designed to produce Type1 / A4 level of both distilled water and deionized water. Meanwhile, models which can produce higher-level ultra pure water such as TOC reduction water and pyrogen-reduced water are also available. Customers can choose based on theirspecific needs.Labo Cube® WL320 installation exampleLabo Cube® water purifierSpace-saving water purifier that can be installed under a fume hood or sink, or on a table; either as a Pure Line® water purifierNon-heating ultra pure water purifiers in combination with reverse osmosis membrane, ion exchange Auto Still® water purifierAuto Still water purifiers are a combination of ion exchange through filters and distillation to produce the desired type of water quality. Deionized water is produced through various types of filters from raw Water Purifier Summary114CATV1-201701:Distilled water :Deionized waterPurified Water Usage*2. Measured by directly introducing water delivery port into electrical conductivity*3. When connected directly to final ion-exchange device and introducing water delivery port into electrical conductivity, electrical conductivity is 0.01mS/m (or 0.1µS/cm) (at 25°C)Yamato Scientific America Inc.Water Purifier Summary 115CATV1-201701WA570/730FeaturesWG270WG203WG250B/1000Yamato Scientific America Inc.WS200/220WL200/220/220TWL320A/320B Water Purifier Summary 116CATV1-201701Equipped with Ion exchange water system, TOC reduction UV lamp and Yamato’s original TOC (Total Organic Carbon) degradation systemCapacity of distilled water storage tank: 20L Easy to read panel displayDisplays replacement of consumables and its exchange history Water sampling tray is equipped with a drainage system to eliminate concerns about discharge of overflowing water Feed and drain can be connected on both sidesStandard equipped with membrane filter (0.1µm hollow fiber membrane) to protect pure water production from contamination Easy maintenance as most consumables can be easily attached and detachedYamato Scientific America Inc.system, distilled water in the storage tank is always kept at Type 2 / A4 level.WG270117CATV1-201701Control PanelWater supply port unit Drain TrapStandWater sampling hose unitHose length 2m, 0.1µmIon exchange resin High purity cartridge Membrane filter TOC reduction UVlampDeaerating filter Tank air vent filterPre-treatment cartridge12345 Optional itemsConsumable PartsWG270Yamato Scientific America Inc.CATV1-201701118Low TOC standard modelsWG250BWG1000*1. Protrusions not included *2. OptionalEasy to use tray for product water intakeYamato Scientific America Inc.Membrane Filter (Standard)Ion-exchange resin life span test (resistivity)Deionized waterDeionized waterWG250B/1000119CATV1-201701Raw waterDrain trap OWI10+stand AS250Product water hose (OWG24)Feed water connection (OWH10)Membrane filter MFRL727Air vent filter for tank AVF-1cartridge (PWF-1) removes trihalomethane and achieves higher water quality (2) Ion-exchange resin cartridge (CPC-S)2413Yamato Scientific America Inc.WG250B/1000CATV1-2017011205904551351557039Membrane filter Tank air vent filterAVF-1 (4210)organic and dustHigh performance ion-exchange resin cartridge (CPC-S, 4L) brings high purity water with low electric conductivity and TOC Optional membrane filter at water sampling port Displays replacement of consumablesFeed / Drain water connectors on both sides* Protrusions not included.Drain trap + StandStand Water supply port unit * Please specify when ordering main unit.Yamato Scientific America Inc.WG203CATV1-201701121 Yamato Scientific America Inc.122 CATV1-201701ASTM D1193 Type1 / JIS K 0557 A4 levelhigh purity water with reduced TOC valueEmploys microprocessor which auto-matically controls all processes fromsupplying of water, ion exchange anddistillation to storageEquipped with high performance pre-treatment cartridge (activated charcoal +0.1µm hollow fiber membrane) for highquality waterStandard equipped with 0.1µm hollowfiber membrane filter at water samplingports which protects pure water deliveryfrom contaminationInitial distilled water drainage, automaticboiler cleaning and drainage device forstable quality of distilled waterSafety device includes low-water boilingprevention, overheat prevention, waterleak detector, earth leakage circuitbreakerWA570WA730(1)(2)(3)Water supply port unitHigh purity cartridgePre-treatment cartridge Ion-exchange resin cartridgeWS200WS220Simple and economical water purifier designed for distilled water productionSpace saving and compactBy adopting splash prevention design, impurities are prevented from mixing with the distilled water, resulting to a stable water quality D esigned with empty boiling prevention and overheat prevention functionsSuitable as washing water for cleaning tools, glassware, etc.*Protrusions not includedOptional itemsConsumable partsMembrane filterPre-treatment cartridge Water sampling stand Foot switchIon-exchange resin cartridge CPC-TReverse osmosis (RO) membrane cartridge setCollecting deionized water is as simple as connecting to a faucetBenchtop, space-saving design Digital display for easy operationDeionized water compliant with ASTM D1193 Type 2 / JIS K 0557 A3 level, suitable for trace analysisDisplays replacement of consumablesStandard equipped with membrane filter (WL200/220)A solenoid valve at the water sampling port prevents water leakage from final membrane filterWL220T is equipped with constant temperature control and pure water tank. Constant tempera-ture and deionized water delivery to pure water tank controlled by electromagnetic valve*Protrusions not included.WL200WL220WL220TSpecificationsWater supply port unit OWH10Shelf plate (OWL50): used when WL220T is placed on top of the constant temperature control plateConsumablesMembrane filter CPC-P Ion exchange resin cartridge CPC-E Ion exchange resin cartridgeWL220Ton a tableDeionized water compliant with ASTM D1193 Type2/ JIS K 0557 A4 level, suitable for high sensitivitytrace analysisEasy operating digital displayStandard equipped with membrane filter at waterfeeding portEquipped with water leak detection function thatstops water supply in case water leak occurs, byactivating the electric leakage breakerDisplays replacement of consumablesWL320Bare required: WL320 + 253277 + 253276 (with foot switch)(1) (2)Foot switch (optional)Water Quality AnalysisItemASTM D 1193 Standard Type 1JIS K 0057Standard A4Electrical conductivity (µS/cm)<0.056<1Organic carbon (µg /l)<50<50Zinc (µg Zn/l)-<0.1Silica (µg SiO 2/l)<3<2.5Chloride ion (µ Cl _/l)<1<1_。
WAVE系统介绍-原版

1
2
3
3. My recent updates lists any initiatives or actions you have edited in the last 7 days. Click an item to open it. 4. All initiatives shows all the initiatives of the project, with some key information (Progress, Owner, Last modification date…) 5. All actions shows shows all the initiatives of the project, with some key information (Progress, Owner, Last modification date…)
Contents of this user guide
Topic
Page #
▪
▪ ▪ ▪ ▪ ▪ ▪
Wave overview and key concepts
Basic navigation and Dashboard Content Explorer : Initiatives and Actions Creating a new Initiative Tracking Impact Reports
SOURCE: Wave team
Email: support@
McKinsey & Company
| 2
Key concepts in Wave
Wave is structured along two key elements: Initiatives and Actions An initiative can be defined as an improvement opportunity within the overall project. Initiatives are the “what” as in “What should we do?”. Initiatives themselves can be grouped e.g. by business unit, function, theme or geography by using initiative attributes or so-called “project structures”. Each initiative could potentially have impact on one or more key business metrics such as cost or revenue. An action is a task which must be executed in order to implement an initiative. Actions are the “how” as in “How will we do it?” Each action sits within one specific parent initiative. Each initiative can have multiple actions (or even none), and an action cannot exist without a parent initiative.
Manufacturing_and_Construction

R&D Pathway 4 C Current t St State-of-the-Art t f th A t
Target Innovation 1. Pre‐Planning & Lessons Learned (OE) Reinforcing Steel Density Reduction Reinforcing Steel Prefabrication Lifting and Rigging Current State Excellent progress in Japanese program and in US nuclear major component replacements. To be proven in US nuclear new build. Utility early project cash flow restrictions may be an impediment. Recent developments in commercial sector with use of high strength reinforcing steel and “headed headed rebar rebar”. Japanese program is getting great benefit from reinforcing steel prefabrication and use of “SC” walls. Large crane concept has been proven in Japanese program. Needs are for “flexible” flexible large crane approaches and increasing lifting speeds for very heavy components. Both are in development. Prefabrication is prevalent, modularization is gaining momentum, manufacturing is yet to be exploited but represents significant opportunity. Considerable progress in last five years in the availability of modeling software (BIM). Extensive Japanese use of models for planning. Wide acknowledgement that these are valuable and will be utilized in new nuclear nuclear.
constructionandbuildingmaterials
constructionandbuildingmaterialsBehavior and mix design development of concrete made with recycled aggregate from deconstructed lead-contaminated masonry materialsJ.Hu a ,?,K.Wang b ,J.A.Gaunt ba Department of Engineering Technology,Texas State University-San Marcos,San Marcos,TX 78666,United StatesbDepartment of Civil,Construction and Environmental Engineering,Iowa State University,Ames,IA 50011,United Statesa r t i c l e i n f o Article history:Available online xxxx Keywords:Aggregate Cement Concrete Lead Masonry Nomograph Recycleda b s t r a c tThe present study is to develop an effective method for using deconstructed,lead-contaminated masonry materials in new concrete so as to minimize the environmental impact,cost,and time of the deconstruc-tion.The approach to this method is to use crushed masonry materials to replace natural aggregate in conventional concrete.Two different types of masonry materials (concrete blocks and clay bricks)were collected,painted with lead-based paint (LBP),and then crushed to simulate recycled LBP-contaminated masonry materials.Three types of cement (type I Portland cement,Calcium Sulfoaluminate (CSA)cement,and Portland cement with 5%phosphate addition)were selected for sequestering lead in the recycled aggregate.A concrete mix design matrix was developed with different water-to-cement ratios (w/c),aggregate-to-cement ratios (a/c),types of cements,and types of masonry materials.Based on the test results,mix design nomographs were developed for concrete made with the recycled,LBP-contaminated masonry materials.The results indicate that the lead can be sequestered,or rendered non-leachable,due to the high alkalinity of cement.The concrete therefore no longer has the toxicity characteristic for lead and is suitable for various types of new construction,such as foundation and pavement,reinforced beams,columns,and walls.ó2012Elsevier Ltd.All rights reserved.1.IntroductionIn the United States,many masonry structures built before 1980s contain lead-based paint (LBP),which causes a considerable environmental and health concern.Both the US Environmental Protection Agency (EPA)and the Occupational Safety and Health Administration (OSHA)have established regulations governing the management of LBP in buildings.Deconstruction of these struc-tures is often time consuming and costly due to the paint removal and the hazardous material disposal [1–3].Clearly,a more cost effective,environmentally friendly method is urgently needed for remediating and reusing deconstructed masonry materials con-taminated with LBP.From a chemical point view,the degree of the hazard resulting from LBP is often de?ned by the solubility of lead in a material.The solubility of lead in a material is generally controlled by the pH or alkalinity of the material.The Eh–pH diagram for an aqueous lead-carbonate system indicates that lead will be insoluble if the system has a pH value above 6or 7[4–6].In a cement-based material,the pH values of pore solutions often range from 11to 13,thus possi-bly sequestering lead in the material.Using the above-mentioned concept,a study has been con-ducted to sequester lead by recycling the lead-contaminated deconstruction masonry materials as concrete aggregate.A key of this study is to design rational mix proportions so that the concrete cannot only sequester lead in the recycled aggregate but also meet general concrete construction and structural performance require-ments,such as having proper workability and strength.This paper presents a rational mix design method for proportioning non-hazardous,well-performing,sustainable concrete utilizing the recycled,lead-contaminated aggregate for ?eld construction.The mix design development includes three major steps:(1)characterizing the recycled masonry materials –evaluating their toxicity,speci?c gravity,absorption,and strength,(2)proportion-ing concrete mixtures based on workability control –designing concrete mixtures to have low,medium and high slumps so as to permit the concrete to be used for different construction applica-tions,and (3)performance evaluation –examining the lead leach-ing ability or sequestering effectiveness and strength of the concrete containing recycled,lead-contaminated deconstruction masonry materials.As a result,a series of mix design nomograms are established that illustrate the relationships between the mix proportion parameters (such as water-to-cement ratio,aggre-gate-to-cement ratio,and cement content)and concrete perfor-mance (such as lead sequestering effectiveness and strength).0950-0618/$-see front matter ó2012Elsevier Ltd.All rights reserved.doi:10.1016/j.conbuildmat.2011.07.067Corresponding author.Tel.:+15122456328;fax:+15122453052.E-mail address:jiong.hu@/doc/0fc77951804d2b160b4ec0fb.html (J.Hu).prepared (Table 2).Air entraining agent with the recommended dosage was used in all of the concrete mixes studied.2.3.Test methodsPhysical properties of the masonry materials were characterized,and their total and leachable lead contents were evaluated.The speci?c gravity and absorption of the crushed masonry materials were measured according to ASTM C127and ASTM C128.Sieving analysis and bulk density (unit weight)tests were conducted for the painted and crushed masonry materials according to ASTM C136,and ASTM C29respectively.The leachability of lead from the LBP-painted recycled aggregates and the concrete mixes made with those aggregates was tested using the Toxicity Characteristic Leaching Procedure (TCLP),EPA Method 1311[9].The total lead con-tent in the materials was also evaluated using the California Waste Extraction Test (WET)[10].Concrete was mixed based on the ASTM C192multiple-step mixing procedure.The slump of fresh concrete was measured according to ASTMC143immediately after mixing.In this study,the slump test was not only a measurement to evaluate the workability of concrete,more importantly,the slump value was used as a con-trol parameter for concrete mix design.Different slumps are required for different concrete construction applications.Concretes with three different ranges of slumps were designed:(1)25–50mm slump for low workability concrete (generally used for pavements and slabs),(2)75–100mm slump for medium workability concrete (generally used for beams,walls,columns,reinforced concrete),and (3)150–175mm slump for high workability concrete (generally used for heavily reinforced components with complicated shapes).The entire sample preparation and curing process followed ASTM C192.Compressive strength of hardened concrete was tested at the age of 3,7and 28days according to ASTM C39.The broken specimens from compression testing were further processed and then used for the TCLP soluble and total lead content (WET)tests.3.Results and discussion3.1.Characterization of recycled,LBP-contaminated aggregate Table 3presents the physical properties and lead content of the lead-contaminated masonry materials used.The test results indi-Table 1Oxide and chemical composition of cement (%).CaOSiO 2Al 2O 3Fe 2O 3MgO SO 3TiO 2Oxide composition (%)Portland cement 62.9620.96 4.54 3.48 2.91 2.77–CSA cement40.00 5.5537.50 1.50 1.7510.00 1.25C 3SC 2S C 3A C 4AF Gypsum Ca 4Al 6O 12SO 4Chemical composition (%)Portland cement 53.7119.58 6.1410.590.78–CSA cement0.4212.5910.64–1.0773.37Fig.1.Painting with LBP.Fig.2.Crushing of LBP contaminated masonry materials.cated that the recycled masonry materials had lower speci?c grav-ity (2.34–2.39)than natural aggregate (2.5–2.9),while the absorp-tion of the recycled aggregate (5.11–7.11%)was much higher than natural aggregate (0.2–4.0%)[11,12].The void contents of the four(a) Masonry A (b) Masonry BTable 2Concrete mix proportions.CementMasonry a/c w/c C (kg/m 3)Cement Masonry a/c w/c C (kg/m 3)1Portland A 3.00.2850025Portland C 6.00.362662Portland A 3.00.3145626Portland C 6.00.422653Portland A 3.00.3247727Portland C 6.00.442554Portland A 4.50.3234828Portland D 3.00.394835Portland A 4.50.3433029Portland D3.00.434756Portland A4.50.3732130Portland D 3.00.484367Portland A 6.00.3426531Portland D 4.50.503408Portland A 6.00.3626632Portland D4.50.523299Portland A 6.00.4125433Portland D 4.50.5633410Portland B 3.00.3450634Portland D 6.00.5626711Portland B 3.00.3547135Portland D 6.00.6025712Portland B 3.00.4047336Portland D 6.00.7425313Portland B 4.50.3935137CSA B 3.00.4546814Portland B 4.50.4231838CSA B4.50.4635415Portland B 4.50.4831739CSA B 6.00.5026916Portland B 6.00.4526940CSA D 3.00.4647017Portland B 6.00.4825641CSA D4.50.5134918Portland B 6.00.5523642CSAD 6.00.6126519Portland C 3.00.3049943Phosphate B 3.00.3748320Portland C 3.00.3348644Phosphate B 4.50.4134921Portland C3.00.3647545Phosphate B 6.00.4925322Portland C4.50.3333946Phosphate D 3.00.4347323Portland C 4.50.3634447Phosphate D 4.50.5333624 PortlandC4.50.3933448PhosphateD6.00.62263Note :Here,a/c is aggregate-to-cement ratio;w/c is water-to-cement ratio;and C is cement factor.J.Hu et al./Construction and Building Materials xxx (2012)xxx–xxx3and 10.1g/Kg,larger than 1g/Kg,which shall be de?ned as hazard materials based on the California regulation.masonry C and D had TCLP lead content of 142and 77mg/L and the total lead content from WET tests of 12.5and 5.82g/Kg,which were de?ned as haz-ard materials based on both the RCRA and California regulations.The critical issue in the present study is to ?nd out whether or not the concrete made with these hazard materials still have tox-icity characteristic.3.2.Lead content and lead leachability of concreteThe above mentioned lead-contaminated masonry materials were crushed and used as aggregate in the concrete mixes as de-signed in Table 1.The TCLP lead,TCLP pH and total lead of the 48designed mixes were determined at the concrete age of 28-days.Results of compressivestrengths,together with lead content and lead leachability of all 48mixes can be found in Table 4.Detailed test results and analysis can be found in Wang et al.[8].Fig.5presents the TCLP pH value and leachable Pb content of concrete mixes studied.Although the total lead in the concrete mixes were high (up to 2.2%),the ?gure shows that all concrete mixes studied,except four mixes with masonry material D,had TCLP leachable Pb content less than1mg/L,much lower than the RCRA limit of 5mg Pb/L.As a result,these concrete mixes are con-sidered as nonhazardous materials under RCRA although their aggregate is hazardous.The four mixes that showed hazard charac-teristic were mixes 34and 36(Table 1),which had a high a/c(6.0)and low Portland cement content (267and 253kg/m 3)and mixes 40and 42,which was made of CSA cement with a/c of 6.0and3.0respectively.The result is probably due to the fact that the CSA cement was less alkaline than Portland cement,and the con-crete made with CSA cement had lower pH values than the corre-sponding concrete made with Portland cement,thus being less effective for sequestering lead in the concrete.A mix design withhigher cement content or high alkaline cement may be used to in-crease the alkalinity of the concrete and reduce its TCLP Pb value.Addition of5%phosphate in Portland cement did not signi?-cantly change the TCLP lead concentrations and total lead in the concrete.It is believed that if highly insoluble hydroxypyromorph-ite [Pb 5(PO 4)3OH]was formed in the concrete system through the lead phosphate reaction,it would have sequestered lead from the highly acidic conditions of the total lead test.This might have sug-gested a means for rendering LBP-contaminated masonry nonhaz-ardous under California law.This reaction,however,did not occur in the present study.The concentrations of phosphate added ran-ged from 31%to 62%of the amounts needed to stoichiometrically convert the lead in the concrete to hydroxypyromorphite but did not result in proportionate reductions in detectable total /doc/0fc77951804d2b160b4ec0fb.html pressive strength of concreteCompressive strength of all concrete mixes was tested at ages of 3days,7days,and 28days.Fig.6illustrates the effects of materials and mix parameters on the concrete strength.The trends of the ef-fects were similar for the concrete at three different testing ages.Generally,concrete strength decreased with increased water-to-cement ratios (w/c)and aggregate-to-cement ratios (a/c).As observed in Fig.6,for a given w/c,masonry B and D resulted in higher concrete strength than masonry A and C,which is prob-ably related to the concrete workability and strength of the recy-cled aggregate,respectively.For a given mix proportion,concrete made with CSA cement provided higher early age compressive strength than the corresponding concrete made with Portland ce-ment.The large strength and workability ranges imply that,with appropriate design,the concrete made with recycled aggregate from deconstructed masonry materials can be used for variousTable 3Physical properties and lead content of lead-contraindicated masonry materials.Concrete blocks Clay bricks AB C D Speci?c gravity 2.34 2.39 2.37 2.39Absorption (%)7.70 5.95 6.52 5.11Voids between aggregate particle (compacted)(%)36.7937.2041.3239.92Voids between aggregate particle (uncompacted) (%)38.5241.9847.746.33Compressive strength (MPa)21.0732.7973.65101.53TCLP pH6.737.02 5.11 4.88TCLP Pb,mg/L (toxicity limit:5mg/L) 4.17 1.2914277WET Total Pb,g/Kg (toxicity limit:1g/Kg)15.410.112.55.82Note :The underlined values indicate that these materials are classi?ed as toxic materials based on RCRA or California regulations.4.Gradation of the aggregate recycled masonry materials studied.(Note:DOT-C3and C4are natural aggregate used for conventional pavement concrete USA)types of constructions,such as foundation,pavement,reinforced beams,columns,and walls.A cost effective analysis by the authorsshowed that a signi?cant saving can be achieved by using LBP-con-taminated masonry materials as recycled aggregate in concrete.The cost savings may result from eliminating LBP removal and waste material disposal,which will minimize the use of secure land?lls,eliminate the time and equipment required for sieving and re-grading recycled aggregate,and reduce natural aggregate consumption for concrete construction.Details of this cost effec-tive analysis can be found in a separated publication [13].4.Mix design nomograph developmentIn the present study,a nomograph was developed for concrete made with each type of recycled,LBP-contaminated aggregate and/doc/0fc77951804d2b160b4ec0fb.html ing the mix design nomograph,proper mix propor-tions can be selected for the desired workability and strength.The nomograph combines three relationships developed for the prop-erties of fresh and hardened concrete into one graph.The mix de-sign nomograph uses three correlations:Abrams’law,Lyse’s law,and Molinari’s law [14,15].Abrams’law correlates the compressive strength of concrete with the w/c as:f 0c ?k 1k w =c2e1Twhere k 1,and k 2are constants depending on the materials used.Lyse’s law correlates the water-to-cement ratio (w/c)with the aggregate-to-cement ratio (a/c)(by weight)as:ea =c T?k 3ew =c Ttk 4e2Twhere a/c is the aggregate-to-cement ratio,k 3,and k 4are constants depend on the materials used.Molinari’s law correlates the cement content and aggregate-to-cement ratio as:C ?1000k 5ea =c Ttk 6e3Twhere C is the cement content,k 5,and k 6are constants depend on the materials used.Fig.6shows samples of general mix design nomograph.The nomograph can be used to determine the concrete mix proportion (a)for a given compressive strength but different workability (slump)requirements (Fig.7a)or (b)for a given workability but different strength requirements (Fig.7b).As shown in Fig.6a,according to the required compressive strength f 0c ;1;2;3,one can determined the w/c for concrete mixtures (w/c1,2,3)throughTable 4Compressive strength,lead content and lead-leachability of concrete mixtures.f 0c ;3(MPa)f 0c ;7(MPa)f 0c ;28(MPa)TCLP pH TCLP Pb (mg/L)Total Pb(g/Kg)124.730.035.211.050.4219.6216.720.926.611.430.3216.1318.022.025.911.160.3016.0412.615.820.610.610.3217.158.211.514.011.270.2716.06 6.610.012.611.360.4916.07 5.67.310.310.780.0621.48 5.68.812.010.690.0520.69 4.5 6.59.110.410.3817.31031.535.846.011.011.168.371121.126.334.211.412.1910.41219.325.032.611.190.499.11313.718.523.511.070.359.0149.412.816.111.33 1.088.515 6.49.311.910.871.210.78168.310.514.610.850.2510.1117 5.37.410.011.25 1.2710.76182.93.9 5.610.89 1.110.821922.326.032.810.910.758.872018.625.430.310.961.168.02115.318.227.411.23 1.097.6228.113.419.610.220.277.623 6.210.913.810.60.948.6824 4.88.915.510.570.447.5250.07.29.58.042.419.67260.0 4.37.69.68 1.369.99270.0 2.5 5.49.79 1.189.172828.433.338.0110.834.192922.331.340.911.150.16 4.43015.019.826.410.980.765.23113.816.728.211.460.95 5.03212.015.923.810.40.63 5.513311.712.218.59.750.58 4.19347.413.117.07.33 6.14 6.30357.710.516.38.86 1.436.2436 3.8 6.87.9 6.4133 5.513719.623.825.910.290.227.943816.717.921.810.40.328.93911.212.013.310.540.3711.14026.428.730.2 5.7891.94.7Fig.5.TCLP pH value and Pb content of concrete mixes studied.J.Hu et al./Construction and Building Materials xxx (2012)xxx–xxx5Abram’s Law.Then,the a/c ratio (a/c 1,2,3)can be evaluated through Lyse’s Law based on the w/c and required workability (slump)le-vel.Finally,the cement content (C 1,2,3)can be determined based on the Molinari’s Law from a/c.The concrete mix design is there-fore determined based on these three parameters:w/c,a/c,and C.In order to comply a set of mix design nomograph,a series of mixes with different proportion components (w/c,a/c and C)gen-erally need to be prepared based on controlled workability.The6J.Hu et al./Construction and Building Materials xxx (2012)xxx–xxxperformance (such as compressive strength)of these mixtures are then evaluated and incorporated into the nomograph so as to establish the relation between mix proportion parameters (w/c,a/c and C).Fig.8provides four examples of nomographs of concrete made with different masonry materials and different types of cement.In these nomographs,compressive strength at three different ages (3,7,and 28days)was considered as the concrete performance crite-ria in addition to workability.These nomographs demonstrate sim-ilar trends to those published in the literature [14].Similar nomographs can also be developed if other performance test re-sults,such as ?exural strength,are used to replace concrete strength values in the ?gure.Thus,concrete can be designed to meet the other performance criteria.More nomographs resulting from the present study can be found in the reference reported by Wang et al.[8].The mix design nomographs developed in this study can help ?eld engineers select the proper mix proportion parameters to meet speci?ed concrete performance criteria.Concretes with desir-able compressive strengths and workability levels can be designed using LBP-contaminated recycled aggregates.While these con-cretes might have high concentrations of total lead (up to 2.2%in this study),they would not have a toxicity characteristic for lead and would not be classi?ed as hazardous materials under RCRA.J.Hu et al./Construction and Building Materials xxx (2012)xxx–xxx 75.ConclusionsA variety of concrete mixes was made with four different aggre-gates recycled from lead-contaminated masonry materials,three different kinds of cement,three different aggregate-to-cement ra-tios,and a wide range of water-to-cement ratios.The concrete workability,compressive strength,total lead and lead leachability of the concrete mixes were evaluated.Based on the test results,mix design nomographs were developed.The following conclu-sions can be made: 1.Lead in the LBP-contaminated masonry materials can be sequestered in concrete due to the high alkalinity of cement.Although some masonry materials were classi?ed as hazard materials due to leachable lead content,concrete mixes made with such materials showed no toxicity characteristic for lead according to the Resource Conservation and Recovery Act (RCRA).2.Although having low speci?c gravity and high absorption,crushed masonry materials,without sieving and re-grading process,can be simply used to replace all natural aggregate8J.Hu et al./Construction and Building Materials xxx (2012)xxx–xxxand to produce new concrete that meets structural and con-structability requirements.3.Using of Calcium Sulfoaluminate (CSA)cement signi?cantly increased concrete strength at early ages but had a little effect on the 28-day compressive strength.The CSA cement was less alkaline than Portland cement,and the concrete made with CSA cement had lower pH values than the corresponding con-crete made with Portland cement,thus being less effective for sequestering lead in the concrete.4.Theoretically,phosphate cold react with lead to form hydrox-ypyromorphite,thus resulting in sequestration of lead.How-ever,such a reaction did not occur in the present study and the addition of 5%phosphate had no signi?cant effect on appar-ent total lead content,lead leachability,or compressive strength.5.When well designed and well processed,the concrete made with all recycled aggregate from deconstructed masonry mate-rials can have a large range of workability and strength,thus applicable to various new concrete constructions,such as foun-dation and pavement,reinforcedbeams,columns,and walls.6.The mix design nomograph developed in this study can be used to decide concrete mix design with desired strengths and work-ability.This method can be easily adapted by ?eld engineers for designing concrete with aggregates recycled from different ?eld deconstruction projects. AcknowledgementsThe authors gratefully acknowledge the Strategic Environmen-tal Research and Development Program (SERDP)for sponsor the re-search project and the support provided by the National Concrete Pavement Technology Center (CP Tech Center).Special thanks are given to Mr.Robert Steffes,Dr.David White,Dr.Zhi Ge,and Mr.Eric Lindquist for their assistance in the lab and Mr.John Lathum at the Department of Environmental Health and Safety,Iowa StateUniversity for providing advice and assistance in dealing with occupational safety and hazardous waste issues associated with this project.Mr.Row Carr and Mr.Steve Otto at the Holcim Ltd.kindly provided donations of masonry materials and cement.References[1]ESTCP (Environmental Security Technology Certi?cation Program).ThermalSpray Removal of Lead-Containing Paint of Steel Structures,US Department of Defense,Cost and Performance Report (CP-9607);1999.[2]Hock VF,Edwards-Daniels A.Field demonstration of lead-based paint removaland inorganic stabilization technologies.Environmental Quality Management Inc.;2001.[3]Jacobs DE,Mielke H,Pavur N.The high cost of improper removal of lead-basedpaint from housing:a case report.Environmental Health Perspectives;2003.p.111.[4]Garrels RM,Christ CK,Solutions,minerals,and equilibria.Harper and Row;1965.[5]Brookins DG.Eh–pH diagrams for geochemistry.Springer-Verlag;1988.[6]Cao X,Ma LQ,Chen M,Hardison DW,Harris WG.Weathering of lead bulletsand their environmental effects at outdoor shooting ranges.J Environ Quality 2003;32:526–634.[7]ASTM (American Society for Testing and Materials).Annual Book of ASTMStandards;2010.[8]Wang K,Gaunt JA,Hu J.Sequestering lead in paint by utilizing deconstructedmasonry materials as recycled aggregate in concrete,Strategic Environmental Research and Development Program (SERDP)Project SI 1548;2008.[9]US EPA.Method 1311Toxicity Characteristic Leaching Procedure,CD-ROM,Revision 0;1992.[10]California Code of Regulations.California State of Waste Extraction Test (WET)procedures.California Code of Regulations,Title 22,Division 4.5,Chapter 11,Appendix II;2005.[11]Kosmatka SH,Kerkhoff B,Panarese WC.Design and control of concretemixture.14th ed.Portland Cement Association;2002.[12]Neville AM.Properties of concrete.4th ed.ELBS and Longman;1996.[13]Hu J,Wang K,Gaunt JA.Sequestering lead by utilizing lead based paintcontaminated masonry materials as recycled aggregate in concrete.Resour,Conserv Recy 2010;54(12):1453–60.[14]Levy SM,Helen P.Durability of recycled aggregates concrete:a safe way tosustainable development.Cem Concr Res 2004;34:1975–80.[15]Monteiro PJM,Helene PRL,Kang SH.Designing concrete mixtures for strength,elastic modulus and fracture energy.Mater Struct/Materiaux et Construc 1993;26:443–52.J.Hu et al./Construction and Building Materials xxx (2012)xxx–xxx9。
全球十大管理咨询公司的排名
1、麦肯锡全球最著名的管理咨询公司之一,1926年在美国成立,是专门为企业高层管理人员服务的国际性公司,在全球44个国家和地区开设了84个分公司,目前拥有9000多名咨询人员,分别来自78个国家,均具有世界著名学府的高等学位。
其业务主要是提供战略方面的咨询,同时还涉足企业金融、商业技术和运营等一系列广泛的咨询领域及管理议题。
麦肯锡中国公司被评为"中国最受尊敬企业"之一。
2、罗兰.贝格罗兰·贝格国际管理咨询公司于1967年在德国建立,现已成为欧洲最大的管理咨询公司之一,隶属于德意志银行集团,在全球26个国家和地区设有35个办事处。
公司的咨询顾问来自全球近四十个国家。
专长于为企业提供公司战略、重建、重组、市场营销、物流营运、企业兼并后联合及人力资源管理等咨询服务,帮助您解决在市场进入战略确定、中国营运模式的建立、合资企业重建与购并、全国销售网络控制及招聘与保留人才方面的问题。
3、埃森哲全球领先的管理及信息技术咨询机构,2003财政年度纯收入达118亿美元。
拥有83,000多名员工,在全球47个国家和地区设有110多家分支机构。
为各行各业的客户提供广博精深的专业服务和业务解决方案。
在公司战略目标的指导下,为了全方位地满足客户的需求,正在不断拓展业务服务网络,包括管理咨询、信息技术、经营外包、企业联盟和风险投资。
4、毕博毕博(BearingPoint)—原毕马威管理咨询(KPMG Consulting),总部位于美国弗吉尼亚州麦克林市,是世界最大的管理咨询公司和系统集成商之一,拥有员工16000余人,年收入近29亿美元,服务全球2100多家企业客户,其中包括72家美国《财富》100强公司、318家《财富》1000强公司以及超过四分之一的环球《财富》2000强公司,并致力于服务中小型企业、政府机构和其它组织,是美国26家政府部门中21家的主要系统集成服务提供商。
毕博(BearingPoint)有着极高的客户合作保持率,其中前150位的保持率为96%,而前50位大客户的保持率更是高达100%。
深圳市多恩技术有限公司2022产品手册说明书

S H I F T T O S A F E T Y安全/传感/控制2022产品手册Products and ServicesS h e n z h e n T o r e n t T e c h n o l o g y C o.,L t d.深圳市多恩技术有限公司0755********1. 功能安全控制器及传感器,产品最高可达PLe/SiL3安全性能等级,符合中国及全球标准,通过欧美专业机构和中国国家检测中心认证,应用于自动化设备,AGV,物流系统,数控机床,电梯,机器人,风电等诸多行业;2. 提供专业的自动化产线整体安全防护系统风险评估,设计与定制。
一站式交钥匙工程,最高符合PLe/SiL3安全性能等级,快速实现安全智能连接。
多恩技术是专业的安全传感控制研发企业,具备TUV 认证的机械安全风险评估资质,同时也是中国机械工业安全卫生协会会员单位,公司产品具有多项发明及实用新型专利,并获得多家国内国际权威机构认证。
Profile公司简介产品与服务P&S技术与荣誉Honor多恩技术是专注于工业安全控制与传感技术的研发型企业,由曾任职于世界100强工业电气巨头的海归工程师团队创建,具备电子、电气、机械核心研发能力,团队70%以上为十年以上工业行业经验的研发人员。
我们 的目标是让产品功能及应用精益求精,解决工业生产的安全难题,把安全的基因更加广泛植入到国内的传感与控制系统中,推动工业4.0的战略早日实现。
引言CONENT 目录0102040607081012141516171820多功能安全继电器功能型安全继电器可配置安全继电器佰安翼AnEZ 电磁式安全联锁开关截留钥匙型安全开关门栓把手部件安全触边/地毯安全围栏安全控制系统Safety V+可视化监视系统安全评估与改造行业应用引言01切割事故会造成严重的后果,比如人员伤亡,设备受损,生产停滞,经济赔偿,行政处罚,法务支出,额外的事故处理人力及费用,企业名誉受损等。
美国Wisdom Audio平面振膜扬声系统中国首演广州富盛音响体验中心开幕

广州富盛音响体验中心开幕●女本W记者/摄影张国棵继W i s dom A udi o宣布推出新系列入墙式喇叭系统后.近日本刊记者应邀出席了在广州举行的W i s dom A udi o平面电磁振膜扬声系统的新闻发布会.井有幸鉴赏和聆听了音响效果。
美国W i s dom A ud i o的总经理M ark G l az i er先生及技术营销总监Jon H e r r en先生亲临现场.讲解了平面电磁振膜扬声器的技术研发过程。
介绍中获悉.W i sdom A udi o公司于1996年创立.是一家专门从事H i E nd级家庭影院及H i Fi系统开发与生产的厂家一W i s dom A udi o公司能够在相对较短的时间内得到世界各地影音媒体的认可.很大程度上离不开它背后的团队。
而且这个团队中的每一个成员在过去都曾在著名的H i E nd音口自及家庭影院设计与生产厂家中任过职.拥有丰富的研发、生产以及销售经验。
因此,W i sdom A udi o可以称得上是由一帮“技术狂^”打造而成的超级H i E nd家庭影院及H i—Fi音响厂商一其目W i sdom A i J d{oi l#然{黢‘W i s dom A udi o是设计和制造高性能平面电磁振膜的专家.拥有超过90年扬声器制造经验。
为广大严苛的发烧友研究出毫不妥协的平面电磁振膜扬声器。
W i s dom A udi o系统栗用专利的平面电磁技术和电动式单元,带来最出色的声音效果。
这种混台技术系统已获得多个由专业媒体颁发的奖项.同时还满足了规模日益庞大的全球顾客与经销商的需求。
屡获殊荣的W i s dom A udi o Sage系列扬声器,由专业工匠在公司总部内华达州卡森市纯手工限量打造.今天亮相中国市场,以满足日益壮大的中国音响市场需求。
由于现时多声道家庭影院音响是影音市场的主流.而对于某部分高端消费用户来说,他们通常都对声音品质和房间美学有着极高的要求.所以人墙式音箱是最好的解抉方案。
(PPT)010麦肯锡

用新鲜事物和信息向团 队成员挑战
新的信息会使潜在的团队 重新解释和再度丰富对业 绩挑战的理解 ,从而有助 于团队形成一个共同的目 的 , 建立更为明确的目标 , 改进团队的共同方法
多花时间在一起
尤其是在团队组建的初期 显得更为重要, 以至于特 别小组的成员发现小组的 任务几乎成了他们的第二 职业
提出和抓住几个有立竿 见影效果的注重业绩成
明确的行为规则
例如出席会议的规则,
“对事不对人 ”的原则 , 有助于集中注意力、承担 责任和建立信任
最初的见面和团队领导 人的行动
异地开会 ,提供轻松的环 境和气氛
领导人需表现出灵活性和 勇于承认错误的态度 , 允 许大家畅所欲言 , 并不失 时机地表明团队今后方向
案例: 安然铺设钢管特别工作组
corp stBrJa(tGeBg)y
•每个成员有无可能在所有三类技能上把自己的水平提高到团队目的 和目标所要求的水平 •是否有对团队的业绩很重要的技能被漏掉或低估 •无论从个人或是集体的角度, 团队的成员是否愿意花时间帮助自己和 他人学习和发展技能 •如果需要, 团队是否能引进新的或补充的技能
corp stBraJ(tGegBy)
对团队基本要素的具体描述之三 — — 共同目的和业绩目标
团队领导者的作用
建立责任感 和自信心
使目的目标 和方法恰当 而有意义
干实事
团队领导者
强化综合技能 提高技术水平
处理好与团队 外人们关系包括
为他人 创造机会
排除障碍
corp stBrJa(tGeBg)y
评价团队领导者的态度 、行为和成果
corp stBrJa(tGeBg)y
领导者是选定了团队 还是工作组的形式
国际制药协会ISPE基本指南05卷
A GUIDE FOR NEW FACILITIES VOLUME 5: COMMISSIONING AND QUALIFICATIONEXECUTIVE SUMMARYJUNE 2000A DOCUMENT DEVELOPED IN PARTNERSHIP BY:23ISPE PHARMACEUTICAL ENGINEERING GUIDECOMMISSIONING AND QUALIFICATIONFOREWORDAs noted in the Baseline® Guides, Volume 1, the pharmaceutical industry has experienced a ratcheting effect in the cost of new facilities. This increase in cost has been driven in part by uncertainty about the requirements for regulatory compliance. Some significant areas of concern are validation, particularly related to automation systems, and the trend to validate back to source utilities, architectural and HVAC. The absence of a consistent and widely accepted interpretation of regulatory requirements has led to one-upmanship. This practice of building increasingly technically advanced facilities has led to increased cost, longer lead times and, in some cases, delays in bringing new products to market.In May 1994, engineering representatives from the pharmaceutical industry engaged in a discussion with the International Society for Pharmaceutical Engineering (ISPE) and the Food and Drug Administration (FDA). That first discussion allowed for the creation of 10 facility engineering guides, now known as the Baseline® Pharmaceutical Engineering Guides. These guides are intended to assist pharmaceutical manufacturers in the design, construction and commissioning of facilities that comply with the requirements of the FDA. Volume 1, covering Bulk Pharmaceutical Chemicals (BPC), was published in June of 1996. This Guide, for Commissioning and Qualification, is the fifth volume in the series.As with the BPC Guide, the Commissioning and Qualification Guide, has been sponsored by ISPE’s Pharmaceutical Advisory Council, made up of senior pharmaceutical engineering executives from owner companies, the FDA and ISPE senior management. Overall planning, direction and technical guidance in the preparation of the Commissioning and Qualification Guide was provided by a Steering Committee most of whom were involved in the BPC Guide. The Commissioning and Qualification Guide itself was produced by a task force of around 60 individuals who expended a great deal of their own time in its preparation and development.Editors’ Disclaimer:This guide is meant to assist pharmaceutical manufacturers in the design and construction of newfacilities that comply with the requirements of the Food and Drug Administration (FDA). TheInternational Society for Pharmaceutical Engineering (ISPE) cannot ensure, and does not warrant,that a facility built in accordance with this guide will be acceptable to FDA.4ISPE PHARMACEUTICAL ENGINEERING GUIDECOMMISIONING AND QUALIFICATIONACKNOWLEDGEMENTSThis guide was developed by an integrated US-European team under the co-leadership of Alan Philips of Pfizer and Christopher Wood of Glaxo Wellcome.The Core Team on the guide was comprised:Alan Philips PfizerChristopher Wood Glaxo WellcomeBob Myers KvaernerGeorgia Keresty, Ph.D. Bristol Myers SquibbThe Extended Review Team was comprised the Core Team plusJan Gustafsson Novo NordiskGraham Shewell SmithKline BeechamTodd Troutman KvaernerSimon Shelley Glaxo WellcomeGene Yuan Hoffman LaRocheThe Chapter Credits are as follows:Introduction Alan PhilipsGeorgia Keresty, Ph.D. PfizerBristol-Myers SquibbKey Concepts & Philosophy Chris WoodGeorgia Keresty, Ph.D. Glaxo Wellcome Bristol-Myers SquibbImpact Assessment Bob MyersSimon ShelleyTodd Troutman KvaernerGlaxo WellcomeKvaerner5Good Engineering Practice John FadoolGraham Shewell Glaxo Wellcome SmithKline BeechamCommissioning Mark E. Miller1Chris WoodGraham Shewell GenentechGlaxo Wellcome SmithKline BeechamQualification Practices Jan GustafssonGene YuanSue Bacso Novo Nordisk Hoffman LaRoche MerckEnhanced Design Review Graham ShewellChris Wood SmithKline Beecham Glaxo WellcomeInstallation Qualification Bob MyersBob AdamsonTodd Troutman Kvaerner Foster Wheeler KvaernerOperational Qualification Bob MyersTodd Troutman Kvaerner KvaernerPerformance Qualification Chris Dell Cioppia KvaernerRelated Programs Georgia Keresty, Ph.D.Todd Troutman Bristol-Myers Squibb KvaernerIllustrative Examples Bob Myers KvaernerThe guide co-team leaders would also like to acknowledge the contributions made by the following part-time members of the guide team:Flemming Steen Jensen (then of) Novo NordiskSteve Heidel MerckCecilia Luna Novartis1 With the support of John Hughes (TVS Inc,), Jon Sheh (Alza Inc.) and Gary Schoenhouse (Genentech)6Tony deClaire APDC ConsultingFDA Reviewers:We would like to thank the following FDA review team for their input to this guide:Robert Sharpnack InvestigatorEric S. Weilage NDA/ANDA Pre-approval Inspection ManagerRobert Coleman National Drug Expert, DEIOBrian Nadel Compliance Officer, CDERWe also appreciate FDA support from the following representatives:Sharon Smith-Holston Deputy Commissioner for External AffairsSusan Setterberg Regional Director, Mid-Atlantic RegionJoe Phillips Deputy Regional Manager, Mid-Atlantic RegionIn addition, we would like to acknowledge the support and contribution of the ISPE Technical Documents Steering Committee, in particular the following members:Paul D’Eramo Committee Chairman, Johnson & JohnsonMel Crichton Eli LillyBruce Davis Astra ZenecaPaul Lorenzo (Retired)71. INTRODUCTION1.1 BACKGROUNDThe design, construction, commissioning and qualification of manufacturing facilities regulated by FDA or other regulatory authorities pose significant challenges to manufacturers, engineering professionals and equipment suppliers. These facilities are required to meet cGMP regulations while remaining in compliance with all other governing codes, laws, and regulations.The cost and time required to bring such facilities on line has been increasing, in many cases due to inconsistent interpretation of regulatory requirements. The ISPE and engineering representatives from a broad base of healthcare companies (e.g. pharmaceutical, device, biotechnology, etc.) have entered into a partnership with the Food and Drug Administration (FDA) to enhance understanding of Baseline cGMP requirements for facilities. This Guide is intended to define key terms and offer a consistent interpretation, while still allowing a flexible and innovative approach to facility design, construction, commissioning and qualification. A fundamental goal of the Guide is to provide value added guidance to industry that will facilitate timely and cost effective commissioning and qualification of facilities.This guide is one in a series of Baseline® Guides being planned and produced by ISPE. The majority of these are specific to one functional area (e.g. Oral Solid Dosage Forms). However, this guide provides advice and guidance that may be applied to all types of facilities, utilities and equipment found in the healthcare industry.This Guide was prepared by the ISPE, and has incorporated comments from:Industry representatives from all areas and disciplinesFDA Field Investigators and personnel from The Center for Drug Evaluation and ResearchIt is recognized that industry standards evolve and this document reflects the understanding of these standards, as of publication date.1.2 SCOPE OF THIS GUIDEThis is a Guide to be used by industry for the design, construction, commissioning and qualification of new or newly renovated manufacturing facilities that are regulated by FDA or other health authorities. It is neither a standard nor a GMP. It is not intended to replace governing laws, codes, standards or regulations that apply to facilities of this type. These are mentioned only for completeness and where their impact affects facility, equipment and utility design relative to cGMP’s. The use of this document for new or existing facilities, equipment or utilities is at the discretion of the owner or operator.This Guide focuses on the engineering approaches and practices involved in providing cost effective manufacturing facilities in a timely manner that meet their intended purposes. Specifically, the Guide addresses the process of designing, constructing, commissioning and qualifying the facilities, utilities and equipment regulated by FDA or other health authorities.This Guide is not intended to address any aspect of process/product validation. This is a subject that has been well defined by FDA and other authorities and for which substantial guidance documentation exists.It must be recognized, however, that Commissioning and Qualification activities are the foundation upon which Process Validation is built. Furthermore, these activities play a crucial role in delivering operationally effective, safe and efficient facilities, utilities and equipment. Therefore, it is important to ensure that a comprehensive approach is 8undertaken during the commissioning and qualification process. A well conceived and executed commissioning and qualification plan can greatly facilitate a timely and cost effective validation effort.Where non-engineering issues are covered (e.g. support systems, documentation, decision processes), the guidance is provided to show engineers the importance of such topics and the impact they have on the commissioning and qualification process. Consequently, non-engineering topics are not covered comprehensively. Specialist advice from QA Departments should be sought where additional information is required.The Guide is intended primarily for facilities, equipment and utilities meeting regulatory requirements to supply the United States (US) market and is aligned with US standards and references. The Guide may also be helpful to manufacturers needing to meet European requirements.91.3 KEY FEATURES AND CHAPTERS OF THIS GUIDEThe following key concepts are defined and used as a basis for guidance:• Direct Impact Systems• Indirect Impact Systems• System Impact Assessment• Good Engineering Practice• Commissioning• Qualification Practices• Enhanced Design Review• Installation Qualification• Operational Qualification• Performance Qualification• Consistent Terminology• Documentation RequirementsSOME BRIEF EXPLANATION OF THESE IS AS FOLLOWS:It is the function of the facility, equipment or utility that determines what level of commissioning and qualification are needed.• ‘Direct Impact’ systems are expected to have an impact on product quality• ‘Indirect Impact’ systems are not expected to have an impact on product qualityBoth types of systems will require commissioning, however, the “Direct Impact” systems will be subject to supplementary qualification practices to meet the additional regulatory requirements of the FDA and other regulatory authorities.The determination of a system as either ‘Direct Impact’ or ‘Indirect Impact’ is critical. It is this differentiation between system types that determines the degree of effort and level of resources required for each system. System Impact Assessment provides the thought process and some key questions that must be asked in making the determination.During the production of this guide, regulatory authorities have expressed concern that designating a system “Indirect Impact” might be a means of doing less than full testing on a system that may actually require it. This is not the intention. The objective is that through a comprehensive impact assessment process, those systems presenting a risk to product quality are identified and given the attention appropriate to this level of risk, and by the right people (e.g. QA Departments).For this process to work it is essential that an explicit rationale is provided for the indirect/direct impact assessment and that the rationales are fully understood, documented and endorsed by QA Departments. This places a responsibility upon engineers to communicate clearly the nature of operation of engineering systems, and their potential impact on product quality.It will also be seen that throughout the Guide, the application of Good Engineering Practice is essential to the commissioning and qualification activities. Good Engineering Practice, commonly referred to as GEP, is proven and accepted, cost-effective, engineering methods and practices that ensure the effective satisfaction of stakeholder requirements. As such, GEP ensures that an engineering project meets the requirements of the user while being cost effective, compliant with regulations and well documented. Guidance and standards that have been defined by engineering institutes and other learned bodies support GEP. For direct impact systems, GEP is supplemented by enhanced documentation and qualification practices with the active participation of Quality Assurance personnel.The guide also attempts to clarify some misconceptions about how activities are defined, which activities are the subject of regulatory oversight and the sequence, if any, of these activities. For example, the guide discusses “Enhanced Design Review” and the components and criteria of this activity. The intent is to identify design aspects that are key to manufacturing facilities regulated by the FDA or other health authorities. How this enhanced design review is accomplished, either with a formal or informal process, is at the discretion of the individual company. The intent is not to establish new administrative requirements, especially for those activities not regulated by FDA or other regulatory authorities. The design review activities are part of GEP and are unregulated by FDA, i.e. these are good engineering practices, not regulatory requirements.Installation Qualification (IQ), Operational Qualification (OQ) and Performance Qualification (PQ) are activities that FDA may have an interest in, since these are the final activities before process validation can begin. IQ/OQ in many instances is done concurrently with commissioning and requires the enhanced documentation, QA involvement and additional tests and checks known as Qualification Practices.An overview of the Chapter structure is given in Figure 1-2.Figure 1-2: Chapter Structure1.4 GOALS OF THIS GUIDEThere are two primary goals of the Commissioning and Qualification Baseline® Guide. The first is to bring a common terminology and methodology to the commissioning and qualification process that can be used by manufacturers, facility designers, contractors and equipment suppliers. The second is to provide a system impact assessment process to bring structure and consistency to determining a direct and indirect impact system. An important secondary goal is to foster an interdisciplinary team approach to commissioning and qualification. Such an approach will help establish an effective basis for master planning and execution of facility projects. Specifically, the Guide is focused upon value added approaches that will eliminate duplication of effort and the costly practices of:• Repeating qualification steps during process validation• Qualifying systems that only require commissioning• Generating insufficient or excessive documentation• Excessively long project schedules• Delays which can result in product supply interruptions or delayed product launches2. GUIDE PHILOSOPHY AND KEY CONCEPTSThis Chapter describes the purpose and philosophy of the Commissioning and Qualification Baseline® Guide, and the differences between the commissioning and qualification processes in the context of this Guide. It is important to understand and apply the approaches outlined in this Baseline® Guide in a sound and well-reasoned manner, since every facility and project is different.The key terms used in the Guide are defined, including:• Direct Impact System• Indirect Impact System• No Impact System• Design for Impact• Good Engineering Practice• Enhanced Design Review• CommissioningAn overview of Qualification Practices is given, including Enhanced Design Review, Installation Qualification, Operational Qualification, and Performance Qualification. V-models are provided for both Direct Impact systems and Indirect Impact systems and the role of Quality Assurance is discussed.3. IMPACT ASSESSMENTImpact Assessment is the process of determining which systems and/or system components should be subject to Qualification Practices in addition to Good Engineering Practices (GEP). Impact Assessment assists in defining the Commissioning and Qualification scope of a project.This Chapter considers the Impact Assessment process. Terms specific to Impact Assessment are defined. A method is suggested for defining the steps of a system assessment process, including a discussion of the benefits, and a list of the criteria for determining system impact and component criticality.4. GOOD ENGINEERING PRACTICEThis Chapter provides an overview of the various project phases and sequence, from inception through commissioning, qualification, and operation. Concepts associated with “Good Engineering Practice” (GEP), the types of activities that occur, and documentation that is created through GEP are discussed. Overviews are provided of both effective project controls, and project team concepts and organization.The Requirements phase is considered in detail, including:• Project Purpose and Justification• User Requirements Brief• Requirements Specifications• Project Execution Plan• Maintenance and Technical Support Requirements• Compliance Requirements• DeliverablesStages in the design process are described with specific consideration of Piping and Instrumentation Diagrams, Specifications, and Construction drawings. Construction involves several elements, which are crucial to every project, including project site logistics and project quality control. This Chapter details typical requirements and elements of construction.The information given in the Chapter aims to demonstrate how GEP, as applied throughout the project lifecycle, provides a basis for effective qualification.5. COMMISSIONINGThis Chapter defines the term “commissioning” in the context of the Guide and describes the organization and content of the Commissioning Plan document. Commissioning is positioned within the context of the Qualification effort and guidance is provided in the management and execution of the commissioning activities. Typical commissioning deliverables and the associated commissioning team responsibilities are considered.Commissioning activities described include:• Inspection• Setting-to-Work• Regulation and Adjustment• Testing and Performance Testing• Training• Turnover• Commissioning Plan Close-Out6. QUALIFICATION PRACTICESDirect impact systems are subject to qualification practices that incorporate the enhanced review, control and testing against specifications and requirements necessary for compliance with current Good Manufacturing Practice. The purpose of this chapter is to introduce a high level overview of qualification practices that are required for direct impact systems. The Validation Master Plan and Qualification Rationale are described in detail. This Chapter contains detailed consideration of Enhanced Documentation.7. ENHANCED DESIGN REVIEWEnhanced Design Review (EDR) is the term adopted by this guide to describe the process by which engineering designs for pharmaceutical facilities, systems and equipment are evaluated. This process compliments Good Engineering Practice.This Chapter gives the regulatory perspective on EDR and relates EDR to the V-Model for Direct Impact systems. The EDR process is detailed. A structured design review method and a failure modes analysis method are suggested for evaluating designs.8. INSTALLATION QUALIFICATIONInstallation Qualification (IQ) is an activity that is regulated by the FDA, and is a part of final qualification activities before process validation begins.The primary objectives of this chapter are to:• Provide an overview of the Installation Qualification process• Describe the types of activities that occur and documentation that is needed for the Installation Qualification Process• Describe how Installation Qualification fits in with the overall qualification process• Describe how Commissioning integrates within the Installation Qualification process9. OPERATIONAL QUALIFICATIONOperational Qualification (OQ) is an activity that is regulated by the FDA, and is a part of final qualification activities before Performance Qualification or Process Validation begins.The primary objectives of this chapter are to:• Provide an overview of the Operational Qualification process• Describe the types of activities that occur and documentation that is needed for the Operational Qualification Process• Describe how Operational Qualification fits in with the overall qualification process• Describe how the commissioning process integrates within Operational Qualification10. PERFORMANCE QUALIFICATIONPerformance Qualification (PQ) is an activity that is regulated by the FDA, and is the final qualification activity before the remainder of Process Validation begins. For pharmaceutical grade utilities and certain support systems, PQ is the final qualification step.Once the system (or systems) have gone through IQ and OQ execution and have been approved/accepted the PQ can be performed.The primary objectives of this chapter are to:• Provide an overview of the Performance Qualification process• Describe the types of activities that occur and documentation that is needed for the Performance Qualification Process• Describe how Performance Qualification fits in with the overall qualification process• Describe how the commissioning process integrates within Performance Qualification11. RELATED PROGRAMSThis Chapter provides details of those programs that are undertaken to provide assistance and information in support of the qualification activities. Some of these programs can be applied to ‘Direct’, ‘Indirect’ and ‘No Impact’ systems and their components. Where these programs are undertaken in support of qualification activities, the appropriate qualification practices must be followed to ensure that the compliance of the over-all qualification effort is not compromised. Related programs considered include:• Safety• Standard Operating Procedures• Training• Preventative Maintenance and Calibration• Computer Systems Validation• Cleaning Validation• Analytical Method Validation• Process Validation• Revalidation12. GLOSSARYTerms and concepts used throughout the Commissioning and Qualification Baseline® Guide are defined and cross-referenced.13. ILLUSTRATIVE EXAMPLESThe illustrative examples given in this Chapter provide one interpretation of how the key concepts of this guidecan be applied in preparing for commissioning and qualification activities. Depending upon company policies or the intended use of the equipment listed, there may be additions or deletions to the listed activities. APPENDIXThe Appendix provides detail and references for Failures Modes Analysis.。
亨普尔公司技术指南说明书
Technical guideline Issued by Hempel A/S - May 20201/1ScopeThis document describes in general terms when to use thinner and when not to use thinner.Safety precautionsUse adequate personal safety equipment and follow sound procedures. Apply only in well ventilated areas. Observe safety labels on packaging and paint containers and consult Hempel ’s Safety Data Sheets for the products to be applied.IntroductionSolvent in a paint has one main purpose, to help getting the paint out of the can and onto the surface to be painted. Generally, once the paint is on the surface, the solvent evaporates.Apart from a few special situations, thinning is not necessary. Paints are designed to be applied out of the can, so once the paint has been thoroughly mixed (together with a curing agent if appropriate), there should not normally be a need for the addition of thinner.There are general reasons for when to use thinner and when not to use thinner.When to use thinnerBrush and roller marksHeavy duty paints are often made viscous or ‘thick’ to enable application of high film thicknesses in one go.However, when applied manually using brush or roller, the high viscosity often results in brush or roller marks left in the surface of the paint.Adding a small amount of thinner (just a few percent) will lower the viscosity, help flow of the paint and result in a smoothersurface when applied manually. An alternative to using thinner to avoid marks, is not to brush or roll the surface excessively.FlowThick paint may have difficulty in flowing down into a very even surface. Adding a very small amount of thinner will help this flow and ease the distribution of paint on the surface.How to add thinnerIn general, do not add thinner to the mixed paint to start with and never to the separate paint components.Initially, mix the paint thoroughly at the correct temperature (around 20°C [68°F]) and try the application before adding any thinner.If viscosity is still too high for proper application, start by adding thinner gradually since (obviously) too much added thinner cannot be removed again.When not to use thinnerTemperatureWhen paint is cold (< 10°C [50°F]), it will be thicker thannormally. In this case, addition of thinner is not the solution to reduce viscosity. Instead, cans shall be transferred to a warmer place so that the paint obtains a temperature of around 20°C [68°F] before mixing. This will lower the viscosity and make application easier.Film thicknessThinning the paint might seem to make the application quicker, but the film that is applied will be of lower thickness and more coats will be needed to provide the proper protection.SaggingThinning the paint will increase the chances of sagging when a high film thickness is applied. When the paint sags, there will be very little paint above the sag and too much paint on the sag.TopcoatsNote that many topcoats or finishing coats have a lower viscosity than other paint types. Most often, it is not necessary to thin these paints.Use of thinnerThis document is intended for professional use and provides generic advice in respect of the subject matter only. It is not intended to be used as acomprehensive guide. The buyer/applicator should always read the relevant Product Data Sheet (“PDS ”) and Safety Data Sheet (“SDS ”) relating to the Products ordered which are available for download on . If in doubt, please contact your local Hempel representative for further advice. To the extent relevant, the disclaimer set out in the relevant PDS(s) applies to this document.。
效率评价软件(EMS)说明书解析

3.设定权重约束条件 你可以定义权重约束公式W(p, q) ≥ 0, 这里 p 指输入权重向量, q 指输出权重向量(或影子价格)。从而可以合并“锥面比 率”约束条件和“可行域”约束条件。 举例:假设有3个输入和2个输出,若约束条件是 p1≥ p2,那么权重约束矩阵W 中的相应行就是 (1 ?1 0 0 0);如果另外代入边 际比率约束如 0.3≤q1/q2 ≤3,可以将之转化为两个约束条件: q1 ?0.3q2 ≥0 和 -q1 + 3q2≥ 0,对应矩阵W中的行 (0 0 0 1?0.3)和 (0 0 0?1 3)。这样,本例得出矩阵W如下:
0 0 0 1 0.3 0 0 0 ?1 3 用程序文件夹中的 EMS 。
现在将EMS 与数据相联:输入输出数据可以按Ctrl+0调入。如果你选择了合适的文件名,那么EMS 也会搜索并与文件相联。对于有上千个DMU 的大型 DEA 评价,可能会需要几秒钟。联接能成功: ? 如果文件名出现在状态栏里(在EMS 窗口底部)并且 ? 沙漏标志消失 EMS 不显示你的数据!如果想编辑数据,应打开Excel 中的或文本编辑器里的数据 文件并进行编辑。保存修改内容(不必关闭文件)并按(Ctrl+0) 再次向EMS 调入。EMS 通常从硬盘上调入文件版本。
按Ctrl+W 来调入包含矩阵W 的文件(菜单文件→调入权重约束),当文件成功调入后,文件名出现在状态栏里(如同输入输 出数据文件)。 5 运行DEA 模型
运行DEA 模型前,确认bpmpd.par 文件与数据文件在同一文件夹内! 5.1 设计计算结果的格式
Ctrl+F (菜单 DEA→格式) 将出现在格式对话框里。在这儿,你可以定义小数点后的位数,EMS 计算出的结果将出现在结果表 中。 进而,你可以决定是否: 纯投入产出权重(影子价格)pi 和 qj 应当被显示(选择纯权重)或 “实际的输入和输出”,权重同输入和输出进行了相乘pi · x i0, qj · y j0(选择的实际输入输出) 上面这些应当在结果表中显示出来。 4. 2选择一个技术结构 Ctrl+M (菜单DEA ! Run model)将显示一个对话框,你可以在那里限定你所计算的模型
2025十大趋势白皮书(华为)

智能世界,触手可及是机器,更是家人全球14%的家庭将拥有家用智能机器人。
人机协创97%的大企业将采用AI。
超级视野采用VR/AR技术的企业将增长到10%。
无摩擦沟通企业的数据利用率将达86%。
16275G、云、IoT、AI的融合应用正在塑造一个万物感知、万物互联、万物智能的世界,它比我们想象中更快地到来。
华为展望2025年行业发展趋势,让我们一起预见触手可及的智能世界,每个人、每个企业、每个行业都将从中获得新能力,挖掘新机会,创造无限可能。
@20252025十大趋势:智能世界,触手可及懂“我”道路C-V2X(蜂窝车联网技术)将嵌入到全球15%的车辆。
5G,加速而来全球58%的人口将享有5G服务。
零搜索全球90%的人口将拥有个人智能终端助理。
共生经济基于云技术的应用使用率将达到85%。
机器从事三高每万名制造业员工将与103个机器人共同工作。
全球数字治理全球年存储数据量高达180ZB 。
3849510目录执行概要趋势一 是机器,更是家人 趋势二 超级视野趋势三 零搜索趋势四 懂“我”道路趋势五 机器从事三高趋势六 人机协创趋势七 无摩擦沟通趋势八 共生经济趋势九 5G,加速而来趋势十 全球数字治理方法论指标定义执行概要执行概要智能世界触手可及当今,以人工智能、5G、云计算为主导的第四次工业革命所带来的改变,已在悄然发生,并比你想象中更快地到来。
4岁的孩子能向智能助手发出指令;小机器人能够深入检测地下管道,看见人类看不见的视野;复杂的按钮正在简化,你的家电开始与你对话;交通出行由“你看灯”,变成“灯看你”;生活在复杂雨林环境下的蜘蛛猴因为智能设备对声音的收集分析,得到了有效的保护……,这些都是我们当下正在发生的真实案例,它们所探索的方向以及背后的技术,向我们呈现了一个方向:智能世界正在朝每个普通人,每个大小企业,每个行业走来,并且它是触手可及的。
为此,华为全球产业展望(GIV@2025),旨在通过实际的案例和数据,勾勒和阐述一个可触碰的智能世界,将如何赋予个人、企业、产业新的能力、新的机会、新的生活方式。
霍普金斯科学公司的B+系列产品说明书
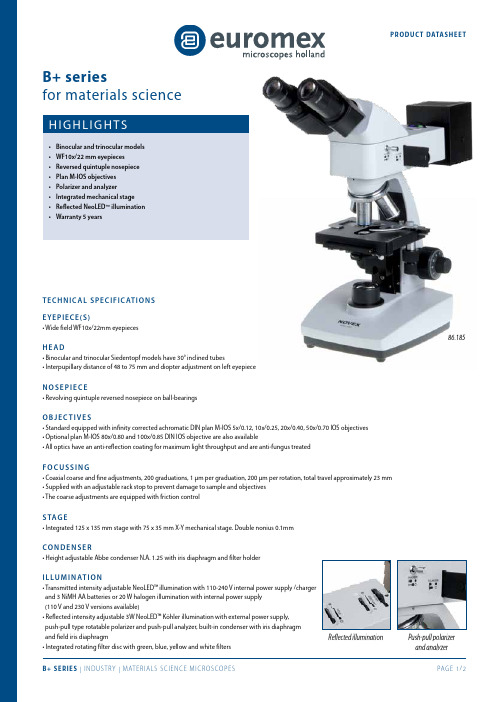
H I GH LI GH TS• Binocular and trinocular models • WF10x/22 mm eyepieces • Reversed quintuple nosepiece • Plan M-IOS objectives • Polarizer and analyzer • Integrated mechanical stage • Reflected NeoLED ™ illumination • Warranty 5 yearsB+ seriesfor materials scienceTEC HNI C A L S P E C IF IC AT I ON S EYEP I E C E (S )• Wide field WF10x/22mm eyepiecesH E A D• Binocular and trinocular Siedentopf models have 30° inclined tubes• Interpupillary distance of 48 to 75 mm and diopter adjustment on left eyepieceN O S E P I E C E• Revolving quintuple reversed nosepiece on ball-bearingsO B J E C T I V E S• Standard equipped with infinity corrected achromatic DIN plan M-IOS 5x/0.12, 10x/0.25, 20x/0.40, 50x/0.70 IOS objectives • Optional plan M-IOS 80x/0.80 and 100x/0.85 DIN IOS objective are also available• All optics have an anti-reflection coating for maximum light throughput and are anti-fungus treatedF O C U S S I N G• Coaxial coarse and fine adjustments, 200 graduations, 1 μm per graduation, 200 μm per rotation, total travel approximately 23 mm • Supplied with an adjustable rack stop to prevent damage to sample and objectives • The coarse adjustments are equipped with friction controlS TAG E• Integrated 125 x 135 mm stage with 75 x 35 mm X-Y mechanical stage. Double nonius 0.1mmCO N D E N S E R• Height adjustable Abbe condenser N.A. 1.25 with iris diaphragm and filter holderI L LU M I N AT I O N• Transmitted intensity adjustable NeoLED™ illumination with 110-240 V internal power supply /charger and 3 NiMH AA batteries or 20 W halogen illumination with internal power supply (110 V and 230 V versions available)• Reflected intensity adjustable 3W NeoLED™ Köhler illumination with external power supply, push-pull type rotatable polarizer and push-pull analyzer, built-in condenser with iris diaphragm and field iris diaphragm• Integrated rotating filter disc with green, blue, yellow and white filters PRODU C T DATASHE E T86.185Push-pull polarizer and analyzerReflected illuminationEuromexMicroscopenbv•Papenkamp20•6836BDArnhem•TheNetherlands•T+31(0)263232211•F+31(0)263232833•****************•ACC E S S O RI E S A ND S PA RE PA R TS86.573 HWF 15x/12 mm eyepiece86.574 HWF 10x/18 mm eyepiece with micrometer 10mm/100 reticule 80.839 Eyecup for ø 28 mm tube86.527 Plan M-IOS DIN 5x/0.12 infinity corrected objective. Working distance 26.1 mm86.529 Plan M-IOS DIN 10x/0.25 infinity corrected objective. Working distance 20.20 mm86.531 Plan M-IOS DIN 20x/0.40 infinity corrected objective. Working distance 8.80 mm86.535 Plan M-IOS DIN 50x/0.70 infinity corrected objective. Working distance 3.68 mm86.538 Plan M-IOS DIN 80x/0.80 infinity corrected objective. Working distance 1.25 mm objective.86.539 Plan M-IOS DIN 100x/0.85 infinity corrected objective. Working distance 0.40 mm86.851 Polarizing attachment for transmitted halogen illumination 86.852 Polarizing attachment for transmitted LED illumination 86.806 Mirror adapter(only for B and B+ series with halogen illumination)86.860 Köhler diaphragm with centering, to be mounted on lamp house(only suitable for models with halogen illumination)86.172 Dark field stop to be placed in filter holder (transmitted illumination).Suitable for objectives from 10x up to S40xAE.5130 Universal SLR camera adapter with 2x projection lens for 23.2 mm tubes. Need T2 adapterAE.5020 T2 adapter for Nikon D digital SLR cameras AE.5040 T2 adapter for Canon EOS digital SLR cameras Other T2 adapters on requestAE.5202 Blue filter ø 32 mm AE.5203 Yellow filter ø 32 mm AE.5204 Neutral density filter ø 32 mm AE.5205 Blue acrylic filter ø 32 mm AE.5207 Blue filter acrylic ø 31.8 mm86.889 Spare halogen bulb 20 W / 6 V 86.101 Spare LED module for B series AE.5227 Glass fuses 1 A 250 V, 10 pieces PB.5155 Microscope slides 76 x 26 mm, ground edges, 50 pieces PB.5165 Cover glasses 18 x 18 mm, thickness 0.13-0.17 mm, 100 piecesPB.5168 Cover glasses 22 x 22 mm, thickness 0.13-0.17 mm, 100 piecesPB.5245 Lens cleaning paper, 100 sheetsPB.5274 Cleaning liquid, isopropanol alcohol 99% (200ml)PB.5275 Cleaning kit: lens cleaning fluid, lint free lens tissue, brush, air blower and cotton swabs PAC K AG I N G• Supplied with power cord, dust cover, a spare fuse and user manual• Models with a 20 W halogen illumination are supplied with a spare bulb and a blue filter • All packed in a polystyrene boxM O D E L SBinocularTrinocularTransmitted 20 W halogen illuminationTransmitted illumination LEDReflected illumination NeoLED ™86.185••• 86.185-LED ••• 86.189••• 86.189-LED•••。
麦肯锡全球研究院

麦肯锡全球研究院麦肯锡全球研究院(MGI),成立于1990年,是麦肯锡公司的业务和经济研究部门。
麦肯锡全球研究院的使命是帮助在商业,公共和社会各界的领导人对全球经济的发展有更深的了解,并提供一个事实基础,有助于对关键管理人员的决策和政策问题做决定。
麦肯锡的研究结合两个学科:经济学和管理学。
经济学家经常对高级管理人员的访问的实际问题存在限制,而高级管理人员往往缺乏时间和激励使自己的行业去超越解决全球经济的更大的问题。
通过整合这些观点,麦肯锡能够争取到关于长期的宏观经济走势的微观基础的见解,影响企业战略和决策的见解。
近二十年以来,麦肯锡将这个“微观到宏观”的方法利用到研究中,范围涵盖超过20多个国家和30多个行业。
麦肯锡目前的研究议程集中于三大领域:生产力,竞争力和增长;全球金融市场的演变;以及技术对经济的影响。
最近的研究通过加速的生产率的增长,审查了在欧洲和美国的以促进增长和更新的项目改革;非洲的经济潜力,债务和去杠杆化和廉价资本,跨国公司对美国经济的影响;技术支持业务的发展趋势;印度和中国的城市化;以及行业竞争力和产业政策。
麦肯锡由三个麦肯锡公司的董事领导:理查德·多布斯,詹姆斯·曼依卡,和查尔斯·罗克斯堡。
苏珊·伦德担任麦肯锡的研究董事。
麦肯锡项目小组由一群高级研究员领导,并包括一些来自世界各地麦肯锡公司办事处的顾问。
这些团队展现了麦肯锡公司的全球工业网络,管理专家和合作伙伴。
此外,在麦肯锡工作的还有一些著名经济学家,包括诺贝尔奖获得者作为麦肯锡项目顾问。
麦肯锡公司的合作伙伴成立了麦肯锡的研究基金,它不受任何企业,政府或其他机构的委托。
要想了解更多有关MGI和麦肯锡发表的报告的信息,请访问/ MGI。
大数据:下一个创新,竞争和生产力前沿领域序言我们所处的世界中的数据量一直呈爆炸性增长。
公司获取万亿种关于他们的客户,供应商和运营的信息,并掌握数百万网络传感器被嵌入现实世界的设备中,如移动电话,汽车,传感,创建,和通信数据。
EM 621FV16B 低功耗 128Kx16 SRAM 数据手册说明书
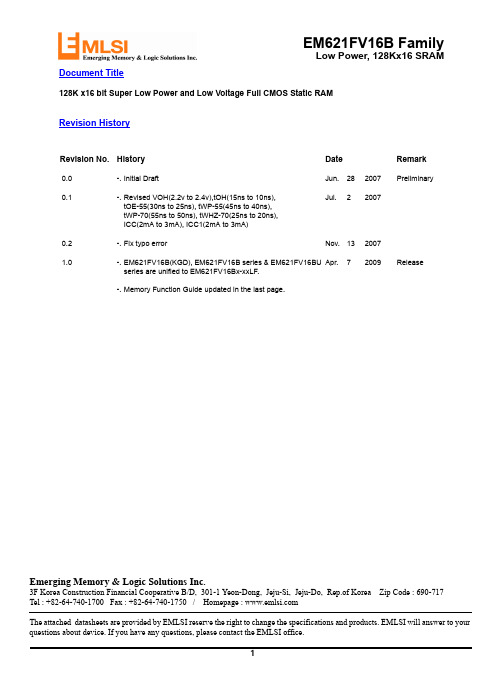
Document Title128K x16 bit Super Low Power and Low Voltage Full CMOS Static RAMRevision HistoryRevision No. History Date Remark0.0-.Initial Draft Jun.282007PreliminaryJul.220070.1-.Revised VOH(2.2v to 2.4v),tOH(15ns to 10ns),tOE-55(30ns to 25ns), tWP-55(45ns to 40ns),tWP-70(55ns to 50ns), tWHZ-70(25ns to 20ns),ICC(2mA to 3mA), ICC1(2mA to 3mA)0.2 -.Fix typo error Nov.132007Apr.72009Release1.0-.EM621FV16B(KGD), EM621FV16B series & EM621FV16BUseries are unified to EM621FV16Bx-xxLF.-.Memory Function Guide updated in the last page.Emerging Memory & Logic Solutions Inc.3F Korea Construction Financial Cooperative B/D, 301-1 Yeon-Dong, Jeju-Si, Jeju-Do, Rep.of Korea Zip Code : 690-717Tel : +82-64-740-1700 Fax : +82-64-740-1750 / Homepage : The attached datasheets are provided by EMLSI reserve the right to change the specifications and products. EMLSI will answer to your questions about device. If you have any questions, please contact the EMLSI office.PRODUCT FAMILY1. “xx” represents speed.2. Typical values are measured at Vcc=3.3V, T A =25o C and not 100% tested.Product FamilyOperating Temperature Vcc RangeSpeedPower DissipationPKG Type Standby (I SB1, Typ.)Operating (I CC1.Max.)EM621FV16B Industrial (-40 ~ 85o C)2.7 ~3.6 V 45/55/70 ns1 µA 2)3 mAKGDEM621FV16B - xx 1)LF 48-FPBGA EM621FV16BU - xx 1)LF44-TSOP2R o w S e l e c tI/O Circuit Column SelectData ContData ContPre-charge CircuitMemory Array 1024 x 2048A1A2A3A4A5A6A7A0A8A9A10WE OE UB LB CSDQ0 ~ DQ7DQ8 ~ DQ15V CCV SSControl LogicFUNCTIONAL BLOCK DIAGRAMFEATURES•Process Technology : 0.15µm Full CMOS •Organization : 128K x 16 bit•Power Supply Voltage : 2.7V ~ 3.6V •Low Data Retention Voltage : 1.5V(Min.)•Three state output and TTL Compatible •Package Type : 48-FPBGA, 44-TSOP2GENERAL DESCRIPTIONThe EM621FV16B families are fabricated by EMLSI’s advanced full CMOS process technology. The families support industrial temperature range and Chip Scale Package for user flexibility of system design. The families also supports low data retention voltage for battery back-up operation with low data retention current.A11A12A13A14A15A16PIN DESCRIPTIONName FunctionName FunctionCS Chip Select input V CC Power Supply OE Output Enable input V SS GroundWE Write Enable input UB Upper Byte (DQ8~DQ15)A0~A16 Address inputs LB Lower Byte (DQ0~DQ7)DQ0~DQ15Data inputs/outputsNCNo ConnectionPIN CONFIGURATIONSFPBGA-48 : Top view(ball down)123456A LB OE A0A1A2NC B DQ8UB A3A4CS DQ0C DQ9DQ10A5A6DQ1DQ2D V SS DQ11NC A7DQ3V CCE V CC DQ12 NC A16DQ4V SSF DQ14DQ13A14A15DQ5DQ6G DQ15NC A12A13WE DQ7HNCA8A9A10A11NC1234567891011121314151644434241403938373635343332313029A4A3A2A1A0CS DQ0DQ1DQ2DQ3V CC V SS DQ4DQ5DQ6DQ7A5A6A7OE UB LB DQ15DQ14DQ13DQ12V SS V CC DQ11DQ10DQ9DQ844 - TSOP2171819202122282726252423WE A16A15A14A13A12NC A8A9A10A11NC44 - TSOP2 : Top viewABSOLUTE MAXIMUM RATINGS 1)1. Stresses greater than those listed under “Absolute Maximum Ratings” may cause permanent damage to the device. Functional operation should be restricted to recommended operating condition. Exposure to absolute maximum rating conditions for extended periods may affect reliability.FUNCTIONAL DESCRIPTIONNOTE : X means don’t care. (Must be low or high state)ParameterSymbol Ratings Unit Voltage on Any Pin Relative to Vss V IN , V OUT-0.2 to 4.0V Voltage on Vcc supply relative to Vss V CC -0.2 to 4.0V Power Dissipation P D 1.0WOperating TemperatureT A-40 to 85oCCS OE WE LB UB DQ0~7DQ8~15Mode Power H X X X X High-Z High-Z Deselected Stand by X X X H H High-Z High-Z Deselected Stand by L H H L X High-Z High-Z Output Disabled Active L H H X L High-Z High-Z Output Disabled Active L L H L H Data Out High-Z Lower Byte Read Active L L H H L High-Z Data Out Upper Byte Read Active L L H L L Data Out Data Out Word Read Active L X L L H Data In High-Z Lower Byte Write Active L X L H L High-Z Data In Upper Byte Write Active LXLLLData InData InWord WriteActiveRECOMMENDED DC OPERATING CONDITIONS 1)1. TA= -40 to 85o C, otherwise specified2. Overshoot: VCC +2.0 V in case of pulse width < 20ns3. Undershoot: -2.0 V in case of pulse width < 20ns4. Overshoot and undershoot are sampled, not 100% tested.CAPACITANCE 1) (f =1MHz, T A =25o C)1. Capacitance is sampled, not 100% testedDC AND OPERATING CHARACTERISTICS1. Typical values are measured at Vcc=3.3V, T A =25o C and not 100% tested.ParameterSymbol Min Typ Max Unit Supply voltage V CC 2.7 3.3 3.6V GroundV SS 000V Input high voltage V IH 2.2 -V CC + 0.22)V Input low voltageV IL-0.23)-0.6VItemSymbol Test ConditionMin Max Unit Input capacitance C IN V IN =0V -8pF Input/Ouput capacitanceC IOV IO =0V-10pFParameterSymbol Test Conditions Min Typ Max Unit Input leakage current I LI V IN =V SS to V CC-1-1µA Output leakage current I LO CS=V IH or OE=V IH or WE=V IL or LB=UB=V IH V IO =V SS to V CC-1-1µA Operating power supplyI CC I IO =0mA, CS=V IL , WE=V IH, V IN =V IH or V IL --3mA Average operating currentI CC1Cycle time=1µs, 100% duty, I IO =0mA, CS<0.2V, LB<0.2V or/and UB<0.2V, V IN <0.2V or V IN >V CC -0.2V--3mAI CC2Cycle time = Min, I IO =0mA, 100% duty,CS=V IL , LB=V IL or/and UB=V IL , V IN =V IL or V IH 45ns--35mA55ns --30 70ns--25 Output low voltage V OL I OL = 2.1mA--0.4V Output high voltage V OH I OH = -1.0mA2.4--V Standby Current (TTL)I SB CS=V IH , Other inputs=V IH or V IL --0.3mAStandby Current (CMOS)I SB1CS>V CC -0.2V , Other inputs = 0~V CC(Typ. condition : V CC =3.3V @ 25o C) (Max. condition : V CC =3.6V @ 85o C)LF -1 1)10µAAC OPERATING CONDITIONSTest Conditions (Test Load and Test Input/Output Reference)Input Pulse Level : 0.4 to 2.2V Input Rise and Fall Time : 5nsInput and Output reference Voltage : 1.5VOutput Load (See right) : CL 1) = 100pF+ 1 TTL(70nsec) CL 1) = 30pF + 1 TTL(45ns/55ns)1. Including scope and Jig capacitance 2. R 1=3070Ω, R 2=3150Ω3. V TM =2.8V4. CL = 5pF + 1 TTL (measurement with t LZ , t HZ , t OLZ , t OHZ , t WHZ )READ CYCLE (V cc =2.7 to 3.6V, Gnd = 0V, T A = -40o C to +85o C)WRITE CYCLE (V cc =2.7 to 3.6V, Gnd = 0V, T A = -40o C to +85o C)ParameterSymbol45ns 55ns70nsUnitMin Max Min Max Min Max Read cycle time t RC 45-55-70-ns Address access time t AA -45-55-70ns Chip select to output t CO -45-55-70ns Output enable to valid output t OE -25-25-35ns UB, LB access time t BA 4555 70ns Chip select to low-Z output t LZ 10-10-10-ns UB, LB enable to low-Z output t BLZ 5-5-5-ns Output enable to low-Z output t OLZ 5-5-5-ns Chip disable to high-Z output t HZ 020020025ns UB, LB disable to how-Z output t BHZ 015020025ns Output disable to high-Z output t OHZ 015020025ns Output hold from address changet OH10-10-10-nsParameterSymbol45ns 55ns70ns UnitMin Max Min Max MinMax Write cycle timet WC 45-55-70-ns Chip select to end of write t CW 45-45-60-ns Address setup time t As 0-0-0-ns Address valid to end of write t AW 45-45-60-ns UB, LB valid to end of write t BW 45-45-60-ns Write pulse width t WP 35-40-50-ns Write recovery time t WR 0-0-0-ns Write to ouput high-Z t WHZ 015020020nsData to write time overlap t DW 252530ns Data hold from write time t DH 0-0-0-ns End write to output low-Zt OW5-55-nsCL 1)V TM 3)R 12)R 22)TIMING WAVEFORM OF READ CYCLE(2) (WE = V IH )t RCAddresst AA Data Validt OHPrevious Data ValidTIMING WAVEFORM OF READ CYCLE(1) (Address Controlled, CS=OE=V IL , WE=V IH, UB or/and LB=V IL )Data OutTIMING DIAGRAMSt RCAddressCSUB,LBOEData Outt COt OHt BAt OEHigh-Zt BHZt OHZData Validt OLZt BLZ t LZt AAt HZNOTES (READ CYCLE)1. t HZ and t OHZ are defined as the outputs achieve the open circuit conditions and are not referenced to output voltage levels.2. At any given temperature and voltage condition, t HZ (Max.) is less than t LZ (Min.) both for a given device and from device to device interconnection.t WR (4)t WCAddressCSUB,LBWEData inData outt CW (2)t AW t BWt WP (1)t AS (3)High-Zt DWt DHHigh-Z t OWt WHZData UndefinedTIMING WAVEFORM OF WRITE CYCLE(1) (WE Controlled)Data Validt WCAddressCSUB,LBWEData inData outt CW (2)t WR (4)t BWt WP (1)t DWt DHTIMING WAVEFORM OF WRITE CYCLE(2) (CS Controlled)t AS (3)High-Z High-ZData Validt AWNOTES (WRITE CYCLE)1. A write occurs during the overlap(t WP ) of low CS and low WE. A write begins when CS goes low and WE goes low with asserting UB or LB for single byte operation or simultaneously asserting UB and LB for double byte operation. A write ends at the earliest transition when CS goes high and WE goes high. The t WP is measured from the beginning of write to the end of write.2. t CW is measured from the CS going low to end of write.3. t AS is measured from the address valid to the beginning of write.4. t WR is measured from the end or write to the address change. t WR applied in case a write ends as CS or WE going high.t WCAddressCSUB,LBWEData in Data outt CW (2)t WR (4)t BWt WP (1)t DWt DHTIMING WAVEFORM OF WRITE CYCLE(3) (UB, LB Controlled)High-ZHigh-ZData Validt AS (3)t AWDATA RETENTION CHARACTERISTICSNOTES1. See the I SB1 measurement condition of datasheet page 5.2. Typical values are measured at T A =25o C and not 100% tested.ParameterSymbolTest ConditionMinTyp 2)MaxUnitV CC for Data Retention V DR I SB1 Test Condition (Chip Disabled)1)1.5- 3.6V Data Retention CurrentI DR V CC =1.5V, I SB1 Test Condition(Chip Disabled)1)-0.5 5.0µAChip Deselect to Data Retention Time t SDR See data retention wave form0--nsOperation Recovery Timet RDRt RC--DATA RETENTION WAVE FORMt SDRt RDRData Retention ModeCS1 > Vcc-0.2VV cc 2.7V2.2V V DRCS, LB / UBGNDPACKAGE DIMENSION44 - TSOP2 (0.8mm pin pitch)Unit : millimeters / inches0.5#A1A0.79 T y p .0.25 T y p .E 20.26E 1E AB CDEF G H654321B B10.5CC 1B/2C 1/2BC48 Ball Fine Pitch BGA (0.75mm ball pitch)Bottom ViewTop ViewCDYMinTyp Max A -0.75-B 5.93 6.00 6.03B1- 3.75-C 6.937.007.03C1- 5.25-D 0.300.350.40E 1.00 1.04 1.10E1-0.79-E2-0.25-Y--0.08NOTES.1. Bump counts : 48(8row x 6column)2. Bump pitch : (x,y)=(0.75x0.75) (typ.)3. All tolerence are +/-0.050 unless otherwise specified.4. Typ : Typical5. Y is coplanarity : 0.08(Max)Side ViewDetail AA1 index MarkUnit: millimetersMEMORY FUNCTION GUIDE1. Memory Component8. VersionBlank---------------Mother die2. Device Type A ---------------2 nd generation 6---------------Low Power SRAM B ---------------3 rd generation 7---------------STRAM C ---------------4 th generation C ---------------CellularRAM D ---------------5 th generation E ---------------6 th generation3. Density F ---------------7 th generation 1--------------- 1MG ---------------8 th generation 2--------------- 2M 4--------------- 4M 9. Package8--------------- 8M Blank---------------KGD, FBGA 16--------------- 16M S ---------------32 sTSOP132--------------- 32M T ---------------32 TSOP164--------------- 64M U ---------------44 TSOP228---------------128MV ---------------32 SOP 4. Option 10. Speed 0---------------Dual CS 45--------------- 45ns 1---------------Single CS 55--------------- 55ns 60--------------- 60ns 5. Technology 70--------------- 70ns F ---------------Full CMOS 85--------------- 85ns 90--------------- 90ns 6. Operating Voltage 10---------------100ns T ---------------5.0V 12---------------120nsV ---------------3.3V U ---------------3.0V 11. Power S ---------------2.5V LL ---------------Low Low PowerR ---------------2.0V LF ---------------Low Low Power(Pb-free & Green)P ---------------1.8V L ---------------Low PowerS ---------------Standard Power7. Organization 8--------------- X8 bit 16---------------X16 bit 32---------------X32 bitEMX XX XXX XX XX -XX XX1. EMLSI Memory2. Device Type 11. Power3. Density 10. Speed4. Function 9. Package5. Technology 8. Version6. Operating Voltage7. Organization。
英语北京硅谷时代技术开发中心其他产品介绍

一、滚瓜烂熟系列《英语发音滚瓜烂熟》发音是任何一种语言的基础,英语学习要从英语发音开始。
只有掌握了标准英语发音,才能说出纯正的英语,才能听懂正常语速的对话,也才能自如地用英语交流。
硅谷时代互动英语实验室经过长期素材准备、技术开发,推出了《英语发音“滚瓜烂熟”》学习软件。
1、素材权威丰富素材由人教社选定的专家及外籍学者编写、朗读。
素材包含数千个发音盲点(近似音)的辩识练习和分门别类的10000多单词。
发音盲点包含音标盲点、音节盲点、单词盲点等,并且用户在学习过程中还会智能地产生用户自己的盲点。
2、目标彻底《英语发音“滚瓜烂熟”》的目的是使您对英语发音的敏感度就象母语一样,任何英语发音都能在您大脑里产生直接反射,英语的听和说再也不需要经过反复思考。
3、功能强大音标学习:通过音标发音技巧、音标发音校正、音标听写、常见音标盲点辩识、用户音标盲点辩识等功能使您对每一个音标都能正确发音和辨别。
音节学习:通过音节拼读、音节听写、常见音节盲点辩识、用户音节盲点辩识等功能进一步提高您对音语发音的敏感度,并且使您以后看到任何单词都会发音。
常见单词盲点辩识:本产品从国家教委指定教材中精心挑选了数千个单词盲点,如“thin”和“thing”,“sin”和“thin”,“wheat”和“wait”,“ship”和“sheep”等,让您反复辩识。
学完这些盲点后,您再也不会在听英语时因某个单词而打顿。
用户单词盲点辩识:用户单词盲点是您在学习过程中产生的盲点。
该功能是为您自己量身定制的一套单词发音盲点解决方案。
捋单词:让您一遍一遍地将所有常用单词的发音和词义捋得滚瓜烂熟。
捋单词与一般的单词记忆法完全不同,它总是让您优先记忆您最不熟悉的单词,使您在短时间内对10000余个常用单词的熟悉程度都同“Sorry”一样,脱口而出。
我们的单词库按难易程度分为8个等级,用户可以根据自己的英语水平选择任一个等级。
4、适用面广本产品适合每一个英语学习者,如果您是初学者,您可以用来学好发音,并快速高效地提高听力水平;如果您已具备一定英语水平,本产品将会使您的听说能力产生突破性提高;如果您的英语水平非常高,本产品仍然对提高英语敏感度大有裨益。
- 1、下载文档前请自行甄别文档内容的完整性,平台不提供额外的编辑、内容补充、找答案等附加服务。
- 2、"仅部分预览"的文档,不可在线预览部分如存在完整性等问题,可反馈申请退款(可完整预览的文档不适用该条件!)。
- 3、如文档侵犯您的权益,请联系客服反馈,我们会尽快为您处理(人工客服工作时间:9:00-18:30)。
Organizational Health Index(OHI)Using ‘Organizational Health’ to buildand sustain financial performanceShifting your organization toward higher performance u Assess underlying mindsets and behaviors that impact financial performanceu Benchmark your organization’s health index against your industry and high performers u Understand your organization’s archetype to identify the six to seven “must-have”practices for successu Prioritize intervention programs needed to improve healthu Periodically track health to ensure ongoing progress and catch potential issues early Connecting with expertsu Gain important, and often unexpected, insights identified by analysts with experience across many companies, industries, and geographiesu Develop the best solution for your company by drawing upon McKinsey’s deep organizational expertise and broad experience serving 96% of the world’s leading global institutionsCompetitive insightsu The OHI solution includes benchmarks against a continuously growing, proprietarydatabase of more than 600 companies in all industries across the globeArchetypesu Instead of a “one-size-fits-all” approach, McKinsey has identified four patterns ofbehaviors, or archetypes, to help a company identify its optimal path forward/ohiThe Organizational Health Index solution provides detailed findings for how your company is performing on the nine elements of health related to financial performance. These findings include ‘sore’ points as well as best practices for business units, functional groups, and organizational layers.McKinsey’s Basic BeliefsLinking organizational health and performanceThe OHI solution…Focus on the right practicesAlthough a company must achieve a minimum threshold level for all management practices, they need distinctiveness in only six to seven practicesHealth mattersFinancial performance is driven by organizational health - 9 elements with 34 underlying management practicesOrient for actionThe management challenge is to fully understand its archetype and select the right combination of management practices necessary to deliver outstanding performance and healthKnow your organization’s archetypeMcKinsey has identified four patterns of organizational behavior or “archetypes”, that most companies fall into: market focus, execution edge, talent/knowledge core, and leadership-drivenProvides hard measures for the soft issues that impact financial performanceBenchmarksorganizational health against a wide range of competitors and top performersIdentifies and prioritizes needed changes and intervention programsTracks progress and catches potential issues early1234Comprehensive OHI assessment surveyuAn online employee survey of an organization’s entire population or specificsegments (paper-based survey available for employees without computer access)u In-depth interviews and focus groups to gain a deeper understanding of the key issues uAdditional survey modules, if needed, to assess specific areas; for example, social networks, top management effectiveness, change readinessRigorous analysis and benchmarkingu McKinsey experts analyze organizational health results for the overall organization, business units, functional groups, management layers, and other subgroups as neededuExperts benchmark results against a proprietary database of more than 600 companies codified in a set of management reports to guide the problem solvingProblem-solving session and identification of initiativesuMcKinsey leaders share OHI results with leadership and facilitate managementworkshops to discuss implications, set aspirations, develop interventions and initiatives, and identify milestonesTracking progressu The OHI survey is conducted periodically to comprehensively or selectively track progress uMcKinsey experts discuss with management key learnings from the tracking survey including progress madeFrom designing the approach to tracking progress, the Organizational Health Index solution relies on McKinsey’s close collaboration with youand your management team.For more information on OHI, visit /ohior send an email to ohi@For more information on McKinsey Solutions, visit /catalog or send an email to mckinseysolutions@O H I -1007 V 01。