雅思写作—小作文图表题万能开头
雅思小作文开头模板

雅思小作文开头模板英文回答:In my opinion, there are several ways to start an IELTS Writing Task 1. One common approach is to begin by introducing the topic and providing some background information. For example, if the task requires you to describe a chart or graph, you can start by stating what the chart shows and where the data comes from. This helps to set the context for the reader and gives them a clear understanding of what they can expect from the rest of the essay.Another effective way to start an IELTS Writing Task 1 is to highlight the most significant or interestingfindings from the data. This can capture the reader's attention and make them want to learn more about the information presented in the chart or graph. For instance, if the chart shows a dramatic increase in a certain trend, you can begin by pointing out this key finding and thendelve into the details in the following paragraphs.中文回答:在我看来,有几种方法可以开始雅思写作任务1。
雅思经典图表作文范文

#45. The charts below show the percentage of their food budget the average family spent on restaurant meals in different years. The graph shows the number of meals eaten in fast food restaurants and sit-down restaurants.You should write at least 150 words.Give reasons for your answer and include any relevant examples from your own knowledge or experience.Over the past 30 years, the average family has dramatically increased the number of meals that they eat at restaurants. The percentage of the family's food budget spent on restaurant meals steadily climbed. Just 10 percent of the food budget was spent on restaurant meals in 1970, and 15 percent in 1980. That percentage more than doubled in 1990, to 35 percent, and rose again in 2000 to 50 percent. Where families eat their restaurant meals also changed during that 30-year period. In 1970, families ate the same number of meals at fast food and sit-down restaurants. In 1980, fam¬ilies ate slightly more frequently at sit-down restaurants. However, since 1990, fast food restaurants serve more meals to the families than do the sit-down restaurants. Most of the restaurant meals from 2000 were eaten at fast food restaurants. If this pattern continues, eventually the number of meals that families eat at fast food restaurants could double the number of meals they eat at sit-down restaurants.(164 words)#44. You should spend about 20 minutes on this task.The map below is of the town of Garlsdon. A new supermarket (S) is planned for the town. The map shows two possible sites for the supermarket.Summarise the information by selecting and reporting the main features, and make comparisons where relevant.You should write at least 150 wordsmodel answer:The first potential location (S1) is outside the town itself, and is sited just off the main road to the town of Hindon, lying 12 kms to the north-west. This site is in the countryside and so would be able to accommodate a lot of car parking. This would make it accessable to shoppers from both Hindon and Garlsdon who could travel by car. As it is also close to the railway line linking the who towns to Cransdon (25 km to the south-east), a potentially large number of shoppers would also be able to travel by train.In contrast, the suggested location, S2, is right in the town centre, which would begood for local residents. Theorically the store could be accessed by road or rail from the surrounding towns, including Bransdon, but as the central area is a no-traffic zone, cars would be unable to park and access would be difficult. Overall, neither site is appropriate for all the towns, but for customers in Cransdon, Hindon and Garlsdon, the out-of-town site (S1) would probably offer more advantages.(179 words)# 43. You should spend about 20 minutes on this task.The table below shows CO2 emissions for different forms of transport in the European Union.The Pie Chart shows the percentage of European Union funds being spent on different forms of transport.You should write at least 150 words.model answer:The chart shows CO2 emissions per passenger kilometre for variuos methods of transport in the European Union while the pie chart shows European Union spending on transport. Flying by air produces by far the greatest CO2 emissions, approximately three times as much as passenger cars which are the next largest producers. Very little is spent by the EU on air travel while roads make up more than half of the EU transport budget.Trains produce about three times less CO2 emissions per passenger kilometre than passenger cars and eight times less than air travel. Nearly a third of EU transport funds are spent on railways.Ships are a clean form of transport and produce about the same amount of CO2 per passenger kilometre as trains do. However, only 2 percent of EU funds are spent on ports. A further one percent is spent on inland waterways.Coaches are the cleanest form of transport. Emissions of CO2 per passenger kilometre from coaches are half those of buses. Buses emit less than half as much CO2 per passenger kilometre as cars. The European Union spends 10 percent of its transport budget on public transport, such as buses and coaches. (197 words)The table below shows the sales at a small restaurant in a downtown business district.Summarize the information by selecting and reporting the main features, and make comparisons where relevant.You should write at least 150 words.Give reasons for your answer and include any relevant examples from your own knowledge or experience.model answer:The sales at this small restaurant during the week of October 7 to 13th followed a fairly set pattern from Monday to Friday, and then showed notable shift on the weekend. The lunch and dinner sales during the week peaked on Friday and then dipper down as the weekend set in.During the week of October 7-14th, the lunch sales averaged at approximately $2,400. The highest lunch sales occurred on Friday, and the lowest occurred on Sunday. Sunday's lunch sales were approximately $1,000 less than the average lunch sales during the rest of the week.Dinner sales, which generated at least $1,000 to $1,500 more a day than lunch sales, also remained steady during the week. Just like the lunch sales, the dinner sales peak on Friday and dipped down for the weekend.Excluding Wednesday and Thursday, the lunch and dinner sales from October 7-11 rose gradually until the end of the business week. Midweek, on Wednesday and Thursday, the sales were slightly lower than they were on Tuesday.According to the sales report, this restaurant has a steady lunch and dinner crowd. The most profitable day during the second week of October was Friday. Sunday, was the least prof¬itable day, with the full day's sales totaling/totalling less than the Friday dinner sales. These numbers are reflective of a restaurant that is located in a business/financial district where business hours are Monday through Friday.In June 1996, an experimental flu vaccine was trialled in a large country town on females only.Summarise the information by selecting and reporting the main features, and make comparisons where relevant.You should write at least 150 words.Give reasons for your answer and include any relevant examples from your own knowledge or experience.model answer:The diagrams show data for a flu epidemic which hit a large country town in 1996. Figure 1 gives the number of persons who died; Figure 2 shows the percentage breakdown of females who received a new flu vaccine; and Figure 3 gives the number of cases of flu before and during the epidemic.In Figure 1 it can be seen that the flu was responsible for the deaths of 2 females but no males in the period from March to May. However, from June to August, there were 4 female deaths and 1 male death.According to the pie chart in Figure 2, only those females most at risk were given the new flu vaccine; 28% did not take part in the trial. Of those females who took part, 35% were aged (over 65 years old); 24% were babies or children; and 13% were either hospitalised or receiving other medical attention.From Figure 3 it is clear that the new vaccine had a positive effect on the number of new cases of flu reported in females. There were just over 1000 cases reported in March, climbing rapidly to a peak of 3500 in June. Thereafter, the number of cases dropped slowly to about 2800 in August, before levelling off at 2500 for the rest of the year. For males, the figures were lower but showed a similar trend throughout the epidemic.(232 words)#39. You should spend about 20 minutes on this task.The chart below shows estimated world literacy rates by region and by gender for the year 2000.Write a report for a university lecturer describing the information below.You should write at least 150 words.model answer:In this report I will describe a bar chart that shows the estimated world illiteracy rates by gender and region for the year 2000.First I will look at male illiteracy for the 6 areas shown. The lowest rates were in Developed Countries, Latin America/Caribbean and East Asia/Oceania with rates of 1% (approximately), 10% and 8% (approximately) respectively. The rates for the next three areas were much higher and quite similar to each other. Sub-Saharan Africa, the Arab States and South Asia had rates of approximately 31%, 29% and 34%.Female illiteracy was much higher relatively in each area except LatinAmerica/Caribbean where it was only slightly higher. The lowest rates for female illiteracy were again Developed Countries, Latin America/Caribbean and East Asia/Oceania with rates of approximately 2%, 12% and 20%. Again the rates for the next three areas were much higher and quite similar to each other. Sub-Saharan Africa, the Arab States and South Asia had rates of approximately 48%, 52% and 56%.This ends my report.# 38. You should spend about 20 minutes on this task.The chart shows the number of mobile phones and landlines per 100 people in selected countries.Write a report for a university lecturer describing the information given.You should write at least 150 words.model answer:The graph shows the number of mobile phones and landlines per 100 users, for selected countries. Overall, most of the countries included in the graph have more mobile phones subscribers than landlines.Most European countries have high mobile phone use. The biggest users of mobile phones are the Italians, with 88 cell phones per 100 people. For example, Italy has twice as many mobile phones as landlines, with 88 mobiles per hundred people compared to 45 for landlines. Mobile phone use is low in Canada, with fewer than 40 phones per 100 people. Denmark is also unusual because it has slightly more landlines than mobile phones.However, in some countries, the number of landlines is higher than the number of mobile phones. One example is the USA, where the number of mobiles, at 50 per 100 people, is much lower than the number of landlines, at almost 70 per hundred.A similar pattern can be seen in Canada. The highest number of landlines in the graph is in Denmark, with about 90 per 100 people. In contrast, the lowest figures for fixed lines are in Italy and the UK.In conclusion, it seems that mobile phone use is higher in Europe than in North America.# 37. You should spend about 20 minutes on this task.The graphs show enrolment in different colleges in the Higher Colleges of Technology in 1999.Write a total of 150 - 200 words about the information in the three graphs. Write a report for a university lecturer describing the information given. You should write at least 150 wordsmodel answer:The charts shows student enrolment by gender and level in different colleges of the Higher Colleges of Technology colleges in the UAE.There are clear differences in male and female enrolment. Females outnumber men in all the colleges, with almost 25% more students in Dubai Women's college than in Dubai Men's. Ras Al-Khaimah Women's College has almost 180 students, compared to only 100 in the Men's college.Females also outnumber males by level, with almost double the number of men at Higher Diploma level (330 compared to 181). Only at Diploma level does the number of men slightly exceed that of women.Over half the students are in Certificate level, with less than a quarter at Higher Diploma or Bachelor level.In conclusion, most students in the Higher Colleges are enrolled at Diploma level or below, and the majority of students are women.(143 words)# 36. You should spend about 20 minutes on this task.The line graph below shows the number of annual visits to Australia by overseas residents. The table below gives information on the country of origin where the visitors came from. Write a report for a university lecturer describing the information given.You should write at least 150 words.NUMBER OF VISITORS (million)1975 2005SOUTH KOREAJAPANCHINAUSABRITAINEUROPE 2.93.20.30.40.91.19.112.00.81.12.94.5Total 8.8 30.4model answer:The given line graph illustrates information on the number of overseas visitors traveling to Australia in millions of people. Overall, one notable trend seems to be that Australia has steadily become more popular as a destination spot. For example, there were 20 million more visitors to Australia in 2005 than in 1975. That's a jump from 10 million to 30 million in 20 years.The second table gives statistics showing the countries whose residents went to Australia between 1975 and 2005. In both years, the largest number of visitors came from Japan, followed by South Korea and Europe. Britain, the United States and China also had many people traveling to Australia in these years. In fact, the number of people visiting Australia grew in every one of these countries. For example, in 2005, 12 million people went there from Japan compared with only 3.2 million in 1975.(147 words)#35. You should spend about 20 minutes on this task.The table below shows the consumer durables (telephone, refrigerator, etc.) owned in Britain from 1972 to 1983.Write a report for a university lecturer describing the information shown below. You should write at least 150 words.Consumer1972 1974 1976 1978 1979 1981 1982 1983 durablesPercentage ofhouseholds with:central heating 39 43 48 52 55 59 60 64television 93 95 96 96 97 97 97 98video 18vacuum cleaner 87 89 92 92 93 94 95refrigerator 73 81 88 91 92 93 93 94washing66 68 71 75 74 78 79 80 machinedishwasher 3 3 4 4 5telephone 42 50 54 60 67 75 76 77 model answer:The chart shows that the percentage of British households with a range of consumer durables steadily increased between 1972 and 1983. The greatest increase was in telephone ownership, rising from 42% in 1972 to 77% in 1983. Next came centralheating ownership, rising from 37% of households in 1972 to 64% in 1983. The percentage of households with a refrigerator rose 2 1% over the same period and of those with a washing machine by 14%. Households with vacuum-cleaners. televisions and dishwashers increased by 8%, 5% and 2% respectively. In 1983. the year of their introduction, 18% of households had a video recorder.The significant social changes reflected in the statistics are that over the period the proportion of British houses with central heating rose from one to two thuds, and of those with a phone from under a half to over three-quarters. Together with the big increases in the ownership of washing machines and refrigerators, they are evidence of both rising living standards and the trend to lifestyles based on comfort and convenience.#34. You should spend about 20 minutes on this task.The table below shows the figures for imprisonment in five countries between 1930 and 1980.Write a report for a university, lecturer describing the information shown below. You should write at least 150 wordsmodel answer:The table shows that the figures for imprisonment in the five countries mentioned indicate no overall pattern of increase or decrease. In fact there is considerable fluctuation from country to country.In Great Britain the numbers in prison have increased steadily from 30 000 in 1930 to 80,000 in 1980. On the other hand in Australia, and particularly in New Zealand the numbers fell markedly from 1930 to 1940. Since then they have increased gradually, apart from in 1980 when the numbers in prison in New Zealand fell by about 30,000 from the 1970 total. Canada is the only country in which the numbers in prison have decreased over the period 1930 to 1980, although there have been fluctuations in this trend. The figures for the United States indicate the greatest number of prisoners compared to the other four countries but population size needs to be taken into account in this analysis. The prison population in the United States increased rapidly from 1970 to 1980 and this must be a worrying trend.。
雅思作文图表题范文(热门3篇)

雅思作文图表题范文第1篇It is said that countries are becoming similar to each other because of the global spread of the same products, which are now available for purchase almost anywhere. I strongly believe that this modern development is largely detrimental to culture and traditions worldwide.A country’s history, language and ethos are all inextricably bound up in its manufactured artefacts. If the relentless advance of international brands into every corner of the world continues, these bland packages might one day completely oust the traditional objects of a nation, which would be a loss of richness and diversity in the world, as well as the sad disappearance of the manifestations of a place’s character. What would a Japanese tea ceremony be without its specially crafted teapot, or a Fijian kava ritual without its bowl made from a certain type of tree bark?Let us not forget either that traditional products, whether these be medicines, cosmetics, toy, clothes, utensils or food, provide employment for local people. The spread of multinational products can often bring in its wake a loss of jobs, as people urn to buying the new brand, perhaps thinking it more glamorous than the one they are used to. This eventually puts old-school craftspeople out of work.Finally, tourism numbers may also be affected, as travelers become disillusioned with finding every place just the same as the one they visited previously. To see the same products in shops the world over is boring, and does not impel visitors to open their wallets in the same way that trinkets or souvenirs unique to the particular area too.Some may argue that all people are entitled to have access to the same products, but I say that local objects suit local conditions best, and that faceless uniformity worldwide is an unwelcome and dreary prospect.Heres my full answer:The line graphs show the average monthly amount that parents in Britain spent on their children’s sporting activities and the number of British children who took part in three different sports from 2008 to is clear that parents spent more money each year on their children’s participation in sports over the six-year period. In terms of the number of children taking part, football was significantly more popular than athletics and 2008, British parents spent an average of around £20 per month on their children’s sporting activities. Parents’ spending on children’s sports increased gradually over the following six years, and by 2014 the average monthly amount had risen to just over £ at participation numbers, in 2008 approximately 8 million British children played football, while only 2 million children were enrolled in swimming clubs and less than 1 million practised athletics. The figures for football participation remained relatively stable over the following 6 years. By contrast, participation in swimming almost doubled, to nearly 4 million children, and there was a near fivefold increase in the number of children doing athletics.剑桥雅思6test1大作文范文,剑桥雅思6test1大作文task2高分范文+真题答案实感。
雅思写作考试作文万能模板

雅思写作考试作文万能
雅思写作考试作文万能模板
1The bar chart illustrates that…该柱状图展示了
2 As is shown in the bar chart, 如柱状图所示,
3It can be concluded from the barchart that…从该柱状图我们可以推导出
4 The bar chart presents the general trend in…该柱状图描述了……总的趋势
5 This bar chart displays the numbers of…该柱状图展示了…的数据
6 The number of … increased by %…的数字上升了百分之…
7 The number of… dropped by %…的数字下降了百分之…
8 The chart reflects several trends. 该图展示了几个趋势
9As can be seen clearly from the barchart, the fluctuation of…tookplace
从该柱状图我们可以清楚地看出:…出现了波动
10 Over the period from…to…the…remained level. 在……至……期间,…基本不变。
作文范文之雅思图表类英语作文模板
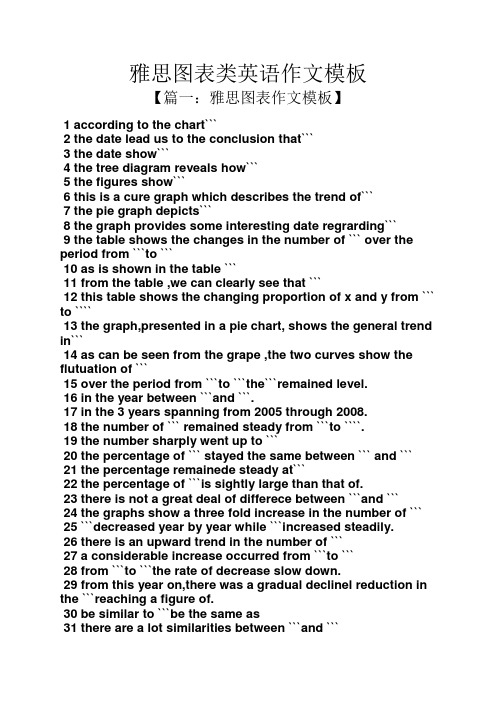
雅思图表类英语作文模板【篇一:雅思图表作文模板】1 according to the chart```2 the date lead us to the conclusion that```3 the date show```4 the tree diagram reveals how```5 the figures show```6 this is a cure graph which describes the trend of```7 the pie graph depicts```8 the graph provides some interesting date regrarding```9 the table shows the changes in the number of ``` over the period from ```to ```10 as is shown in the table ```11 from the table ,we can clearly see that ```12 this table shows the changing proportion of x and y from ``` to ````13 the graph,presented in a pie chart, shows the general trend in```14 as can be seen from the grape ,the two curves show the flutuation of ```15 over the period from ```to ```the```remained level.16 in the year between ```and ```.17 in the 3 years spanning from 2005 through 2008.18 the number of ``` remained steady from ```to ````.19 the number sharply went up to ```20 the percentage of ``` stayed the same between ``` and ```21 the percentage remainede steady at```22 the percentage of ```is sightly large than that of.23 there is not a great deal of differece between ```and ```24 the graphs show a three fold increase in the number of ```25 ```decreased year by year while ```increased steadily.26 there is an upward trend in the number of ```27 a considerable increase occurred from ```to ```28 from ```to ```the rate of decrease slow down.29 from this year on,there was a gradual declinel reduction in the ```reaching a figure of.30 be similar to ```be the same as31 there are a lot similarities between ```and ```32 the difference between x and y lies in ``para 1,两句话:第一句:this is a _____chart, which demonstrates the number of_____ from ____ to____. 如果两个图,则:there are two charts below. the _____ chart describes the number of_____, and the _____ chart illustrates the figure of ____. 第二句:(所有题目适用),from thechart we can see that the number of ______ variesconstantly/greatly in _____. )para 2, as we can see from the chart,/or it is clear from thechart that ____. 如果有两个图:则:the _____ chart shows that ______./or as we can see from the first chart, _______para 3, (如果两个图的话,) it is clear from the second chartthat ?para 4 结尾:from the figures/statistics above, we cansee/conclude/draw a conclusion that ?the bar chart indicates the current situation of the amount of money spent on fastfoods according to different income classes in britain.for those who belong to the high-income class, hamburgerhas been shown to beperson per week. by contrast fish and chips remain at a rather low level of about 16pence per person per week, and pizza, though attracts more expenses, accounts for 19pence per person per week, merely 3 pence more than that of fish and chips.as expected, low-income class spend much less in all 3 categories than high-incomeclass, with fish and chips at the top of the list at 15 pence per capital per week, andpizza at the bottom at a weekly expense of 8 pence per capital. the average income group resembles high-income class in hamburger consumptionat the largest amount of 33 per person every week, and low-income class in pizzaconsumption at the smallest amount of 11 per person every week, but amazingly, fishand chips consumed by this group leads all classes at a weekly expense of 25 penceper person.in conclusion, hamburgers, in general gain more welcome than other types of fastfood.para1. this is a table / chart / (line线状 bar柱状 pie饼状)graph which demonstrate / illustrate /reveal /depict /privide information about.............para2.(1)obvious /apparent from the graph is that ...rank thefirst/highest,while/whereas ....turn out tobe the lowest(2)it is exhibited/shown in the table that.....(3)it can be seen from the table that.....para3.(1)饼.柱图 a,which accounts for...%,ranks the first;then next is b with...%;followed byc,constituting...%;finally it comes d.e.fat...%...%and...%respectively(2)特殊变化(不变,增长或下降多的)(3)①it is worth mentioning that.... ②it must be pointed out that.... ③morestriking/suprising is that.... para4.to conclude /inconclusion/overall1. 最明显的原因__,因此___the most obvious reason for this phenomenon is that_____consequently, ____.2. 无论你喜欢与否,_____已经变得越来越流行,这是有原因的no matter you like it or not, aaa has become more and more popular and there are many reasonfor it.3. 对我们来说,改变这个不利的环境____是非常紧急的it’s an urgent task for us to change this unfavorable situation: ____.4. 这个图片会让你想起一些奇怪的东西,这种现象还是会继续存在这个社会the picture can reminds you of some strange, yet familiar phenomena existing in our society.5. 提供了大量的解决方案,一些人建议___,另一些人建议___a great number of solutions are being offered. some people suggest that ____. others argue that .6. 对于____,我们应该____confronted with aaa, we should take a serious of effective measures to cope with thesituation.7. 然而,___引起了许多为问题,however____ may cause some problems. first, it is__second, __. finally, ____. so, it is clear that__has its advantages and disadvantages.8. 虽然_____有一个__的非常大的好处,但是它不能完全__在__方面although _____ has a great advantage of _____, it cant compete with ____ in ____.9. _____也许更喜欢_____,但是_____忍受_____的不利之出_____may be preferable to ____, but it suffers from the disadvantages that___.10. _____的有利之处比____的有利之处要多,举例说明,_____the advantages of ______are much greater that thoseof____.for instance, ___.11.but i don’t think it is a very good way to solve ___. for instance, _____.worst of all,______.12.there are many ways to ______. first, _____. second, _____. third, ___.13.on the contrary, there are some people in favor of _____.14.they believe___. moreover, they think____. there are several measures for us to adopt. first,we can____, there are a number of advantages of ____. another solution is to _____.15.it is high time that something was done about it. for example,_____. in addition,_____. all these measures will certainly _.16. there are some other people, who______. their reasons are different, something for _____,sometimes for____, and sometimes simply for _____.17._____ is necessary and important to our country’s development and construction. first, ____.what’s more, ___. most important of all,___.18.however, if not managed properly, ____ can create many problems.sometimes ____.furthermore,_. therefore, ___ has been gaining public concern.19.有很多原因____,①there are probably many reasons for ____. first, ____.②second, ____. finally, ___.there are, i think, two main reasons for __. in the first place, ___. in the second place, __. therefore,③well, why is there ____? i think there might be two reasons. one is ___, and the other is _____.④why___? for one thing, ____. for another,____. perhaps the main reason is ___.⑤why_____? the first reason is that___. the second reason is ___. the third is__. for all this,the main cause of_____ is due to ____.20.it is no easy job to find the reasons for this tendency which involves several complicated factors. for some ___. for others ____.21. “why do _____?” many people often ask questions like this.22. in recent years, there is a general tendency to ___. according to a study, there is__. comparedwith __ last year. why _____?23.according to a survey, there is a growing number of ___. what brings this result? the mainreason rests with.24.①some people prefer to ___. in their opinion, ____. in addition, ____. nevertheless,nowadays, __ has become more and more common.②many people are inclined to____. in their opinion, ___.they believe that ___.25. today, there __, which have brought a lot of harms in our daily life. first, __ second, ____. what makes things worse is that ___.26.nowadays, ___ has become a problem we have to face. though it’s easier said than done, with the help of modern technology, we now have many means to solve it.27. 对于这个图,说明了_①the graph shows the general trend in _______.②according to the figures/numbers/statistics/percentages in the table/chart/bar graph/line graph, it can be seen that ___. obviously, ____, but why?③the figure indicates/shows/suggests/proves that___. there isa steady/rapid development/trend of _.④from the graph/chart, we know the statistics of __ and _. it can be seen easily that ___.⑤according to the two graphs presented, it can be observed that ___ in the left graph, __. at the same time, _ as the right graph shows.28. 现在我们经常听到_____,但是真的如此吗?①these days we are often told that ____. but is it true?②these days we often hear about ___. but is this really the case?29. 一位著名的作家曾经说过_____one of the great writers once said that _. now it still has a realistic significance.30. 回看历史,______的想法从来都没流行过,一方面_____另一方面______in our history, the idea that ____ never has been so popular. on one hand, ___, on the other hand,31. 人们中有许多像____不同的意见,一些人认为_______there are different opinions among people as to ____. some people suggest that __.32. 一些人认为__对_______来说在许多方面都是好的,然而,其他人不同意some people hold the opinion that _ is superior to __ in many ways: others, however, disagree with it.33. 现在虽然越来越多的人___,但仍有一些__的人,他们也许认为_____nowadays although more and more people __, still there are some who think __, they may think【篇二:雅思图表作文模板20篇下载】智课网ielts备考资料雅思图表作文模板20篇下载摘要:雅思图表作文模板20篇下载。
雅思小作文模板
第 1 页中公留学无忧,让留学更简单小作文模板素材雅思小作文很多人不要模板, 拒绝套用雅思作文模板。
但是对于初试者, 或者目 标分是雅思 6 分的学生而言, 作文模板是必要而且也确实有效的。
关键是要有逻 辑性。
只要具备一定的逻辑性,模板一样会非常出彩!雅思小作文总体分为两种: 线状图/饼状图/柱状图/柱状图/表格题/地图题/流程 图万能开头与结尾模板:(6.0 分以下均可适用,6.5 分以上参考使用) 开头1.This graph/pie chart/table/bar chart reflects the (rate/percentage/proportion/number … ) of ( 对 象 ) in(place/country) from …to …2.According to the figure , it is not spurring findings that there was/were 总体趋势的描述(the overall trend tended to indicate …/the general trend is …/其他) 结尾1.In conclude , the overall trend tended to illustrate ……during this XX year period2.the data/statistics/figures lead us to the conclusion that ……这些数 据资料令我们得出结论……按题型类别:(提供很多句式请自选)①线状图1.先(上升/下降)后(下降/上升),之后便平稳(1)According to the data , the years from … to … saw/witness a rise/climb/drop in the number/rate/percentage/proportion of 对象 from 数据 to 数据,which was followed by a rapid decrease/reduce/increase over the **years.(2)The number/rate…dropped/went up again from…in ** year to…in ** year第 1 页第 2 页中公留学无忧,让留学更简单and then went up gradually until ** year ,when there was a leveling off/leveling out at 数据 for 一段时间。
雅思小作文范文表题(必备14篇)

雅思小作文范文表题(必备14篇)雅思小作文范文表题第9篇雅思小作文范文表题第10篇Task achievement1. 文章基本呈现了图表中的全部数字。
为了避开数字过多的状况,同一学位水平中男女所占比例只消失了一个(总和为100%)。
不影响我们对图表的认知。
2. 文章结尾处总结了图表的整体特点,即文章来自老烤鸭雅思男性在高等学位和低等学位所占比例较多,而女性则在本科阶段所占比例较多。
3. 文章对数据进行了合理对比。
主体段一开头先指出男女差异最大的类别。
然后将剩余类别根据男性多于女性或者女性多于男性进行分类比较。
Coherence and Cohesion1. 文章规律结构合理。
分组之间没有消失重复的状况,而且点出了最大的差异所在。
2. 使用了各种各样的链接手段。
如其次段开头的immediately, 其次段结尾处的by contrast, 第三段开头的at the higher levels of education等。
也就是说链接手段并不肯定得是and或者however,重要的是让文章整体行文流利通常。
3. 指代方面,利用定语从句和词汇(counterpart)来避开混乱和重复。
Lexical Resource文章用词丰富,持有学位使用了held,with,reach等进行同义替换。
同时比较过程中除了使用比较级之外,还用了outnumber这样的词来展现自己的词汇积累。
Grammatical Range语法结构方面,文章虽然也有各种各样的从句,但并不是每个句子都很简单。
关键在于句子结构各不相同。
敏捷使用各种非谓语动词,状语前置来呈现句子的多样性。
雅思小作文范文表题第11篇题目:The bar chart below shows the proportions of English men and women of different ages who were living alone in 2023. The pie chart compares the numbers of bedrooms in these one-person households. Living alone in England by age and gender, 2023Number of bedrooms in one-person households (England, 2023)雅思小作文范文表题第12篇Dear Sir/ Madam,Dear Professor Moss,I am Sandy, a junior student of the Department of Electrical and Computer Engineering. I am writing to enquire about your African Literature and Culture course.Just a few days ago, I found the course when we were asked to choose optional courses for next semester. The name of African Literature and Culture aroused my great interest. Because of your reputation and my enthusiasm in literature, I hope I could study this course next semester. Except the name, however, all I know about the course is that it is atwo-hour one held every Thursday afternoon. I want to get more details of the course. First of all, I would like to know the brief outline of the course. Moreover, I wonder if there are some relevant books that you can recommend for me to read before the course.I also heard that another course of yours, Chinese Literature, is held every Friday afternoon. If the registration of this course hasn’t closed yet, I will be so glad to participate in your class.Sorry to bother you. Your help will be greatly appreciated.Yours sincerely,Sandy雅思小作文范文表题第13篇题目:The chart below shows the total number of minutes (in billions) of telephone calls in the UK, divided into three categories, from 1995-2023. Here's my suggested outline for a 4-paragraph report: Introduction: rewrite the question statement in your own words.Overview: point out which category was highest in each year, which was lowest, and which saw the biggest changes.Details: compare the 3 categories in 1995, then say what happened up until 1999.Details: notice what happened to local calls from 1999 onwards, and contrast this with the other 2 categories. Finish with a comparison of thefigures in 2023.雅思小作文范文表题第14篇The graph below shows the proportion of the population aged 65 and over between 1940 and 2040 in three different countries.雅思小作文范文:The line graph compares the percentage of people aged 65 or more in three countries over a period of 100 years.It is clear that the proportion of elderly people increases in each country between 1940 and 2040. Japan is expected to see the most dramatic changes in its elderly population.In 1940, around 9% of Americans were aged 65 or over, compared to about 7% of Swedish people and 5% of Japanese people. The proportions of elderly people in the USA and Sweden rose gradually over the next 50 years, reaching just under 15% in 1990. By contrast, the figures for Japan remained below 5% until the early 2000s.Looking into the future, a sudden increase in the percentage of elderly people is predicted for Japan, with a jump of over 15% in just 10 years from 2030 to 2040. By 2040, it is thought that around 27% of the Japanese population will be 65 years old or more, while the figures for Sweden and the USA will be slightly lower, at about 25% and 23% respectively.(178 words, band 9)。
雅思写作图表作文万能句型
雅思写作图表作文万能句型以下是特地为大家整理的雅思图表作文万能开头句子,希望对各位考生们有所帮助!1.the table shows the changes in the number of...over the period from...to...该表格描述了在...年之...年间...数量的变化。
2.the barchart illustrates that...该柱状图展示了...3.thegraph provides some interesting data regarding...该图为我们提供了有关...有趣数据。
4.thediagram shows (that)...该图向我们展示了...5.the piegraph depicts (that)....该圆形图揭示了...6.this isa cure graph which describes the trend of...这个曲线图描述了...的`趋势。
7.thefigures/statistics show (that)...数据(字)表明...8.thetree diagram reveals how...该树型图向我们揭示了如何...9.thedata/statistics show (that)...该数据(字)可以这样理解...10.thedata/statistics/figures lead us to the conclusion that...这些数据资料令我们得出结论...11.as isshown/demonstrated/exhibited in the diagram/graph/chart/table...如图所示...12.accordingto the chart/figures...根据这些表(数字)...13.as isshown in the table...如表格所示...14.as canbe seen from the diagram,great changes have taken place in...从图中可以看出,...发生了巨大变化。
- 1、下载文档前请自行甄别文档内容的完整性,平台不提供额外的编辑、内容补充、找答案等附加服务。
- 2、"仅部分预览"的文档,不可在线预览部分如存在完整性等问题,可反馈申请退款(可完整预览的文档不适用该条件!)。
- 3、如文档侵犯您的权益,请联系客服反馈,我们会尽快为您处理(人工客服工作时间:9:00-18:30)。
雅思写作—小作文图表题万能开头
很多同学在面对这小作文是图表题的时候感到很苦恼,这种题目的小作文究竟要怎么开头才能引起改卷老师的兴致,让老师眼前一亮呢?
别担心,小编都为你准备好了万能开头,要好好背下来哦。
高分开头第一句:
1 The gragh provided reveals....
2 Given is a line chart concerning a comparison of...
3 A glance at the figure provided reveals...
说完第一句可以紧接着概述一下图表的整体情况,如:
1 Clearly, both rates fluctuated dramatically during this period....
2 It is evident that both nations saw considerable fluctuations in rates...
下面我们再来比较一下5,6,7分学生的开头:
5分
The graph shows similarities between the birth rates of China and the USA from 1920 to 2000.
6分
The gragh provided reveals some surprising similarities between the Chinese and US birth rates during the period from 1920 to 2000. Clearly, both rates fluctuated dramatically during this period.
7分
A glance at the graph provided reveals some striking similarities between the Chinese and US birth rates during the perirod from 1920 to 2000. It is evident that both nations saw considerable fluctuations in fertility, with lows during the 1940s and highs during the 1950s.。