转录组学分析流程及常用软件介绍.pdf
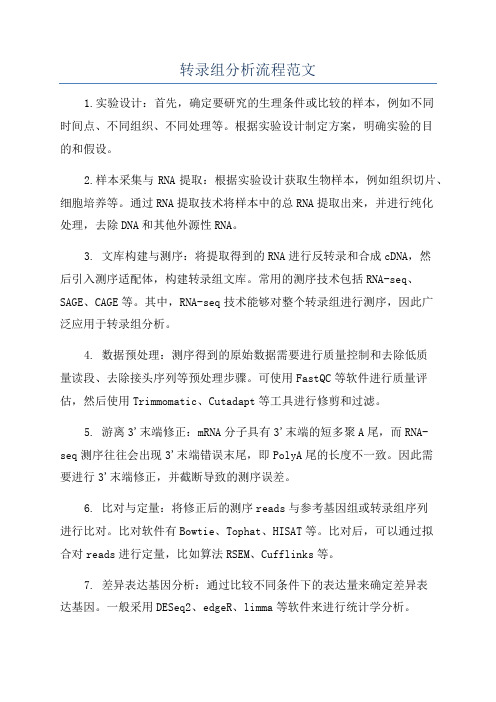
转录组分析流程范文

转录组分析流程范文转录组分析是一种用于研究特定生物体或组织中的全部转录本的方法。
它通过测量RNA分子在特定时间点和条件下的表达水平,揭示了基因转录的调控机制,功能注释和转录本的表达图谱,并为找到新的基因和功能注释提供了线索。
下面是一个常用的转录组分析流程,包含预处理、质控、序列比对、表达定量和差异分析等步骤。
1.数据预处理:数据预处理主要包括质量控制和去除低质量序列。
在高通量测序中,原始的测序数据通常包含低质量碱基、接头序列和多聚A/T等噪声。
质控工具如FastQC可以用于评估测序数据的质量,根据其结果,采用切割、修剪、过滤和去除低质量序列来提高数据质量。
2.序列比对:序列比对是将预处理后的测序数据与参考基因组进行比对的过程。
常用的比对工具包括Bowtie、BWA和STAR等。
这一步的目的是将测序数据映射到参考基因组上,以确定每个读取序列的起始位置。
3.表达定量:表达定量是将比对得到的序列转化为表达量的过程,它衡量了每个转录本的相对丰度。
常用的表达定量工具包括HTSeq、Cufflinks和Salmon 等。
这些工具通过计算每个转录本对应的读取数来估计其表达水平,并生成基因表达矩阵。
4.差异表达分析:差异表达分析是比较不同条件下的基因表达量,以确定哪些基因在不同条件下的表达水平发生了显著变化。
常用的差异表达分析工具包括DESeq2、edgeR和limma等。
这些工具通过统计学方法来鉴定不同条件之间的显著差异,并生成差异表达基因列表。
5.功能注释:功能注释是对差异表达基因进行生物学功能注释的过程。
常用的功能注释工具包括DAVID、GOseq和KEGG等。
这些工具通过富集分析、与已知数据库的比对和基因网络分析等方法,帮助研究人员了解差异表达基因的功能和参与的生物学过程。
6.结果可视化:结果可视化是将转录组分析结果以图形化的形式呈现,以帮助研究人员理解和解释数据。
常见的结果可视化工具包括Heatmap、Venn图、火山图和基因网络图等。
RNA-seq(转录组学)的分析流程和原理

RNA-seq(转录组学)的分析流程和原理在开始详细讲解RNA测序之前,我们先来了解一下它的基本步骤:1.建库:提取RNA,富集mRNA或消除rRNA,合成cDNA和构建测序文库。
2.测序:然后在高通量平台(通常是Illumina)上进行测序(每个样本测序reads在DNA测序中,读数是对应于单个DNA片段的全部或部分的碱基对(或碱基对概率)的推断序列。
深度为10-30 Million reads。
)3.分析:先比对/拼装测序片段到转录本,通过计数、定量,样本间过滤和标准化,以进行样本组间基因/转录本统计差异分析。
大致了解这个过程之后,我们就先从建库开始了解建库的难点在于提纯出mRNA, 一般在我们抽离出的RNA中rRNA占比很大,其他还会有tRNA、microRNA等。
我们需要从抽离出的RNA中提取出mRNA,并建立cDNA文库。
这里以应用最广泛的Illumina公司的Truseq RNA的建库方法为例来进行介绍。
首先,利用高等生物的mRNA通常有poly(A)尾的(使mRNA更稳定,翻译不容易出错)特点,用带有poly(T)探针的磁珠与总RNA进行杂交,这样磁珠就和带poly(A)尾巴的mRNA结合在一起了。
接下来,就回收磁珠,把这些带poly(A)的mRNA从磁珠上洗脱下来。
再用镁离子溶液(或者超声波)进行处理,把mRNA打成小段。
然后,利用这些被打断的mRNA片段,以随机引物进行逆转录,得到第一链cDNA。
再根据第一链cDNA合成出ds-cDNA。
对cDNA在平末端进行3’端加A碱基(腺苷酸)(adapter接头上带了T碱基头,为了和adapter配对)在双链cDNA的两端加分别上Y型接头再经PCR扩增经筛选的目的基因,就得到可以上机的测序文库了。
这个建库方法对RNA的完整度有较高的要求。
也就是说,只有在mRNA大部分是完整的状态下,才能得到比较好的效果。
因为带Poly(T)的磁珠,它所吸附的是带有Poly(A)的那些序列。
转录组测序数据分析及其应用

转录组测序数据分析及其应用基因组学研究一直是生命科学领域的重要分支,而随着高通量测序技术的发展,转录组学研究也变得越来越重要。
转录组测序是一种高通量的测序技术,可用于分析RNA的产生和使用。
它可以用于解析基因表达调控机制、鉴定新的转录产物、发现新的基因及其功能以及研究基因表达的变化。
而分析和处理转录组测序数据则是实现这些研究目标的关键步骤。
本文将介绍转录组测序数据分析的流程以及其在生命科学研究中的应用。
1. 转录组测序数据分析的流程转录组测序数据分析的流程包括测序数据质量控制、选用合适的参考基因组进行比对、基因表达量计算、差异表达基因筛选、功能注释及通路分析等步骤。
(1)数据质量控制在数据分析之前,需要对原始测序数据进行质量控制。
质量控制通常包括检查样品的测序深度和比对率,检测是否存在序列重复和序列污染,并通过统计和图形化分析来评估测序数据的准确性和一致性。
一些常用的工具如FastQC和Trimmomatic可以用于数据质量控制。
(2)比对与注释转录组测序数据的比对和注释是数据分析过程中的关键步骤,它可以帮助我们理解基因组中那些区域正在表达这些转录物,并且可以使下游分析过程更加准确和可靠。
常用的比对软件有TopHat和STAR等,同时,基于火山图和MA-plot等绘图技术,对比对结果进行筛选与统计分析,即可确定差异表达的基因。
(3)差异表达基因筛选通过比对和注释分析后,我们可以通过基因表达量的计算来确定哪些基因在不同的实验条件下差异表达。
常用的对基因表达量计算的方法有FPKM和TPM等,同时也适用于多样品比较的统计方法如edgeR和DESeq2等,以筛选差异表达的基因。
(4)功能注释及通路分析结合差异表达基因的结果进行进一步的功能注释和通路分析,通过各种生物信息学工具对其进行KEGG、GO、Cytoscape等分析,以便确定关键的基因、分子和通路在生物学过程中的作用。
2. 转录组测序数据的应用转录组测序数据被广泛应用于生命科学领域中的多种研究,如基因组结构与表达、药物研发、癌症研究、农业作物育种、蛋白质组学、环境科学等等。
转录组分析报告

转录组分析报告介绍转录组分析是研究基因组中转录过程的研究领域。
通过转录组分析,我们可以了解到在特定条件下细胞中正在转录的所有基因。
这些信息对于理解细胞功能、疾病发展以及生物技术的开发都非常重要。
本报告将介绍转录组分析的一般步骤和常用方法。
步骤一:实验设计转录组分析的第一步是设计实验。
在这个步骤中,我们需要确定要研究的样本类型、实验条件和重复次数。
合理的实验设计可以最大程度地减少误差,并提高结果的可靠性。
步骤二:RNA提取在转录组分析中,我们需要从样本中提取RNA。
RNA是细胞中转录的产物,它可以反映细胞中正在表达的基因信息。
RNA提取的质量和纯度对后续的转录组分析非常重要。
常用的提取方法包括酚氯仿法、磁珠法和硅胶膜法等。
步骤三:RNA测序RNA测序是转录组分析的核心步骤之一。
通过RNA测序,我们可以将RNA样本转化为对应的DNA序列,并确定每个基因的表达水平。
常见的RNA测序技术包括Sanger测序、二代测序和三代测序等。
二代测序技术如Illumina和Ion Torrent等已经成为转录组分析的主流技术。
步骤四:数据预处理RNA测序会产生大量的原始数据,这些数据需要进行预处理以去除噪音和提高数据质量。
数据预处理包括去除低质量的reads、去除接头序列、去除重复序列和过滤低表达基因等。
预处理后的数据可以为后续的分析提供可靠的基础。
步骤五:差异表达基因分析差异表达基因分析是转录组分析的重要环节之一。
通过比较不同条件下基因的表达水平,我们可以找到与特定条件相关的差异表达基因。
常用的差异表达基因分析方法包括DESeq、edgeR和limma等。
这些方法可以帮助我们发现与特定条件相关的生物学过程和信号通路。
步骤六:功能注释和富集分析一旦确定了差异表达基因,我们可以对这些基因进行功能注释和富集分析。
功能注释可以帮助我们了解差异表达基因的功能和参与的生物学过程。
而富集分析可以帮助我们发现差异表达基因在特定功能和通路中的富集情况。
转录组学分析流程及常用软件介绍

转录组学分析流程及常用软件介绍转录组学是研究在特定条件下生物体内转录的所有RNA分子的总体,包括信使RNA(mRNA)、转运RNA(tRNA)、核糖体RNA(rRNA)和小核RNA(snRNA)等。
转录组学研究可以通过分析转录组中的基因表达水平和调控机制,揭示基因功能和调控网络,从而深入了解生物体的生命活动和适应能力。
转录组学分析流程包括实验设计、RNA提取、RNA测序、数据分析和结果解释等环节,并依赖于一系列的软件工具来完成。
下面将介绍转录组学分析的流程以及常用的软件。
1.实验设计:确定研究目的和假设,设计实验方案,包括样本的选择和处理方式等。
2.RNA提取:从样本中提取总RNA,并进行纯化和富集,去除DNA和其他杂质。
3. RNA测序:将提取得到的RNA反转录成cDNA,然后通过高通量测序技术进行测序。
常用的测序技术包括Illumina HiSeq、Ion Torrent Proton等。
4.数据分析:对测序得到的数据进行质控、比对和定量等处理。
这一步通常需要使用一系列的转录组学分析软件。
5.结果解释:根据数据分析的结果,进行差异表达基因的筛选、基因富集分析和信号通路分析,以探索转录组的生物学意义。
常用的转录组学分析软件包括:1. 基因表达微阵列分析:在早期的转录组学研究中,基因表达微阵列是常用的分析方法。
常用的分析软件有Affymetrix Expression Console、Partek Genomics Suite等。
2. RNA测序数据分析:随着高通量测序技术的发展,RNA测序已成为转录组学研究的主要方法。
RNA测序数据的分析可以分为质控、比对和定量等环节。
常用的软件工具有Trimmomatic、FastQC、STAR、HISAT等。
3. 差异表达基因分析:差异表达基因是通过比较不同样本之间的基因表达水平而筛选出来的。
常用的软件包括DESeq2、edgeR、limma等。
4. 基因富集分析:基因富集分析可以帮助我们了解不同基因集之间的功能和通路差异,从而揭示转录组的生物学意义。
转录组测序数据分析流程
#流程大放送#转录组测序数据处理和分析
介绍
转录组测序的研究对象为特定细胞在某一功能状态下所能转录出来的所有RNA的总和,包括mRNA和非编码RNA。
相对于传统的芯片杂交平台,转录组测序无需预先针对已知序列设计探针,即可对任意物种的整体转录活动进行检测,提供更精确的数字化信号,更高的检测通量以及更广泛的检测范围,是目前深入研究转录组复杂性的强大工具。
基于高通量测序平台的转录组测序技术能够全面获得物种特定组织或器官的转录本信息,从而进行基因表达水平研究、新转录本发现研究、转录本结构变异研究等。
该技术可用于以下研究
1.观察疾病发生过程中病灶部位内部的基因表达水平变化
2.在肿瘤研究中,使用RNA-seq技术可以预测潜在的融合基因
3.新lncRNA预测和已知lncRNA表达水平研究
4.新物种的转录组数据构建和功能研究
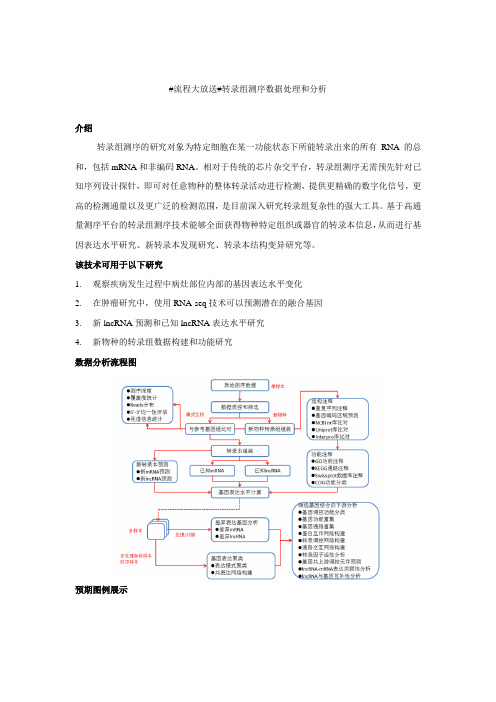
数据分析流程图
预期图例展示
示例图1 差异表达基因筛选示例2 基因聚类分析heatmap图
示例3 差异基因互作网络图示例4 lncRNA、基因与上游共有miRNA网络图。
转录组学分析流程及常用软件介绍

--bowtie-path #bowtie2路径
RSEM用法
• 3.[rsem-calculate-expression]
rsem-calculate-expression [options] upstream_read_file(s) reference_name sample_name rsem-calculate-expression [options] --paired-end upstream_read_file(s) downstream_read_file(s) reference_name sample_name
比对——Tophat2 Tophat2
特点如下: -不依赖于splice sites信息 可只使用参考基因组进行比对; 可以处理spliced reads; -可以利用注释信息进行比对 -序列比对;Bowtie2,也可以使用Bowite -处理错误比对,eg:假基因 -处理Indels
比对——Tophat2
--phred33-quals 、--phred64-quals、 --paired-end
RSEM用法
• extract-transcript-to-gene-map-from-trinity trinity_out_dir.Trinity.fasta isoform2gene • rsem-prepare-reference --bowtie2 --bowtie2-path /PUBLIC/software/RNA/bowtie2-2.2.3 --transcript-to-gene-map isoform2gene --no-polyA trinity_out_dir.Trinity.fasta Trinity.fasta • rsem-calculate-expression --bowtie2 --bowtie2-path /PUBLIC/software/RNA/bowtie2-2.2.3/ --phred33-quals -p 8 --forwardprob 0.0 --time --paired-end reads.left.fq reads.right.fq Trinity.fasta Sample
转录组分析流程范文
转录组分析流程范文1.实验设计:首先,确定要研究的生理条件或比较的样本,例如不同时间点、不同组织、不同处理等。
根据实验设计制定方案,明确实验的目的和假设。
2.样本采集与RNA提取:根据实验设计获取生物样本,例如组织切片、细胞培养等。
通过RNA提取技术将样本中的总RNA提取出来,并进行纯化处理,去除DNA和其他外源性RNA。
3. 文库构建与测序:将提取得到的RNA进行反转录和合成cDNA,然后引入测序适配体,构建转录组文库。
常用的测序技术包括RNA-seq、SAGE、CAGE等。
其中,RNA-seq技术能够对整个转录组进行测序,因此广泛应用于转录组分析。
4. 数据预处理:测序得到的原始数据需要进行质量控制和去除低质量读段、去除接头序列等预处理步骤。
可使用FastQC等软件进行质量评估,然后使用Trimmomatic、Cutadapt等工具进行修剪和过滤。
5. 游离3'末端修正:mRNA分子具有3'末端的短多聚A尾,而RNA-seq测序往往会出现3'末端错误末尾,即PolyA尾的长度不一致。
因此需要进行3'末端修正,并截断导致的测序误差。
6. 比对与定量:将修正后的测序reads与参考基因组或转录组序列进行比对。
比对软件有Bowtie、Tophat、HISAT等。
比对后,可以通过拟合对reads进行定量,比如算法RSEM、Cufflinks等。
7. 差异表达基因分析:通过比较不同条件下的表达量来确定差异表达基因。
一般采用DESeq2、edgeR、limma等软件来进行统计学分析。
8.功能注释与富集分析:对差异表达基因进行生物学功能注释,如基因本体论(GO)、通路富集分析(KEGG)等,找出富集的GO和KEGG通路,以及参与其功能的关键基因。
9.可变剪切分析:转录组测序可以对基因的可变剪切进行研究,通过比对和拼接转录本,找出不同剪切形式的外显子、内含子和连接顺序变化等信息。
生物信息学中的转录组数据分析方法与工具研究
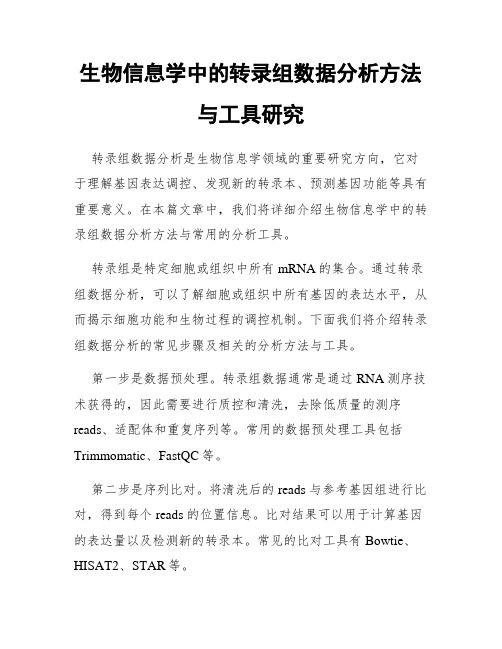
生物信息学中的转录组数据分析方法与工具研究转录组数据分析是生物信息学领域的重要研究方向,它对于理解基因表达调控、发现新的转录本、预测基因功能等具有重要意义。
在本篇文章中,我们将详细介绍生物信息学中的转录组数据分析方法与常用的分析工具。
转录组是特定细胞或组织中所有mRNA的集合。
通过转录组数据分析,可以了解细胞或组织中所有基因的表达水平,从而揭示细胞功能和生物过程的调控机制。
下面我们将介绍转录组数据分析的常见步骤及相关的分析方法与工具。
第一步是数据预处理。
转录组数据通常是通过RNA测序技术获得的,因此需要进行质控和清洗,去除低质量的测序reads、适配体和重复序列等。
常用的数据预处理工具包括Trimmomatic、FastQC等。
第二步是序列比对。
将清洗后的 reads 与参考基因组进行比对,得到每个 reads 的位置信息。
比对结果可以用于计算基因的表达量以及检测新的转录本。
常见的比对工具有Bowtie、HISAT2、STAR等。
第三步是基因表达量的计算。
通过将测序 reads 映射到参考基因组的基因区域,可以计算出每个基因的表达量。
常用的工具有HTSeq、FeatureCounts等。
第四步是差异表达分析。
差异表达分析可以用来寻找在不同条件下表达水平发生显著变化的基因。
常用的差异表达分析工具有DESeq2、edgeR等。
第五步是功能注释和富集分析。
对差异表达基因进行功能注释和富集分析可以帮助我们理解这些基因在生物过程中的功能和调控机制。
常用的工具有DAVID、GSEA等。
除了上述基本步骤外,还有一些高级的转录组数据分析方法和工具,可以进一步挖掘和解析转录组数据的信息。
例如,可以通过融合多种类型的数据,如基因表达、蛋白质互作和代谢通路等,来构建转录组的整体网络。
常用的工具有Cytoscape。
此外,还有一些专门用于分析非编码RNA的工具,例如miRNA和lncRNA。
对于miRNA数据的分析,常用的工具有miRDeep2、miRanda等。
转录组测序数据分析小软件介绍

输入邮箱地址,计算完成 后会将结果发送到邮箱。
给文件命名
17
DAVID分析流程
1 登录网站:
点击开始 数据分析
19
2 导入数据
点击此处选择输入数据特征, 例: •输入的是Agilent探针号如 A_19_P3420011等 ,则此处选 择AGILENT_ID; •输入的是GeneBank登录号如 NM_015355等,此处选择 REFSEQ_MRNA; •输入的是基因缩写如ME3等, 此处选择 OFFICAL_GENE_SYMBOL
• DIANA-microT: http://www.microrna.gr/microT
DIANA-microT是KiriakidouM等基于实验和计算生物学方法开发的miRNA靶基因预测软件。 和miRanda预测结果中可能出 现一个miRNA对应多个靶位点或多个miRNA对应一个靶位点 而丢掉了miRNA调控单个靶位点不同的是,DIANA-microT考虑了miRNA调 控单个靶位点的 情况。DIANA-microT预测算法基于以下两点来判别miRNA靶基因:①miRNA和靶基因间的 高亲和力,主要通过结合能来衡量。 ②影响miRNA和靶基因所形成二聚体茎环结构环部位 置和环大小的miRNA相关蛋白可能指导miRNA和靶基因的相互作用。
数据分析小软件介绍
欧易生物
芯片分析流程
原始数据标准化 差异筛选和统计分析
Genespring(商业化)
Excel
功 能 分 析
FunNet DAVID
聚 类 分 析
MEV cluster
靶基 因预 测
Targetscan miRecords
网 络 图
Cytoscape
维 恩 分 析
使用生物大数据技术进行转录组学分析的步骤和技巧

使用生物大数据技术进行转录组学分析的步骤和技巧转录组学分析是生物学研究中的重要分支,它通过研究转录组(即一种特定生物体的所有转录RNA分子)的组成和调控方式,揭示了基因表达的动态变化和调控网络。
而使用生物大数据技术进行转录组学分析,能够更加全面地了解基因表达的复杂性和细节,为生物学研究提供了有力的工具。
本文将介绍使用生物大数据技术进行转录组学分析的步骤和技巧。
第一步:数据获取在进行转录组学分析之前,首先需要获取转录组数据。
目前,公共数据库如NCBI GEO、EBI ArrayExpress等提供了大量的转录组数据。
这些数据涵盖了多种生物体(如人类、小鼠、果蝇等),不同组织和病理状态(如正常组织、癌症组织等)。
研究者可以根据自己的研究需求选择合适的数据集进行分析。
第二步:数据预处理获得转录组数据后,需要对数据进行预处理。
这包括质量控制、去除低质量读数、去除接头序列、去除内源性RNA、合并重复样本等。
为了保证数据的质量和准确性,可以使用一些常用的工具进行处理,如FastQC、Trimmomatic、Cutadapt 等。
预处理后的数据将用于后续的转录组分析。
第三步:基因表达定量基因表达定量是转录组学分析的核心环节,它可以确定不同基因在不同组织或条件下的表达水平。
常用的基因表达定量方法有FPKM、TPM、Counts等。
在这一步骤中,需要利用一些转录组定量工具,如Kallisto、Salmon等,对预处理后的数据进行定量计算。
得到基因表达定量矩阵后,可以进行后续的差异表达分析和功能注释。
第四步:差异表达分析差异表达分析是转录组学研究中常用的方法,它可以发现在不同组织或条件下表达水平显著变化的基因。
在进行差异表达分析之前,需要对基因表达定量矩阵进行标准化。
常用的标准化方法有TMM、DESeq、edgeR等。
之后,可以使用一些差异表达分析工具,如DESeq2、edgeR等,计算差异表达基因,并进行统计分析和可视化。
生物信息学中转录组学数据分析的方法与工具
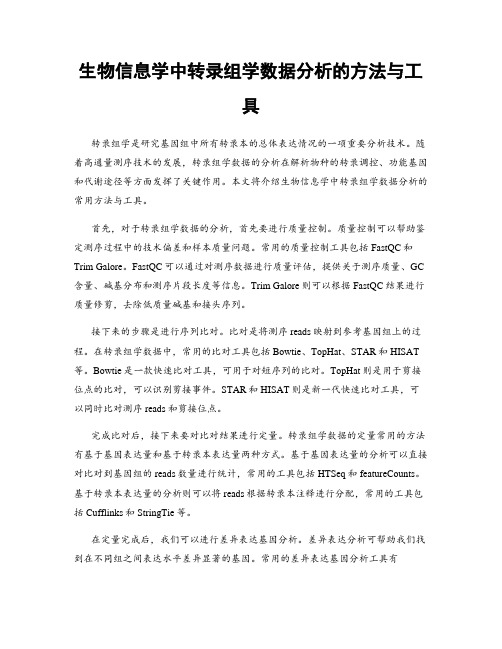
生物信息学中转录组学数据分析的方法与工具转录组学是研究基因组中所有转录本的总体表达情况的一项重要分析技术。
随着高通量测序技术的发展,转录组学数据的分析在解析物种的转录调控、功能基因和代谢途径等方面发挥了关键作用。
本文将介绍生物信息学中转录组学数据分析的常用方法与工具。
首先,对于转录组学数据的分析,首先要进行质量控制。
质量控制可以帮助鉴定测序过程中的技术偏差和样本质量问题。
常用的质量控制工具包括FastQC和Trim Galore。
FastQC可以通过对测序数据进行质量评估,提供关于测序质量、GC 含量、碱基分布和测序片段长度等信息。
Trim Galore则可以根据FastQC结果进行质量修剪,去除低质量碱基和接头序列。
接下来的步骤是进行序列比对。
比对是将测序reads映射到参考基因组上的过程。
在转录组学数据中,常用的比对工具包括Bowtie、TopHat、STAR和HISAT 等。
Bowtie是一款快速比对工具,可用于对短序列的比对。
TopHat则是用于剪接位点的比对,可以识别剪接事件。
STAR和HISAT则是新一代快速比对工具,可以同时比对测序reads和剪接位点。
完成比对后,接下来要对比对结果进行定量。
转录组学数据的定量常用的方法有基于基因表达量和基于转录本表达量两种方式。
基于基因表达量的分析可以直接对比对到基因组的reads数量进行统计,常用的工具包括HTSeq和featureCounts。
基于转录本表达量的分析则可以将reads根据转录本注释进行分配,常用的工具包括Cufflinks和StringTie等。
在定量完成后,我们可以进行差异表达基因分析。
差异表达分析可帮助我们找到在不同组之间表达水平差异显著的基因。
常用的差异表达基因分析工具有DESeq2、edgeR和limma-voom等。
这些工具可以从统计学的角度评估差异表达的可靠性,并提供一系列的统计分析方法和可视化工具。
此外,转录组数据的富集分析也是转录组学数据分析的重要部分。
转录组学分析流程及常用软件介绍

1. 图形化简
2.解图,确定转录本序列
Butterfly
•
2016-1-11
Butterfly
2016-1-11
Trinity
• --jaccard_clip
Trinity参数
– for gene-dense compact genome, such as fungal genomes, where transcripts may often overlap in UTR regions.
--min_kmer_cov 2 \ --min_glue 2 \ --full_cleanup \#删除中间文件
Trinity示例
• 输出结果
– Trinity.fasta文件 – unigene.fasta文件
从trinity.fasta中选择最长的转录本作为unigene,Trinity作者推荐
– Unpaired (single) reads: • F: the single read is in the sense (forward) orientation • R: the single read is in the antisense (reverse) orientation
Trinity拼接结果解读
• >c1_g1_i1 len=233 path=[94:0-232]
c1: sequence is derived from Chrysalis component 1 g1: sequence also corresponds to Butterfly subcomponent# 1 (during graph compaction and pruning, some components are partitioned into disconnected subcomponents). i1: sequence count from chrysalis component 1, butterfly subcomponent 1. If this subcomponent yields multiple sequences, these will have different seq numbers.
转录组分析常用软件汇总--精华版
转录组分析常用软件汇总--精华版一、比对工具(Kim et al., 2015)HISAT: a fast spliced aligner with low memory requirements. Nature methods.Aligns RNA-seq reads to a reference genome using uncompressed suffix arrays. STAR has a potential for accurately aligning long (several kilobases) reads that are emerging from the third-generation sequencing technologies.(Dobin et al., 2013) STAR: ultrafast universal RNA-seq aligner. Bioinformatics.Self-training Algorithm for Splice Junction Detection using RNA-seq.(Li et al., 2013) TrueSight: a new algorithm for splice junction detection using RNA-seq. Nucleic acids research.A toolkit for processing next-gen sequencing data. These programs were also implemented in Bioconductor R package Rsubread.(Liao et al., 2013)The Subread aligner: fast, accurate and scalable read mapping by seed-and-vote. Nucleic acids research.(Rogers et al., 2012)SpliceGrapher: detecting patterns of alternative splicing from RNA-Seq data in the context of gene models and EST data. Genome biology.(Philippe et al., 2013) CRAC: an integrated approach to the analysis of RNA-seq reads. Genome biology.A fast splice junction mapper for RNA-Seq reads. TopHat aligns RNA-Seq reads to mammalian-sized genomes using the high-throughput short read aligner Bowtie, and then analyzes the mapping results to identify splice junctions between exons.(Kim et al., 2013) TopHat2: accurate alignment of transcriptomes in the presence of insertions, deletions and gene fusions. Genome Biol.(Chu et al., 2015)SpliceJumper: a classification-based approach for calling splicing junctions from RNA-seq data. BMC bioinformatics.(Srivastava et al., 2016)RapMap: a rapid, sensitive and accurate tool for mapping RNA-seq reads to transcriptomes. Bioinformatics.A framework for genome-based transcript reconstruction and quantification. CIDANE is engineered to not only assembly RNA-seq reads ab initio, but to also make use of the growing annotation of known splice sites, transcription start and end sites, or even full-length transcripts, available for most model organisms. T o some extent, CIDANE is able to recover splice junctions that are invisible to existing bioinformatics tools.(Canzar et al., 2016)CIDANE: comprehensive isoform discovery and abundance estimation. Genome biology.An open source tool for accurate genome-guided transcriptome assembly from RNA-seq reads based on the model of splice graph. An extension of our program CLASS, CLASS2 jointly optimizes read patterns and the number of supporting reads to score and prioritize transcripts, implemented in a novel, scalable and efficient dynamic programming algorithm.(Song et al., 2016) CLASS2: accurate and efficient splice variant annotation from RNA-seq reads. Nucleic acids research.二、Read数统计An RNA-seq read counting tool which builds upon the speed of featureCounts and implements the counting modes of HTSeq. VERSE is more than 30x faster than HTSeq when computing thesame gene counts. VERSE also supports a hierarchical assignment scheme, which allows reads to be assigned uniquely and sequentially to different types of features according to user-defined priorities. It is built on top of featureCounts.(Zhu et al., 2016) VERSE: a versatile and efficient RNA-Seq read counting tool. bioRxiv.A tool for RNA-Seq data analysis that counts for each gene how many aligned reads overlap its exons.(Anders et al., 2013) Count-based differential expression analysis of RNA sequencing data using R and Bioconductor. Nature protocols.A package that provides efficient low-level and highly reusable S4 classes for storing ranges of integers, RLE vectors (Run-Length Encoding) and, more generally, data that can be organized sequentially (formally defined as Vector objects), as well as views on these Vector objects. IRanges provides also efficient list-like classes for storing big collections of instances of the basic classes. All classes in the package use consistent naming and share the same rich and consistent 'Vector API' as much as possible.(Lawrence et al., 2013) Software for computing and annotating genomic ranges. PLoS computational biology.A read summarization program, which counts mapped reads for the genomic features such as genes and exons.(Liao et., 2013) featureCounts: an efficient general-purpose program for assigning sequence reads to genomic features. Bioinformatics三、定量A fast and highly efficient assembler of RNA-Seq alignments into potential transcripts. It is primarily a genome-guidedtranscriptome assembler, although it can borrow algorithmic techniques from de novo genome assembly to help with transcript assembly. Its input can include not only the spliced read alignments used by reference-based assemblers, but also longer contigs that were assembled de novo from unambiguous, non-branching parts of a transcript.(Pertea et al., 2015) StringTie enables improved reconstruction of a transcriptome from RNA-seq reads. Nature biotechnology.A computational approach that measures changes in mature RNA and pre-mRNA reads across different experimental conditions to quantify transcriptional and post-transcriptional regulation of gene expression. EISA reveals both transcriptional and post-transcriptional contributions to expression changes, increasing the amount of information that can be gained from RNA-seq data sets.(Gaidatzis et al., 2015) Analysis of intronic and exonic reads in RNA-seq data characterizes transcriptional and post-transcriptional regulation. Nature biotechnology.Assembles transcripts, estimates their abundances, and tests for differential expression and regulation in RNA-Seq samples.(Trapnell et al., 2010)Transcript assembly and quantification by RNA-Seq reveals unannotated transcripts and isoform switching during cell differentiation. Nature biotechnology.A method for transcriptome reconstruction that relies solely on RNA-Seq reads and an assembled genome to build a transcriptome ab initio. The statistical methods to estimate read coverage significance are also applicable to other sequencing data. Scripture also has modules for ChIP-Seq peak calling.(Guttman et al., 2010) Ab initio reconstruction of cell type-specific transcriptomes in mouse reveals the conserved multi-exonic structure of lincRNAs. Nature biotechnologyAccurate quantification of transcriptome from RNA-Seq data by effective length normalization.(Lee et al., 2011) Accurate quantification of transcriptome from RNA-Seq data by effective length normalization. Nucleic acids research.An integrated alignment workflow and a simple counting-based approach to derive estimates for gene, exon and exon-exon junction expression. In contrast to previous counting-based approaches, EQP takes into account only reads whose alignment pattern agrees with the splicing pattern of the features of interest. This leads to improved gene expression estimates as well as to the generation of exon counts that allow disambiguating reads between overlapping exons.(Schuierer and Roma, 2016) The exon quantification pipeline (EQP): a comprehensive approach to the quantification of gene, exon and junction expression from RNA-seq data. Nucleic acids research.It was designed as a user friendly solution to extract and annotate biologically important transcripts from next generation RNA sequencing data.(Forster et al., 2013) RNA-eXpress annotates novel transcript features in RNA-seq data. Bioinformatics.A versatile model to account for sequence specific bias that commonly occurs at the ends of fragments. Isolotar analyzes RNA-Seq experiments using a simple Bayesian hierarchical model. Combined with aggressive bias correction, it produces estimates that are simultaneously accurate and show highagreement between samples. Isolator is uniquely able to compute posterior probabilities corresponding to arbitrarily complex questions, within the confines of the model.(Jones et al., 2016) Isolator: accurate and stable analysis of isoform-level expression in RNA-Seq experiments. bioRxiv.四、标准化与差异表达A method for differential analysis of count data, using shrinkage estimation for dispersions and fold changes to improve stability and interpretability of estimates. This enables a more quantitative analysis focused on the strength rather than the mere presence of differential expression.(Love et al., 2014) Moderated estimation of fold change and dispersion for RNA-seq data with DESeq2. Genome biologyA software package designed to facilitate flexible differential expression analysis of RNA-Seq data. Ballgown can also be used to visualize the transcript assembly on a gene-by-gene basis, extract abundance estimates for exons, introns, transcripts or genes, and perform linear model–based differential expression analyses.(Frazee et al., 2015) Ballgown bridges the gap between transcriptome assembly and expression analysis. Nature biotechnology.A package to dampen the effect of outliers on count-based differential expression analyses.edgeR uses empirical Bayes estimation and exact tests based on the negative binomial distribution and is useful for differential signal analysis with other types of genome-scale count data. It requires a delicate tradeoff to maintain high power while at the same time achieving a decent resistance to the presence of outliers. In particular, it is difficult to know exactly what an outlier is and where the lineshould be drawn to identify it as such.(Zhou et al., 2014) Robustly detecting differential expression in RNA sequencing data using observation weights. Nucleic acids researchA differential transcript expression (DTE) analysis algorithm. SDEAP estimates the number of conditions directly from the input samples using a Dirichlet mixture model and discovers alternative splicing events using a new graph modular decomposition algorithm. By taking advantage of the above technical improvement, SDEAP was able to outperform the other DTE analysis methods in extensive experiments on simulated data and real data with qPCR validation. The prediction of SDEAP also allows users to classify the samples of cancer subtypes and cell-cycle phases more accurately.(Yang and Jiang, 2016) SDEAP: a splice graph based differential transcript expression analysis tool for population data. BioinformaticsEnables rapid interpretation of complex gene expression studies as well as other high-throughput genomics assays. variancePartition is a statistical and visualization framework, used to prioritize drivers of variation based on a genome-wide summary, and identify genes that deviate from the genome-wide trend. This tool quantifies variation in each expression trait attributable to differences in disease status, sex, cell or tissue type, ancestry, genetic background, experimental stimulus, or technical variables.(Hoffman and Schadt, 2016) variancePartition: interpreting drivers of variation in complex gene expression studies. BMC BIoinformatics.A realistic framework to assess the impact of the keycomponents of the statistical framework for differential analyses of RNA-seq data. This tool is based on real data sets and allows the exploration of various scenarios differing in the proportion of non-differentially expressed genes. Hence, it provides an evaluation of the key ingredients of the differential analysis, free of the biases associated with the simulation of data using parametric models.(Rigaill et al., 2016) Synthetic data sets for the identification of key ingredients for RNA-seq differential analysis. Briefings in Bioinformatics.Detects differentially expressed (DE) genes for RNA-seq data with high level of hetergeniety such as cancer RNA-seq data. ELTSeq is an empirical likelihood ratio test (ELT) with a mean-variance relationship constraint for the differential expression analysis of RNA sequencing (RNA-seq). As a distribution-free nonparametric model, ELTSeq handles individual heterogeneity by estimating an empirical probability for each observation without making any assumption about read-count distribution. It also incorporates a constraint for the read-count overdispersion, which is widely observed in RNA-seq data. ELTSeq demonstrates a significant improvement over existing methods such as edgeR, DESeq, t-tests, Wilcoxon tests and the classic empirical likelihood-ratio test when handling heterogeneous groups. It will significantly advance the transcriptomics studies of cancers and other complex disease(Xu and Chen, 2016) An empirical likelihood ratio test robust to individual heterogeneity for differential expression analysis of RNA-seq. Briefings in Bioinformatics.A package for detecting the differentially expressed (DE) genes in time course RNA-Seq data. The negative binomialmixed-effect model (NBMM) method is applied to gene expression data on a gene-by-gene basis. A parallel computing option is implemented in timeSeq package to speed up the computing process. We showed that our approach outperforms other currently available methods in both synthetic and real data.(Sun et al., 2016) Statistical inference for time course RNA-Seq data using a negative binomial mixed-effect model. BMC Bioinformatics.A method for facilitating DE analysis using RNA-seq read count data with multiple treatment conditions. The read count is assumed to follow a log-linear model incorporating two factors (i.e., condition and gene), where an interaction term is used to quantify the association between gene and condition. The number of the degrees of freedom is reduced to one through the first order decomposition of the interaction, leading to a dramatically power improvement in testing DE genes when the number of conditions is greater than two.(Kang et al., 2016) multiDE: a dimension reduced model based statistical method for differential expression analysis using RNA-sequencing data with multiple treatment conditions. BMC bioinformatics.(Jia et al., 2015) MetaDiff: differential isoform expression analysis using random-effects meta-regression. BMC bioinformatics.Provides a data-driven solution to test the assumptions of global normalization methods. Group level information about each sample (such as tumor/normal status) must be provided because the test assesses if there are global differences in the distributions between the user-defined groups.(Hicks and Irizarry, 2015) quantro: a data-driven approach toguide the choice of an appropriate normalization method. Genome biology.A Bayesian hierarchical approach to investigate within-sample and between-sample variations in RNA-Seq data.(Gu et al., 2014) BADGE: A novel Bayesian model for accurate abundance quantification and differential analysis of RNA-Seq data. BMC bioinformatics.An algorithm that estimates expression at transcript-level resolution and controls for variability evident across replicate libraries.(Trapnell et al., 2013) Differential analysis of gene regulation at transcript resolution with RNA-seq. Nature biotechnology.(Li et al., 2012) Normalization, testing, and false discovery rate estimation for RNA-sequencing data. Biostatistics.A package to identify differentially expressed genes or isoforms for RNA-seq data from different samples. DEGseq also encourage users to export gene expression values in a table format which could be directly processed by edgeR (Robinson, 2009), an R package implementing the method based on negative binominal distribution to model overdispersion relative to Poisson for digital gene expression data with small replicates (Robinson and Smyth, 2007)(Wang et al., 2010)DEGseq: an R package for identifying differentially expressed genes from RNA-seq data. Bioinformatics.五、基因融合An enhanced version with the ability to align reads across fusion points, which results from the breakage and re-joining oftwo different chromosomes, or from rearrangements within a chromosome.(Kim and Salzberg, 2011) TopHat-Fusion: an algorithm for discovery of novel fusion transcripts. Genome biology.A python package to annotate and visualize gene fusions. For a given gene fusion, AGFusion will predict the cDNA, CDS, and protein sequences resulting from fusion of all combinations of transcripts and save them to fasta files. AGFusion can also plot the protein domain architecture of the fusion transcripts.(Murphy and Elemento, 2016)AGFusion: annotate and visualize gene fusions. bioRxiv.A toolkit for fusion gene and chimeric transcript detection from RNA-seq data. InFusion is a computational method for the discovery of chimeric transcripts from RNA-seq data capable of detecting alternatively spliced chimeric transcripts and fusion genes involving non-coding regions. InFusion allows detection of fusions that involve intergenic regions, analyses and filters putative fusion events based on coverage depth, genomic context and strand specificity.(Okonechnikov et al., 2016) InFusion: Advancing Discovery of Fusion Genes and Chimeric Transcripts from Deep RNA-Sequencing Data. PLoS One.六、可变剪接(Reuter et al., 2016) PreTIS: A T ool to Predict Non-canonical 5’ UTR Translational Initiation Sites in Human and Mouse. Plos Computational Biology.(Afsari et al., 2016)Splice Expression Variation Analysis (SEVA) for Differential Gene Isoform Usage in Cancer. bioRxiv.The DEXseq method is implemented as an open Bioconductor package, which facilitates data visualization andexploration. It can detect with high sensitivity genes, and in many cases exons, that are subject to differential exon usage.(Anders et al., 2012) Detecting differential usage of exons from RNA-seq data. Genome research.(Liu et al., 2012) Detection, annotation and visualization of alternative splicing from RNA-Seq data with SplicingViewer. Genomics.(Ryan et al., 2012) SpliceSeq: a resource for analysis and visualization of RNA-Seq data on alternative splicing and its functional impacts. Bioinformatics.Alternative Splicing transcriptional landscape visualization tool.(Foissac and Sammeth, 2007)ASTALAVISTA: dynamic and flexible analysis of alternative splicing events in custom gene datasets. Nucleic acids research.六、等位基因(Deonovic et al., 2016)IDP-ASE: haplotyping and quantifying allele-specific expression at the gene and gene isoform level by hybrid sequencing. Nucleic Acids Research.(Soderlund et al., 2014) Allele workbench: transcriptome pipeline and interactive graphics for allele-specific expression. PloS one(Romanel et al., 2015) ASEQ: fast allele-specific studies from next-generation sequencing data. BMC medical genomics.(Nariai et al., 2015) A Bayesian approach for estimating allele-specific expression from RNA-Seq data with diploid genomes. BMC genomics.。
一步一步教你做转录组分析(HISAT--StringTie-and-Ballgown)
#安装需要的R包>source('')>biocLite('ballgown')>source('')>biocLite('genefilter')>source('')>biocLite('devtools')>source('')>biocLite('RSkittleBrewer')>install.packages('dplyr')
一、数据下载Linux系统下常用的下载工具是wget,但该工具是单线程下载,当使用它下载较大数据时比较慢,所以选择axel,终端中输入安装命令:$sudo yum install axel然后提示输入密码获得root权限后即可自动安装,安装完成后,输入命令axel,终端会显示如下内容,表示安装成功。
#加载要用到的语言包> library(RSkittleBrewer)>library(ballgown)>library(genefilter)>library(dplyr)>library(devtools)#设置R语言的工作路径>setwd('F:/data/R')#读取表型数据如下图所示:
>read.csv('geuvadis_phenodata.csv')>pheno_data#dataDir告知数据路径,samplePattern则依据样本的名字来,pheno_data则指明了样本数据的关系,这个里面第一列样本名需要和ballgown下面的文件夹的样本名一样,不然会报错>bg_chrX= ballgown(dataDir = “F:/data/R/ballgown',samplePattern = 'ERR', pData=pheno_data)#滤掉低丰度的基因,这里选择过滤掉样本间差异少于一个转录本的数据>bg_chrX_filt=subset(bg_chrX,'rowVars(texpr(bg_chrX))>1',genomesubset=TRUE)#确认组间有差异的转录本,在这里我们比较male和famle之间的基因差异,指定的分析参数为“transcripts”,主变量是“sex”,修正变量是“population”,getFC可以指定输出结果显示组间表达量的foldchange。>result_transcripts=stattest(bg_chrX_filt,feature = 'transcript',covariate = 'sex',adjustvars = c('population'), getFC=TRUE,meas='FPKM')#查看有差异转录本的输出结果,如下图
转录组测序数据分析(无参考基因组)
转录组测序数据分析(无参考基因组)一、数据分析流程二、数据分析内容1. 数据预处理目的:对原始测序数据进行一定程度的过滤。
原理:根据测序接头以及测序质量对原始的测序数据进行预处理,其中,测序质量Q与测序错误E之间的关系如下:结果:对预处理后质量以及碱基分布统计进行统计2. UniGene拼接目的:将预处理后reads进行拼接,得到拼接结果。
原理:应用 de Bruijn graph path 算法对reads进行denovo拼接;对上一步的拼接结果,再用Hamilton Path算法拼接。
结果:UniGene序列,UniGene统计信息,序列长度分布图3. 数据库注释目的:对拼接得到的UniGene进行功能注释原理:通过blast+算法将拼接得到的UniGene序列与数据库进行比对结果:比对结果表格,物种分布统计和Evalue分布统计4. UniGene表达分析目的:UniGene定量分析。
原理:以UniGene为reference,分别将每个样本的reads进行reference mapping ,从而得到每个样本在每个UniGenes中的一个reads覆盖度,然后应用RPKM/FPKM标准化公式对富集片段的数量进行归一化。
RPKM:Reads Per Kilobase of exon model per Million mapped reads,公式下:FPKM:Fragments Per Kilobase of exon model per Million mapped reads,公式下:UniGene表达分布图,1X,5X分别为FPKM=1,FPKM=5分界点,可以大体观察到低表达,中表达以及高表达的比例关系UniGene样本间表达相关性散点图样本间表达差异程度的MA图,可以体现差异表达总体偏差5. UniGene表达差异分析目的:对定量结果进行统计检验分析,找出差异表达UniGene原理:双层过滤筛选差异基因FC值筛选:采用Fold-change(FC),表达差异倍数进行第一层此的差异基因筛选FDR检验:一般采用卡方检验中的fisher精确检验进行p值检验,采用Benjamini FDR(False discovery ratio)校验方法对p值进行假阳性检验,即,通过FDR显著性参数进行第二层次的差异基因筛选。
转录组数据分析流程及软件
转录组数据分析流程及软件下载温馨提示:该文档是我店铺精心编制而成,希望大家下载以后,能够帮助大家解决实际的问题。
文档下载后可定制随意修改,请根据实际需要进行相应的调整和使用,谢谢!并且,本店铺为大家提供各种各样类型的实用资料,如教育随笔、日记赏析、句子摘抄、古诗大全、经典美文、话题作文、工作总结、词语解析、文案摘录、其他资料等等,如想了解不同资料格式和写法,敬请关注!Download tips: This document is carefully compiled by theeditor. I hope that after you download them,they can help yousolve practical problems. The document can be customized andmodified after downloading,please adjust and use it according toactual needs, thank you!In addition, our shop provides you with various types ofpractical materials,such as educational essays, diaryappreciation,sentence excerpts,ancient poems,classic articles,topic composition,work summary,word parsing,copy excerpts,other materials and so on,want to know different data formats andwriting methods,please pay attention!转录组数据分析是对细胞或组织中所有 RNA 转录本进行分析的过程,它可以帮助我们了解基因表达的模式和调控机制。
史上最全的转录组研究软件收集
史上最全的转录组研究软件收集这份软件清单,能看出作者的确是花了大力气的,满满的都是诚意。
主要涵盖了转录组分析的以下18个方向,看我我才明白自己的水平的确没到家,印象中的转录组分析也就是差异表达,然后注释一下,最多分析一下融合基因,看看可变剪切,要不然就关注一下那些miRNA,和lncRNA咯,没想到里面的学问也大着呢,怪不得生物是一个大坑,来再多的学者也不怕,咱有的是研究方向给你。
1 Quality control and pre-processing data1.1 Quality control and filtering data1.2 Detection of chimeric reads1.3 Errors Correction1.4 Pre-processing data2 Alignment Tools2.1 Short (Unspliced) aligners2.2 Spliced aligners2.2.1 Aligners based on known splice junctions (annotation-guided aligners)2.2.2 De novo Splice Aligners2.2.2.1 De novo Splice Aligners that also use annotation optionally2.2.2.2 Other Spliced Aligners3 Normalization, Quantitative analysis and Differential Expression3.1 Multi-tool solutions4 Workbench (analysis pipeline / integrated solutions)4.1 Commercial Solutions4.2 Open (free) Source Solutions5 Alternative Splicing Analysis5.1 General Tools5.2 Intron Retention Analysis6 Bias Correction7 Fusion genes/chimeras/translocation finders/structural variations8 Copy Number Variation identification9 RNA-Seq simulators10 Transcriptome assemblers10.1 Genome-Guided assemblers10.2 Genome-Independent (de novo) assemblers10.2.1 Assembly evaluation tools11 Co-expression networks12 miRNA prediction13 Visualization tools14 Functional, Network & Pathway Analysis Tools15 Further annotation tools for RNA-Seq data16 RNA-Seq Databases17 Webinars and Presentations18 References。
利用生物大数据技术进行转录组学分析的步骤及注意事项

利用生物大数据技术进行转录组学分析的步骤及注意事项转录组学是研究生物体某一特定时间点或条件下转录过程中所有的RNA分子的总称。
随着高通量测序技术的发展,大规模转录组数据的获取和分析变得更为可行。
利用生物大数据技术进行转录组学分析,可以揭示基因表达调控、寻找新的基因、预测蛋白质功能等,因此在基础生物学、医学研究和生物制药等领域得到广泛应用。
以下将介绍利用生物大数据技术进行转录组学分析的一般步骤,并列出相关的注意事项。
步骤一:实验设计与样本制备实验设计是转录组学分析的重要一步,它应该基于研究问题和统计学原理。
首先明确研究目标:比如是发现差异表达基因、寻找分子机制、发现新的基因等。
然后选择适当的实验组和对照组,保证样本之间的差异是实验因素引起的,而非技术误差。
同时,根据实验目的选择合适的组织、生长阶段和处理条件进行样本制备,保证高质量的RNA提取。
步骤二:RNA提取与测序RNA提取是转录组学分析的关键步骤,其目的是提取到高质量的RNA样本。
采用标准的RNA提取技术,如酚/氯仿法、磁珠法等,能够得到富含完整RNA的样本。
接下来是转录组测序,目前常用的有两种方法:RNA-seq和微阵列芯片。
RNA-seq技术可以获得全转录组的信息,包括基因表达水平、剪接异构体和转录本等,而微阵列芯片则是通过探针序列检测特定基因的表达。
选择合适的测序方法取决于实验目标、样本特性和经费预算等因素。
步骤三:数据处理与分析数据处理与分析是转录组学研究中的核心环节。
首先要对测序所得的原始数据进行质控,包括去除低质量的reads、去除接头序列、剪切不合理长度的reads等。
接着使用合适的生物信息学工具和算法进行数据分析,主要包括基因表达量计算、差异表达分析和富集功能注释。
在这个过程中,需要注意选择恰当的数据处理软件、参数设置和参考基因组。
对于初学者来说,可以借助已有的分析流程和工具提供的文档进行学习和参考。
步骤四:结果解释与验证分析得到的转录组数据需要进行解释和验证。
- 1、下载文档前请自行甄别文档内容的完整性,平台不提供额外的编辑、内容补充、找答案等附加服务。
- 2、"仅部分预览"的文档,不可在线预览部分如存在完整性等问题,可反馈申请退款(可完整预览的文档不适用该条件!)。
- 3、如文档侵犯您的权益,请联系客服反馈,我们会尽快为您处理(人工客服工作时间:9:00-18:30)。
• --SS_lib_type (Strand-specific libFra bibliotekary type)
– Paired reads: • RF: first read(/1) of fragment pair is sequenced as antisense(reverse(R)), and second read(/2) is in the sense strand(forward(F)); typical of sequencing method. • FR: (reverse)
len: length of the transcript sequence
Trinity拼接质量评估
• N50/N90:按照长度将拼接转录本从大到小排序,累加转录本的 长度,到不小于总长50%/90%的拼接转录本的长度就是N50/N90。
OUTLINE
拼 接——Trinity(无参) 比对定量——RSEM(无参) 比对软件(Tophat2有参) ) 定量(HTSeq有参)
常用数据库介绍(NCBI,ENSEMBL)
step1:Inchworm
1.分解测序reads,构建k-mer字典 2.从k-mer字典中移除error-containing k-mer 3.选择seed k-mer 4.Seed k-mer 延伸,构成contig 5. 重复seed selection 和 bidirectional k-mer extension 直到k-mer 字 典耗尽 6. 过滤 contig
– Unpaired (single) reads: • F: the single read is in the sense (forward) orientation • R: the single read is in the antisense (reverse) orientation
step2:Chrysalis
1.将contigs 组合成connected components 2. 将每个component构成一个de Bruijn graph 3.reads回比 4.过滤
step3:Butterfly
Butterfly resolves alternatively spliced and paralogous transcripts
--min_kmer_cov 2 \ --min_glue 2 \ --full_cleanup \#删除中间文件
Trinity示例
• 输出结果
– Trinity.fasta文件 – unigene.fasta文件
从trinity.fasta中选择最长的转录本作为unigene,Trinity作者推荐
Trinity参数
• --min_contig_length default:200 (step1,filter contigs)
– minimum assebled contig length to report
• --min_glue default:2 (step1,contigs to componets)
常用数据库介绍(NCBI,ENSEMBL)
1. 图形化简
2.解图,确定转录本序列
Butterfly
•
2016-1-11
Butterfly
2016-1-11
Trinity
• --jaccard_clip
Trinity参数
– for gene-dense compact genome, such as fungal genomes, where transcripts may often overlap in UTR regions.
Trinity拼接结果解读
• >c1_g1_i1 len=233 path=[94:0-232]
c1: sequence is derived from Chrysalis component 1 g1: sequence also corresponds to Butterfly subcomponent# 1 (during graph compaction and pruning, some components are partitioned into disconnected subcomponents). i1: sequence count from chrysalis component 1, butterfly subcomponent 1. If this subcomponent yields multiple sequences, these will have different seq numbers.
转录组分析流程及常用软件使用方法
(无参,有参)
Novogene 孙福明
2015.1.12
无参转录组分析流程
有参分析流程
OUTLINE
拼 接(无参) 比对定量(RESM无参) 比对软件(Tophat2有参) ) 定量(HTSeq有参)
常用数据库介绍(NCBI,ENSEMBL)
OUTLINE
拼 接——Trinity(无参) 比对定量(RESM无参) 比对软件(Tophat2有参) ) 定量(HTSeq有参)
- min numbler of read needed to glue two inchworm contigs together
Trinity示例
ln -s /BJPROJ/RNA/rna_test/TR_bioinfomatics1/prepare/sunfuming/lession5/trinitydata/re ads.*.fq . perl /PUBLIC/software/public/Assembly/trinityrnaseq_r20140413p1/Trinity \ --seqType fq \ --JM 2G \ --left reads.left.fq \ --right reads.right.fq\ --SS_lib_type RF \ --CPU 4 \