缆道雷达波测流系统软件使用说明书
无线遥控雷达波数字化测流系统的组成及应用
无线遥控雷达波数字化测流系统的组成及应用侯宇;喇乾坤【期刊名称】《河北水利》【年(卷),期】2015(000)006【总页数】1页(P11-11)【作者】侯宇;喇乾坤【作者单位】张家口水文水资源勘测局;张家口水文水资源勘测局【正文语种】中文S3—SVRII型无线遥控雷达波数字化测流系统是一种新型的非接触式中小河流流量快速测验系统。
系统采用了雷达多普勒表面测速、惟一姿态精确控制、指令信息无线数字传输、状态检测及智能决策、数据实时分析处理等大量新技术,水文系统统称之为“缆道测流机器人”。
该系统是在直径4.2mm的简易钢丝绳缆道上,利用无线遥控、配套定位和测流软件,在电脑上远程操作,以非接触方式测验、计算水面流速、断面流量。
无线遥控雷达波数字化测流系统主要用于取代浮标法进行较大洪水流量测验,特别适合高流速、多漂浮物情况时流速仪无法入水情况下的流量测验,也可用于巡测、极浅水和一般性测流。
1. 设备组成部分及特点设备组成部分包含:测验缆道,在断面上架设和该仪器设备配套使用的4.2mm的镀锌或不锈钢钢丝绳;雷达波定位测验流速仪,多普勒雷达波流速传感器、步进电机和高性能细分驱动器、PLC、无线信号传输及内置锂电池;无线遥控数字化处理器,计算机,无线遥控、仪器定位控制器及测流数字化处理计算软件。
无线遥控雷达波数字化测流系统特点包含:精度高,速度快;使用不受风雨和停电影响,测验数据准确规范;功能完备,可靠性高,适用性广;操作携带方便;全新便携式测流系统;适用各种复杂水况等特点。
2. 主要技术规格及操作主要技术规格:起点距范围:-2000~2000m;测速范围:0.2~18m/s;流速精度:±0.03m/s;传输距离:2000m。
操作流程:启动设备(先启动雷达波定位测验流速仪,再启动电脑雷达波测流程序)—测流开始,设置设备参数—点击“测流→垂线设置”,输入水位,点击“提取垂线”,点击“确定”—点击“测流→测流开始”,再点击界面上的“连续测流”,进行自动测流—测流完成后点击“流量计算”,然后点击“数据→报表导出”生成报表—测流完成后,可以手工进行补测或重测。
测波雷达操作手册

WaMoS® IIWave Monitoring SystemOperating ManualVersion 3.03Installation GuideOceanWaveS GmbHMunstermannskamp 1D - 21335 LüneburgTable of Contents:1 Preface (8)2 Introduction (9)3 Technical Data (12)4 Hardware Description (14)4.1 WaMoS PCI-card (14)4.1.1 The components are: (14)4.1.3 LEDs on the PCI-card: (15)4.2 NMEA Input / Output (16)4.3 Failure Control (18)4.4 PC Watchdog (18)4.5 Antenna Motor Control (19)4.6 Alarm Interface (19)4.7 Hardware Error Logging (19)5 Control program: WinWaMoS (21)5.1 Installation (21)5.2 Program Modes (21)5.3 User Mode (21)5.3.1 Menu View (22)5.3.2 Menu Control (23)5.3.2.1 Menu Item: Configuration User Display (24)5.3.2.2 Menu Item: Start/Stop Automatic Recording (25)5.3.2.3 Menu Item: Save Screenshot (27)5.4 Install Mode (28)5.4.1 Menu Control - Menu Item: Configuration WaMoS (28)5.4.1.1 Station Setup (30)5.4.1.2 Measurement (31)5.4.1.3 Measurement Event Handling (33)5.4.1.4 Cartesian Transformation (35)5.4.1.5 Radar (37)5.4.1.6 PCI-Card (38)5.4.1.7 Program Mode (40)5.4.1.8 Quality Control (42)5.4.1.9 Calculation parameters (45)5.4.1.10 Sea state alarm (47)5.4.1.11 NMEA (48)5.4.2 Menu Control – Menu Item: Watchdog Buzzer (F4) (53)5.4.3 Menu Analysis (54)5.4.4 Menu Test (54)5.4.4.1 Test WaMoS Device ... .. (54)5.4.4.2 Test NMEA Service (55)5.4.4.3 Test WatchDog (56)5.4.4.4 Test User Display (57)5.4.4.5 Test ADC-Level (58)6 WaMoS II Data Products (59)6.1 File Name Convention (59)6.2 WaMoS II Data Formats (60)6.2.1 Polar Image Files (61)6.2.2 Cartesian Images (61)6.2.3 Two-Dimensional Wave Number Spectrum (62)6.2.4 Frequency Direction Spectrum (Frequency Theta Spectrum) (63)6.2.5 One-dimensional frequency spectrum (63)6.3 Time series of WaMoS II measurement (64)6.4 Log files of WaMoS II measurement (67)7 Configuration file: wamos.cfg (68)8 List of Notations, Symbols and Descriptions (69)9 Preventive mainenance WaMoS Processor Unit (71)Appendix1Appendix Header (74)1.1 Polar Image (74)1.1.1 Header of a Polar Image (74)1.1.2 Keywords of the Polar Header (75)1.2 Cartesian Image (76)1.2.1 Header of a Cartesian Image (76)1.2.2 Keywords of the Cartesian Header (77)1.3 Three-Dimensional Wave Number Frequency Spectrum (77)1.3.1 Header of the FFT (77)1.3.2 Keywords of the FFT Header (78)1.4 Two-Dimensional Wave Number Spectrum (79)1.4.1 Header of the Wave Parameters (79)1.4.2 Keywords of the Wave Analysis Header (80)2 Appendix Configuration File (82)2.1 Example of the configuration file: wamos.cfg (82)2.2 Example of the file: user.bat (88)2.3 Example of the file: backup.bat (88)3 Appendix Software Error Codes (89)4 Appendix Error Handling (91)FigureFigure 1: Components of WaMoS II (8)Figure 2: WaMoS II PCI card (11)Figure 3: WaMoS II wiring diagram (12)Figure 4: Functional block diagram of the WaMoS II sampling unit. (13)Figure 5: WaMoS II LEDs (14)Figure 6: WaMoS II polar image onboard the cruiser ‘Freedom of the seas’.22 Figure 7: Configuration of the display settings (23)Figure 8: WaMoS II while sampling (24)Figure 9: File dialogue to save screen shot (26)Figure 10: Station Setup tab of WaMoS II configuration menu (27)Figure 11: Measurement tab of WaMoS II configuration menu (29)Figure 12: Measurement event handling tab of configuration menu (31)Figure 13: Cartesian transformation tab of WaMoS II configuration menu (32)Figure 14: Hardware tab of WaMoS II configuration menu (33)Figure 15: ADC-Settings tab of WaMoS II configuration menu (35)Figure 16: Program Mode tab of WaMoS II configuration menu (37)Figure 17: Quality control tab of WaMoS II configuration menu (39)Figure 18: Calculation parameters tab of WaMoS II configuration menu (41)Figure 19: Sea state alarm tab of WaMoS II configuration menu (43)Figure 20: Sea state alarm window (44)Figure 21: Configuration of the NMEA of COM-port 1 (45)Figure 22: Selection of NMEA Service properties (45)Figure 23: Select NMEA service ‘Compass’ (46)Figure 24: Selection of NMEA Address (46)Figure 25: Manual selection of NMEA Address (47)Figure 26: Selection of NMEA service position (47)Figure 27: Selection of NMEA service format (48)Figure 28: Selection of NMEA service COM-port connection (48)Figure 29: Configured NMEA service (49)Figure 30: Test basic WaMoS II hardware functions (51)Figure 31: Test NMEA service (52)Figure 32: Test WatchDog Card (53)Figure 33: Activated Test WatchDog Card (53)Figure 34: Test ADC-Level (54)Figure 35: Error pop-up window indicating loss of video signal (82)Figure 36: Error pop-up window indicating loss of heading signal (82)Figure 37: Error pop-up window indicating hardware communication error.83 Figure 38: Error pop-up window indicating image size error (83)TableTable 1: WaMoS II wave and current parameters and accuracies (9)Table 2: NMEA Sentence Data Format Notation (15)Table 3: NMEA Sentence Unit Notation (16)Table 4: NMEA not standardized Sentence Description (16)Table 5: Quality index IQ (40)Table 6: WaMoS II standard products and the extensions and subdirectory.56 Table 7: Wave parameters stored in the PARA- and MPAR data files (60)Table 8: Wave parameters stored in the PEAK- and MPEK data files (61)1 PrefaceCOPYRIGHT© Copyright 2005 OceanWaveS GmbH. All rights reserved.No part of this publication may be reproduced or stored in any form, without the prior consent of OceanWaveS GmbH,Munstermannskamp1,D-21335Lüneburg, Germany.WaMoS® II and WaMoS® II Wave Monitoring System1 are registered trademarks of OceanWaveS GmbH, Lüneburg.CHANGESThis manual has been validated and reviewed for accuracy. The instructions and descriptions are accurate at the time of the production of this manual. The material in this manual is for information only and is subject to change without notice.OceanWaveS GmbH reserves the right to make changes in the product design without reservation and without notification to its users.1 WaMoS® II is a registered trademark. In the following of the manual the notation of WaMoS® II takeplace without trademark label.Changes Control PageThis section is being used as a template to control and track modifications made to this document.Modifications since version 3.02Revision Date: 17.09.2007Author: Dieter GronholzSection: 5.3 Figure 7; 8 and 9 modifiedPage number: 25; 26; 28Wrong link to appendix corrected.Section: 6.2; 6.2.1; 6.2.2; 6.2.4; 7Page number: 62; 63; 64; 65; 70Border between wind see and swell set from 10 s to 9 s.Section: 6.3Page number: 67Summary of changes: Screenshots form the new softwere implemented.2 IntroductionReal-time information about the sea state, such as wave height, wave period, wave direction,and surface currents is crucial for coastal protection and off-shore operations (e.g. oil platforms or ships). Wave Monitoring System – WaMoS II is a state-of-the-art system developed to measure the spectral sea state and surface current parameters remotely. The system is especially designed for the operation from fixed and moving platforms, and on board all types of ocean going vessels as well as coastal sites.The overall advantage of WaMoS II is,the continuous availability of wave data in very rough sea conditions even under harsh weather conditions and during night with limited visibility.The system uses the output from a standard marine X-Band radar which is typically used for traffic control and navigation purposes.WaMoS II permits objective measurements of the sea state.By analysing the spatial and temporal evolution of the radar backscatter from the sea surface the system allows to obtain unambiguous directional wave information.The measurement is based on the backscatter of microwaves from the sea surface, that is known as 'sea clutter' on common nautical radar units. All the important sea state parameters,such as significant wave height,wave periods,wave lengths and directions are derived from the unambiguous directional wave spectrum in near real time.Figure 1: Components of WaMoS II.The system consists of both hardware and software components. The hardware components are comprised of a standard marine X-Band radar,the WaMoS II Connection Box and a standard PC.The specially developed WaMoS II control program (software “WinWaMoS”), which captures and stores the sequences of radar images of the sea surface, includes the radar test routines, the configuration facilities, the wave analysis and the display, storage and data handling routines.The wave and current data are displayed graphically as well as being made available as a text output,in data files and/or remotely via modem or internet, intranet or serial line (NMEA 0183).Table 1 gives the standard wave and current parameters with the corresponding accuracies as delivered by WaMoS II. The resolution depends on the radar which is used and the installation configurations. Typical values are provided:Table 1: WaMoS II wave and current parameters and accuracies.Notes:1) Depending on which one is larger2) The first and second peak refers to the first and second energy maximum in thefrequency-direction spectrumThe system can operate in an automatic mode for unattended stand-alone wave monitoring. Data sampling and wave analysis are carried out in user-defined time intervals.WaMoS II can be operated on board moving vessels,from offshore platforms and from coastal sites.3 Technical DataWaMoS II can be connected to almost any type of marine X-Band radar. The following radars have been used successfully with WaMoS II:•FURUNO FR 2125 B•FURUNO FR 1525 MK III•JRC JMA-5526-6•JRC JMA-9823-7XA•Litton Marine System BridgeMaster E•STN-ATLAS Radarpilot Atlas 1000•RAYTHEON Pathfinder MK I•Kelvin Hughes Nucleus 2-5000/2-6000/3-5000.The list is only a short excerpt.Please contact us if you want to use a radar different from these.WaMoS II is a PCI plug in card for standard PCs. This card is easy to install to any PC providing a free PCI slot.Minimum Hardware requirement:Pentium© III with 800 MHz256 MB RAM80 GB Hard diskFigure 2 shows a picture of the WaMoS II PCI card.Figure 2: WaMoS II PCI card.The WaMoS II radar image sampling unit is connected via an isolated buffer amplifier to the radar. Four signals from the radar are required as input signals to obtain the radar images and synchronization.These signals are:―VIDEO―TRIGGER/SYNC―HEADING―BEARING.Figure 3: WaMoS II wiring diagram.4 Hardware DescriptionThe different hardware components of WaMoS II are described in this chapter.4.1 WaMoS PCI-cardFigure 4: Functional block diagram of the WaMoS II sampling unit.4.1.1 The components are:A/D-Converter High speed flash analog-to-digital converterFiFo Memory Fast FiFo (First-in-First-out) memory for radar range bursts Clock Logic Programmable clock oscillator to provide 10 – 200 MHz Control Logic CPLD (Complex Programmable Logic Device) control logic PCI-Bridge Bridge to connect the PCI bus of the PCReset Relay The integrated Watchdog uses this relay to restart the PC Connector 2 x 40 pins For the connection of additional circuits4.1.2 Principal functions:Commands are sent from the control software via the PCI-Bridge to the Control Logic. The control logic runs the sampling under its own control. The Video signal from the radar will be prepared by the signal preparation. The Control Logic controls the A/D-Converter to sample beams of the radar and stores these with the full sample frequency in the FiFo Memory. The sample frequency is provided by the clock logic and can be chosen by the software between 20 and 50 MHz in 1 MHz steps. The Control Logic also contains a Watchdog. The watchdog must be triggered by the software, otherwise it will restart the PC after a programmable time (30 sec, 20 min, 40 min or 12 h). The required radar signals for the sampling are provided by the WIBA (WaMoS Isolated Buffer Amplifier). These are Video, Trigger, Heading and Bearing. On the PCI card are two connectors for further expansions to prepare the radar signals. The PC software sends different commands to the control unit setting up the hardware and controlling the sampling process.4.1.3 LEDs on the PCI-card:On the PCI card is a section with four LEDs located, as shown in the following picture:Figure 5: WaMoS II LEDsLED Description:4.2 NMEA Input / OutputWaMoS II accepts serial inputs from navigational instruments such as compass and GPS. The inputs must comply to NMEA 0183 standard and can be enabled in the WaMoS II configuration (see chapter 5.4.1). The WaMoS II outputs are wave parameters in not standardized NMEA format.The values in NMEA sentences are separated by comma. The commas are not part of the NMEA data. The NMEA sentence starts with '$' and ends with '∗' followed by the hexadecimal check sum in the form of two ASCII characters. This check sum is calculated by exclusive disjunction the8data bits of each character in the sentence between '$' and '∗'.The NMEA sentence ends with <CR> and <LF>. These are single byte characters with ASCII values 13 (0D hex) and 10 (0A hex). These characters act as the ‘end of sentence’ marker and are not separated by a comma (i.e. they follow direct after the check sum).The values of the NMEA sentence can have three different formats:•numeric data,•alpha numeric data,•time stamps.The data types represented in the NMEA sentence description are given in Table 2.Table 2: NMEA Sentence Data Format Notation.All other characters are literal. They appear in the data as noted in the format (hyphens in date formats, colons etc.). Sentence formats also include a unit column indicating the unit of the value. The abbreviations of used units are described in the following table:Table 3: NMEA Sentence Unit Notation.The WaMoS II NMEA not standardized sentence has the format as described in the following table with a total length of 118 characters including separating commas:Table 4: NMEA not standardized Sentence Description.An example output is:$PWAM,0001.0,0006.2,0236.4,0007.2,0082.1,0237.6,0007.0,0076.9,0192.2,0007.8, 0097.1,0044.1,0007.6,2000-02-17 16:54:00*214.3 Failure ControlWhile booting, the WaMoS II PC executes BIOS, CPU and RAM/ROM tests. When the program starts an additional hardware check is performed.This check is repeated before measurement starts. Any failure (e.g. radar is disconnected) results an error message on the screen and is stored in a Log-File (‘HWERRORMMyyyy.LOG’ MM =>month yyyy => year). This file is stored in the same directory where the WinWaMoS.exe is located. This is usually C:\WinWaMoS\. The program controls the data output for plausibility (see chapter 5.4.1.8). A fail-safe potential-free relay (located in the WIBA see Figure 3) sends an alarm in case of hardware errors or power failure. If WaMoS II sends data to another system a parity check sum test is performed.4.4 PC WatchdogFor an unattended WaMoS II operation, a PC Watchdog is integrated into the PCI-card. This ensures that in case of a PC system error due to an electrical discharge (for instance), the system reboots automatically. The PC Watchdog observes the WaMoS II control program WinWaMoS by an independent logic part inside the control logic (see Figure 4) of the PCI-card. The PC Watchdog relay is connected parallel to the reset push button of the PC.A LED on the PC front panel indicates the PC Watchdog's operation:― A two Hertz flashing light indicates that the PC Watchdog is set to20 minutes.― A 0,5 Hertz flashing light indicates that the PC Watchdog is set to 12 hours.The PC Watchdog is always activated independent of the WinWaMoS program. During start up, the PC Watchdog is set to 12 hours, if WinWaMoS is in sampling mode the PC Watchdog is set to 20 minutes. This means, if WinWaMoS did not trigger the PC Watchdog during this time, the PC Watchdog will reboot the PC.A buzzer will give a warning sound 120 seconds before the PC Watchdog resets the computer to give an operator the chance to save his work or to restart the application.If the sampling mode is stopped or WinWaMoS is terminated,the PC Watchdog is set to 12 hours.a)b)Figure 6: a) Connection between PC Watchdog relay to reset push button andb) excerpt of the board pin out4.5 Antenna Motor ControlIf WaMoS II wave measurement is set to intervals (see chapter 5.4.1.2) the radar antenna can be switched on and off automatically and the radar transmitter can be switched to stand-by mode.This increases the life time of the radar and its magnetron and also saves electrical power. The switch unit is located inside the WIBA.4.6 Alarm InterfaceThe alarm interface is connected to a normal closed relay contact.If a not correctable error occurs, for instance a radar defect, the relay opens the contact. This can be used to activate an alarm circuit or an operator bell.The alarm interface can also be programmed for any kind of output parameter (e.g. critical wave height, wave length, period) to activate an external warning (see chapter 5.4.1.3). The alarm interface is also located inside the WIBA.4.7 Hardware Error LoggingIn case of an error during data sampling,transfer or analysis occurs,the corresponding error codes and error messages are logged to error files (hardware error => HWERRORMMyyyy.LOG (MM =>month yyyy => year); analysis error => ERROR.LOG). A list of error codes and the corresponding error messages can be found in the appendix of section 3 and 4.The error codes and messages are popping up as a window on the screen. This window can be closed by confirming the OK button. Independent what kind of error occurs, the WinWaMoS is always trying to repeat the measurement. The error log files are stored in the same directory where the WinWaMoS.EXE is located. This is usually C:\WinWaMoS.If an error occurs, the alarm relay inside the WIBA signals the error condition to a remote system (if connected) by a potential free contact. The error relay is safe of failure, which means that under normal operating conditions the contact is open. Hardware errors can occur when a signal of the radar is missing or has wrong information, for example due to a bad cable connection or internal failure of the radar or WaMoS II. If WinWaMoS is configured to receive NMEA data, the missing input or format errors are also logged.Format and description of HWERRORMMyyyy.LOG:Sample output:12-13-2005 08:14:48 Error CNMEACom::ConnectToCom: PurgeComm for <COM1>failed. GetLastError()=995 The I/O operation has beenaborted because of either a thread exit or an applicationrequest.@12-13-2005 10:53:17 Error CAutoRecord::ReadNMEAData: NMEA ship speed servicefailed (66) sec12-13-2005 10:54:26 Error CAutoRecord::GetImage: Failed res= -2 bearing= 0NumBytes= 0 ErrorCode= 0 resBearing= 0 resErrorCode= 0 12-13-2005 11:04:44 Error Radar Error: Start of radar failed. @Check communicationand heading signal!12-13-2005 11:06:02 Error ThreadProc_ReadDMA: Error: <ReadDMABlock: Unable toperform DMA transfer. Err=518>.12-13-2005 11:06:34 Error CPCIWamos::WaitForHeading failed.Probably no heading signal.12-13-2005 14:12:27 Error CUserDisp::ShowPTMSpectrum: File<d:\radar\fthspec\200512131410fos.pth> not found or illegalformat.Errors are logged with date and time, error code and error message. The date and time is given in the format: MM-dd-yyyy hh:mm:ss.5 Control program: WinWaMoSWinWaMoS is the software that controls the WaMoS II hardware, carries out the wave analysis and displays the results.5.1 InstallationThe WinWaMoS software will be installed by starting the ‘install.bat’ file on the WaMoS II CD-ROM. The install program creates a directory called WinWaMoS on the hard drive ‘C:\’ (e.g. C:\WinWaMoS) and copies the ‘WinWaMoS.exe’ file and the configuration file ‘wamos.cfg’ (see chapter 7) into the directory.5.2 Program ModesWinWaMoS can operate in two different running modes:•user mode(see chapter 5.3) and•the install mode (see chapter 5.4).The user mode is the basic setting of WinWaMoS.The control program ‘WinWaMoS’starts in the user mode automatically.This mode is for normal sampling activity and displays the results. The install mode allows to configure the basic measurement setup and to test the hardware.5.3 User ModeThe user mode has four menu items:•View: display of existing data sets (see 5.3.1).•Control:―configuration of the display settings (see 5.3.2.1),―start/stop the automatic data recording and wave analysis (see 5.3.2.2)―save screen-shots of the display (see 5.3.2.3).•User Display: If there are different user displays set up (see 5.3.2.1), it is possible to choose the different user settings here.•Night Display: Changes the colours and brightness for a glare-free night time display and the other way round. For a propper and easy to usenight display it is additional necessary that the monitor has a brightnessturning knob at the frontside.5.3.1 Menu ViewThe different WaMoS II wave data products (see chapter 6) can be displayed under the menu item ‘View’.These data products are:•‘Polar file’: ... shows the radar image sequence (see Figure 7). It is also possible to view Polar files wich are compressed to a ZIP-file. In thiscase the drive where the zipped polar files are stored must not be writeprotected. Also on this drive must be enough free disk space to unpackthe files which should be displayed.The files must be zipped withPKZIP25.exe and this file must be present in the WinWaMoS folder (i. e.C:\WinWaMoS\).•‘Cartesian file’: ... shows the subsection of the radar image sequence in the area from which the wave analysis is performed.•‘Wave Number Spectrum’: … shows the wave energy as a function of wave number in x- and y-direction.•‘Frequency Direction Spectrum’: ... shows the wave energy as a function of frequency and direction.•‘1D-Frequency spectrum’: ... shows the wave energy as a function of frequency.•‘Wave Parameter History’: …shows the history of selectable wave parameters (e.g. significant wave height and/or peak wave period). Inaddition the start day of the history and an according number of days canbe chosen.The selection of one of these menu items opens a file-dialogue window, containing the available data files. The selection of one or more of these data files displays sequential the data. To stop displaying or to select another data product use the break button. The display of a sequence of polar or cartesian images can be paused by using the ‘Pause’ button and continued by using the ‘Continue’ button.Figure 7: WaMoS II polar image onboard the container vessel ‘Gray Fox’.5.3.2 Menu ControlThe control menu in the user mode contains 5 menu items:•Goto Install Mode: change the program mode•Configuration User Display (see section 5.3.2.1)•Start/stop automatic recording (see section 5.3.2.2)•Save screen shot (see section 5.3.2.3)•Exit program(will end the program and requires the password 'gohome')To change the program to install mode, or to exit the program it is necessary to stop the automatic recording first.5.3.2.1 Menu Item: Configuration User Display ...The WaMoS II data display can be configured from the main menu ‘Control => Configuration User Display’. Individual settings can be saved for an unlimited amount of users.Figure 8: Configuration of the display settings.The parameters that can be displayed are 'selected' or 'deselected' in the check boxes. The order of the parameters can be changed by 'sort up' and 'sort down' buttons. For the history plots the number of days to be displayed, as well as the minimum and maximum values of the plot can be chosen. Additional the display colours for daylight as well as for night time viewing can be selected individual. Typing in a user name together with the'save changes'button will save the configuration under this name.5.3.2.2 Menu Item: Start/Stop Automatic RecordingWhen WaMoS II is set to operational measurements, it automatically records the radar image sequences and calculates the wave and surface current parameters.The procedure can be separated into the following steps:1.Sampling of the polar radar image sequences: The hardware (see chapter4) samples a sequence of digital radar images of the sea surface and storesthe sequence on the hard drive.2.Cartesian Transformation:For the wave analysis a rectangular sub-area,called the analysis area,is extracted from the full polar radar image (see chapter 6.2.1)and is transformed into cartesian coordinates(see chapter6.2.2). The size of the analysis area, its position and the length of the timeseries is configurable in the install mode under the menu item Control/ Configuration WaMoS.3.Discrete Fourier Transformation:The sequence of cartesian radar imagesis transformed into a3D-wave number frequency spectrum by applying a discrete Fourier Transformation.4.Filtering the 3D-image spectrum and surface current determination: Thedispersion relation is applied as a band-pass filter to separate the energy associated with the ocean waves from the background noise and the surface current is determined.5.Determination of the unambiguous 2D-image spectrum: The unambiguouswave-number spectrum is obtained by integrating over the frequency domain and applying a modulation transfer function (MTF). (See chapter 6.2.3).putation of the directional wave spectrum:The2D-wave numberspectrum from the wave number domain is transformed into the frequency direction domain (see section 6.2.4).7.Determination of the frequency spectrum and all other sea stateparameters(see Table 1):Several statistical wave parameters are derived from the 1D-wave spectrum (see chapter 6.2.5).8.Determination of the mean wave parameter over the chosen timeinterval: The mean 2D-wave spectrum is determined by spectral averaging.The results of the different analysis steps will be stored on the hard drive. The file name convention and the data format are described in chapter 6.1.In case of an analysis failure, the measurement is discarded. The corresponding error code and message is stored in an error log file named ‘CERRxxxx.LOG’ located also in the WaMoS II working directory (e.g.C:\WinWaMoS).Description of the analysis errors are given in appendix 3 and 4.To start the automatic recording, choose ‘Control => Start Automatic Recording’ from the main menu.Figure 9 shows the screen while in automatic recording (this is the standard setting, the appearance depends on the settings in Configuration User Display):Figure 9: WaMoS II while sampling.The example of the user display shows:•Time and status of the measurement (top left: yellow)•Current sea state parameters such as: significant wave height, peak wave period, peak wave length, and peak wave direction(middle left: red)•Radar image (bottom left).。
雷达波缆道测流
大部分需要监测的河流分布广、地域宽、站点多,特别是山溪性河流汇流速度快,洪水陡涨陡落等特点,使得流量测验极为困难。
该系统可不直接接触和扰动(或破坏)水流结构可以实现自动精确监测,安全快捷。
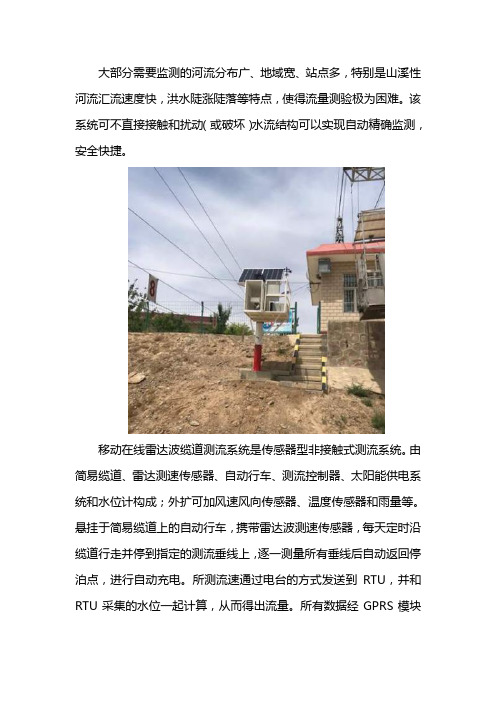
移动在线雷达波缆道测流系统是传感器型非接触式测流系统。
由简易缆道、雷达测速传感器、自动行车、测流控制器、太阳能供电系统和水位计构成;外扩可加风速风向传感器、温度传感器和雨量等。
悬挂于简易缆道上的自动行车,携带雷达波测速传感器,每天定时沿缆道行走并停到指定的测流垂线上,逐一测量所有垂线后自动返回停泊点,进行自动充电。
所测流速通过电台的方式发送到RTU,并和RTU采集的水位一起计算,从而得出流量。
所有数据经GPRS模块发送到指定的中心站。
整个过程无需人工操作,方便快捷,省时省力。
移动在线雷达波缆道测流系统设计遵循无人值守、简单可靠、方便维护、功能完善的原则,采用雷达波施测多条垂线测速,同步采集相应水位,按部分面积法计算流量,实现流量自动监测。
系统遵循《河流流量测验规范》和《水文缆道测验规范》,成果输出符合《水文资料整编规范》,实现数据输出与整编软件无缝衔接。
另外,此系统支持远程手动测流和修改参数等功能;如河道的断面、垂线、水位计高程、测流历时、低水停测、低温停测、大风停测、加报段制、加报水位及加报変幅等都可以远程修改。
航征科技是目前国内具有自主知识产权的雷达方案提供商,拥有多项专利和软件著作权。
航征面向水文、水利、环境保护、城市排水管网等行业用户,提供雷达流速流量在线监测解决方案。
航征分别在上海、无锡建立了运营和研发测试中心,拥有完整的技术研发体系和阵容强大的科研队伍,与清华大学、国防科技大学、上海交通大学等知名院校达成长期战略合作,有多位业内专家作为公司的技术后盾,立志成为全球优秀的智能传感解决方案提供商。
TEL-10A型铅鱼缆道雷达波测速系统比测分析

TEL-10A型铅鱼缆道雷达波测速系统比测分析在科技高速发展的今天,雷达测速在现代广泛运用于各领域,其测速简单方便,雷达波流速仪也逐步走入水文测验中。
为弄清雷达波流速仪在水文测验中的精准度及使用的边界条件,针对新配发的TEL-10A型铅鱼缆道雷达波测速系统,与传统的转子式流速仪进行了比测,对其测流精度进行了分析评价,为其投入生产使用提供依据。
具体比测情况如下:一、TEL-10A型铅鱼缆道雷达波测速系统测流基本原理TEL-10A型铅鱼缆道雷达波测速系统,采用多普勒效应雷达波定点测速原理,对河道过水断面的测流垂线水面点流速在一定时段内多次测速取平均值后,得各测流垂线水面点流速,再将各垂线水面点流速修正为垂线平均流速,采用流速面积法计算流量。
二、比测情况(一)比测设备本次比测采用TEL-10A型铅鱼缆道雷达波测速系统与传统转子式流速仪LS78型、LS25-3A型流速仪进行比测。
比测所用的转子式流速仪为LS78型和LS25-3A型,其中LS78型为今年鉴定,鉴定后使用过3次;LS25-3A型流速仪为2017年鉴定,鉴定后使用次数6次;两台流速仪均在正常使用期限内,能正常使用。
在比测期间,LS78型流速仪使用旋浆号为072513,LS25-3A型流速仪使用旋浆号为960499。
(二)比测地点比测地点选择在黄家庄水文站。
黄家庄水文站是珠江流域西江水系巴江的干流控制站,控制集水面积365km2,属国家基本水文站、区域代表站、二类精度站;该站测验断面顺直,断面呈U型,左右岸为浆砌石护岸,上游沿河多处有拦河坝、抽水站,区间多座水库调节,下游约2.2km处有黄家庄大坝控制水位供二台发电机及两条渠道引水,下游约650m处有马料河汇入巴江,测验中受电站闸坝影响频繁,形成回水顶托。
(三)比测时机比测时机选择了水流流态和水位相对平稳时期,为了验证河水含沙量不同是否会对雷达波流速仪测速带来影响,分别选择了水清沙少时(5月24日)和洪水含沙量大的时机分别比测。
移动式雷达波在线测流系统在水文中的应用

移动式雷达波在线测流系统在水文中的应用摘要:本文主要围绕移动式雷达波在线测流系统展开研究,详细论述系统的设备组成、运行流程、软件管理。
在水文环境中应用在线测流系统,能够自动测验河流流量,测验结果的准确率高,值得推广应用。
关键词:移动式雷达波;在线测流系统;水文应用在开展水文监测工作时,面临水文测站多、洪水期测流隐患大、高洪流量测验时效性不足问题,所以要开发自动在线测流系统,减少流量测验工作量,实现自动化水文测验工作。
水文自动测报系统的建设,可以全面采集和分析雨水情数据,实现远程传输,从而指挥防汛抗旱工作。
然而,技术人员多针对重要流域设置站点,部分河流的位置偏远,测验难度高,因此很难设置测点,也无法获取流域数据,影响雨水情数据的准确性。
在防汛抗旱指挥工作中,为了提供准确的数据参考,要采用移动式雷达波在线测流系统。
通过长期系统运行实践发现,雷达波在线测流系统不仅能够自动检测水文数据,还可以保证数据结果的准确性,应用优势显著。
1、系统运行流程雷达波测流系统运行时,水面流速测量多采用雷达波探头实现,以轨道吊挂仪器,通过测流计算机为缆道控制箱提供电能,对缆道系统的悬吊仪移动予以控制。
测流计算机可以无线控制雷达波探头,测量和接收数据。
同时可采集水位数据,利用断面资料、率定流量计算模型,保证流量数据计算的准确性。
测验流量后,将原始数据、流量计算数据均存储到数据库内,通过GPRS/GSM 模块,将潮流信息发送至在线测流中心。
此外,该测流系统能够实现单根、多根垂线的测流任务。
第一,系统的主控器、蓄电池组、测流计算机、通讯模块、缆道控制箱,均设置在水文测站仪器房。
缆道钢丝绳与仪器房直接相连。
雷达测速探头、钢丝网悬挂机箱,也能够连接到仪器房内。
仪器房采用敞开式结构,并且朝向测流断面,确保雷达波测速探头的灵活使用。
第二,野外机箱内部,主要安装温度传感器、太阳能电池板、数传终端、蓄电池。
机箱下方,主要安装雷达波测速探头。
雷达使用手册

道闸雷达安装调试手册目录一、前言 (3)二、产品概述 (3)三、雷达技术参数 (4)四、雷达安装规范 (5)五、接线定义 (5)六、雷达参数设置 (8)七、调试 (9)八、注意事项 (11)九、保修 (12)一、前言本手册适用于触发和防砸道闸雷达,以下将描述道闸雷达的安装、参数设置、调试以及注意事项,指导您正确安装和使用道闸雷达。
本雷达采用当今集成度最高的24G雷达单芯片收发方案,具有技术含量高、专业强的特性,使用前请仔细阅读产品安装调试手册。
二、产品概述2.1、工作原理道闸雷达是采用24-24.5GHz可调连续波(FMCW)和高速数字信号处理技术,通过计算接收的回波频率与发射频率之间的频率差来计算目标距离,经逻辑运算后执行外部控制和数据传输。
2.2雷达特点与应用▲本产品工作于24-24.5GHz频域区间,全天侯,不受任何气候环境的影响。
▲可完全替代“车辆检测器”,实现关闸和防砸功能,省掉了繁琐的切地感线圈工序。
降低人工成本。
▲可检测人体,或人体以上大小的非金属物体,可确保人员和物资在闸机下方的安全通行。
▲可用于触发检测,如触发摄像机抓拍。
▲可用于警戒区域报警触发器用。
▲有流量记录功能,断电不丢失数据。
2.3雷达天线HFSS仿真效果从上图可看出,要获得更窄的波束,可将雷达横向安装三、雷达技术参数1、输入电压:DC12V 150mA2、工作频率:24-24.5GHz3、调制模式:FMCW4、发射功率:10-15dBm5、波束与闸杆夹角:宽波<15°、窄波<12°6、检测距离:1-6米,±0.2米。
7、通讯方式:RS485 、波特率1152008、工作温度:-40℃~+85℃9、防护等级:IP6710、外型尺寸(长*宽*厚) 131mm*106mm*28.5mm四、雷达安装规范4.1触发雷达和防砸雷达均应垂直于车道方向安装,防砸雷达安装在自动闸杆下方的箱体上,触发雷达安装在雷达安装专用支架上,雷达中心距地面最佳高度为0.6m。
radan5中文操作手册
RADAN5软件用户手册美国地球物理测量系统公司美国劳雷工业公司翻译2004年9月第二章显示、编辑、打印雷达数据 (3)概述General Overview (3)推荐数据处理顺序Recommended Data Processing Sequence (3)编辑文件头Editing the File Header (5)数据显示选项Data Display Options (7)显示参数设置Display Parameters Setup (14)线扫描显示参数Linescan Display Parameters (15)波形显示参数Wiggle Display Parameters (18)示波器显示参数O-Scope Display Parameters (21)其它显示选项Other Display Options (24)交互显示Interactive Display (25)编辑数据Editing the Data (29)显示数据Viewing the Data (29)去除不必要的信息Removing Unnecessary Information (30)保存为单独文件Saving the Selection in a Separate File (35)编辑标记Editing the Markers (36)标记类型 (36)标记数据库选项 (37)打开标记编辑对话框 (38)标记信息浏览 (39)标记编辑 (40)去标记To Delete A Marker (41)加标记To Add A Marker (41)手动修改标记类型To Manually Change Marker Type (42)做图片出报告Generating Displays For Reports (44)打印文件Printing a File (46)第二章显示、编辑、打印雷达数据概述General Overview鉴于处理和解释海量数据需要大量的时间,用户就必须考虑处理程序的必要性。
雷达软件操作说明
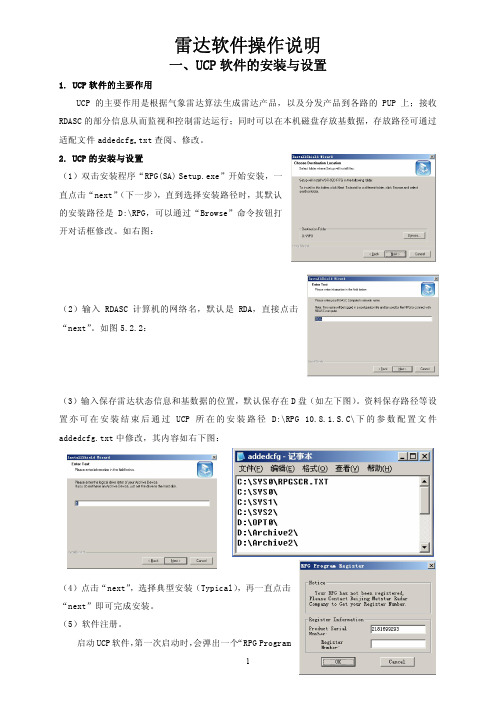
雷达软件操作说明一、UCP软件的安装与设置1. UCP软件的主要作用UCP的主要作用是根据气象雷达算法生成雷达产品,以及分发产品到各路的PUP上;接收RDASC的部分信息从而监视和控制雷达运行;同时可以在本机磁盘存放基数据,存放路径可通过适配文件addedcfg.txt查阅、修改。
2.UCP的安装与设置(1)双击安装程序“RPG(SA) Setup.exe”开始安装,一直点击“next”(下一步),直到选择安装路径时,其默认的安装路径是D:\RPG,可以通过“Browse”命令按钮打开对话框修改。
如右图:(2)输入RDASC计算机的网络名,默认是RDA,直接点击“next”。
如图5.2.2:(3)输入保存雷达状态信息和基数据的位置,默认保存在D盘(如左下图)。
资料保存路径等设置亦可在安装结束后通过UCP所在的安装路径D:\RPG 10.8.1.S.C\下的参数配置文件addedcfg.txt中修改,其内容如右下图:(4)点击“next”,选择典型安装(Typical),再一直点击“next”即可完成安装。
(5)软件注册。
启动UCP软件,第一次启动时,会弹出一个“RPG ProgramRegister”的注册框,打开注册软件“RpgReg.exe”,出现“RPG Register (Version 10)”。
如右图把“RPG Program Register”上面的“Product Serial Number”框内的数字2181699293复制并粘贴到“RPG Register(Version 10)”的“Serial Num”栏,尔后点击“Register”按钮,即可生成注册码。
如右图再把注册码复制、粘贴到RPG注册提示框“RPG Program Register”上,点击OK即可完成安装。
(6)设置通信配置文件C:\ WINNT\Nbcomm.iniUCP生成的雷达产品如何发送到PUP产品显示终端,是通过窄带通信配置文件Nbcomm.ini来控制,相应地PUP也有Nbcomm.ini配置文件,预报员通常是将RPG与PUP安装在同一台电脑,则需要将RPG和PUP的Nbcomm.ini配置文件设置为同一个文件,其通信配置内容如右图二、PUP软件的安装与设置1. PUP软件的主要作用PUP主要作用是从RPG获取、保存雷达产品和gif图,并实现多个功能供观测员对雷达产品进行操作,业务中通过三个辅助软件,将产品、gif图上传北京或者上网。
缆道测流操作规程
缆道测流操作规程《缆道测流操作规程》一、前言缆道测流是水文测验中常用的一种方法,它通过测量水面漂浮物在缆道中的速度来计算水流速度。
为了确保测流的准确性和安全性,制定了一套缆道测流操作规程。
二、作业人员1. 操作缆道测流设备的人员必须接受专业的测流培训,并持有相关证书。
2. 必须严格按照规程进行操作,并遵循安全操作程序。
3. 作业人员应熟悉缆道测流设备的使用方法和维护保养常识。
三、设备准备1. 在进行缆道测流之前,必须对测流设备进行检查,并保证设备无损坏。
2. 必须检查缆道的结构和构造是否完好,是否有任何可能影响测流结果的问题。
四、测流操作1. 选择合适的测流点,根据实际水流状况合理设置设备。
2. 操作人员必须按照正确的测流程序进行操作,不得随意改动或调整设备。
3. 必须准确记录测流设备的位置、水流状况及测量数据等信息。
4. 保持测流设备的清洁和维护,确保设备的精准度。
五、安全注意事项1. 在操作缆道测流设备时,必须严格遵守安全操作规程,确保人身安全。
2. 在恶劣天气条件下,必须停止测流作业,保证作业人员的安全。
3. 在水流较急的情况下,必须加强安全防护措施。
六、数据处理1. 测流结束后,必须对测得的数据进行准确的处理和分析。
2. 对测流时存在的异常情况,必须进行合理的解释和说明。
七、后期工作1. 在测流结束后,必须对缆道测流设备进行及时的清洁和维护,并妥善保管设备。
2. 整理和归档测流数据,确保数据的完整性与准确度。
八、附则缆道测流操作规程的制定和执行,是保障水文测验准确性和安全性的重要举措。
所有涉及到缆道测流的人员都必须严格遵守该规程。
如有违反规程的行为,必须严肃追究责任。
以上就是《缆道测流操作规程》的内容要点,希望所有相关人员能够遵守规程,确保测流作业的顺利进行和准确完成。
雷达数据采集软件K2中文操作手册

INGEGNERIA DEI SISTEMI MN/2004/005雷达数据采集软件K2用户手册2006年12月版本升级版本日期修改原因Rev. 2004年11月第二版(加入附录E,F,G,H)Rev. 2005年8月升级,加入手动增益和删除扫描Rev. 2005年12月增加结构物工具类型(和附录J)Rev. 2006年3月引入Webex支持中心(第节)本手册所涵盖的软件版本01.01.000,,声明IDS 公司对设备不正常使用所造成的后果不承担相关责任IDS 公司对软件不正常使用所造所的后果不承担相关责任.IDS 作为该专用软件的知识产权拥有者,有权在未提前通知用户的情况下对软件进行更改。
联系方式IDS Ingegneria dei Sistemi Sterpulino 2056121 PISA(Loc. Ospedaletto)Tel:+:+客户服务中心:目录1. 概览 (1)1.1如何使用本手册 (1)2. K2系统硬件的配置 (2)2.1DAD控制单元 (2)2.2笔记本电脑 (3)2.3连接DAD控制单元与笔记本电脑 (3)3. K2系统的软件设置 (6)3.1软件安装与设置 (6)4. K2采集软件的使用 (9)4.1启动K2采集软件 (9)4.2选择驱动 (10)4.3增益标定 (13)4.3.1 高级设置菜单 (19)4.4选择测区 (20)4.5设置采集参数 (23)4.6数据采集 (27)4.7查看模式操作 (30)5. 错误信息及报警 (34)5.1错误信息 (34)6. 在线帮助 (35)6.1如何安装“S YMANTEC PCA NYWHERE”软件 (35)6.1.1 使用电话连接养护 (36)6.2使用W EBEX S UPPORT C ENTER远程协助 (37)6.2.1 如何使用Webex服务 (37)1.概览1.1如何使用本手册此K2采集软件使用手册被细分为以下几部分: •:概览•:K2系统的硬件配置•:K2 采集软件操作程序•:K2 采集软件的设置•:错误信息及报警•:在线帮助2.K2系统硬件的配置K2系统由以下几部分组成:•DAD控制单元•笔记本电脑•网络电缆•电池电缆•电池包2.1DAD控制单元DAD控制单元直接与天线相连,把采集的雷达数据数字化的控制单元。
缆道雷达波测流系统软件使用说明书

缆道雷达波测流系统软件使用说明书缆道雷达波测流管理系统用户操作手册河南黄河水文科技有限公司一软件主要功能1)设置测流断面和测流垂线,并能自动绘制河道断面图2)设置左右岸边系数和浮标系数及水位流速系数及报表参数3)计算流速平均历时4)设置测量点测量时长,自动计算平均流速5)接收流速数据和输入水位数据,计算流量并生成流量计算表6)输入水尺读数自动计算水位,水位比降,糙率7)自动计算左水边岸边距与右水边岸边距8)报表以标准Excel格式显示,方便用户打印,传递9)往期报表查询及流速查询10)能够根据测量点自动定位浮标位置并显示当前测量点的起点距11)能提示并自动跳到下一个起点距大一点的测量点,也可以反方向自动跳到下一个起点距小一点的测量点12)具有数据库备份与恢复功能13)具有自动测量模式与人工测量模式14)自动从现有水位系统中提取水位,并计算出流量二软件主要特点1)软件美观大方,具有较强的扩展性2)开发需求来源于一线水文站,符合实际使用的操作习惯,具有人性化的操作界面3)报表小数位数,有效数字及各种数据符合国标要求,有效数字在计算时符合四舍六入五留双原则4)软件符合冗余度,时间复杂度与空间复杂度的算法原理,具有较高的质量三硬件3.1计算机及配件计算机:Intel及其兼容设备,主频500MHz以上;内存:64MB以上;硬盘空间:10G以上;串行通讯接口:一个;Microsoft Mouse 或与其兼容的鼠标器;显示卡:分辨率最低为1024*768,VGA显示器;A3激光打印机。
3.2硬件设备SOMMER RG-30非接触式雷达测流系统无线电台四支持软件操作系统名称及版本号:window2000,window xp,windows2003;数据库管理系统的名称及版本号:Microsoft SQL Server2000标准版;办公系统的名称及版本号:Microsoft Office2003中文版、Microsoft Excel2003中文版。
单轨双轨雷达波测流系统比较

单轨和双轨雷达波在线测流系统比较
单索钢丝绳 双索道钢丝绳 单轨优势 缆道形式 单索钢丝绳 双索道钢丝绳 单轨结构简单、安装方便、故障率低、容易维护、行车更换快捷。
安装形式 可立杆式安装,无需站房 必须安装在站房内 新建站无需做站房,两岸各建一根立杆即可。
雷达波流速传感器斯德克传感器 非斯德克传感器 斯德克传感器采样速率高,行车晃动不影响测速精度。
供电 100W太阳能 交流+太阳能 太阳能独立供电,30天阴雨可正常工作 现场控制器 测流控制器 普通RTU 1、测流控制器可计算流量,GPRS断网时作为雷达流量计使用。
2、可以U盘下载数据
3、可接入定点ADCP
4、彩色触摸屏操作简便
系统管理软件 按流量测验规范设计 按水雨情信息采集模
式设计 1、有高、中、低水三种测流模式,分别设置测流时段、加测变幅、测速历时、测速垂线。
2、远程配置测流控制器的大断面、测流垂线。
3、远程配置流速平均算法,适应不同断面水流条件。
数据分析软件 符合流量测验规范 无 1、数据合理性分析,提供图表分析工具
2、数据删除、修改,按规范要求建立资料档案
3、水位流量关系定线,自动拟合关系式,生成关系曲线验证表
4、生成实测流量成果表、测速记载及流量计算表、水文要素摘录表
5、导出实测成果表的整编数据、导出连时序整编数据
系统成熟度 成熟 不详 1、系统应用已多年,站点超过300个,覆盖17个省和淮委水文系统,
包括江西、湖南、重庆高温潮湿地区,青海玉树、内蒙呼伦贝尔高原、
寒冷地区。
2、通过水利部水文仪器质检中心检测。
刘庄闸水文站在线自动雷达波测流系统比测分析

关 测 流 系 统 人 工 控 制 临 时 增 加 测 流 次 数 ,查 看 、修
(
3)比测 方 法。在 相 同 时 间 段 内 均 采 用 流 速 面
(
4)比测数 据。 自 2022 年 6 月 至 2023 年 8 月
刘庄闸水文站在线自动雷达波测流系统比测分析———刘
豪
严芳芳
刘庄闸水文站在线自动雷达波测流系统比测分析
刘
豪
严芳芳
菏泽市水文中心,山东 菏泽 274000
摘要:在线自动雷达波流量监测系统中的流量系数是影响水文测验计 算 结 果 的 重 要 因 素 之 一,精 准、高
效地利用流量系数是提高洪水测验数据精度的关键,通过对刘庄闸水文站在线自动 雷 达 波 测 流 系 统 的 比 测
程 服 务 器 ,在 后 台 处 理 后 ,计 算 相 应 流 量 ,能 够 随
时 实 现 流 量 在 线 监 测 ,及 时 了 解 和 掌 握 河 道 水 情
变 化 ,大 大 降 低 水 文 测 验 人 员 的 劳 动 强 度 和 测 流
风险。
2.
3 比测情况
(
1)比测 断 面。刘 庄 闸 水 文 站 流 速 仪 测 流 断 面
比测流量范围(m3/s)
1.
74~65.
6
表 2 雷达波与流速仪测流水位—流量关系线比测数据
时间
断面水位
流速仪测流
雷达波测流
(m)
(m3/s)
(m3/s)
1.
85
1.
25
2022
7
14
41.
34
2022
雷达波无线测流系统软件V3.0使用说明书

遥控雷达波测流软件(版本号:V3.0)使用说明书2015-05-01如有改动,恕不事先通知。
目录1软件简介及安装 (1)1.1软件简介 (1)1.1.1 软件运行的基本条件 (1)1.1.2 新增功能 (2)1.1.3 有关数据精度 (2)1.2 软件安装 (3)1.3 附加数据库 (8)2.操作界面 (13)2.1 标题栏 (14)2.2 菜单栏 (15)2.3 测流显示区 (15)2.4 测流数据 (20)2.5 测流控制区 (21)2.6 起点距控制区 (24)2.7 状态栏 (25)3.菜单栏 (25)3.1 设备(D) (25)3.1.1 定位(L) (26)3.1.2 测速(T) (27)3.1.3 停止(N) (27)3.1.4 起点距重置 (27)3.1.5 返回停泊点 (28)3.1.6 运行速度设定 (28)3.1.7 雷达角度设置 (29)3.1.8 停泊点重置 (30)3.1.9 电机参数设置 (30)3.1.10 电池报警电压 (32)3.1.11 仪器匹配 (33)3.1.12 退出(Q) (34)3.2 通讯(C) (34)3.3 设置(S) (35)3.3.1 水位设置 (36)3.3.2 测次自动编号 (37)3.3.3 设置垂线 (37)3.3.4 删除垂线 (39)3.3.5 测速时间 (39)3.3.6 测流方向 (40)3.3.7 断面运行参数 (40)3.3.8 保存垂线设置 (43)3.3.9 读入垂线设置 (43)3.3.10 测速相关参数 (44)3.3.11 模式(M) (45)3.3.12 图示背景色 (45)3.3.13 图示边界—测流区间 (46)3.4 快速操作(F) (46)3.5 数据(T) (47)3.5.1 保存到数据库 (47)3.5.2 另存为 (48)3.5.3 导出EXCEL表格 (48)3.5.4 打印预览 (48)3.5.5 打印报表 (48)3.5.6 测流数据查询 (48)3.5.7 读入测次 (49)3.5.8 数据合并 (50)3.5.9 查看流速数据 (51)3.5.10 删除测流数据 (51)3.5.11 测站管理 (51)3.5.12 操作人员管理 (52)3.5.13 雷达流速仪管理 (53)3.5.14 断面管理 (54)3.6 帮助(H) (56)4测流 (57)4.1 概述 (57)4.1.1 雷达测速的基本原理 (57)4.1.2 雷达波测流流量计算 (58)4.1.3 遥控雷达波测流软件中水文相关术语 (58)4.2 测流一般步骤 (61)4.3 测流快速入门——第一份流量 (64)4.4 便捷操作 (71)4.4.1 同一断面测流 (71)4.4.2 多水道断面垂线设置 (71)4.4.3 重测与返测 (73)4.4.4 其它 (73)4.5 测流操作说明 (73)4.5.1 准备工作 (73)4.5.2 相关数据与水位记录 (74)4.5.3 数据输入与保存 (74)4.5.4 测流 (75)5注意事项 (75)附录一文本格式的测流数据 (76)附录二断面高程数据文件 (77)1 软件简介及安装1.1软件简介遥控雷达波测流软件(V3.0),英文缩写AFS(Auto Flow measurement System),图标为,是为雷达波无线测流系统开发的基于Windows操作系统的专用软件,与雷达波测流仪配合可实现水文全自动测流(一键测流)。
缆道测流操作规程

缆道测流操作规程缆道测流操作规程一、概述缆道测流是一种常用的测量水流速度和流量的方法,适用于河道、渠道等水流环境。
为确保测流工作的准确性和安全性,制定本操作规程。
二、设备准备1.测流设备:包括缆道测流仪、夹板、测流计等。
2.缆道:根据实际情况选择适合的缆道,并进行检查和修整。
3.安全工具:包括救生衣、救生圈等。
三、操作流程1.确定测流位置并编号,根据实际需要选择缆道的起止位置。
2.将缆道正确布置在测流位置,保证缆道与水流垂直,并使用夹板将缆道固定在岸边。
3.将测流仪安装在缆道上,确保测流仪与缆道垂直并固定好。
4.根据需要使用测流计,将测流计安装在合适的位置。
四、安全注意事项1.操作人员必须熟悉测流设备的使用方法和操作规程,并具备一定的水性和自救能力。
2.在安装缆道和测流仪时,必须确保牢固可靠,防止发生意外。
3.操作人员必须佩戴救生衣,并熟悉使用救生圈和其他救生设备。
4.操作人员必须保持警觉,注意观察水流状况,避免发生危险情况。
5.操作人员必须按照操作流程进行操作,严禁擅自改变测流位置和操作方法。
五、操作要点1.在选择测流位置时,应根据实际情况选择水流速度较稳定的区域,避免水流中出现大的涡流和湍流。
2.在安装缆道和测流仪时,应确保设备与水流垂直,避免夹板、缆道或测流仪的倾斜导致测量结果的误差。
3.在操作过程中,应特别注意水流的流向和速度的变化,并及时记录测量结果。
4.在完成测量后,应及时拆除缆道和测流仪,妥善保存设备,并对操作过程进行总结和记录。
六、操作常见问题及解决方法1.测流设备故障:应及时检查设备,修复或更换故障部件。
2.水流异常:如遇大流速、大涡流等情况,应及时撤离现场,寻找其他测流位置。
3.操作失误:如发现操作错误,应及时纠正,重新进行测量。
七、考核和培训1.对测流操作人员进行培训,使其熟悉操作规程和注意事项。
2.定期进行操作考核,确保操作人员的操作熟练并掌握相关知识。
八、附则1.本操作规程适用于缆道测流操作,如有特殊情况需要调整操作方法和注意事项,应经过相关部门批准并进行相应的培训。
缆道测流操作规程
缆道测流操作规程1. 背景与目的缆道测流是指利用缆道设备测量水流速度和流向的一种方法。
缆道测流被广泛应用于水文、水利等领域,用于研究河流、水道的水流情况,为工程设计和管理提供依据。
本文档旨在规范缆道测流操作流程,确保测量结果准确可靠。
2. 缆道测流设备准备在进行缆道测流之前,需要做好设备准备工作,具体包括: - 缆道:选择合适材质和尺寸的缆道,确保其具有足够的强度和耐用性。
- 测流仪器:选择适用于缆道测流的仪器,如流速仪、流量计等。
- 缆道固定设备:准备缆道固定设备,如固定钉、固定绳等,确保缆道牢固固定在测量位置上。
3. 缆道测流操作流程3.1. 确定测量位置在进行缆道测流之前,需要根据实际需要确定测量位置。
测量位置通常选择在河流或水道截面较宽、水流较平稳的地方,避免测量误差。
3.2. 缆道布设在测量位置上,按照设计要求,将缆道固定在水中,保证缆道与水流平行,并且缆道的测量段位于水中部分。
3.3. 测量仪器设置将所选测流仪器固定在缆道上,确保仪器与缆道的相对位置准确可靠。
根据仪器说明书,进行设置和校准,保证测量的准确性。
3.4. 测量操作1.启动测流仪器,确保仪器正常运行。
2.将测流仪器置于水中,通过缆道固定设备,将测量段浸入水中。
3.根据所选测流仪器的要求,进行时间和数据记录,确保数据采集的及时性和准确性。
4.测量一段时间后,停止测量。
将测流仪器取出水中,关闭仪器。
3.5. 测量结果处理1.将测得的数据导出至计算机,通过相应软件进行数据处理。
2.根据处理结果,计算得到水流速度和流向的平均值和变化规律。
3.将测量结果汇总,并按照要求整理成报告或数据表格。
4. 安全注意事项•在操作过程中,应注意人员的安全。
避免单人操作,至少需要两人配合进行。
•操作人员应穿戴合适的防护装备,如救生衣、手套等。
•在进行缆道布设和调整时,应注意防滑和防跌落。
•在拆除缆道时,应注意水流的影响,避免被水流冲击。
5. 总结缆道测流操作规程是确保测量结果准确可靠的重要保障。
移动在线缆道雷达波测流系统及其应用分析

移动在线缆道雷达波测流系统及其应用分析刘永超【摘要】介绍移动在线缆道雷达波测流系统的软硬件组成、工作模式及工作流程,通过分析该系统在东洋河水文站2018年施测小洪水过程中的使用情况,总结其在实际使用过程中存在的优缺点,分析该系统的最佳使用环境,充分发挥其无人值守、全自动、全天候、远程遥测监控等先进功能优势.【期刊名称】《河北水利》【年(卷),期】2018(000)011【总页数】2页(P32-33)【关键词】测流系统;缆道雷达波;工作流程【作者】刘永超【作者单位】张家口水文水资源勘测局【正文语种】中文流量测验是水文站最重要的观测项目之一。
河北省运用近代科学方法测流始于1912年,使用流速仪法或浮标法施测流量;20世纪70、80年代,水文缆道、缆车测流得到迅速发展;20世纪90年代随着电子测流技术的发展,引进了电波流速仪;2000年以后又陆续引进了声学多普勒剖面流速仪(AD⁃CP),用于特殊情况下应急测流和引调水测流,使河北省流量测验技术迈向了现代化。
随着现代通讯技术的快速发展,流量测验设施设备进入全天候、全自动遥测模式,一系列新型测验设备逐步应用到长期落后于现代科技水平的水文行业。
2018年东洋河水文站升级建设移动在线缆道雷达波测流系统,通过一个汛期的使用分析,该系统的推广使用将对新时期水文事业的发展具有重要意义。
1.移动在线缆道雷达波测流系统移动在线缆道雷达波测流系统是北京美科华仪科技有限公司在其便携式无线遥控雷达波缆道测流系统的基础上升级开发的传感器型非接触式测流系统。
其设计遵循无人值守、简单可靠、方便维护、功能完善的原则,采用雷达波施测多条垂线测速,同步采集相应水位,按部分面积法计算流量,实现流量自动监测。
该系统由硬件及Web远程管理软件两部分组成。
1.1 系统硬件组成介绍系统硬件是由简易单缆道、携带S3 SVR IV雷达测速传感器的自动行车、雷达水位计、蓄电池、太阳能供电及充电系统、以及由RTU(远程终端单元)和DTU (数据传输单元)等器件组成的测流控制器所构成的,另外还可扩加风速、风向、温度和雨量等传感器。
- 1、下载文档前请自行甄别文档内容的完整性,平台不提供额外的编辑、内容补充、找答案等附加服务。
- 2、"仅部分预览"的文档,不可在线预览部分如存在完整性等问题,可反馈申请退款(可完整预览的文档不适用该条件!)。
- 3、如文档侵犯您的权益,请联系客服反馈,我们会尽快为您处理(人工客服工作时间:9:00-18:30)。
缆道雷达波测流管理系统用户操作手册河南黄河水文科技有限公司一软件主要功能 (3)二软件主要特点 (4)三硬件 (4)3.1计算机及配件 (4)3.2硬件设备 (4)四支持软件 (5)五软件使用说明 (5)5.1软件的安装 (5)5.2软件配置 (9)5.3软件的操作说明 (10)5.3.1系统断面设置 (11)5.3.2系统设置 (12)5.3.3测流操作 (14)5.3.4数据查看 (18)一软件主要功能1)设置测流断面和测流垂线,并能自动绘制河道断面图2)设置左右岸边系数和浮标系数及水位流速系数及报表参数3)计算流速平均历时4)设置测量点测量时长,自动计算平均流速5)接收流速数据和输入水位数据,计算流量并生成流量计算表6)输入水尺读数自动计算水位,水位比降,糙率7)自动计算左水边岸边距与右水边岸边距8)报表以标准Excel格式显示,方便用户打印,传递9)往期报表查询及流速查询10)能够根据测量点自动定位浮标位置并显示当前测量点的起点距11)能提示并自动跳到下一个起点距大一点的测量点,也可以反方向自动跳到下一个起点距小一点的测量点12)具有数据库备份与恢复功能13)具有自动测量模式与人工测量模式14)自动从现有水位系统中提取水位,并计算出流量二软件主要特点1)软件美观大方,具有较强的扩展性2)开发需求来源于一线水文站,符合实际使用的操作习惯,具有人性化的操作界面3)报表小数位数,有效数字及各种数据符合国标要求,有效数字在计算时符合四舍六入五留双原则4)软件符合冗余度,时间复杂度与空间复杂度的算法原理,具有较高的质量三硬件3.1计算机及配件计算机:Intel及其兼容设备,主频500MHz以上;内存:64MB以上;硬盘空间:10G以上;串行通讯接口:一个;Microsoft Mouse 或与其兼容的鼠标器;显示卡:分辨率最低为1024*768,VGA显示器;A3激光打印机。
3.2硬件设备SOMMER RG-30非接触式雷达测流系统无线电台四支持软件操作系统名称及版本号:window2000,window xp,windows2003;数据库管理系统的名称及版本号:Microsoft SQL Server2000标准版;办公系统的名称及版本号:Microsoft Office2003中文版、Microsoft Excel2003中文版。
五软件使用说明5.1软件的安装软件文档结构图1)软件文档结构软件文档结构如下图:其中Settings.ini是系统配置文件,shuiwenserver.exe是最终可执行文件,该文件不需要安装,考过来就可以运行。
雷达流速仪_data.MDF与雷达流速仪_Log.LDF 两个数据库文件.2)在安装本软件之前需先安装Microsoft Windows 2000或xp 操作系统及Microsoft SQLServer 2000数据库管理系统;3)数据库配置打开sqlserver的企业管理器,如下图在数据库上,点右键----所有任务---附加数据库,如下图弹出如下图点击红色区域,弹出下图,找到文档结构图中的雷达流速仪_Data_MDF文件点击确定,如下图点击确定,如下图点击确定,如下图,会在数据库结构图中出现雷达流速仪的数据库,表明数据库配置成功.5.2软件配置打开settings.ini文件, 如下图com1: 串口的值改为接无线电台的串口,一般为com1 btl:波特率,一般为9600DataServer:数据库服务器名称为计算机名User:sqlserver的用户名saPassword:sqlserver的密码,修改为当初安装sqlserver的密码5.3软件的操作说明运行shuiwenserver.exe打开如下图主界面,左侧(红色框区)为菜单区域,和上方菜单同步,方便用户操作.右侧为主操作区域,右侧的上方(绿色框区)为导航区域,所有菜单打开的窗口均在右侧主工作区域里打开,并在导航区域显示当前窗体的名称,可以在导航上对该窗体进行关闭或选择为当前窗体操作。
也可以在导航的右侧进行关闭和选择为当前窗口操作主界面5.3.1系统断面设置系统在使用之前要录入水文站测流的断面,断面要从没有水的地方开始录1,先在左侧录入断面号,点添加,断面号不能重复. 如果添加成功,则可以在右侧垂线设置表格中录入垂线。
可以在中间插入,也可以在最后添加,录入完毕后保存即可,并自动绘制河道断面曲线.断面设置界面5.3.2系统设置在生成报表之前要录入系统参数,报表参数,如下图主要设置默认断面,由于断面可能会定期测量,所以要把最新的断面设成默认断面.雷达波测流系数,即表面流速系数,一般随水位的变化会微调。
左右岸边系数,可以根据水文规范进行录入:在斜坡岸边,水深均匀地变浅到零的岸边部分,岸边系数为0.67一0.75。
在不平整的陡岸边系数一般为0.8,在光滑的陡岸边系数一般为0.9,在死水与流水界处的死水边岸边系数一般为0.6,参看下表。
5.3.3测流操作测流操作主要包括人工测流与自动测流:人工测流:即人工移动行车进行多条垂线测量,要求数据发送周期短。
自动测流:不需人工干预,自动在一个固定点进行测流。
1、在操作之前首先了解硬件设备雷达流速仪工作过程:雷达流速仪刚上电后的15分钟内,处于等待命令状态,此时雷达流速仪不测量流速,而是等待用户的命令。
这时,通过电台(串口)给其发送一个“采集间隔命令”:格式为: #2(0000,1) ,雷达流速仪收到此命令后,会立即进入快速测量模式(不休眠),大约20秒发出一次数据。
括号中逗号右边的1表示1分钟测量间隔,可以是任何测量间隔,1分钟、2分钟、60分钟、120分钟等。
只要这个数值小于5,即(1~4),雷达流速仪就会进入快速测量模式。
此时用户可以打开测流软件,进入“人工模式”进行流量测量。
如果命令中的时间值大于或者等于5,则雷达流速仪会按照这个设置的时间间隔测量。
当采集的时间点到来时,比如01:30,会自动打开设备电源,开启测量,测量完后发出数据,发出数据之后的10秒钟之内,接收中心站发来的命令(设置采集间隔、调整时间、历史数据召测)。
10秒钟过去后,自动休眠,不再接收中心站的命令。
等待下一个测量时间点的到来。
自动休眠是为了降低雷达流速仪的能耗,这在长期无人值守的自动测量模式下很重要;在任何时候,只要中心站收到一条雷达流速仪发来的数据(测量数据),在10秒钟之内可以对其发送命令。
比如设置其采集间隔、设置雷达流速仪的内部时间、历史数据召测。
10秒钟后,雷达流速仪自动休眠,不再接收中心站发送的命令。
对于“采集间隔命令”,如果雷达流速仪收到的时间间隔小于5分钟,则会快速测量,大约20秒一个数据传上来。
如果这个时间间隔大于或者等于5分钟,则会按照设定的时间间隔测量。
如上所述2、人工测流时:1,软件一开机一般处于自动测流模式,发送数据间隔较长,而人工测流时需要快速测量,这时需要向雷达流速仪发送命令。
打开远程控制窗口如下图:在周期里输入1点“发送周期”按纽,这里程序等到接到数据时同时把命令发送给雷达流速仪,雷达流速仪接收成功后,会在下面的列表中显示”修改周期成功”字样说明成功,可以在测流主窗口中输入测量起始垂线,点开始按纽,进行人工测流。
2,软件自动在基本水尺里填上水位系统中的水位,也可以输入水位,以防水位系统有误时不能进行测流。
3,把雷达流速仪移动到第一个点的位置,点击开始按纽,进行第一个点的测流,软件自动记下开始时间,此时工作人员不需要进行其它操作,只需等待流速仪发来数据,流速仪是自动定时通过电台向软件发送数据.如果在测流时长里有多组数据,则流速取平均值.当软件定时器达到测流时长,则自动把所接到的多组流速填到正式报表的第一个点的位置,并提示工作人员是否进行下一个测量点测量.开始时串口自动打开接流速数据,测流时长到达时串口自动关闭进行数据处理,防止在移动铅鱼或绞车的过程中数据变化大太.直到进行下一点测量时串口自动打开,接新的数据4,把流速仪移动到下一个点的位置后,点是,则进行下一个点的测流,软件浮标自动移动到对应位置,也可以反向测量。
如果认为这一测量的有些问题(流速仪不稳,有晃动),需要重测,则可以点取消,由用户重新选择测点进行重新测量。
5,以后重复操作第4步,直到结束.6,当所有点测完后,点结束按纽,这时软件自动记录下本次测流结束时间和平均时间7,点生成报表可以生成国标的计算结果报表.报表如下图准确的流量成果取决于该断面的表面流速系统和岸边系数的确定。
需要积累一定资料进行率定,其中窗口下方有一个基线位置,里面选左或右,这里主要是用来判断岸边,当为左是那么起点距小的是左水边,当为右时起点距小的为右水边,同里左岸边系数与右岸边系数也是通过这来判断的.注意:人工测流时是把内部所有电全部打开,比较费电,所以在测完后要修改发送周期一般30分钟测一次,只有测的时候才打开电源,不测的时候休眠,以达到省电的目的。
3、自动测流:如果系统在人工测流时,可以通过以下两个步骤进行测流:1,修改周期,2,点击”自动模式”按纽5.3.4数据查看数据查看可以查询往期测量结果,如下图,选择要查询的起始时间,与终止时间。
可以在报表列表中列出往期报表,点击右键能查看具体的报表.报表查询界面5.3.5数据备份与还原及数据上报为了防止数据丢失,软件提供了数据备份与恢复功能,如下图备份时请选择备份路径,点数据备份即可还原时选择备份的文件点数据恢复即可选择上报的路径点上报,可以进行把站上的数据上报到局数据中心合并。