点云数据与STL格式转换 PPT
点云数据转换成实体模型通过基于点的立体像素化立体像素
点云数据转换成实体模型通过基于点的立体像素化立体像素PointCloudDataConversionintoSolidModelsviaPoint-BasedVoxelization1 2 3 4Tommy Hinks ; Hamish Carr ; Linh Truong-Hong ; and Debra F. Laefer, M.ASCEAbstract:Automatedconversionofpointclouddatafromlaserscanninginto formatsappropriateforstructuralengineeringholdsgreatprom- iseforexploitingincreasinglyavailableaeriallyandterrestriallybase dpixelizeddataforawiderangeofsurveying-relatedapplicationsfrom environmental modeling to disaster management. This paper introduces a point-based voxelization method to automatically transform pointclouddataintosolidmodelsforcomputationalmodeling.Thefundamentalvi abilityofthetechniqueisvisuallydemonstratedforbothaerial andterrestrialdata.Foraerialandterrestrialdata,thiswasachievedinl essthan30sfordatasetsupto650,000points.Inallcases,thesolid models converged without any user intervention when processed in a commercial ?nite-element method program. DOI: 10.1061/ASCESU.1943-5428.0000097 2013 American Society of Civil Engineers.CE Database subject headings: Data processing; Surveys; Finite element method; Information management.Author keywords: Terrestrial; Aerial; Laser scanning; LiDAR; Voxelization; Computational modeling; Solid models; Finite element.Introductionexist.Thispaperlaysthegroundworkforkeyadvancementinsucha pipeline. The procedure proposed herein to reconstruct buildingLaser scanning has achieved great prominence within the civil en- facadesfrompointcloud,whichisafundamentalstepforgenerating gineering community in recent years for topics as divergent as city-scale computational models.coastline monitoring Olsen et al. 2009, 2011, airport layout op- timization Parrish and Nowak 2009, and ground-displacementidenti?cation for water-system risk assessment Stewart et al.FacadeReconstruction2009. Additionally, there has been strong motivation to obtainfurther functionality from laser scanning and other remote-sensing Inrecentyears,developmentsinlaser-scanningtechnologyand?ight-data, including three-dimensional 3D volume estimation forpath planning have allowed aerial laser scanning ALS to acquire mining Mukherji 2012, road documentation Dong et al. 2007,pointclouddataquicklyandaccuratelyatacityscale,therebyhaving structuralidenti?cationShanandLee2005;Zhangetal.2012,and thepotentialforreconstructing3Dbuildingsurfacesacrossanentire emergency planning Laefer and Pradhan 2006. Furthermore,city in nearly real time. A number of approaches based on semi- computational responses of city-scale building groups are increas- automaticLangandForstner1996andautomaticHenricssonetal. inglyindemandforheightenedurbanization,disastermanagement,1996techniqueshavebeenproposedtoreconstructbuildingmodelsand microclimate modeling, but input data are typically too ex- from such data sets, but automatically extracting highly detailed, pensive as a result of the need for manual surveying. Additionally, accurate,andcomplexbuildingsstillremainsachallengeHaalaandcurrent software tools for transforming remote-sensing data into Kada 2010. The semiautomatic procedures need human operator computationalmodelshaveoneormoreofthefollowingproblems: intelligence.TheautomaticvisualmodelingofurbanareasfromALS alowdegreeofreliability,aninabilitytocapturepotentiallycritical data tends to extract sample points for an individual building by details,and/oraneedforahighdegreeofhumaninteraction.Todate, applying segmentation techniques and then reconstructing eacha seamless, automated, and robust transformation pipeline frombuilding individually. In such cases, vertical facade surfaces are notremote-sensing data into city-scale computational models does not portrayed in detail, and outlines may be of relatively low accuracy unless ground planes are integrated, which requires either a priori1 informationormanualintervention.Unfortunately,theeffectivenessDoctoralRecipient,SchoolofComputerScienceandInformatics,Univ.of engineering modeling often depends largely on the geometricCollege Dublin, Bel?eld, Dublin 4, Ireland. E-mail: ******************2accuracy and details of the building models?thus the currentSeniorLecturer,SchoolofComputing,FacultyofEngineering,Univ.ofmismatch.Leeds, Leeds LS2 9JT, U.K. E-mail: h.carr@//0>.3Post-doctoral Researcher, Urban Modelling Group, School of Civil, Presently, commercial products are generally semiautomatic StructuralandEnvironmentalEngineering,Univ.CollegeDublin,Bel?eld, Laefer et al. 2011, whereas in the computer graphics and photo- Dublin 4, Ireland. E-mail: linh.truonghong@gmailgrammetry communities, researchers have focused on automated4AssociateProfessor,LeadPI,UrbanModellingGroup,SchoolofCivil,surfacereconstructionfromdenseandregularsamplepointsHoppeStructuralandEnvironmentalEngineering,Univ.CollegeDublin,Bel?eld, 1994; Kazhdan et al. 2006. Unfortunately, ALS data are oftenDublin 4, Ireland corresponding author. E-mail: ******************* sparse and irregular, and may contain major occlusions on vertical Note.ThismanuscriptwassubmittedonNovember16,2011; approvedsurfaces owing to street- and self-shadowing Hinks et al. 2009.on September 10, 2012; published online on September 13, 2012. Discus- Dedicated urban modeling surface-reconstruction approachession period open until October 1, 2013; separate discussions must be generallyusethemajorbuildingplanesChenandChen2007andsubmitted for individual papers. This paper is part of the Journal ofcan be described as either model-driven or data-driven. Model-Surveying Engineering, Vol. 139, No. 2, May 1, 2013ASCE, ISSN0733-9453/2013/2-72?83/$25.00. driven techniques use a ?xed set of geometric primitives that are72 / JOURNALOFSURVEYINGENGINEERING?ASCE / MAY2013J. Surv. Eng. 2013.139:72-83.Downloaded from by East China Inst of Tech on 04/13/13.Copyright ASCE. For personal use only; all rights reserved.Fig. 1. Work?ow of the proposed approach: *Collection and preparation of LiDAR data involve multiple steps outside the scope of this paper’s scienti?ccontribution;thesegenerallyincludeplanning,collection,re gistration,and?ltering;seeTruong-Hong2011andHinks2011forfurther detailsttedtothepointdata.Suchtechniquescanbeeffectivewhenadataset is sparse because the ?tting of geometric primitives does not require complete data. In contrast, data-driven techniques derive surfaces directly from the point data and are capable of modeling arbitrarilyshapedbuildings.Generally,data-drivenapproachesaremore?exiblethanmodel-drivenapproaches,butareoftensensitiveto noise in the input data.For strictly visual representation, model-driven approachescanbeeffective.Forexample,Haalaetal.1998 proposed four dif-ferent primitives and their combinations to automatically derive 3D building geometry of houses from ALS and existing ground planes.Similarly, Maas and Vosselman 1999 introduced an invariantmoment-basedalgorithmfortheparametersofastandardgabled-roofhouse type that allowed for modeling asymmetric elements such as dormers. However, these efforts assume homogeneous point dis-Fig. 2. Octree representationtributions, which is unrealistic. You et al. 2003 also adapted a set of geometric primitives and ?tting strategies to model complex buildings with irregular shapes, but the approach required user interventionandgeneratedonlylimitedwalldetails.Huetal.2004used a combination of linear and nonlinear ?tting primitives to SolidModelingreconstructacomplexbuilding,inwhichaerialimagerywasusedtore?ne the models. To generate building models directly from point cloud data forIncontrast,manydata-driventechniquesoperatingonALSdata engineering simulations [e.g., FEM], there are three dominant reconstruct roof shapes directly from sample points of roof planes. methods:1constructivesolidgeometryCSG,whereobjectsareSubsequently, the remainder of the building is simply extruded represented using Boolean combinations of simpler objects; 2 to the ground level from the roof-shape outlines. Vosselman and boundary representations B-reps, where object surfaces are rep- Dijkman2001usedaHoughtransformforextractionofplanefaces resentedeitherexplicitly orimplicitly;and3spatialsubdivision roofplanesfromtheALSdata,andthen3Dbuildingmodelswere representations,wherean objectdomain is decomposed intocells reconstructed by combining ground planes and the detected roof withsimple topologic and geometric structure, such as regular planes.Hofmannetal.2003introducedamethodtoextractplanar gridsandoctreesGoldman2009;HoffmannandRossignac1996;roof faces by analyzing triangle mesh slopes and orientations from there are many extensive treatises available for in-depth consid-a triangular irregular network structure generated from ALS data. eration of this topic B?hm et al. 1984; Rossignac and Requicha More recently, Dorninger and Pfeifer 2008 used an a-shape ap- 1984, 1999.proach to determine a roof outline from point clouds of the roof Generating solid models automatically from point cloud data projectedontoahorizontalplane.Also,ZhouandNeumann2010 is particularly important because the cost of manually creating created impressive buildings for a large urban area by using a vol- solid models of existing objects is far greater than the associated umetric modeling approach in which roof planes were determined hardware,software,andtrainingcosts.Assuch,spatialsubdivision based on a normal vector obtained from analysis of grid cells be- representations are used extensively for creating solid models of longingtorooflayers.However,thesemodelsarealsoextrudedand buildings in which regular grids or octrees are employed to de- lack vertical-wall details. compose an entire object intononoverlapping 3D regions, com-Therefore, this paper presents an automated approach to con- monly referred to as voxels. Voxels are usually connected andverting point clouds of individual buildings into solid models for described a simple topologic and geometric structure. In grids, structural analysis by means of computational analysis in which avolumeissubdividedintosmallerregionsbyappropriateplanes thepointcloudthatweresemiautomaticallysegmentedfromLight parallel to the coordinate system axes,typically using aCartesian Detection and Ranging LiDAR data become the input Fig. 1. coordinate system. An initial voxel bounding all point data re-Notably, this proposed approach focuses on reconstructing solid cursively divides a volume into eight subvoxels, organized in modelsbyusingvoxelgridswiththecriticalparameteraseitherthe a hierarchical structure Samet 1989. Voxels may be labeled voxel size or the number of voxel grids; for more details on col- white,black,orgraybasedontheirpositionsFig.2.Blackvoxels lecting ALS and terrestrial laser scanning TLS data and on are completely inside the solid, whereas white voxels are com- segmenting point clouds, see Truong-Hong 2011andHinks pletelyoutside.Voxelswithbothblackandwhitechildrenaregray 2011. Hoffmann and Rossignac 1996.JOURNALOFSURVEYINGENGINEERING?ASCE / MAY2013 / 73J. Surv. Eng. 2013.139:72-83.Downloaded from by East China Inst of Tech on 04/13/13. Copyright ASCE. For personal use only; all rights reserved.Fig.3.Voxelgridspanningavolumeina3Dspaceboundedbyx ,x ,y ,y ,andz ,z ,whe reDx,Dy,andDzarevoxelsizes andmin min minN , N , and N are the number of voxels in each directionx y zIn an application of spatial subdivision for surface recon-struction,CurlessandLevoy1996presentedavolumetricmethodforintegratingrangeimagestoreconstruc tanobject’ssurfacebasedon acumulative weighted signed-distancefunction. Unfortunately,the approach is not suited for arbitrary objects. In related work, GuarnieriandPontin2005builtatriangulatedmeshofanobject’ssurfacebycombiningaconsensussurface[asproposedbyWheeleret al. 1998], an octree representation, and the marching-cubesalgorithm Lorensen and Cline 1987. This multifaceted algorithmFig. 4. Point-based voxelization avoids surface reconstruction and canreducetheeffectofthenoiseowingtosurfacesampling,sensoroperates directly on point datameasurements,andregistrationerrors.However,foroptimalresults,themethodrequiresmodi?cationofparametersthatdependheavilyon input-data characteristics such as the voxel size, the threshold value for the angle, and the distance between two consecutive neighbor-range viewpoints. z 2zminN? 1 ?3?zDzThevoxelhaseightlatticeverticesassociatedwithsixrectangular VoxelizationfacesFig.3.Eachinteriorvoxelhas26neighboringvoxels,witheight sharing a vertex,12 sharing an edge,and six sharing a face. Critical to octree/quadree representations for further processing is Conversely,anexteriororinteriorvoxelonahole’sboundaryoften voxelization. This term describes the conversion of any type of has only 17 neighboring voxels four sharing a vertex, eight geometric or volumetric object such as a curve, surface, solid, or sharinganedge,and?vesharingaface.Moreover,mostexisting computedtomographicdataintovolumetricdatastoredina3Darray voxelization techniques operate on surface representations ofof voxels Karabassi et al. 1999. Initially, a voxel grid divides objects, where a signi?cant part of the problem is to identifya bounded 3D region into a set of cells, which are referred to as throughwhichvoxelsthesurfacespass.Suchmethodsarereferredvoxels. The division is typically conducted in the axial directions to as surface-based voxelization Cohen-Or and Kaufman 1995of a Cartesian coordinate system. Before voxelization, three pairs [Fig.4a?c].Incontrast,thepoint-basedvoxelizationinthispaper ofcoordinatevalues??x , x , ?y , y , and ?z , z ? aremin min minoperates directly on the point data and does not require a derived createdalongthethreeaxesX, Y, and Zde?ningaglobalsystemsurface [Fig. 4a?c]. Point-based voxelization is conceptually Fig. 3. The basic idea of a voxelization algorithm is to examine much simpler than surface-based voxelization algorithms, and whethervoxelsbelongtotheobjectofinterestandtoassignavalue whereas the mechanisms are well known, they have not beenof 1 or 0,respectively Karabassi et al. 1999; a further description applied to generating solid modeling of buildings from LiDARof voxel grids is available in Cohen and Kaufman 1990.data.An initial voxel bounding all point cloud data in 3D Euclidean3Asmentionedearlier,eachvoxelisclassi?edasactiveorinactivespaceR is subdivided into subset voxels by grids along the x-, y-, corresponding to binary values based on the sample points within andz-coordinatesinaCartesiancoordinatesystem.Eachvoxelinthethat voxel [Eq. 4]subset is represented by an index v?i, j, k?, where i2?0; N 21 , xj2?0; N 21 , and k2?0; N 21 Fig. 3. With the dimensionsy zactive ifn$TnofindividualvoxelsDx, Dy, Dz,anumberofvoxelsN , N , Nx y zf n?4?valong each direction are given in Eqs. 1?3 inactive ifn,Tnwheretheargumentn5numberofpointsmapping to avoxel,andx 2xmin T 5user-speci?edthresholdvalue.Typically,T 51,whichmeansn nN? 1 ?1?xDxthat voxels containing at least one mapping point are classi?edasactiveandallothersasinactive.Moresophisticateddensity-basedy 2yminclassi?cation functions can be designed. An example is shown inN? 1 ?2?yDyFig. 5.74 / JOURNALOFSURVEYINGENGINEERING?ASCE / MAY2013J. Surv. Eng. 2013.139:72-83.Downloaded from by East China Inst of Tech on 04/13/13. Copyright ASCE. For personal use only; all rights reserved.Fig. 5. Voxelization model of front building of Trinity College, Dublin, Ireland, created by a voxel grid: a input data set of 245,000 ALS points;bvoxelizationmodelwithvoxelsizeDx5Dy5Dz50:25m;cvoxelclassi?cationwiththethresholdT51andvoxelizationmodelwithaboutn5,000 active voxels n is the largest number of points mapping to asingle voxelFig. 6. Solid model componentsProposedConversionofVoxelizedModelsintoSolidModelsTo reconstruct vertical surfaces of building models, a voxel grid is used to divide data points in a bounded 3D region into smallervoxels. Important facade features such as windows and doors are subsequently detected basedon a voxel’s characteristics, where an inactive voxel represents the inside of an opening. Consequently, building models are converted into an appropriate format for com- putational processing.Anobjectisde?nedbyitssurfaceboundary,whichthenmustbeFig. 7. Face orientation as dictated by the right-hand ruleconvertedintoanappropriatesolidrepresentationcompatiblewithcommercialcomputationalpackages.Althoughmanyschemesareavailable,B-repsarehereinadoptedbecauseoftheircompatibilitywith commercial structural-analysis software e.g., ANSYS soft- Keypointsarerepresentedbya3Dcoordinateofasingularpoint.ware Laefer et al. 2011. The proposed method de?nes both the An edge is de?ned as the connection between exactly two keygeometry and topology of an object by a set of nonoverlappingpoints;forexample,theedgee 5fP, Pgistheedgewithstartingij i jandendingpointP.Notably,edgeshaveanorientation;asfaces approximate the boundary of the solid model. This section pointPi jsuch, e 52eThus, the edges e and e would be ?ipped. EdgepresentsabriefdescriptionoftheB-repschemeimplementedintheij ji ij jiproposed approach; for more details, see Goldman 2009. Ge- ?ipping is important when de?ning an orientable face for dis-ometry is de?ned by key singular points, with each point rep- tinguishing the inside from the outside.resenting a speci?c location in space. Topology is de?ned by Similarly, faces represent surfaces of a solid model that areconnections between key points. When used together, they can connections between edges. The faces are further connected de?neasolidmodelFig.6.DatastructuresfordescribingB-reps to form volumes. A face is de?ned as a list of edgesoften capture the incidence relations between a face and its f5fe ,e ,.,e g that involve closed paths. A face01 12 ?n22??n21?bounding edges and an edge and its bounding vertices, whichconsistingofthreekeypointsisatriangle,whereasqu。
Polyworks的主要模组和功能介ppt课件
面,线,点 基准的权重
点云上的特征 3D档上的特征
33
对比(Compare):
对齐完后,将点云和标准档进行对比,生成颜色比对报告。
对比的工具条
最大距离 最大角度
对比的方向,一般 选择最近。
累计比较结果,仅用于 检视模块。
34
色谱栏的设置:
由此进入色谱栏设置
转换颜色:此 处有三个选项, 自动范围,用 户自定义,使 用特征公差, 一般根据自己 的需要进行选 择。
纵向 横向
進入屬性設置后,可以將所版 面設置成橫向的或者縱向的。
47
48
49
50
51
12
縮減公差
光順水平,有高,中,低三種 網格最大距離 面取樣的距離 標準偏差
光順
13
因目前我们的KEY文件不支持点云的编辑模块,所以当勾选计算完后再编 辑模块打开点云时会弹出找不到KEY文件,这时候直接点”OK”按钮即可, 软体即回到主界面。
将计算后的点云选中, 点右键,可将计算出 来的点云汇出来!
最佳拟合
自动初始猜测。 最大距离 数据采集的比例
次数 收敛值
当自动初始猜测不勾选时,可以限制几个方向的 自由度,如下页图所示:
31
最佳拟合对齐(Best Fit):
设置几个方向的自 由度。
32
两个面,两条轴,两个中心点:
将所需要做为基准的面,线,轴都创建出来后,就可以以之为基准,来 做基准对齐,其实就是3-2-1法的对齐。
1.Polyworks软体界面介绍; 2. 计算STL点云的实例介绍对齐和计算模块; 3.CAV检测模块; 4.尺寸测量及形位公差评价;
3
4
双击
桌面图标进入Polyworks软体界面,如下图所示: 点击相应的图标进入相应的功能模块
点云数据文件常用格式

点云数据⽂件常⽤格式⽂件类型汇总OFF - Object File FormatPLY - Polygon File Format also known as the Stanford Triangle FormatPTS - Laser scan data formatPTX - ASCII based interchange format for point cloud dataXYZ - Based on Cartesian coordinatesLAS/LAZ - The most common format for exchanging points clouds⽂件格式介绍1. OFF - Object File FormatOFF numVertices numFaces numEdgesx y zx y z... numVertices like aboveNVertices v1 v2 v3 ... vNMVertices v1 v2 v3 ... vM... numFaces like above⽴⽅体使⽤ OFF 格式描述的例⼦:OFF8 6 0-0.500000 -0.500000 0.5000000.500000 -0.500000 0.500000-0.500000 0.500000 0.5000000.500000 0.500000 0.500000-0.500000 0.500000 -0.5000000.500000 0.500000 -0.500000-0.500000 -0.500000 -0.5000000.500000 -0.500000 -0.5000004 0 1 3 24 2 35 44 45 7 64 6 7 1 04 1 75 34 6 0 2 42. PLY - Polygon File Format also known as the Stanford Triangle Formatplyformat ascii 1.0 { ascii/binary, format version number }comment made by Greg Turk { comments keyword specified, like all lines }comment this file is a cubeelement vertex 8 { define "vertex" element, 8 of them in file }property float x { vertex contains float "x" coordinate }property float y { y coordinate is also a vertex property }property float z { z coordinate, too }element face 6 { there are 6 "face" elements in the file }property list uchar int vertex_index { "vertex_indices" is a list of ints }end_header { delimits the end of the header }0 0 0 { start of vertex list }0 0 10 1 10 1 01 0 01 0 11 1 11 1 04 0 1 2 3 { start of face list }4 7 65 44 0 45 14 156 24 2 6 7 34 3 7 4 03. PTS - Laser scan data format253730194-0.41025 -2.0806 8.00981 55 52 44 65-0.63016 -1.84527 6.59447 228 228 230 225-0.4766 -2.14446 7.91288 60 56 54 68-0.52017 -1.51698 7.91458 60 58 50 71: : :: : :: : :PTS ⽂件⽆法⽤ MeshLab 直接打开,⽽ PLY ⽂件可以,所以可以⼿动将 PTS ⽂件转换为 PLY ⽂件,便可以在 MeshLab 中查看。
点云编码标准
点云编码标准
点云编码标准是指在三维计算机视觉领域中,对点云数据进行编码的一种规范化标准。
点云数据是由大量从物体表面采集的三维坐标点组成的,这种数据结构在计算机视觉、机器人视觉、虚拟现实、游戏等领域有着广泛的应用。
点云编码标准主要包括点云数据的格式和压缩算法两个方面。
在点云数据格式方面,主要有PLY、OBJ、STL、PCD等格式,每种格式都有其特点和应用场景。
在点云压缩算法方面,主要有基于无损压缩的算法和基于有损压缩的算法两种,其中基于无损压缩的算法包括LASzip、Entwine Point Tile等,而基于有损压缩的算法包括简化算法、网格化算法等。
点云编码标准的制定可以使得不同系统之间的点云数据传输更
加便捷,同时也可以提高点云数据的存储效率和处理速度。
随着智能制造、智能交通等领域的不断发展,点云数据的应用将会越来越广泛,点云编码标准也将会不断完善和更新。
- 1 -。
solidworks点云生成曲面步骤

solidworks点云生成曲面步骤SolidWorks点云生成曲面步骤SolidWorks是一款常用的三维CAD软件,可以用于建模、装配和绘图等。
在使用SolidWorks进行建模时,我们经常需要将实际物体的点云数据转化为CAD模型。
本文将介绍如何使用SolidWorks生成曲面,以便更加准确地模拟实际物体。
一、什么是点云?点云是指由大量离散的点组成的三维空间数据集合。
在实际应用中,我们可以通过激光扫描、摄像头拍摄等方式获取物体表面上的点云数据,并将其转化为CAD模型。
二、如何导入点云数据?1.打开SolidWorks软件,在顶部菜单栏中选择“文件”-“打开”。
2.在弹出的对话框中选择“所有文件”类型,找到并选择要导入的点云数据文件。
3.点击“打开”按钮即可导入点云数据。
三、如何生成曲面?1.选择“曲面”工具栏,在下拉菜单中选择“曲面网格”。
2.在弹出的对话框中,选择导入的点云数据文件,并设置网格密度和最大边界长度等参数。
3.点击“确定”按钮开始生成曲面网格。
这个过程可能需要一些时间,请耐心等待。
4.生成曲面网格后,我们可以对曲面进行调整和优化。
例如,可以使用“修复曲面”工具来消除网格中的不规则形状和孔洞。
5.调整完毕后,我们可以将曲面导出为SolidWorks支持的格式,例如STL或IGES等。
四、如何优化曲面?1.选择“曲面”工具栏,在下拉菜单中选择“修复曲面”。
2.在弹出的对话框中,选择要修复的曲面,并设置修复参数。
例如,可以设置最大距离和最大角度等参数来控制修复程度。
3.点击“确定”按钮开始修复曲面。
这个过程可能需要一些时间,请耐心等待。
4.修复完成后,我们可以使用“检查几何体”工具来检查曲面的质量。
如果发现问题,可以再次使用“修复曲面”工具进行调整。
五、如何导出CAD模型?1.选择“文件”-“另存为”,在弹出的对话框中选择要导出的格式(例如STL或IGES)。
2.设置导出参数,并点击“确定”按钮开始导出CAD模型。
激光点云数据格式标准

激光点云数据格式标准
激光点云数据格式标准是一种将三维空间中的点以坐标形式进行存储的文件格式,用于激光雷达、三维扫描仪等设备采集的数据。
激光点云数据格式标准有多种,其中常见的有ASCII格式和二进制格式。
ASCII格式以文本形式表示点云数据,每个点以一行为单位,包括点的坐标和可能的属性信息,如颜色、反射率等。
这种格式的优点是易于阅读和编辑,但缺点是文件较大,存储和传输效率较低。
二进制格式则将点云数据以二进制形式进行存储,通常使用压缩算法来减小文件大小。
二进制格式的优点是存储和传输效率高,但缺点是不易于阅读和编辑。
在实际应用中,激光点云数据通常会根据不同的应用场景和数据特点选择不同的格式标准。
例如,对于大规模的点云数据,可能会选择使用分块的方式进行存储和传输,以提高处理效率。
同时,随着技术的不断发展,新的激光点云数据格式标准也在不断涌现,如Open3D等开源库提供了多种格式转
换和处理的工具,为激光点云数据的处理和应用提供了更多的选择和便利。
总的来说,激光点云数据格式标准的发展是随着激光雷达、三维扫描仪等设备的普及和技术的不断进步而不断完善的。
未来,随着人工智能、机器学习等技术的进一步发展,激光点云数据格式标准的应用场景将更加广泛和深入,为智能感知、自动驾驶、机器人等领域的发展提供更加有力的技术支持。
《点云配准方法》课件

深度学习算法能够自动提取点云特征,减少人工干预,提高配准精度和效率。
未来研究方向包括改进神经网络结构、优化训练算法以及提高网络泛化能力等。
高精度与实时性需求的挑战与解决方案
随着点云数据量的增加,高精度和实时性的需求对点云配准提出了更高 的要求。
点云配准的背景和重要性
背景
随着三维扫描技术的发展,点云数据在许多领域得到广泛应用,如逆向工程、 机器人导航、文物修复等。由于不同来源的点云数据存在差异,需要进行配准 以实现数据的整合和利用。
重要性
点云配准是实现多传感器融合、提高测量精度、扩展应用范围的关键技术之一 。
点云配准的基本流程
特征提取
相似性度量
采用高性能计算技术和优化算法,提高点云配准速度和精度,以满足实 时性和高精度需求。
未来研究重点包括开发高效的数据结构和算法,以及利用并行计算和 GPU加速等技术提高计算性能。
多模态点云数据的配准问题
多模态点云数据包括激光雷达点云、 RGB-D相机点云等,其配准问题具有
挑战性。
解决多模态点云数据配准问题需要研究 不同模态点云之间的特征提取和匹配方
医学影像处理
点云配准在医学影像处理中也有着重 要的应用价值。通过对医学影像数据 进行配准,能够实现更加精确的疾病 诊断和治疗方案制定。
点云配准在医学影像处理中主要用于 图像融合、病灶检测和手术导航等方 面,为医学影像分析提供更加准确和 可靠的技术手段。
05
点云配准的未来展望
深度学习在点云配准中的应用
基于刚性变换的点云配准
刚性变换:将源点云数据与目 标点云数据在空间中进行对齐 ,保持点云之间的相对位置和 方向不变。
点云存储文件格式简介

点云存储文件格式简介在众多存储点云的文件格式中,有些格式是为点云数据“量身打造”的,也有一些文件格式(如计算机图形学和计算机和学领域的3D 模型或通讯数据文件)具备表示和存储点云的能力,应用于点云信息的存储。
本文将这些文件格式一并视为“点云存储文件格式”。
从这个意义上说,除了包含基本的点的笛卡尔坐标信息之外,有些文件格式还可能包含点之间的连接关系(拓扑结构),以及法线等其他信息。
一、常见点云存储文件格式简介每个人都可以定义自己的数据存储格式,也因此产生了不计其数点云存储文件格式。
一些文件格式致力于标准化与通用性,而今被多个相关软件或软件库所支持,也被大多数业内人士所认同和使用。
下面按字母排列顺序简单介绍几种最常见的点云格式。
*.lasLiDAR数据的工业标准格式,旨在提供一种开放的格式标准,允许不同的硬件和软件提供商输出可互操作的统一格式。
是一种二进制文件格式。
LAS文件包含以下信息:l C--class(所属类)l F一flight(航线号)l T一time(GPS时间)l I一intensity(回波强度)l R一return(第几次回波)l N一number of return(回波次数)l A一scan angle(扫描角)l RGB一red green blue(RGB颜色值)示例:可以看出,las文件格式除了基本的三维坐标之外,保留了原始扫描的数据采集信息。
LAS格式定义中用到的数据类型遵循1999年ANSI(AmericanNationalStandardsInstitute,美国国家标准化协会)C语言标准。
参考资料:https:///chenbokai/p/6010143.html*.obj是由Alias|Wavefront Techonologies公司从几何学上定义的3D 模型文件格式,是一种文本文件。
通常用以“#”开头的注释行作为文件头。
数据部分每一行的开头关键字代表该行数据所表示的几何和模型元素,以空格做数据分隔符。
las点云转换成国家标准格式dem(nsdtf格式)

需要用到两个软件:1. globalmapper(网上都有,有非付费版的),主要是用它来进行插得到标准格网间距的DEM和转换成中间格式ascii2. MapMatrix操作:原始数据必须是.las点云格式1. 打开globalmapper,直接将待转换的.las数据拖入到globalmapper界面中来,会弹出如下对话框:(主要是说没有投影信息,这个可以任意给个投影,其实对它来说没啥用)点击确定,然后随便给个高斯投影就行再点击确定继续确定进来后就是这样的:2. 以上进来的就是离散点模式(不规则三角网模式)需要将他们变成规则格网操作:菜单中的“工具”------“控制中心”,弹出对话框中,选中对应的las文件,右键用3D数据创建格网点确定,即开始转换这种转换纯粹是密集点云抽稀和插,保证每条边的边线长度基本上是上图中“手动指定使用的格网间距”(本例 2米)转换完了后3. 导出中间格式在新转换出的图层上(上图被选中就是)右键,选中“输出--输出选中的图层(s)到新文件”选择输出格式“Arc ASCII GRID"点击确定,弹出对话框意思是用当前投影信息,如果要改变投影信息,则用工具菜单中的配置来设置,我们不需要改变投影,继续点击确定即可,弹出如下对话框在一般设置中设置x和y 方向格网间距即可,点确定,给定输出路径和名称,程序即会输出标准格网间距的 ascii码的高程模型。
globalmapper的使命完成了,可以关掉。
4. 格式转换在这一步要用到mapmatrix打开MapMatrix,点击菜单“工具”中的“DEM转换”工具弹出对话框中点击左上角的打开DEM对话框如上图所示,弹出对话框中,将默认的文件类型改成所有文件(*.*),然后选中刚才导出的ascii文件需要修改格网起算点坐标值如上图。
可以留意一下默认的输出路径(路径可改的,在工具栏上修改)。
点击工具栏上的“执行”按钮(类似于人在跑的那个按钮),即可将ascii码转换成我们国家标准DEM格式,如果需要其他格式的,也可以用此工具转换。
三维点云的重建与匹配ppt课件
4
实验结果
Vestibulum ante ipsum primis in faucibus orci luctus et ultrices Vestibulum ante ipsum primis in faucibus orci luctus et ultrices
3 相关背景:
随着数字城市不断向前发展,大规模三维数据采集技术迅速提 升,可以通过激光原理、摄影测量原理等方式产生多种Ve点stibu云lum a数nte i据psum。 在实际获取三维点云时考虑到测量设备、测量范围的限panri制tmeiispisn以uVmespt及ribimulius被min 测 物体外形的复杂性等,每次扫描只能获取当前视点下的faanu点tceibipus云suomrcpi,erismtibis其uilnum坐 标是相对于当前的仪器坐标系而言的,要得到被测物体foaruc完ci ibu整s orca的ucib三us 维 模型,需要从不同的视点对被测物体进行扫描,并将不同视点获取 的三维点云进行配准。
14 ICP算法配准结果
15 ICP算法配准结果
16 ICP算法配准结果
17 ICP算法配准结果
THANK YOU
11 ICP算法原理
ICP算法的基本原理是:分别在带匹配的目标点云P和源点云Q中, 按照一定的约束条件,找到最邻近点(pi,qi),然后计算出最优 匹配参数R和t,使得误差函数最小。误差函数为E(R,t)为:
其中n为最邻近点对的个数,pi为目标点云 P 中的一点,qi 为源 点云 Q 中与pi 对应的最近点,R 为旋转矩阵,t 为平移向量。
3
点云配准
Vestibulum ante ipsum primis in faucibus orci luctus et ultrices Vestibulum ante ipsum primis in faucibus orci luctus et ultrices
逆向工程基础教程课件
逆向工程基础教程
16
2-1-3 Imageware 基本操作
一、鼠标的应用
1、鼠标左键 鼠标左键用于选择几何体、拖动对象以及选择菜单和
对话框中的命令和按钮。常用功能如下: (1)选取浮动工具条上的命令图标。 (2)在视图区中选取几何对象。 (3)在对话框中单击几何对象的名称,会选中该对象。 (4)按住shift+鼠标左键,拖动鼠标可以对视图进行旋 转。
4、多边形造型模块
提供完美的三角形数据处理,提供处理任何大小的多边
形模型的能力,能够处理以下的数据源和数据类型:STL
数据、有限元数据和VRML数据。
逆向工eware 功能模块
5、检验模块 可检测复杂数字形状与物理以及物理样机的三维模型。提
供大量工具以输入CAD数据及点云数据并将这些数据进行对 其用于比较零件与扫描数据之间定性及数量上的差别。 6、评估模块
逆向工程基础教程
17
2-1-3 Imageware 基本操作
一、鼠标的应用
2、鼠标中键 鼠标中键一般用于执行命令。常用功能如下:
(1)在对话框中,单击鼠标中键,相当于单击对话框中 的【Apply】。 (2)按住shift+鼠标中键,上下拖动鼠标可以对视图进 行缩放。左右拖动鼠标可以对视图进行旋转,旋转轴垂 直于视图。
显示所有工具条
逆向工程基础教程
12
2-1-1 Imageware 用户界面
滑动条
滑动条显示/隐藏切换按钮
逆向工程基础教程
13
2-1-1 Imageware 用户界面
模式条
技能大赛培训子库 2.9.13 电吹风数据处理(知识页)

目录项目一、电吹风反求设计 (1)任务1 三维数据采集前处理 (2)1.1三维数据采集前准备 (2)1.2显像剂的喷涂 (4)1.3标志点的粘贴 (6)任务2 三维数据采集 (7)2.1 Win3D扫描仪介绍 (7)2.2电吹风的数据采集 (9)任务3 三维数据处理 (13)3.1、Geomagic Wrap软件介绍 (13)3.2 数据处理 (20)任务4 电吹风模型重构 (32)4.1 数据初始化 (32)4.2 电吹风模型重构 (35)4.3偏差分析与输出 (52)任务5 创新设计 (53)5.1电吹风的结构设计 (53)项目小结 (57)思考题 (58)项目一电吹风反求设计学习目标:通过本项目学习,初步掌握逆向设计的基本工作流程,理解逆向工程技术的关键技术及实施的条件。
能力要求:掌握逆向设计的工作流程掌握逆向设计三维数据采集掌握Geomagic Wrap软件基本操作掌握模型重构流程操作知识要求:了解逆向设计的工作流程了解三维数据的采集了解Geomagic Wrap软件了解模型重构基本操作引言:电吹风是一种用于头发吹干和整型的整容电器。
但也可供实验室、理疗室及工业生产、美工等方面作局部干燥、加热和理疗之用。
又称干发器、吹风机。
按电动机类型,可分为单相交流感应式、交直流两用串激式和永磁直流式3种;按送风方式,可分为轴流式和离心式两种。
电吹风主要结构如下图所示:图1 电吹风结构任务1 三维数据采集前处理1.1三维数据采集前准备1.2显像剂的喷涂电吹风外表面为高度反光的铝材质,扫描若不作处理会使数据采集时导致无法采集反光处,致使扫描的点云数据出现较大的缺失。
第一步:揭开显像剂盖子后充分摇匀,以防沉淀物的积累。
如图1.2.1所示:图1.2.1 揭开盖子摇匀第二步:距离工件物体15-20cm处开始喷涂显像剂。
如图1.2.2所示:图1.1.2 喷嘴距离物体15-20cm第三步:喷涂薄薄一层显像剂即可。
CAD教程--【第9章--点云】

>打开点云文件,单击【移除球体】功能图标園。
>系统弹出“移除球体内的点”对话框,在绘图区选择需要移除点的位置 >在“半径”选项中设置球体半径值。
>单击“确定”按钮,完成操作。
9.2.3
单击工具栏【点云】一【删除多段线】功能图标國,系统弹出“移除多段线内的点” 对话框,如图9-20所示。通过该功能,可以定义多个点,通过这些点连成多段线,将多段 线内的点删除(当定义的多段线为开放线时,系统自动将首尾两个点连接起来形成封闭的多 段线),如图9-21所示。
丰动广自动
^0X)1@\±\
®@l
图9-16“组合/炸开”对话框
【删除输入点】当勾选该选项的复选框,执行组合/炸开点命令后,系统自动将原有的点 删除。否则,保留原有点。
经验参考:系统默认将点块以“小点”的方式显示,将独立的点以“小圆圈”的方式显示。 当点比较多时,小圆圈显示看起来非常密集,可以通过下拉菜单功能【属性】一【点】来修 改点的显示类型。
>单击鼠标中键确定或将鼠标切换到对话框的“修剪”栏,在绘图区选择一个修剪平面。
>勾选或取消“保留相反侧”选项的复选框,保留自己需要的区域(箭头指向为保留 方向)。
单击“确定”按钮,完成操作。
单击工具栏【点云】一【简化】功能图标fi,系统弹出“减少点数据”对话框,如 图9-26所示。通过该功能可以按一定的公差减少点的数量,如图9-27所示,以自动公差方 式减少点后,点数由原来的309⑻个点减少到7240个点。
单击“确定”按钮,完成操作。
中望3D提供了一个网格化功能,该功能可以将三维点数据网格化,使各个点相互连 接,组成一系列独立的三角形(即将点云转化为STL数据集)。被网格化的STL数据集实际 上是一个与之相同的三角形集,这些三角形是完全相连和缝合在一起的,它们之间没有重叠 边和多余的顶点。这就提供了一种结构化的方法来处理随机的输入数据。可通过【属性】一【面】功能来设置或编辑网格化的STL块属性。
pcl点云与ros之间的数据类型转换
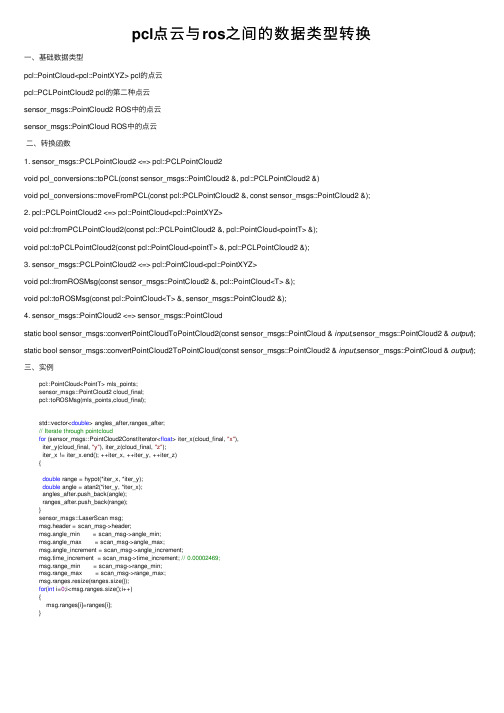
pcl点云与ros之间的数据类型转换⼀、基础数据类型pcl::PointCloud<pcl::PointXYZ> pcl的点云pcl::PCLPointCloud2 pcl的第⼆种点云sensor_msgs::PointCloud2 ROS中的点云sensor_msgs::PointCloud ROS中的点云⼆、转换函数1. sensor_msgs::PCLPointCloud2 <=> pcl::PCLPointCloud2void pcl_conversions::toPCL(const sensor_msgs::PointCloud2 &, pcl::PCLPointCloud2 &)void pcl_conversions::moveFromPCL(const pcl::PCLPointCloud2 &, const sensor_msgs::PointCloud2 &);2. pcl::PCLPointCloud2 <=> pcl::PointCloud<pcl::PointXYZ>void pcl::fromPCLPointCloud2(const pcl::PCLPointCloud2 &, pcl::PointCloud<pointT> &);void pcl::toPCLPointCloud2(const pcl::PointCloud<pointT> &, pcl::PCLPointCloud2 &);3. sensor_msgs::PCLPointCloud2 <=> pcl::PointCloud<pcl::PointXYZ>void pcl::fromROSMsg(const sensor_msgs::PointCloud2 &, pcl::PointCloud<T> &);void pcl::toROSMsg(const pcl::PointCloud<T> &, sensor_msgs::PointCloud2 &);4. sensor_msgs::PointCloud2 <=> sensor_msgs::PointCloudstatic bool sensor_msgs::convertPointCloudToPointCloud2(const sensor_msgs::PointCloud & input,sensor_msgs::PointCloud2 & output); static bool sensor_msgs::convertPointCloud2ToPointCloud(const sensor_msgs::PointCloud2 & input,sensor_msgs::PointCloud & output);三、实例pcl::PointCloud<PointT> mls_points;sensor_msgs::PointCloud2 cloud_final;pcl::toROSMsg(mls_points,cloud_final);std::vector<double> angles_after,ranges_after;// Iterate through pointcloudfor (sensor_msgs::PointCloud2ConstIterator<float> iter_x(cloud_final, "x"),iter_y(cloud_final, "y"), iter_z(cloud_final, "z");iter_x != iter_x.end(); ++iter_x, ++iter_y, ++iter_z){double range = hypot(*iter_x, *iter_y);double angle = atan2(*iter_y, *iter_x);angles_after.push_back(angle);ranges_after.push_back(range);}sensor_msgs::LaserScan msg;msg.header = scan_msg->header;msg.angle_min = scan_msg->angle_min;msg.angle_max = scan_msg->angle_max;msg.angle_increment = scan_msg->angle_increment;msg.time_increment = scan_msg->time_increment; // 0.00002469;msg.range_min = scan_msg->range_min;msg.range_max = scan_msg->range_max;msg.ranges.resize(ranges.size());for(int i=0;i<msg.ranges.size();i++){msg.ranges[i]=ranges[i];}。
点云转换矢量

点云转换矢量全文共四篇示例,供读者参考第一篇示例:点云是一种由大量离散的点构成的空间数据集合,通常由激光扫描仪或者摄像机等设备采集得到。
点云数据广泛应用于地理信息系统、三维建模、机器人视觉等领域,因其高精度、快速获取等特点,成为了当前数字化技术不可或缺的重要数据形式之一。
点云数据通常具有较大的数据量和复杂性,直接对其进行分析和处理存在诸多挑战。
将点云数据转换为矢量数据是一种常见的处理方式,能够简化数据的表示形式,提高数据的可读性和利用性。
点云转换为矢量数据的过程涉及到多种方法和算法,可以根据实际应用场景和需求选择合适的方式进行转换。
在进行点云转换之前,首先需要对点云数据进行预处理,包括去噪、滤波、点云拟合等操作,以提高数据的质量和准确性。
接下来,根据需求可以选择不同的转换方法,常见的点云转矢量的方法包括网格化、曲面拟合、基于特征的方法等。
下面将介绍几种常见的点云转矢量的方法:1.网格化方法:网格化是将点云数据按照一定规则转换为网格数据的一种方法。
在网格化过程中,可以根据点云数据的空间分布和密度等特征,将点云数据分割为若干个小区域,并在每个小区域内生成网格数据。
网格化方法能够有效地保留点云数据的几何信息,适用于对点云数据进行三维可视化、地形建模等场景。
2.曲面拟合方法:曲面拟合是利用数学模型对点云数据进行曲面拟合的一种方法。
通过对点云数据进行曲面拟合,可以将点云数据转换为具有连续性和光滑性的曲面数据,便于进一步的分析和处理。
曲面拟合方法通常适用于对点云数据进行形状分析、对象识别等场景。
3.基于特征的方法:基于特征的方法是一种利用点云数据中的特征信息进行转换的方法。
通过提取点云数据中的关键特征点、边缘信息等,可以将点云数据转换为具有明显特征的矢量数据,便于进行特征匹配、对象识别等操作。
基于特征的方法适用于对点云数据进行特征提取和匹配的场景。
除了上述方法外,还有一些其他的点云转矢量的方法,如基于深度学习的方法、基于空间分析的方法等。
常用的点云数据格式

常用的点云数据格式嘿,朋友们!今天咱来聊聊点云数据格式那些事儿。
你说这点云数据格式啊,就像是一个神奇的魔法盒子,里面装着各种各样的数据宝贝。
它可不是什么平平无奇的东西哦,就好比咱生活中的美食,有各种不同的口味和做法。
咱常见的点云数据格式就有好几种呢。
比如说 PCD 格式,它就像是一个可靠的老朋友,稳定又好用。
它能把点云的数据整理得井井有条,让你能轻松找到你需要的信息。
还有 LAS 格式呢,它就像是一个专业的大师,处理起大规模的点云数据来那是游刃有余。
很多专业的领域都离不开它呢,你能想象如果没有它,那些厉害的工程和设计得变得多麻烦吗?PLY 格式也很不错呀,它像是一个灵活多变的小精灵,能适应各种不同的需求和场景。
那我们怎么选择合适的点云数据格式呢?这可得好好琢磨琢磨。
就像你去买衣服,得根据场合、喜好来挑吧?选择点云数据格式也一样,得看你的具体用途和需求呀。
要是你在做一个超级大的项目,对数据的精度和规模要求很高,那是不是就得选个像 LAS 格式这样的“大师级别”的呀?要是只是一些小打小闹的尝试,PLY 格式可能就足够啦。
而且哦,不同的格式在处理和使用上也有各自的特点呢。
有的格式可能读取速度快,有的可能存储空间小,这就像是不同的交通工具,各有各的优势。
咱在处理点云数据格式的时候,可不能马虎大意。
就像你做饭,要是调料放错了或者步骤弄错了,那做出来的菜能好吃吗?同样的道理,要是对这些格式不熟悉,不小心弄错了,那可就麻烦啦。
所以呀,朋友们,可得好好了解和掌握这些点云数据格式哦。
它们就像是我们手中的工具,用好了就能发挥出巨大的作用。
别小看了它们,它们可是能帮我们创造出很多神奇的东西呢!总之呢,点云数据格式是个非常重要且有趣的东西。
我们要认真对待它们,让它们为我们的工作和生活增添更多的精彩!这就是我对点云数据格式的看法,你们觉得呢?。
3D打印技术实训__点云数据的处理
二 点云数据的逆向
1.生成主体特征
• 选择“面片草图”命令→选择基准平面是“右” →隐藏面片→显示断面轮廓→ 选择“自动草图”命令→画出草图,并修改→做出旋转轴→点击右下角√→ 选择“回转”命令→轮廓为“草图环路1” →轴为“曲线1” →点击√。操作过 程如图所示。
二 点云数据的逆向
2.面片草图
一 点云数据的处理
1. 导入模型
选择菜单栏→插入→导入→选择文件“手轮.stl”→仅导入,如图 所示。
一 点云数据的处理
2. 模型对正
• 参考平面和参考线的建立。 • 选择“领域组”命令→关闭“自动分割”对话框→左下角更改选择模式为“画
笔选择模式”→在底平面选3-4个区域→插入新领域→选择最大外圆柱的 3-4个区域(或者2个大区域)→插入新领域→选择模式更换为“矩形选 择”→点击右下角“√”,操作过程如图所示。
• 选择“面片草图”命令→选择基准平面是“前”→显示断面轮廓→选择“自动 草图”命令→画出草图,并修改→点击右下角√→选择“拉伸”命令→轮廓 为草图2 →运算结果为在“剪切” →点击√。操作过程如图所示
二 点云数据的逆向
3.圆角
• 选择“圆角”命令→选择要倒圆角的边→由面片估算半径→调 整半径值→点击√,ቤተ መጻሕፍቲ ባይዱ图所示
支撑选择。设置如图所示。
三 STL模型的导出与检测
2.打印参数设定
• 载入模型之后,根据需要对打印参数进行设定
层高 采用标准打印质量,层高设定为0.3mm,保证打印速度。
外壳 填充
外周壳数量设定为2,封底层数和封顶层数设置为3,保证有 足够的强度。 填充设置为15%,在保证强度的同时,提高打印效率。
速度 温度
打印速度设置为70mm/s,空走速度设置为120mm/s,这样既 不影响打印质量,又能保证打印效率。
点云逆向建模流程

点云逆向建模流程下载温馨提示:该文档是我店铺精心编制而成,希望大家下载以后,能够帮助大家解决实际的问题。
文档下载后可定制随意修改,请根据实际需要进行相应的调整和使用,谢谢!并且,本店铺为大家提供各种各样类型的实用资料,如教育随笔、日记赏析、句子摘抄、古诗大全、经典美文、话题作文、工作总结、词语解析、文案摘录、其他资料等等,如想了解不同资料格式和写法,敬请关注!Download tips: This document is carefully compiled by theeditor. I hope that after you download them,they can help yousolve practical problems. The document can be customized andmodified after downloading,please adjust and use it according toactual needs, thank you!In addition, our shop provides you with various types ofpractical materials,such as educational essays, diaryappreciation,sentence excerpts,ancient poems,classic articles,topic composition,work summary,word parsing,copy excerpts,other materials and so on,want to know different data formats andwriting methods,please pay attention!点云逆向建模流程点云逆向建模是一种将三维点云数据转化为三维模型的方法。
离散点云直接映射stl文件格式的算法及实现

2006年8月{i群.等:离散点厶直接映射STL文件格式的算法及Je实现345替C..弓(昂Jp。
=,^),计算C+。
只‘o£C+.(i=七…堋)的央角(f+。
P,尸,只+.)及最小夹角(C+。
只,CC+.),设为a。
口m的另一条边的端点即凸壳顶点,记为只。
由刚才的操作,依次循环,形成第一个环域,如图2所示。
(4)将第一个环域各个顶点的坐标记录下来,存入一个点集中,即只,£,…己,设为Ci={丘‘,爿,..尼.)。
然后开始第二环的环域划分,将第二环的点数据记录下来,存入C=(鼻2-只2....焉)中,继续下去,重复操作,直到最里面的点为止。
最终结果如3图所示。
’■‘、||卜。
c.j÷∥I卜。
√。
,÷■l』——一’L…….一■孓=--一一}’.I~一一jl’二!二二j图4相邻环域的三角划分(6)相邻环域三角划分之后,整体点集就完成了幕础的划分过程,其结果如图5所示。
由于受被测件的形状和,F面扫描点数的影响,当点数少、形状复杂,特别是有突变情况会形成狭长三角形。
由此,需要通过平面优化,得到最终的结果,也是理想的结果。
如图6所刀÷。
必要的奉文中三维优化的实现有以下前提条件:①狭长三角形的判定方法足以最小内角小十20度作为标准,从最外层的守问恻格开始遍历。
②为厂循环叙述方便.使用两套下标表示。
初始值为:i=i’,,=,’,k=k’,m=m’,彪=疗’。
只体如下:(1)在三角形9c)9格库中寻找尸I、尸j、Pk(f、/、k为任意值)构成△只尸i尸k,菪找不到,跳转到步1I。
若找到,进入下一步,见图7。
(2)判断△只’PI’Pk'是否为狭长三角形,若不是跳转到步l,若是,进入下一步。
(3)寻找以PiPk为边和以Jpi尸I为边的三角形的另外两个坐标点Pm、Pn(m、n为任意值),若找不到,跳转步1.若找到,则构成五边形PiPmPjJpk尸n,进入下一步。
(4)过Pk’作垂直于△Pi甲m'Pk’的平面£,如果满足Jpk’Jpm’尸i’在-、l,面£的一边时,则这条边满足E面判断要求,进入下一步;如果/f;红M一边,则跳转到步6。
- 1、下载文档前请自行甄别文档内容的完整性,平台不提供额外的编辑、内容补充、找答案等附加服务。
- 2、"仅部分预览"的文档,不可在线预览部分如存在完整性等问题,可反馈申请退款(可完整预览的文档不适用该条件!)。
- 3、如文档侵犯您的权益,请联系客服反馈,我们会尽快为您处理(人工客服工作时间:9:00-18:30)。
STL格式介绍
stl文件是在计算机图形 学应用系统中,用于表 示三角形网格的一种文 件格式。
比如: 这只猫
STL格式优点
文件格式简单,应用广泛。 STL是最多快速原型系统(3D打印)所应用的标准文件类
型。 STL是用三角网格来表现3D CAD模型。
直接使用点云数据的缺点
三维激光扫描系统采集的点云数据可以在AutoCAD软件上 直接使用,但是点云数据量过大,个人电脑无法运行如此 海量数据。
先进行处理再转换
例如我们用 右面这张图 做演示:
ห้องสมุดไป่ตู้
转换
首先把剔除干扰点后的点云数据转换成纯文本(.txt)格 式
如右图:
转换
然后再把纯文本格式转换成CAD格式
海量数据处理方法
大家学习辛苦了,还是要坚持
继续保持安静
海量数据处理方法
2.在分接处设立三四个参考点(方便拼图)
海量数据处理方法
海量数据处理方法
4.最后将处理后的点云数据导出,转换成AutoCAD 格式的点云数据,经上述处理数据量会从100多万 降到3万,这样就可以在AutoCAD平台处理操作
逆向工程
工业上先做出油泥模型,再测量模型表面的点阵
数据,最后利用逆向工程软件进行处理。
似。
我们要做的利用knict采集数据和上述过程很相
Imageware surfacer
目前比较有名气的逆向工程软件就属这款Imageware公司 旗下的surfacer,可以直接将点云数据进行处理并转换为 stl格式的文件。
Imageware 12.1新功能以及改善:
Opening NX Parts in Imageware---可以直接打开NX模型 Importing an Image as a Point Cloud---直接输入一个图片作为点云处理 Using Custom Views--可以自定义视图 Layer Manager Enhancements--增强图层管理 Circle-Selecting Points--增加圈选点云 Global Model Clouds--全局模型点云 Global Model Surfaces--全局模型曲面 Feature-Based Alignment--基于特征的对齐方式