2015最新的雅思作文模板(饼状图)
雅思小作文 饼状图

雅思小作文饼状图英文回答:The pie chart illustrates the percentage of various sources of energy consumed in a particular region during a specific year. The data is presented in a clear and concise manner, with each slice of the pie representing a different energy source.Upon examining the pie chart, it becomes evident that non-renewable energy sources dominate the region's energy consumption. Fossil fuels, including coal, natural gas, and oil, account for a substantial 80% of the total energy usage. This heavy reliance on non-renewable resources highlights the region's dependence on finite energy sources, which raises concerns about future energy security and environmental sustainability.In contrast, renewable energy sources play a relatively minor role in the region's energy mix. Solar and wind powercombined contribute a mere 10% to the total energy consumption. This low percentage suggests a lack of investment in renewable energy infrastructure and a reluctance to transition towards cleaner and more sustainable energy sources.Hydroelectricity stands out as the most significant renewable energy source, accounting for 5% of the region's energy consumption. However, this figure is stillrelatively low compared to the potential hydroelectric resources that the region may possess. The untapped potential of hydroelectricity presents an opportunity for the region to increase its reliance on renewable energy and reduce its dependence on fossil fuels.Overall, the pie chart provides valuable insights into the region's energy consumption patterns. The dominance of non-renewable energy sources raises concerns about the region's long-term energy security and environmental sustainability. The underutilization of renewable energy sources, particularly hydroelectricity, suggests a need for increased investment and a shift towards a more sustainableenergy future.中文回答:此饼状图展示了某个地区在某一年中各种能源消耗所占的百分比。
雅思写作小作文范文 雅思写作饼状图pie chart 宾馆服务满意度.doc

雅思写作小作文范文雅思写作饼状图pie chart 宾馆服务满意度今天我们雅思写作小作文范文的文章来研究下饼状图pie chart。
该题目包含两个图形,显示了某项调查问卷在2005年和2010年的结果。
该调查要求顾客对Parkway宾馆的客户服务给出评价,并将评价结果分为很差,差,满意,良好,优秀五个等级。
小编搜集了一篇相关的考官范文,以供大家参考。
雅思写作小作文题目The charts below show the results of a questionnaire that asked visitors to the Parkway Hotel how they rated the hotel’s customer service. The same questionnaire was given to 100 guests in the years 2005 and 2010.Summarise the information by selecting and reporting the main features, and make comparisons where relevant.雅思写作小作文范文The pie charts compare visitors’ responses to a survey about customer service at the Parkway Hotel in 2005 and in 2010.饼状图比较了2005年和2010年游客对Parkway宾馆客户服务满意度的调查结果。
It is clear that overall customer satisfaction increased considerably from 2005 to 2010. While most hotel guests rated customer service as satisfactory or poor in 2005, a clear majority described the hotel’s service as good or excellent in 2010.很明显,从2005年到2010年,整体的客户满意度有了很大的提升。
饼状图的英语作文模板

饼状图的英语作文模板A pie chart is a type of graph that is used to represent data in a circular form. It is divided into slices to show the proportion of each category or data point. This type of chart is commonly used in business presentations, research reports, and academic papers to visually represent data in a clear and concise manner.Pie charts are a useful tool for comparing different categories or data points at a glance. The size of each slice in the chart represents the proportion of that category relative to the whole. This makes it easy to see which categories are the largest or smallest, and to identify any trends or patterns in the data.One of the key advantages of using a pie chart is that it is visually appealing and easy to understand. The circular shape and different colored slices make it easy for viewers to quickly grasp the information being presented. This can be especially useful when presentingcomplex data sets or statistics to a non-technical audience.However, pie charts also have some limitations. Theycan be difficult to read when there are too many categories or data points, as the slices become too small to differentiate. In addition, it can be challenging to accurately compare the size of different slices, especially when they are similar in size.In conclusion, pie charts are a valuable tool for visually representing data in a clear and concise manner. They are easy to understand and can help viewers quickly grasp the key points of a dataset. However, it is important to use them judiciously and consider their limitations when presenting complex or detailed information.。
饼图英语作文3例

饼图英语作文3例饼图英语作文范文3例饼图英语作文范文篇一:1.雅思饼图写作范文一饼图写作范文一ThepiechartindicateshowtheU.S.budgetisspentinsixaspectsin cludinghumanresources,generalgovernment,physicalresources,c urrentandpastmilitaryandIraq&Afghanwarsin2004.Moneyspentinhumanresourcesaccountsfor32percentoftheto tal,occupyingthelargestshareinthewholebudget.Thesecondlarge stoneisgiventocurrentmilitarywith27percentofthebudget.Pastmil itaryreceivesmoneytenpercentlessthancurrentmilitary,followedb ygeneralgovernmentwhichconstitutes13percent.Thetwoaspects offeredtheleastmoneyinthebudgetarephysicalresourcesandIraq &Afghanwars,makingup8and3percentrespe(出自::饼图英语作文范文)ctively.Currentmilitary,pastmilitaryandIraq&Afghanwars,ifconsidere dseparately,arenotthelargestmoneyreceiverinthebudget.Thethre easpectsintotal,however,accountfor49percentofthebudget,much higherthanhumanresources,letalonegeneralgovernmentandphys icalresources.FromthechartitcanbeseenclearlythatthemajorityoftheU.S.bu dgetin2004isspentinmilitarywhiletherestisallocatedtohumanreso urces,generalgovernmentandphysicalresources.饼图英语作文范文篇二:雅思小作文饼图范文智课网IELTS备考资料雅思小作文饼图范文摘要:雅思小作文饼图范文。
饼型作文英语作文模板
饼型作文英语作文模板英文回答:1. What is a Pie Chart?A pie chart is a diagram that represents data in the form of a circle, with each slice of the pie representing a proportion of the whole. The sizes of the slices are proportional to the values they represent. Pie charts are a simple and effective way to visualize data, especially when comparing different parts of a whole.2. How to Create a Pie Chart in Excel。
Select the data you want to represent in the pie chart.Click on the "Insert" tab in the menu bar.Select "Pie Chart" from the "Charts" group.Choose the type of pie chart you want to create.Click on "OK".3. How to Analyze a Pie Chart。
Identify the large and small slices: The size of each slice indicates the proportion of the whole that it represents.Look for patterns: Are there any noticeable patterns in the data, such as a dominance of certain slices or a gradual decrease in size?Compare the slices: Compare the sizes of different slices to understand the relative importance of each category.4. Advantages and Disadvantages of Pie Charts。
饼状图英语作文模板
饼状图英语作文模板Title: Crafting a Comprehensive Essay Structure for Pie Chart Analysis。
Introduction:A pie chart, a circular statistical graphic, is a popular tool to visualize numerical proportions. Analyzing pie charts involves interpreting data and drawing meaningful insights. In this essay, we will explore a structured approach to dissecting pie charts effectively.1. Overview:Begin by providing a brief overview of the piechart's subject matter and the time frame it represents. For example, if the chart illustrates market share percentages of smartphone brands in 2023, mention that.2. Introduction of the Main Segments:Identify and introduce the main segments or categories represented in the pie chart. Each segment should be briefly described, along with its percentage or numerical value. Use clear and concise language to ensure the reader understands the key components.3. Comparison and Analysis:Compare the proportions of different segments. Identify any significant variations or patterns. Are there any segments that dominate the chart, or are the segments relatively evenly distributed? Discuss any outliers or unexpected findings.4. Factors Influencing the Data:Consider external factors that may have influenced the data presented in the pie chart. For instance, if the chart depicts market share, discuss factors such as brand reputation, pricing strategies, or technological innovations that could impact market dynamics.5. Trend Analysis:If the pie chart represents data over a period of time, analyze any trends or changes observed. Are certain segments increasing or decreasing in proportion over time? Speculate on the reasons behind these trends and their potential implications.6. Interpretation and Conclusion:Offer your interpretation of the findings based on the analysis conducted. Summarize the main insights gleaned from the pie chart and their significance. Avoid introducing new information in the conclusion; instead, reinforce key points made throughout the essay.7. Recommendations (if applicable):Depending on the context of the pie chart, you may choose to provide recommendations for action based on your analysis. For example, if the chart reveals a decliningmarket share for a particular brand, suggest strategies for revitalizing their presence in the market.8. Acknowledgment of Limitations:Acknowledge any limitations or constraints inherent in the data presented in the pie chart. This could include issues such as sample size, data collection methods, or missing information that may affect the validity of the analysis.Conclusion:In conclusion, analyzing pie charts requires a systematic approach that encompasses an overview of the data, comparison of segments, consideration of influencing factors, trend analysis, interpretation, and recommendations. By following this structured essay template, one can effectively dissect pie charts and derive valuable insights from them.。
雅思小作文饼图范文
雅思小作文饼图范文下载温馨提示:该文档是我店铺精心编制而成,希望大家下载以后,能够帮助大家解决实际的问题。
文档下载后可定制随意修改,请根据实际需要进行相应的调整和使用,谢谢!并且,本店铺为大家提供各种各样类型的实用资料,如教育随笔、日记赏析、句子摘抄、古诗大全、经典美文、话题作文、工作总结、词语解析、文案摘录、其他资料等等,如想了解不同资料格式和写法,敬请关注!Download tips: This document is carefully compiled by theeditor. I hope that after you download them,they can help yousolve practical problems. The document can be customized andmodified after downloading,please adjust and use it according toactual needs, thank you!In addition, our shop provides you with various types ofpractical materials,such as educational essays, diaryappreciation,sentence excerpts,ancient poems,classic articles,topic composition,work summary,word parsing,copy excerpts,other materials and so on,want to know different data formats andwriting methods,please pay attention!《雅思小作文饼图范文》。
嘿,小朋友们!今天咱们来瞧瞧一个好玩的饼图哟!这个饼图是讲一些动物的数量占比哒。
雅思写作小作文范文雅思写作饼状图piechart学校花费.doc
雅思写作小作文范文雅思写作饼状图piechart学校花费.doc雅思写作小作文范文雅思写作饼状图pie chart 学校花费今天我们雅思写作小作文范文的文章来研究下饼状图pie chart。
跟以前咱们见过的题目不同,这次有三个图形。
如此一来,数据就显得非常多和杂乱,十分考验大家挑选关键信息并进行比较的能力。
小编搜集了一篇相应的考官范文,以供大家参考。
雅思写作小作文题目The three pie charts below show the changes in annual spending by a particular UK school in 1981, 1991 and 2001.Summarise the information by selecting and reporting the main features, and make comparisons where relevant.雅思写作小作文范文The pie charts compare the expenditure of a school in the UK in three different years over a 20-year period.饼状图比较了一所英国学校在20年的时间跨度中三年的花费。
It is clear that teachers’ salaries made up the largest proportion of the school’s spending in all three years (1981, 1991 and 2001). By contrast, insurance was the smallest cost each year.很明显,教师的工资在所有三个年份(1981年,1991年和2001年)中占据学校花费的最大部分。
相比之下,保险在每一年里都是最小的花费。
In 1981, 40% of the school’s budget went on teachers’ salaries. This figure rose to 50% in 1991, but fell again by 5% in 2001. Th e proportion of spending on other workers’ wages fell steadily over the 20-year period, from 28% of the budget in 1981 to only 15% in 2001.1981年,学校预算的百分之四十用于教师的薪酬纸上。
雅思写作小作文范文雅思写作饼状图piechart健康饮食.doc
雅思写作小作文范文雅思写作饼状图piechart健康饮食.doc雅思写作小作文范文雅思写作饼状图pie chart 健康饮食今天我们雅思写作小作文范文的文章来研究下饼状图pie chart。
该题目中共出现三张饼图,分别展示了碳水化合物、脂肪以及蛋白质在平均饮食、一般健康饮食、以及运动员健康饮食中所占的比例。
从中可以看出,碳水化合物占得比例越来越大,而蛋白质占得比例越来越小。
小编搜集了一篇相关的考官范文,以供大家参考。
雅思写作小作文题目雅思写作小作文范文The pie charts compare the proportion of carbohydrates, protein, and fat in three different diets, namely an average diet, a healthy diet, and a healthy diet for sport.饼状图比较了三种不同饮食中(平均饮食、健康饮食、以及专为运动员准备的健康饮食)碳水化合物、蛋白质和脂肪所占的比例。
It is noticeable that sports people require a diet comprising a significantly higher proportion of carbohydrates than an average diet or a healthy diet. The average diet contains the lowest percentage of carbohydrates but the highest proportion of protein.很明显,与平均饮食和一般的健康饮食相比,运动员需要的饮食中包含更多的碳水化合物。
平均饮食中的碳水化合物虽然较低,但蛋白质的比例最高。
Carbohydrates make up 60% of the healthy diet for sport. This is 10% higher than the proportion of carbohydrates in a normal healthy diet and 20% more than the proportion in an average diet. On the other hand, people who eat an average diet consume a greater amount of protein (40%) than those who eat a healthy diet (30%) and sportspeople (25%).碳水化合物构成运动员健康饮食的百分之60。
雅思写作task 1 饼状图 Pie Chart
练习
• 女生的数量大约是男生的三倍 • The number of girls is about 3 times that of boys • The number of girls is about 3 times as high as boys • The number of girls is about twice higher than boys
P3
• Accommodation and food were the two biggest items of expenditure. Altogether they constituted around 60% of the total students’ expenditure in all the three countries. • The difference is that in country A and B accommodation spending exceeded food spending, while the reverse was true for country C. • 比较较大/最大
P4
• Overall, it is clear that by 2000 these two countries relied on different principal fuel sources: Australia relied on coal and France on nuclear power.
P1
• The charts compare the sources of electricity in Australia and France in the years 1980 and 2000. • Between these years electricity production almost doubled, rising from 100 units to 170 in Australia, and from 90 to 180 units in France. • 三倍triple 四倍quadruple n/adj/v • fourfold adj/adv
雅思名师写作范文:饼状图作文

雅思名师写作范文:饼状图作文最权威的国际教育服务平台雅思名师写作范文:饼状图作文This is a pie chart that shows the proportion of the meal sold in a supermarket. The total meat sold in the supermarket is classified into six types as follows: chicken, pork, beef, lamb, fish and others.Overall, chicken has the largest proportion, which accounts for 40%; while others has the smallest percentage, at 2%.As can be seen in the pie chart, chicken, which makes up 40%, is the most popular among the total meat sold, then next is pork with 20%, followed by beef,constituting 18%; and finally come lamb, fish and others at 15%, 5% and 2%respectively, It should be noted that the sale of pork is half as much as that of chicken. And it is also interesting to note that the sale of chicken is 20 times as much as that of others.It can be concluded from the pie chart that chicken is most commonly bought meat while others is the least commonly bought meat.资料来源:教育优选 /第二篇:雅思小作文饼状图范文 1400字雅思小作文饼状图范文Describing an IELTS Pie ChartThis lesson will provide you with tips and advice on how to write an IELTS pie chart for task one.To begin, take a look at the pie chart below and the modelanswer. You should spend about 20 minutes on this task.The pie charts show the main reasons for migration to and from the UK in 2007.Summarize the information by selecting and reporting the main features and make comparisons where relevant.Write at least 150 wordsSample AnswerThe pie charts illustrate the primary reasons that people came to and left the UK in 2007.At first glance it is clear that the main factor influencing this decision was employment.Having a definite job accounted for 30 per cent of immigration to the UK, and this figure was very similar for emigration,at 29%. A large number of people, 22%, also emigrated because they were looking for a job, though the proportion of people leaving the UK for this purpose was noticeably lower at less than a fifth. Another major factor influencing a move to the UK was for formal study, with over a quarter of people immigrating for this reason. However, interestingly, only a small minority, 4%, left for this.The proportions of those moving to join a family member were quite similar for immigration and emigration, at 15% and 13% respectively. Although a significant number of people (32%) gave ‘other’ reasons or did not give a reason why they emigrated, this accounted for only 17% with regards to immigration.。
饼状图类英语作文模板
饼状图类英语作文模板英文回答:Pie Chart。
A pie chart is a circular statistical graphic that is divided into slices to illustrate numerical proportions. Each slice represents a different category of data, and the size of each slice corresponds to the percentage of the total that category represents.Creating a Pie Chart。
To create a pie chart in Microsoft Excel, follow these steps:1. Create a table of data with two columns: one for the category labels and one for the corresponding numerical values.2. Select the data range.3. Click on the "Insert" tab.4. In the "Charts" group, click on the "Pie" button.5. A pie chart will be inserted into the worksheet.Formatting a Pie Chart。
Once a pie chart has been created, it can be formatted to improve its appearance and clarity. Some of the formatting options available include:Changing the colors of the slices。
饼状图的英文作文

饼状图的英文作文英文:As we all know, a pie chart is a popular way to display data in a visual format. It is a circular chart that is divided into slices, with each slice representing a proportion of the whole. Pie charts are commonly used to show percentages, proportions and distributions.One of the advantages of using a pie chart is that itis easy to understand and interpret. With just a quick glance, you can see the relative sizes of each slice and understand the overall picture. This makes it a great tool for presenting complex data in a clear and concise way.Another advantage of pie charts is that they can beused to compare data from different categories. For example, if you wanted to compare the sales of different products in a particular market, you could use a pie chart to show the percentage of sales for each product. This would allow youto quickly see which products are most popular and which are less popular.However, there are also some disadvantages to using pie charts. One of the main criticisms is that they can be misleading if the slices are not accurately sized or labeled. This can lead to misinterpretation of the data and can result in incorrect conclusions being drawn.In conclusion, pie charts are a useful tool for displaying data in a visual format. They are easy to understand and can be used to compare data from different categories. However, they should be used with caution and care should be taken to ensure that the data is accurately represented.中文:众所周知,饼状图是一种流行的数据可视化展示方式。
雅思小作文范文-饼图

The two graphs show the main sources of energy in the USA in the 1980s and the 1990s.思路:1. 采用折线模式描述2. 注意重点数据的选取(max, min)3. 注意分段原则:一段写上升,一段写下降,一段写保持不变。
答案:The two graphs show that oil was the major energy source in the USA in both 1980 and 1990 and that coal, natural gas and hydroelectric power remained in much the same proportions. On the other hand, there was a dramatic rise in nuclear power, which doubled its percentage over the ten years.Oil supplied the largest percentage of energy, although the percentage decreased from 42% in 1980 to 33% in 1990. Coal in 1990 was the second largest source of energy, increasing its proportion to 27% from 22% in the previous decade. Natural gas, the second largest source in 1980 at 26%, decreased its share very slightly to provide 25% of America’s energy ten years later. There was no change in the percentage supplied by hydroelectric power which remained at 5% of the total energy used. Nuclear power the greatest change: in 1990 it was 10%, twice that of the 1980s.In conclusion, during the decade, the structure of energy resources remained, and the proportion of 3 aspects varied a lot, except natural gas and hydroelectric power.(180)Information on UAE government spending in 2000. The total budget was AED 315 billion.思路:1. 分段原则较为灵活,可以分,也可以不分;2. 注意数据的描述顺序为:从大到小;3. 描述的过程中注意数据的对比:大小关系,倍数关系等;答案:The graph tells us about the budget of the UAE government in 2000. In general, the most important targets were social security, health, and education.The biggest slice of the pie chart is taken up by social security including pensions, employment assistance and other benefits which made up slightly under one-third of total expenditure. Health and personal social services was the second highest budget cost. Hospital and medical services accounted for AED 53 billion, or about 15% of the budget. Education cost UAE AED 38 billion which comprises almost 12% of the whole budget. The government spent about seven percent of revenue on debt, and roughly similar amounts went towards defence (AED 22 billion) and law and order (AED 17 billion). Spending on housing, transport and industry totalled AED 37 billion. Finally, other expenditure accounted for AED 23 billion.All in all, the bulk of UAE government spending goes on social welfare and health. However, education, defence, and law and order are also major areas of spending.(167)3.消费模式The pie charts show changes in U.S. spending patterns between 1966 and 1996.思路:1. 主要采用折线模式,重点描述数据的改变和趋势2. 留意极值(MAX, MIN)的描述3. 分段的原则可为:上升的一段,下降的一段,保持不变的一段。
雅思写作小作文范文 雅思写作饼状图pie chart 英国景点数据统计.doc
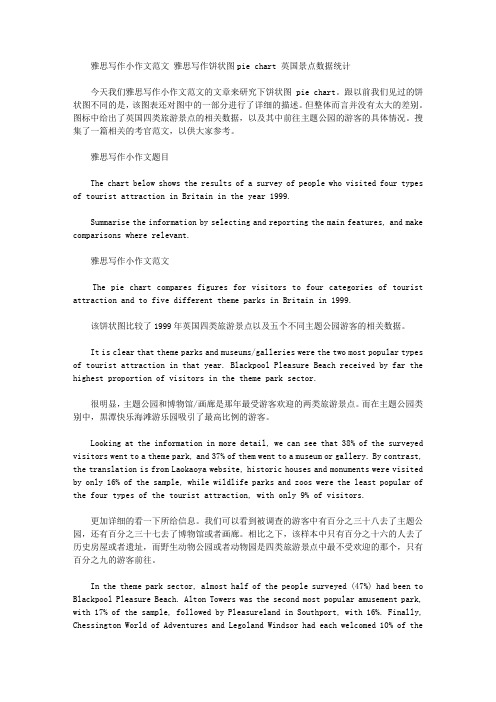
Looking at the information in more detail, we can see that 38% of the surveyed visitors went to a theme park, and 37% of them went to a museum or gallery. By contrast, the translation is from Laokaoya website, historic houses and monuments were visited by only 16% of the sample, while wildlife parks and zoos were the least popular of the four types of the tourist attraction, with only 9% of visitors.
It is clear that theme parks and museums/galleries were the two most popular types of tourist attraction in that year. Blackpool Pleasure Beach received by far the highest proportion of visitors in the theme park sector.
更加详细的看一下所给信息。我们可以看到被调查的游客中有百分之三十八去了主题公园,还有百分之三十七去了博物馆或者画廊。相比之下,该样本中只有百分之十六的人去了历史房屋或者遗址,而野生动物公园或者动物园是四类旅游景点中最不受欢迎的那个,只有百分之九的游客前往。
饼状图的英语作文
饼状图的英语作文Title: Exploring the Dynamics of Pie Charts。
Introduction:Pie charts are powerful visual tools used to represent data distribution in a circular form, with each slice representing a proportion of the whole. This essay delves into the intricacies of pie charts, examining their construction, interpretation, and significance in conveying information effectively.Construction of Pie Charts:Pie charts are constructed by dividing a circle into sectors, with each sector corresponding to a specific category or data subset. The size of each sector is proportional to the quantity it represents in relation to the total. To create a pie chart, data is first gathered and categorized. Then, the percentage or proportion of eachcategory is calculated, and these values are translatedinto angles to determine the size of each sector.Interpretation of Pie Charts:Interpreting pie charts involves understanding the relationship between each sector and the whole. The largest sector typically represents the most significant category or the highest proportion of the data, while smaller sectors indicate lesser proportions. Comparisons between sectors can reveal patterns, trends, or disparities within the data. Additionally, pie charts can highlight outliers or emphasize specific categories based on their size or position within the chart.Significance of Pie Charts:Pie charts offer several advantages in data visualization. They provide a clear and concise representation of proportions, making complex data easily understandable at a glance. Pie charts are particularly useful for illustrating categorical data, such as marketshare, budget allocation, or demographic distribution. Their intuitive design facilitates quick comprehension, making them valuable tools for decision-making, communication, and analysis across various fields and disciplines.Furthermore, pie charts can effectively convey relative proportions and trends over time when used in conjunction with multiple datasets or successive iterations. By comparing pie charts from different time periods or scenarios, stakeholders can assess changes, identify growth areas, or pinpoint areas of concern.Challenges and Considerations:Despite their effectiveness, pie charts havelimitations and considerations. One challenge is the potential for misinterpretation or distortion when the number of categories is excessive or when sectors are too small to distinguish visually. In such cases, alternative visualization methods, such as bar graphs or stacked bar charts, may be more appropriate.Another consideration is the need for accuracy and transparency in presenting data. It is essential to ensure that the data used to construct pie charts is reliable, representative, and properly labeled. Misleading or incomplete information can undermine the credibility of the chart and lead to erroneous conclusions.Conclusion:In conclusion, pie charts are valuable tools for visualizing and communicating data distribution. Their intuitive design and clear presentation make them widely used across various fields, from business and finance to education and research. By understanding the construction, interpretation, and significance of pie charts, individuals can harness their power to effectively convey information, analyze trends, and make informed decisions.。
描述饼图的英语作文模板
描述饼图的英语作文模板英文回答:A pie chart is a circular statistical graph that depicts the proportional sizes of different categories in a dataset. The pie is divided into slices, each representing a category, with the angle of each slice corresponding to the category's percentage of the total. Typically, the slices are arranged in descending order of size, with the largest slice representing the largest category.Pie charts are frequently employed to illustrate the distribution of data into various groups, making them particularly useful for comparing the relative proportions of different categories at a glance. However, pie charts have certain limitations, especially when comparing more than a few categories. Additionally, they can be challenging to read accurately because of potential distortions caused by the angle of the slices.When describing a pie chart, it is essential to:1. Identify the overall dataset and its purpose: Explain the subject matter of the pie chart and its intended use.2. Describe the size and distribution of the slices: State the percentage or proportion of each category and its corresponding slice on the pie chart. Highlight any particularly large or small slices.3. Discuss any trends or patterns: Examine if there are any noticeable trends or patterns in the distribution of the categories, and explain any possible reasons behind these observations.4. Provide context and interpretation: Explain what the pie chart reveals about the underlying data, discuss any insights gained, and relate the findings to the overall context of the analysis.5. Mention any limitations: Acknowledge any potentiallimitations or drawbacks of the pie chart, such asdifficulty in comparing more than a few categories or distortions arising from the angle of the slices.中文回答:饼图是一种圆形统计图,可以显示数据集不同类别的大小比例。
饼状图英文作文模板

饼状图英文作文模板Title: An Exemplary Guide to Crafting a Pie Chart Essay。
Introduction:Pie charts are indispensable tools in data representation and analysis. They provide a visually appealing and easily comprehensible way to present proportions and percentages within a dataset. In this essay, we will delve into the intricacies of crafting a compelling pie chart essay, exploring its structure, content, and analytical depth.Body:1. Understanding the Pie Chart:Before delving into the essay's construction, it's imperative to grasp the fundamental concept of a pie chart.A pie chart, also known as a circle chart, is a circularstatistical graphic divided into slices to illustrate numerical proportions. Each slice represents a proportionate part of the whole, typically expressed in percentages.2. Selecting Relevant Data:The first step in creating a pie chart essay is to identify and select pertinent data. Whether it's demographic statistics, market research findings, or scientific data, the chosen information should be relevant to the essay's theme or subject matter. It's essential to ensure the data is accurate, reliable, and up-to-date to maintain the essay's credibility.3. Constructing the Pie Chart:Once the data is selected, proceed to construct the pie chart. Utilize spreadsheet software or specialized graphing tools to create an accurate representation of the data. Ensure each slice of the pie accurately reflects its corresponding percentage in the dataset. Additionally,label each slice clearly to facilitate understanding for the audience.4. Analyzing the Pie Chart:A pivotal aspect of the pie chart essay is the analysis of the data represented. Interpret the pie chart by identifying trends, patterns, and notable outlierswithin the dataset. Analytical insights derived from the pie chart serve to enhance the essay's depth and provide valuable context to the reader.5. Incorporating Descriptive Text:Complement the pie chart with descriptive text to provide additional context and explanation. Describe the significance of each slice, elucidate key findings, and highlight any noteworthy observations. The descriptive text should be concise, informative, and seamlessly integrated with the visual representation of the data.6. Drawing Comparisons:To enrich the analysis, consider comparing different segments of the pie chart. Highlight disparities between slices, elucidate contrasting trends, or explore the relationship between various data points. Drawing meaningful comparisons adds a layer of complexity to the essay and fosters a deeper understanding of the dataset.7. Providing Real-World Examples:Enhance the essay's relevance and applicability by incorporating real-world examples or case studies.Illustrate how the data represented in the pie chart manifests in practical scenarios, industries, or societal contexts. Real-world examples serve to contextualize the data and resonate with the reader on a more personal level.Conclusion:In conclusion, crafting a pie chart essay entails meticulous attention to detail, insightful analysis, and effective communication of data. By following theguidelines outlined in this essay, you can create a compelling and informative piece that effectively utilizes pie charts as a visual aid for data representation and analysis. Pie charts, when utilized judiciously, serve as powerful tools for conveying complex information in a clear and accessible manner.。