Getdata Dragh Digitizer完整详解版教程
Stata Graph Editor 用户指南说明书

15Editing graphsThe Graph EditorWith Stata’s Graph Editor,you can change almost anything on your graph;you can add text,lines, arrows,and markers wherever you like.We willfirst make a graph to edit and will then point out the tools in the Graph Editor.Start by opening the automobile dataset:sysuse auto.Here is the command that we will use to make the graph:.scatter mpg weight,name(mygraph)title(Mileage vs.vehicle weight)Start the Editor by right-clicking on your graph and selecting Start Graph Editor.Click once on the title of the graph.Here is a picture of the Graph Editor with its elements labeled.Main menu Standard toolbar Contextual toolbar Selected objectbrowserObjectSelect any of the tools along the left of the Graph Editor window to edit the graph.The Pointer(Select tool),,is selected by default.You can change the properties of objects or drag them to new locations by using the Pointer.As you select objects with the Pointer,a Contextual Toolbar will appear just above the graph.In the above example,the title of the graph is selected,so the Contextual Toolbar has controls that are relevant for editing titles.You can use any of the controls on the Contextual Toolbar to immediately change the most important properties of the selected object.Right-click on an object to access more properties and operations.Hold the Shift key when dragging objects to constrain the movement to horizontal or vertical directions.12[GSU]15Editing graphsAdd text,lines,or markers(with optional labels)to your graph by using the three Add...tools—,,and.Lines can be changed to arrows by using the Contextual Toolbar.If you do not like the default properties,simply change their settings in the Contextual Toolbar before adding the text,line,or marker.The new settings will then be applied to all added objects,even in future Stata sessions.Do not be afraid to try things.If you do not like a result,change it back by using the same tool or by clicking on the Undo button,,in the Standard Toolbar for the Graph Editor(below the main menu).Edit>Undo in the main menu does the same thing.Remember to reselect the Pointer tool when you want to drag objects or change their properties.You can move objects on the graph and have the rest of the objects adjust their position to accommodate the move with the Grid edit tool,.With this tool,you are repositioning objects in the underlying grid that holds the objects in the graph.Some graphs,for example,by graphs,are composed of nested grids.You can reposition objects only within the grid that contains them;they cannot be moved to other grids.You can also select objects in the Object Browser along the right of the graph.This window shows a hierarchical listing of the objects in the graph.Clicking or right-clicking on an object in the Object Browser is the same as clicking or right-clicking on the object in the graph.The Graph Editor has the ability to record your actions and play them back on later graphs.When you click on the Start recording button,,every editing action you take,including undos and redos,is recorded.If you would like to do some editing that is not recorded,you can click on the Pause recording button,.You can click on the Pause recording button again to resume recording. When you are done with your recording,click on the Start recording button.You will be prompted to save your recording.Any recording you save is available from the Play recording button,, and may be applied to future graphs.You can even play a recording in any Stata graph command by using the play option.See Graph Recorder in[G-1]Graph Editor for more information.Stop the editor by selecting File>Stop Graph Editor from the main menu or by clicking on the Graph Editor button.When you stop the Graph Editor,you will be prompted to save your graph if you have made any changes.If you do not save your graph,your changes will not be lost,but you will risk losing them if you create a new graph in the same Graph window.You must stop the Editor if you would like to work on other tasks in Stata.Here are a few of the things that you can do with the Editor:•Add annotations using lines,arrows,and text.•Add or remove grid lines or reference lines.•Add or modify titles,captions,and notes.•Change scatterplots to line plots,connected plots,areas,bars,spikes,or drop lines—and,of course,vice versa.•Change the size,color,margin,and other properties of your graph’s titles(or any other text on the graph).•Move your legend to another side of the graph,or even place it in the plot region.•Change the aspect ratio of your graph.•Stack the bars on a bar graph or turn them into percentages.•Rotate or change the angle of axis labels.•Add custom ticks and labels to the axes.•Change the rule for the number and spacing of ticks and labels on an axis.[GSU]15Editing graphs3•Emphasize a point on the graph,whether marker,bar,spike,or other plot,by making it a custom color,size,or symbol.•Change the text or properties of a marker label.Because you can edit every property of every object on the graph,you can change almost anything about your graph.To learn more,see[G-1]Graph Editor or type help graph editor.4[GSU]15Editing graphsStata,Stata Press,and Mata are registered trademarks of StataCorp LLC.Stata andStata Press are registered trademarks with the World Intellectual Property Organization®of the United Nations.Other brand and product names are registered trademarks ortrademarks of their respective companies.Copyright c 1985–2023StataCorp LLC,College Station,TX,USA.All rights reserved.。
getdata方法

getdata方法
getdata方法是一个常见的编程方法,它可以用来获取数据。
在编程中,我们通常需要从外部获取数据,比如从文件、网络或数据库中读取数据,而getdata方法就是用来实现这个功能的。
getdata方法通常包含以下几个步骤:
1. 打开数据源:在使用getdata方法之前,我们需要先打开数据源,比如打开文件、连接数据库等。
2. 读取数据:一旦数据源被打开,我们就可以读取数据了。
读取数据的方式可以根据具体需求来选择,比如逐行读取、逐个字符读取等。
3. 处理数据:在读取完数据之后,我们通常需要对数据进行一些处理,比如解析数据、转换数据类型等。
4. 关闭数据源:在数据处理完成后,我们需要关闭数据源,释放资源。
getdata方法是一个非常重要的方法,它可以帮助我们快速地获取数据并进行处理。
在实际编程中,我们经常会用到getdata方法,因此熟练掌握这个方法是非常有必要的。
- 1 -。
Getdata Dragh Digitizer完整详解版教程解析
Getdata的数据保存:
Save workspace……
以导出为excel为例
与line相对应的两列 左列为X,右列为Y
超链接: 软件及其附件下载
基本步骤
图像的生成与导入、基准点与取值范围确定、提取点坐标、导出数据
步骤一:图像的生成与导入
图像生成
1、直接截图保存
建议使用QQ截图,使用 快捷键Alt+Ctrl+A 。
2、扫描文档后截图保存
主要针对非电子文档,后续步骤同上。 *支持的图像格式TIF、JPEG、PCX、BMP
(此图见附件:示例)
Digitizer area
鉴于绝大多数函数都是 以X为自变量,则按照作 图所示选择。 采样间距dx不能过于小。 Shfit X……感觉没实质 性作用。
拖动黑色实心鼠标划采样矩形格
步骤四:导出数据 得到坐标点之后即可导出数据 数据输出的格式:
TXT XLS DXF EPS XML (text file) (Excel) (AutoCAD) (PostScript)
图像导入
*支持的图像格式TIF、JPEG、PCX、BMP
步骤二:基准点与取值范围确定
一、默认选定: Default axes 默认图片左下角为原点 二、手动设定: Set the scale 1. Set Xmin 位置 Set Xmin 大小 2. Set Xmax 位置 Set Xmax 大小 3. Set Ymin 位置 Set Ymin 大小 4. Set Ymax 位置 Set Ymax 大小 大小可在Adjust……中再次修改。修改X/Y的大小,所有的X/Y会相 应地变大或小。 三、调整坐标实际取值范围 Adjust the scale 调整范围
GetData Graph Digitizer使用方法
1 启动GetData Graph Digitizer,打开要处理的图像文件;
2 设置背景颜色和曲线颜色(“操作->设定背景/线段颜色”),后续拾取数值点的操作要基于颜色信息;
3 设置坐标轴的位置和起始值范围(“操作->设定标尺刻度”)
4 “操作->数字化区域”,启动“数字化区域”方法提取数据点,曲线上提取点的密度由“操作->数字化区域->栅格设置”下dx的值控制(值越大越稀疏),设置好栅格后鼠标变为黑色箭头,用之拖出一个矩形区域,区域内部的曲线就会被自动提取了。这种方法的好处是可以非常简单的(一次操作)提取出所有的数据点,如果选上了不想要的点可以用“操作->数据点移除器”去除,如果点的顺序不对可以用“操作->重新排序工具”改为正确的顺序;
使用“GetData Graph Digitizer”从图像文件中提取X-Y数值点
使用场合:1、想引用别人论文中的某个数据(曲线)图,但论文中没有这个图的数据,直接把图抓过来显得太逊了,希望提取出这个图中的数据信息生成矢量图;2、希望从这个图中提取出数据用于自己的研究;
软件来源:此软件由俄国人开发(好多这种功能强大的小软件都是俄国人开发的,pfpf)上可以下载到试用版,21天的试用期,好像无功能限制,目前最新版本:2.24,有中文和英文界面可供选择,其他有俄文、乌克兰文、日文、朝鲜文,居然还有印度尼西亚文(开发者有印尼朋友?);
4 “设置->语言”中可以更改界面的语言;
4.1 另一种“自动跟踪线段”方法需要多次手工选取曲线上的点,比较麻烦;
另:1 选刻度点的时候,微调鼠标位置的方法是按住Ctrl再移动鼠标;
2 如果有两条颜色不同的数据线,只需要抓其中一条,则可以指定线条颜色和背景颜色,这样就不会受另一条线的干扰了;
getdataids方法
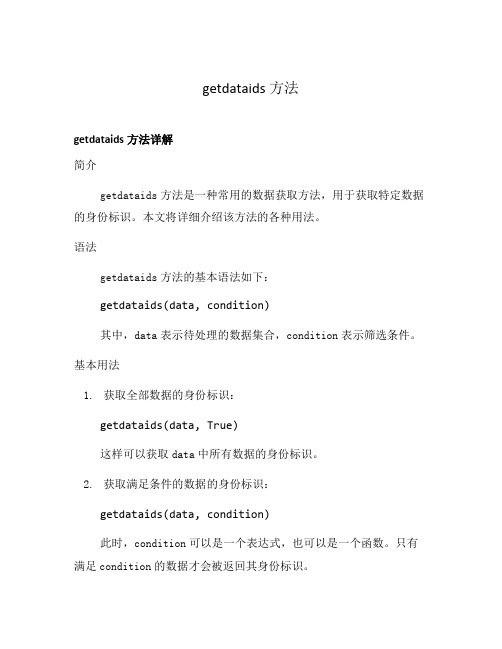
getdataids方法getdataids方法详解简介getdataids方法是一种常用的数据获取方法,用于获取特定数据的身份标识。
本文将详细介绍该方法的各种用法。
语法getdataids方法的基本语法如下:getdataids(data, condition)其中,data表示待处理的数据集合,condition表示筛选条件。
基本用法1.获取全部数据的身份标识:getdataids(data, True)这样可以获取data中所有数据的身份标识。
2.获取满足条件的数据的身份标识:getdataids(data, condition)此时,condition可以是一个表达式,也可以是一个函数。
只有满足condition的数据才会被返回其身份标识。
匿名函数用法可以使用匿名函数来灵活定义筛选条件。
例如,筛选data中年龄大于30的数据:getdataids(data, lambda x: x['age'] > 30)这里的lambda函数定义了一个只有一个参数x的函数,其返回值为x[‘age’]是否大于30。
逻辑运算符用法可以使用逻辑运算符来组合筛选条件。
例如,筛选data中年龄大于30且性别为女性的数据:getdataids(data, lambda x: x['age'] > 30 and x['gen der'] == 'female')这里使用了and运算符将两个筛选条件进行了组合。
总结getdataids方法是一种灵活且常用的数据获取方法,可以根据特定的条件获取数据的身份标识。
通过匿名函数和逻辑运算符的运用,可以实现更加复杂的筛选条件。
以上就是关于getdataids方法的详细介绍,希望能对您在创作过程中有所帮助!getdataids方法的高级应用筛选多个条件除了使用逻辑运算符组合多个筛选条件外,还可以使用列表推导式来筛选满足多个条件的数据。
GetData 图数字化仪使用方法
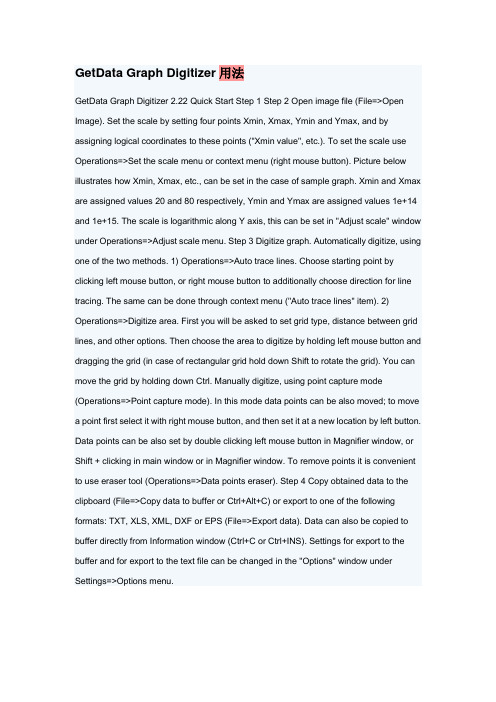
GetData Graph Digitizer用法GetData Graph Digitizer 2.22 Quick Start Step 1 Step 2 Open image file (File=>Open Image). Set the scale by setting four points Xmin, Xmax, Ymin and Ymax, and by assigning logical coordinates to these points ("Xmin value", etc.). To set the scale use Operations=>Set the scale menu or context menu (right mouse button). Picture below illustrates how Xmin, Xmax, etc., can be set in the case of sample graph. Xmin and Xmax are assigned values 20 and 80 respectively, Ymin and Ymax are assigned values 1e+14 and 1e+15. The scale is logarithmic along Y axis, this can be set in "Adjust scale" window under Operations=>Adjust scale menu. Step 3 Digitize graph. Automatically digitize, using one of the two methods. 1) Operations=>Auto trace lines. Choose starting point by clicking left mouse button, or right mouse button to additionally choose direction for line tracing. The same can be done through context menu ("Auto trace lines" item). 2) Operations=>Digitize area. First you will be asked to set grid type, distance between grid lines, and other options. Then choose the area to digitize by holding left mouse button and dragging the grid (in case of rectangular grid hold down Shift to rotate the grid). You can move the grid by holding down Ctrl. Manually digitize, using point capture mode (Operations=>Point capture mode). In this mode data points can be also moved; to move a point first select it with right mouse button, and then set it at a new location by left button. Data points can be also set by double clicking left mouse button in Magnifier window, or Shift + clicking in main window or in Magnifier window. To remove points it is convenient to use eraser tool (Operations=>Data points eraser). Step 4 Copy obtained data to the clipboard (File=>Copy data to buffer or Ctrl+Alt+C) or export to one of the following formats: TXT, XLS, XML, DXF or EPS (File=>Export data). Data can also be copied to buffer directly from Information window (Ctrl+C or Ctrl+INS). Settings for export to the buffer and for export to the text file can be changed in the "Options" window under Settings=>Options menu.GetData 图数字化仪2.22 快速启动步骤1 步骤2 打开图像文件(文件= > 打开图像)。
曲线图转数据工具软件(EngaugeDigitizer)提取文献中的数据
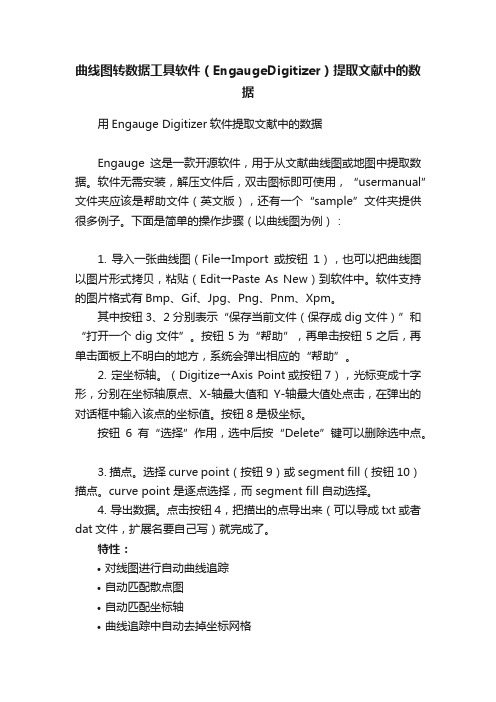
曲线图转数据工具软件(EngaugeDigitizer)提取文献中的数据用Engauge Digitizer软件提取文献中的数据Engauge这是一款开源软件,用于从文献曲线图或地图中提取数据。
软件无需安装,解压文件后,双击图标即可使用,“usermanual”文件夹应该是帮助文件(英文版),还有一个“sample”文件夹提供很多例子。
下面是简单的操作步骤(以曲线图为例):1. 导入一张曲线图(File→Import或按钮1),也可以把曲线图以图片形式拷贝,粘贴(Edit→Paste As New)到软件中。
软件支持的图片格式有Bmp、Gif、Jpg、Png、Pnm、Xpm。
其中按钮3、2分别表示“保存当前文件(保存成dig文件)”和“打开一个dig文件”。
按钮5为“帮助”,再单击按钮5之后,再单击面板上不明白的地方,系统会弹出相应的“帮助”。
2. 定坐标轴。
(Digitize→Axis Point或按钮7),光标变成十字形,分别在坐标轴原点、X-轴最大值和Y-轴最大值处点击,在弹出的对话框中输入该点的坐标值。
按钮8是极坐标。
按钮6有“选择”作用,选中后按“Delete”键可以删除选中点。
3. 描点。
选择curve point(按钮9)或 segment fill(按钮10)描点。
curve point 是逐点选择,而 segment fill 自动选择。
4. 导出数据。
点击按钮4,把描出的点导出来(可以导成txt或者dat文件,扩展名要自己写)就完成了。
特性:•对线图进行自动曲线追踪•自动匹配散点图•自动匹配坐标轴•曲线追踪中自动去掉坐标网格•处理各种坐标系(笛卡尔坐标系、极坐标系、线性坐标系及对数坐标系)•支持多种平台 (Linux, Mac OSX, Windows)•支持多种图形文件格式(BMP, GIF, JPEG, PNG and XPM)•可导出到多种软件(Microsoft Excel, OpenOffice CALC, gnuplot, gnumeric, MATLAB and Mathematica)案例与问题:用engauge digitizer提取曲线上的点代表的数据之后,在把提取的K-M图上的数据根据07年tierney中的那个excel表进行提取HR 时,出现了卡壳现象:1.因为生存曲线图一般都是两条以上曲线(实验组和对照组),在带入07年tierney中的那个excel表提取HR时,需要在一个统一的时间点中,那么在提取数据时怎么样保证两条曲线提取数据时他们横坐标(即时间点)是一样的呢?2. 用engauge digitizer提取曲线上的数据带入07年tierney那个excel表中,我也大概能求出一个HR值,但是不清楚自己求出的对不对,哪位牛人可以指点下啊?(3a)_Curve_Data_with_n(risk)和(2a)_Curve_Data在使用上是不是只能取50个点呢?(1)_Summary_Data这个sheet是不是没有啥用啊?处理方案:step1:取图黑色线代表某因素阳性的,红色线代表某因素阴性的。
Gea使用教程全

应地变大或小。 三、调整坐标实际取值范围
Adjust the scale 调整范围
Log scale along X/Y axis 坐标轴为对数时使用
手动设定基准点
此图选原点为基准点最佳
在基准点(即是X轴最小值处)处单击。
输入X轴最小值,为0。
X轴最大值处单击。
输入X轴最大值。与实际坐标轴一致。 Xmax与Xmin确定了X轴的基准线。Y轴同理。
点击左图圈出点, 一次获取线上点。
使用鼠标滑轮可放大 缩小图片。
橡皮图标可删除已录 入的点。
录入的点数据虽然在Data中的排序能改变,但在最终导出的文件(如 excel)中是以最初录入顺序从上到下排列。 只能在导出文件中另行修改。
如需获取另外一条线上的数 据,点击“current,status”, 然后点击“Add line”.
拖动黑色实心鼠标划采样导出数据 数据输出的格式:
TXT (text file) XLS (Excel) DXF (AutoCAD) EPS (PostScript) XML
Getdata的数据保存:
Save workspace……
以导出为excel为例
与line相对应的两列 左列为X,右列为Y
从而得到实际图像上的实际点坐标,并可以输出成需要的格式。
这一类软件比较多,还有:
Getdata Dragh Digitizer
python中getdata语法
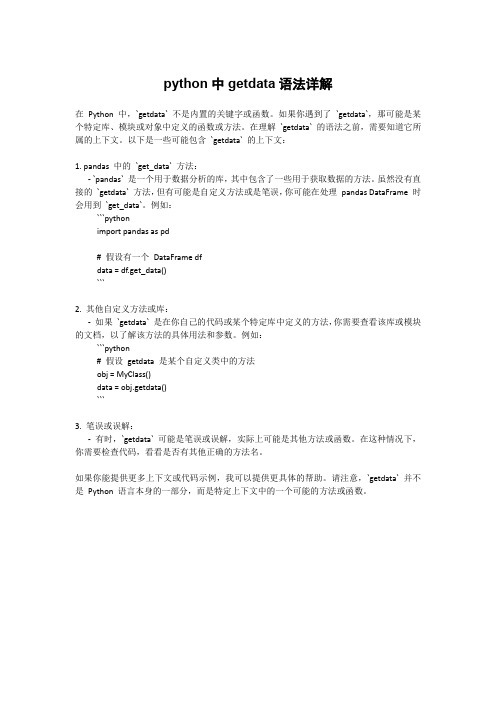
python中getdata语法详解
在Python 中,`getdata` 不是内置的关键字或函数。
如果你遇到了`getdata`,那可能是某个特定库、模块或对象中定义的函数或方法。
在理解`getdata` 的语法之前,需要知道它所属的上下文。
以下是一些可能包含`getdata` 的上下文:
1. pandas 中的`get_data` 方法:
- `pandas` 是一个用于数据分析的库,其中包含了一些用于获取数据的方法。
虽然没有直接的`getdata` 方法,但有可能是自定义方法或是笔误,你可能在处理pandas DataFrame 时会用到`get_data`。
例如:
```python
import pandas as pd
# 假设有一个DataFrame df
data = df.get_data()
```
2. 其他自定义方法或库:
-如果`getdata` 是在你自己的代码或某个特定库中定义的方法,你需要查看该库或模块的文档,以了解该方法的具体用法和参数。
例如:
```python
# 假设getdata 是某个自定义类中的方法
obj = MyClass()
data = obj.getdata()
```
3. 笔误或误解:
-有时,`getdata` 可能是笔误或误解,实际上可能是其他方法或函数。
在这种情况下,你需要检查代码,看看是否有其他正确的方法名。
如果你能提供更多上下文或代码示例,我可以提供更具体的帮助。
请注意,`getdata` 并不是Python 语言本身的一部分,而是特定上下文中的一个可能的方法或函数。
替雷利珠单抗联合化疗一线治疗局部晚期不可切除或转移性胃或胃食管结合部腺癌的成本-效果分析
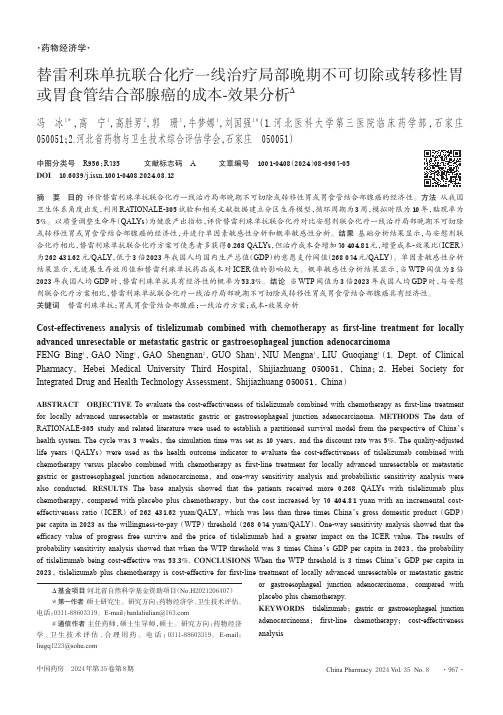
·药物经济学·替雷利珠单抗联合化疗一线治疗局部晚期不可切除或转移性胃或胃食管结合部腺癌的成本-效果分析Δ冯冰 1*,高宁 1,高胜男 2,郭珊 1,牛梦娜 1,刘国强 1 #(1.河北医科大学第三医院临床药学部,石家庄 050051;2.河北省药物与卫生技术综合评估学会,石家庄 050051)中图分类号 R 956;R 735 文献标志码 A 文章编号 1001-0408(2024)08-0967-05DOI 10.6039/j.issn.1001-0408.2024.08.12摘要 目的 评价替雷利珠单抗联合化疗一线治疗局部晚期不可切除或转移性胃或胃食管结合部腺癌的经济性。
方法 从我国卫生体系角度出发,利用RATIONALE-305试验和相关文献数据建立分区生存模型,循环周期为3周,模拟时限为10年,贴现率为5%。
以质量调整生命年(QALYs )为健康产出指标,评价替雷利珠单抗联合化疗对比安慰剂联合化疗一线治疗局部晚期不可切除或转移性胃或胃食管结合部腺癌的经济性,并进行单因素敏感性分析和概率敏感性分析。
结果 基础分析结果显示,与安慰剂联合化疗相比,替雷利珠单抗联合化疗方案可使患者多获得0.268 QALYs ,但治疗成本会增加70 404.81元,增量成本-效果比(ICER )为262 431.62元/QALY ,低于3倍2023年我国人均国内生产总值(GDP )的意愿支付阈值(268 074元/QALY )。
单因素敏感性分析结果显示,无进展生存效用值和替雷利珠单抗药品成本对ICER 值的影响较大。
概率敏感性分析结果显示,当WTP 阈值为3倍2023年我国人均GDP 时,替雷利珠单抗具有经济性的概率为53.3%。
结论 当WTP 阈值为3倍2023年我国人均GDP 时,与安慰剂联合化疗方案相比,替雷利珠单抗联合化疗一线治疗局部晚期不可切除或转移性胃或胃食管结合部腺癌具有经济性。
digitize包—使用R从发布图表中获取数据的指南说明书
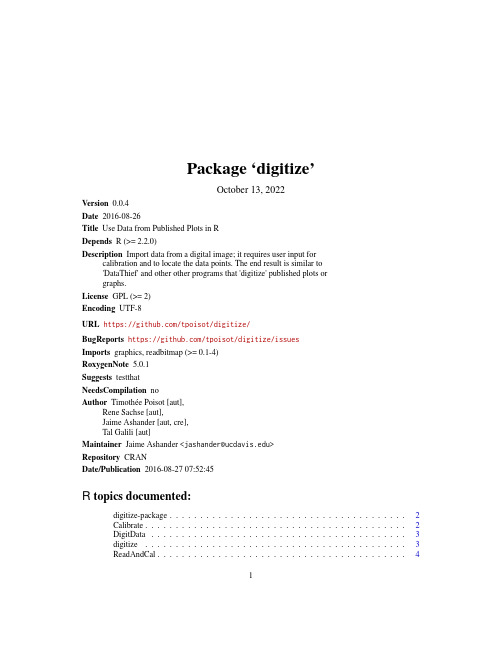
Package‘digitize’October13,2022Version0.0.4Date2016-08-26Title Use Data from Published Plots in RDepends R(>=2.2.0)Description Import data from a digital image;it requires user input forcalibration and to locate the data points.The end result is similar to'DataThief'and other other programs that'digitize'published plots orgraphs.License GPL(>=2)Encoding UTF-8URL https:///tpoisot/digitize/BugReports https:///tpoisot/digitize/issuesImports graphics,readbitmap(>=0.1-4)RoxygenNote5.0.1Suggests testthatNeedsCompilation noAuthor Timothée Poisot[aut],Rene Sachse[aut],Jaime Ashander[aut,cre],Tal Galili[aut]Maintainer Jaime Ashander<*********************>Repository CRANDate/Publication2016-08-2707:52:45R topics documented:digitize-package (2)Calibrate (2)DigitData (3)digitize (3)ReadAndCal (4)12Calibrate Index6 digitize-package digitize:a plot digitizer in RDescriptionGet data from a graph by providing calibration pointsDetailsThe package provides one main function,‘digitize‘,which runs functions that1)Read the image in and calibrate it,and2)Digitize the data.Thefirst step requires user input.Calibrate(deprecated)Digitize the dataDescription(deprecated)Digitize the dataUsageCalibrate(data,calpoints,x1,x2,y1,y2)Argumentsdata output of‘DigitData‘calpoints output of‘ReadAndCal‘x1X-coordinate of the leftmost x point(corrected)x2X-coordinate of the rightmost x point(corrected)y1Y-coordinate of the lower y point(corrected)y2Y-coordinate of the upper y point(corrected)Detailsdeprecated.This function corrects the data according to the calibration age further explained at /index.php/2011/06/digitizing-data-from-old-plots-using-digitize/ Value‘data‘A data frame with the corrected coordinates of the pointsExamples##Not run:Calibrate(data,calpoints,x1,x2,y1,y2)DigitData3 DigitData(deprecated)Mark the data on an imageDescription(deprecated)Mark the data on an imageUsageDigitData(col="red",type="p",...)Argumentscol color of marker as in‘par‘type shape of marker as in‘par‘...other args for‘locator‘Detailsdeprecated.This function waits for the user to click the points of the coordinates.See‘graph-ics::locator‘for age explained at /index.php/2011/06/digitizing-data-from-old-plots-using-digitize/Value‘data‘A list with the coordinates of the pointsdigitize digitize an imageDescriptiondigitize an imageUsagedigitize(image_filename,...,x1,x2,y1,y2)Argumentsimage_filename the imagefile you wish to digitze...pass parameters col or type to change data calibration pointsx1(optional)left-most x-axis pointx2(optional)right-most axis pointy1(optional)the lower y-axis pointy2(optional)the upper y-axis pointDetailsProceeds in two steps,both of which require user input from the mouse:1)Read the image in and calibrate it2)Digitize the dataCalibration points are optionally passed via arguments x1,x2,y1,y2.These**must be named in full**if passed.If not specified,you are prompted to enter these in the console.Note,you don’t need to choose the end points of each axis,only two points for which you know the x or y return.Valuea data.frame containing the digitized dataExamples##Not run:tmp<-tempfile()png(tmp)plot(rnorm(10)+1:10,xlab="x",ylab="y")dev.off()mydata<-digitize(tmp)##End(Not run)ReadAndCal(deprecated)Read image and calibrateDescription(deprecated)Read image and calibrateUsageReadAndCal(fname)Argumentsfname Filename of the graphic to readDetailsdeprecated.Called for side effect of user locating points.See‘graphics::locator‘for age explained at /index.php/2011/06/digitizing-data-from-old-plots-using-digitize/ Value‘calpoints‘List of the x and y coordinates of the calibration pointsExamples##Not run:ReadAndCal(fname)IndexCalibrate,2DigitData,3digitize,3digitize-package,2ReadAndCal,46。
origin9.0教程中文版digitizer插件的使用方法
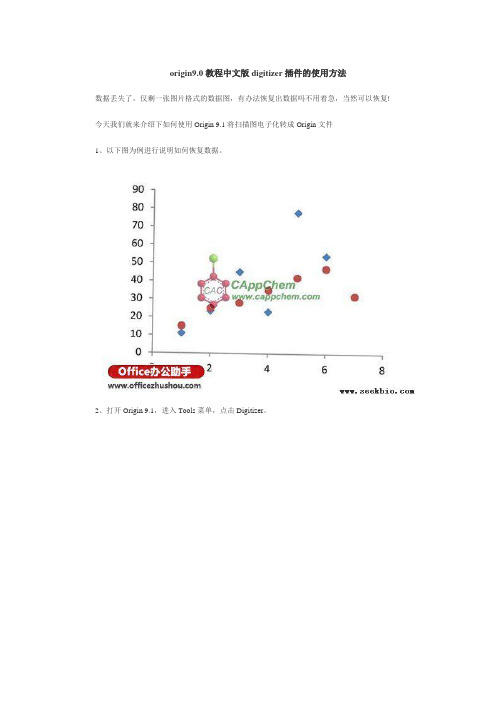
origin9.0教程中文版digitizer插件的使用方法数据丢失了,仅剩一张图片格式的数据图,有办法恢复出数据吗不用着急,当然可以恢复! 今天我们就来介绍下如何使用Origin 9.1将扫描图电子化转成Origin文件1、以下图为例进行说明如何恢复数据。
2、打开Origin 9.1,进入Tools菜单,点击Digitizer。
3、在弹出的Digitizer界面中点击Import按钮(红色方框内)。
4、选中前面提供的数据图,导入后的效果图如下。
5、导入完成后,坐标系有些倾斜。
此时可以点击Digitizer下的Rotate Image按钮,在下面Ratation Angle from Source Image填入旋转角度,将坐标系调正即可。
6、坐标系调正后的效果图如下。
接下来就要定义坐标系了。
7、点击Digitizer下的Edit Axes按钮,通过修改各坐标轴(X1, X2, Y1,Y2)的Image Pixel调节其位置。
通过修改Axis Value确定各坐标轴的坐标值。
8、完成上述坐标校准工作后,得到如下效果图。
9、点击Digitizer下的Pick New Points按钮,用十字光标按顺序双击各点。
将第一组数据全部点击完成后,点击按钮“Done”。
10、切换到Digitizer界面后,点击Go To Data按钮(红色标记内)。
11、此时Origin 9.1会自动切换到刚刚生成的数据页面。
12、完成第一组后,先点击Start New Data。
然后再点击Pick New Points按钮,开始电子化下一组数据点。
13、按照步骤9的方式,选取下一组数据。
14、按照步骤10点击Go To Data按钮,即可切换到数据页面看到新增的一组数据。
15、使用刚刚获取的数据重绘图形,得到的效果图如下。
是不是和原图一样呢。
教程-Getdata Dragh Digitizer图片数据提取软件的使用方法

Getdata Dragh Digitizer 图片数据提取软件的使用方法Getdata Dragh Digitizer的使用背景•在科技论文写作过程中,需要将自己的数据和前人成果进行对比。
为了从别人的论文中得到原始数据,往往需要从曲线图中自主提取数据,这就需要用到今天介绍的GetData Graph Digitizer这一款软件。
•我们可以通过设置坐标轴以及刻度大小提取图片上的坐标点,以获取我们所需要的数据。
下面将对该软件的下载及使用流程进行介绍。
Getdata Dragh Digitizer的使用简介•Getdata Dragh Digitizer主要是用来数字化图表、地图等图像类文件,从而得到图像上的点数据,并可以输出成需要的格式。
•支持的图像格式TIFF、JPEG 、PCX 、BMP•输出的数据格式TXT (text file)XLS (Excel)DXF (AutoCAD)EPS (PostScript)XML•简要使用步骤:图像生成与导入坐标选定与调整获取数据输出数据步骤一:图像的生成与导入图像生成1. 扫描纸张上的曲线图,可以直接扫描成Getdata支持的图片2. 截图软件(针对文献里面的曲线图)使用截图软件截图,保存成Getdata支持的图片格式使用Ctrl+ Print Screen,但是这个截出来的是整个桌面上的图片,不是很方便使用QQ截图3. 建议使用QQ截图,使用快捷键Alt+Ctrl+A,用鼠标右键还可以进行简单的编辑步骤二:选定坐标一、缺省选定:set default axes 二、自己设定:set the scale1.Set Xmin 位置Set Xmin 大小2.Set Xmax 位置Set Xmax 大小3.Set Ymin 位置Set Ymin 大小4.Set Ymax 位置Set Ymax 大小三、调整坐标界限Adjust the scale 重新设置X 和Y 的范围步骤一:图像的生成与导入步骤二:选定坐标Set the scale步骤二:选定坐标Set Xmin位置步骤二:选定坐标Set Xmin大小步骤二:选定坐标Set Xmax 位置步骤二:选定坐标Set Xmax大小步骤二:选定坐标Set Ymin位置步骤二:选定坐标Set Ymin大小步骤二:选定坐标Set Ymax位置步骤二:选定坐标Set Ymax大小步骤二:选定坐标调整坐标界限步骤三:获取数据获取数据的三种方法◆Point capture mode◆Auto trace lines◆Digitizer area步骤三:获取数据Point capture mode步骤三:获取数据Point capture mode步骤三:获取数据Auto trace lines 步骤三:获取数据Auto trace lines步骤三:获取数据Auto trace lines右键选取部分数据步骤三:获取数据Auto trace lines右键选取部分数据步骤四:数据的输出与保存数据输出的格式:◆TXT (text file)◆XLS (Excel)◆DXF (AutoCAD)◆EPS (PostScript)◆XML数据的保存:保存为:workspaceGetdata Dragh Digitizer的使用方法谢谢!。
- 1、下载文档前请自行甄别文档内容的完整性,平台不提供额外的编辑、内容补充、找答案等附加服务。
- 2、"仅部分预览"的文档,不可在线预览部分如存在完整性等问题,可反馈申请退款(可完整预览的文档不适用该条件!)。
- 3、如文档侵犯您的权益,请联系客服反馈,我们会尽快为您处理(人工客服工作时间:9:00-18:30)。
自此,基准点与XY轴取值范围确定结束。
步骤三:提取点坐标
获取数据的三种方法
Point capture mode 适用于点折线
Auto trace lines 适用于连续函数图像
Digitizer area 适用于提取部分函数图像
Point capture mode
使用鼠标滑轮可放大 缩小图片。
ቤተ መጻሕፍቲ ባይዱ
Digitizer area
鉴于绝大多数函数都是 以X为自变量,则按照作 图所示选择。 采样间距dx不能过于小。 Shfit X……感觉没实质 性作用。
拖动黑色实心鼠标划采样矩形格
步骤四:导出数据 得到坐标点之后即可导出数据 数据输出的格式:
TXT XLS DXF EPS XML (text file) (Excel) (AutoCAD) (PostScript)
图像导入
*支持的图像格式TIF、JPEG、PCX、BMP
步骤二:基准点与取值范围确定
一、默认选定: Default axes 默认图片左下角为原点 二、手动设定: Set the scale 1. Set Xmin 位置 Set Xmin 大小 2. Set Xmax 位置 Set Xmax 大小 3. Set Ymin 位置 Set Ymin 大小 4. Set Ymax 位置 Set Ymax 大小 大小可在Adjust……中再次修改。修改X/Y的大小,所有的X/Y会相 应地变大或小。 三、调整坐标实际取值范围 Adjust the scale 调整范围
Log scale along X/Y axis 坐标轴为对数时使用
手动设定基准点
此图选原点为基准点最佳
在基准点(即是X轴最小值处)处单击。
输入X轴最小值,为0。
X轴最大值处单击。
输入X轴最大值。与实际坐标轴一致。 Xmax与Xmin确定了X轴的基准线。Y轴同理。
Y轴最小值处单击。
Y轴最小值。与实际坐标轴一致
Getdata Dragh Digitizer教程
Wchampion
Getdata Dragh Digitizer简介
使用范围
如果你面前只有一张二维曲线图,点数据丢了, 或者根本就不存在。这时你想 用Excel或者Origin重现出来,这款软件就能助你一臂之力。
基本原理
Getdata Dragh Digitizer主要是将图像类文件数字化,通过像素的排布从而得 到实际图像上的实际点坐标,并可以输出成需要的格式。 这一类软件比较多,还有: Getdata Dragh Digitizer Un-Scan-It FindGraph DigitizeXY
橡皮图标可删除已录 入的点。
录入的点数据虽然在Data中的排序能改变,但在最终导出的文件(如 excel)中是以最初录入顺序从上到下排列。 只能在导出文件中另行修改。
新点线添加的按钮
Auto trace lines
GetData自带实 例图sample3
尽量选择端点作为起始点。 *此图的基准点选为(-3.25,-1.05) 可以认为此基准线的选取,可以将任意斜坐标系,画为直角坐标系。
基本步骤
图像的生成与导入、基准点与取值范围确定、提取点坐标、导出数据
步骤一:图像的生成与导入
图像生成
1、直接截图保存
建议使用QQ截图,使用 快捷键Alt+Ctrl+A 。
2、扫描文档后截图保存
主要针对非电子文档,后续步骤同上。 *支持的图像格式TIF、JPEG、PCX、BMP
(此图见附件:示例)
Getdata的数据保存:
Save workspace……
以导出为excel为例
与line相对应的两列 左列为X,右列为Y
超链接: 软件及其附件下载