一个实例搞定MATLAB界面编程
MATLAB程序设计及应用实例

MATLAB程序设计及应用实例MATLAB程序设计及应用实例一、引言1.1 研究背景1.2 目的和意义二、MATLAB入门2.1 MATLAB的基本概念2.2 MATLAB环境的配置2.3 MATLAB的基本操作2.4 基本数据类型和变量2.5 控制语句和循环结构三、向量和矩阵运算3.1 向量的定义和运算3.2 矩阵的定义和运算3.3 矩阵的转置、共轭和逆3.4 特殊矩阵的和操作3.5 矩阵的行列式和特征值计算四、函数的定义和调用4.1 函数的定义和语法4.2 函数的输入和输出参数4.3 匿名函数和内嵌函数4.4 函数的调试和错误处理五、图形化界面设计5.1 MATLAB的图形化界面工具箱5.2 GUI的设计和布局5.3 控件的属性设置和事件处理5.4 图像的读取和处理5.5 图表的绘制和交互操作六、数据分析与统计6.1 数据的导入和导出6.2 数据的预处理和清洗6.3 常用的数据统计和分析方法6.4 数据可视化和结果展示七、信号处理与图像处理7.1 信号的和处理7.2 傅里叶变换和频域分析7.3 滤波器的设计和应用7.4 图像的读取和处理7.5 图像的增强和分割八、机器学习与深度学习8.1 机器学习算法的基本原理8.2 机器学习工具箱的使用8.3 深度学习算法的基本原理8.4 深度学习工具箱的使用8.5 实例:图像分类和预测九、应用实例9.1 实例1:图像处理与分析9.2 实例2:信号处理与模式识别9.3 实例3:数据挖掘与预测十、总结与展望10.1 主要研究成果总结10.2 存在的问题和不足10.3 下一步工作的展望本文档涉及附件:- 附件1:MATLAB代码示例- 附件2:实验数据集法律名词及注释:- 版权:对创作作品的控制权和使用权的法律保护。
- 许可证:允许某人使用或复制作品的法律文件。
matlab创建gui界面的方法

matlab创建gui界面的方法
在MATLAB中创建GUI界面可以使用MATLAB的GUI设计工具。
下面是
一些基本步骤:
1. 在MATLAB命令窗口中输入`guide`,然后按Enter键打开GUI设计器。
2. 在GUI设计器中,选择一个预定义的模板或创建一个新的GUI。
3. 使用GUI设计器中的工具栏和属性编辑器来添加和配置GUI组件,例如
按钮、文本框和滑动条等。
4. 设置每个组件的回调函数,以便在用户与组件交互时执行特定的操作。
5. 保存并运行GUI,以测试其功能和性能。
需要注意的是,GUI设计器是MATLAB的一个可选组件,因此需要确保已
安装该组件才能使用它。
此外,创建复杂的GUI可能需要一定的MATLAB
编程经验和对GUI组件的深入了解。
用MATLAB制作图形用户界面
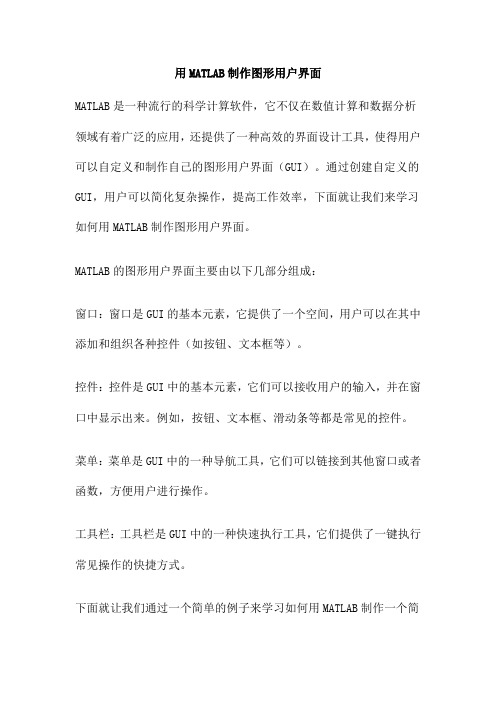
用MATLAB制作图形用户界面MATLAB是一种流行的科学计算软件,它不仅在数值计算和数据分析领域有着广泛的应用,还提供了一种高效的界面设计工具,使得用户可以自定义和制作自己的图形用户界面(GUI)。
通过创建自定义的GUI,用户可以简化复杂操作,提高工作效率,下面就让我们来学习如何用MATLAB制作图形用户界面。
MATLAB的图形用户界面主要由以下几部分组成:窗口:窗口是GUI的基本元素,它提供了一个空间,用户可以在其中添加和组织各种控件(如按钮、文本框等)。
控件:控件是GUI中的基本元素,它们可以接收用户的输入,并在窗口中显示出来。
例如,按钮、文本框、滑动条等都是常见的控件。
菜单:菜单是GUI中的一种导航工具,它们可以链接到其他窗口或者函数,方便用户进行操作。
工具栏:工具栏是GUI中的一种快速执行工具,它们提供了一键执行常见操作的快捷方式。
下面就让我们通过一个简单的例子来学习如何用MATLAB制作一个简单的图形用户界面:打开MATLAB,在命令窗口输入“guide”,并按Enter键。
这将打开GUI设计工具。
在打开的GUI设计工具中,选择“Blank GUI”并点击“OK”,进入GUI编辑器。
在GUI编辑器中,你可以看到一个空白的窗口和一些控件。
你可以通过拖拽的方式将这些控件添加到窗口中。
选中你添加的控件,在右侧的“Properties”面板中,你可以修改控件的属性,如颜色、字体、大小等。
在设计完成后,点击“Save”按钮,保存你的GUI。
此时,MATLAB会生成一个.fig文件和一个.m文件。
其中.fig文件是GUI的图形文件,而.m文件包含了GUI的代码。
在生成的.m文件中,你可以编写控件的事件处理函数。
例如,当用户点击按钮时,应该执行什么样的操作。
在编写完事件处理函数后,你就可以运行你的GUI了。
在命令窗口输入“edit(gcf)”,然后按Enter键,就可以打开你的GUI并进行测试了。
MATLAB图形用户界面设计与开发教程
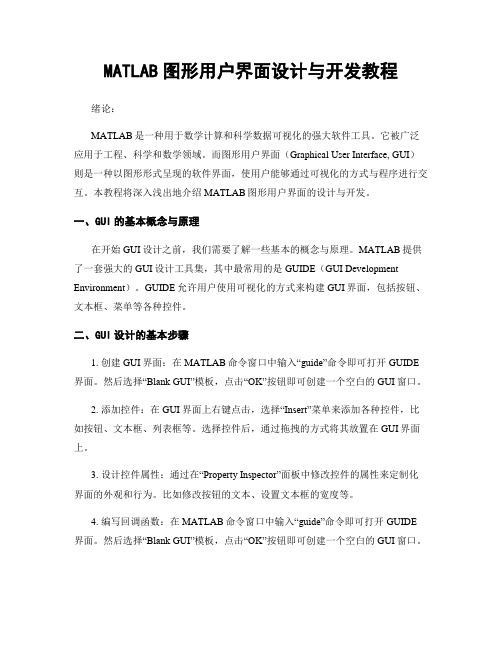
MATLAB图形用户界面设计与开发教程绪论:MATLAB是一种用于数学计算和科学数据可视化的强大软件工具。
它被广泛应用于工程、科学和数学领域。
而图形用户界面(Graphical User Interface, GUI)则是一种以图形形式呈现的软件界面,使用户能够通过可视化的方式与程序进行交互。
本教程将深入浅出地介绍MATLAB图形用户界面的设计与开发。
一、GUI的基本概念与原理在开始GUI设计之前,我们需要了解一些基本的概念与原理。
MATLAB提供了一套强大的GUI设计工具集,其中最常用的是GUIDE(GUI Development Environment)。
GUIDE允许用户使用可视化的方式来构建GUI界面,包括按钮、文本框、菜单等各种控件。
二、GUI设计的基本步骤1. 创建GUI界面:在MATLAB命令窗口中输入“guide”命令即可打开GUIDE 界面。
然后选择“Blank GUI”模板,点击“OK”按钮即可创建一个空白的GUI窗口。
2. 添加控件:在GUI界面上右键点击,选择“Insert”菜单来添加各种控件,比如按钮、文本框、列表框等。
选择控件后,通过拖拽的方式将其放置在GUI界面上。
3. 设计控件属性:通过在“Property Inspector”面板中修改控件的属性来定制化界面的外观和行为。
比如修改按钮的文本、设置文本框的宽度等。
4. 编写回调函数:在MATLAB命令窗口中输入“guide”命令即可打开GUIDE 界面。
然后选择“Blank GUI”模板,点击“OK”按钮即可创建一个空白的GUI窗口。
5. 保存并运行GUI:点击GUIDE界面上的“Save”按钮,保存GUI界面的m文件。
然后在MATLAB命令窗口中输入“run xxx.m”来运行GUI。
三、GUI界面的布局和设计原则好的GUI界面应当具备良好的布局和设计,以提高用户的使用体验。
以下是一些常用的布局和设计原则:1. 界面简洁明了:避免过多的控件和信息,让用户能够快速找到所需功能。
最新Matlab的gui界面设计实例练习资料

一个不错的Matlab的gui界面设计实例%非常漂亮的日历,function CalendarTable;% calendar 日历% Example:% CalendarTable;S=datestr(now);[y,m,d]=datevec(S);% d is day% m is month% y is yearDD={'Sun','Mon','Tue','Wed','Thu','Fri','Sat'};close allfigure;for k=1:7;uicontrol(gcf,'style','text',...'unit','normalized','position',[0.02+k*0.1,0.55,0.08,0.06],...'BackgroundColor',0.6*[1,1,1],'ForegroundColor','b',...'String',DD(k),'fontsize',16,'fontname','times new roman');endh=1;ss='b';qq=eomday(y,m);for k=1:qq;n=datenum(y,m,k);[da,w] = weekday(n);if k==d;ss='r';enduicontrol(gcf,'style','push',...'unit','normalized','position',[0.02+da*0.1,0.55-h*0.08,0.08,0.06] ,...'BackgroundColor',0.6*[1,1,1],'ForegroundColor',ss,...'String',num2str(k));ss='b';if da==7;h=h+1;endenduicontrol(gcf,'style','push',...'unit','normalized','position',[0.6,0.66,0.12,0.08],...'BackgroundColor',0.6*[1,1,1],'ForegroundColor',ss,...'String','clock','fontsize',18,'fontname','times new roman');Tq=uicontrol(gcf,'style','push',...'unit','normalized','position',[0.74,0.66,0.17,0.08],...'BackgroundColor',0.6*[1,1,1],'ForegroundColor',[0.1,0.9,0.9],...'fontsize',18,'fontname','times new roman');sq='The calendar';uicontrol(gcf,'style','push',...'unit','normalized','position',[0.14,0.86,0.37,0.08],...'BackgroundColor',0.6*[1,1,1],'ForegroundColor',[0.1,0.9,0.9],...'fontsize',18,'fontname','times new roman','string',sq);trywhile 1set(Tq,'String',datestr(now,13));pause(1);endend计算万年历的Matlab程序(2008-12-21 13:59:19)标签:matlab万年历杂谈分类:Matlab实例function test_calendar(year,month)% 输入年份,月份,打印这个月的月历run = 0;ping = 0;fprintf('\n%s %s %s %s %s %s %s\n',...'日','一','二','三','四','五','六');% 计算从第一年到前一年的闰年和平年的个数for i =1:year-1if (mod(i,4)==0 & mod(i,100)~=0) | mod(i,400)==0run = run+1;elseping = ping+1;endend% 计算从第一年到当年前一个月的天数sum = 366*run+365*ping;for i = 1:month-1sum = sum+monthday(year,i);end% 获得这个月的天数n = monthday(year,month);temp = zeros(n,1);sum = sum+1;% 计算这个月第一天是星期几wkd = mod(sum,7);for i = 1:ntemp(wkd+i) = i;endl = 1;m = 1;% 打印日历for i = 1:length(temp)if temp(i) ==0temp2(l,m) = ' ';fprintf(' ');m = m+1;elsetemp2(l,m) = temp(i);if temp(i) >= 10fprintf('%d ',temp(i));elsefprintf('%d ',temp(i));endm = m+1;endif mod(i,7)==0fprintf('\n');m = 1;l = l+1;endendfprintf('\n');% 闰年和平年每月的天数function out = monthday(year,i)if mod(year,4)==0 & mod(year,100)~=0 | mod(year,400)==0 data = [31 29 31 30 31 30 31 31 30 31 30 31]; elsedata = [31 28 31 30 31 30 31 31 30 31 30 31]; endout = data(i);举例:输入:>> test_calendar(2008,12)返回:日一二三四五六1 2 3 4 5 67 8 9 10 11 12 1314 15 16 17 18 19 2021 22 23 24 25 26 2728 29 30 31闲来无事,学了一些Matlab GUI的基础知识,想找个东西练一下手。
Matlab实用程序界面设计实例分析
Matlab实用程序界面设计实例分析实例33:曲线转换按钮h0=figure('toolbar','none',...'position',[200 150 450 250],...'name','实例33');x=0:0.5:2*pi;y=sin(x);h=plot(x,y);grid onhuidiao=[...'if i==1,',...'i=0;,',...'y=cos(x);,',...'delete(h),',...'set(hm,''string'',''正弦函数''),',...'h=plot(x,y);,',...'grid on,',...'else if i==0,',...'i=1;,',...'y=sin(x);,',...'set(hm,''string'',''余弦函数''),',...'delete(h),',...'h=plot(x,y);,',...'grid on,',...'end,',...'end'];hm=uicontrol(gcf,'style','pushbutton',...'string','余弦函数',...'callback',huidiao);i=1;set(hm,'position',[250 20 60 20]);set(gca,'position',[0.2 0.2 0.6 0.6]) title('按钮的使用')hold on实例34:栅格控制按钮h0=figure('toolbar','none',...'position',[200 150 450 250],...'name','实例34');x=0:0.5:2*pi;y=sin(x);plot(x,y)huidiao1=[...'set(h_toggle2,''value'',0),',...'grid on,',...];huidiao2=[...'set(h_toggle1,''value'',0),',...'grid off,',...];h_toggle1=uicontrol(gcf,'style','togglebutton',...'string','grid on',...'value',0,...'position',[20 45 50 20],...'callback',huidiao1);h_toggle2=uicontrol(gcf,'style','togglebutton',...'string','grid off',...'value',0,...'position',[20 20 50 20],...'callback',huidiao2);set(gca,'position',[0.2 0.2 0.6 0.6])title('开关按钮的使用')实例35:编辑框的使用h0=figure('toolbar','none',...'position',[200 150 350 250],...'name','实例35');f='Please input the letter';huidiao1=[...'g=upper(f);,',...'set(h2_edit,''string'',g),',...];huidiao2=[...'g=lower(f);,',...'set(h2_edit,''string'',g),',...];h1_edit=uicontrol(gcf,'style','edit',...'position',[100 200 100 50],...'HorizontalAlignment','left',...'string','Please input the letter',...'callback','f=get(h1_edit,''string'');',...'background','w',...'max',5,...'min',1);h2_edit=uicontrol(gcf,'style','edit',...'HorizontalAlignment','left',...'position',[100 100 100 50],...'background','w',...'max',5,...'min',1);h1_button=uicontrol(gcf,'style','pushbutton',...'string','小写变大写',...'position',[100 45 100 20],...'callback',huidiao1);h2_button=uicontrol(gcf,'style','pushbutton',...'string','大写变小写',...'position',[100 20 100 20],...'callback',huidiao2);实例36:弹出式菜单h0=figure('toolbar','none',...'position',[200 150 450 250],...'name','实例36');x=0:0.5:2*pi;y=sin(x);h=plot(x,y);grid onhm=uicontrol(gcf,'style','popupmenu',...'string',...'sin(x)|cos(x)|sin(x)+cos(x)|exp(-sin(x))',...'position',[250 20 50 20]);set(hm,'value',1)huidiao=[...'v=get(hm,''value'');,',...'switch v,',...'case 1,',...'delete(h),',...'y=sin(x);,',...'h=plot(x,y);,',...'grid on,',...'case 2,',...'delete(h),',...'y=cos(x);,',...'h=plot(x,y);,',...'grid on,',...'case 3,',...'delete(h),',...'y=sin(x)+cos(x);,',...'h=plot(x,y);,',...'grid on,',...'case 4,',...'delete(h),',...'y=exp(-sin(x));,',...'h=plot(x,y);,',...'grid on,',...'end'];set(hm,'callback',huidiao)set(gca,'position',[0.2 0.2 0.6 0.6]) title('弹出式菜单的使用')实例37:滑标的使用h0=figure('toolbar','none',...'position',[200 150 450 250],...'name','实例37');[x,y]=meshgrid(-8:0.5:8);r=sqrt(x.^2+y.^2)+eps;z=sin(r)./r;h0=mesh(x,y,z);h1=axes('position',...[0.2 0.2 0.5 0.5],...'visible','off');htext=uicontrol(gcf,...'units','points',...'position',[20 30 45 15],...'string','brightness',...'style','text');hslider=uicontrol(gcf,...'units','points',...'position',[10 10 300 15],...'min',-1,...'max',1,...'style','slider',...'callback',...'brighten(get(hslider,''value''))'); 实例38:多选菜单h0=figure('toolbar','none',...'position',[200 150 450 250],...'name','实例38');[x,y]=meshgrid(-8:0.5:8);r=sqrt(x.^2+y.^2)+eps;z=sin(r)./r;h0=mesh(x,y,z);hlist=uicontrol(gcf,'style','listbox',...'string','default|spring|summer|autumn|winter',...'max',5,...'min',1,...'position',[20 20 80 100],...'callback',[...'k=get(hlist,''value'');,',...'switch k,',...'case 1,',...'colormap default,',...'case 2,',...'colormap spring,',...'case 3,',...'colormap summer,',...'case 4,',...'colormap autumn,',...'case 5,',...'colormap winter,',...'end']);实例39:菜单控制的使用h0=figure('toolbar','none',...'position',[200 150 450 250],...'name','实例39');x=0:0.5:2*pi;y=cos(x);h=plot(x,y);grid onset(gcf,'toolbar','none')hm=uimenu('label','example');huidiao1=[...'set(hm_gridon,''checked'',''on''),',...'set(hm_gridoff,''checked'',''off''),',...'grid on'];huidiao2=[...'set(hm_gridoff,''checked'',''on''),',...'set(hm_gridon,''checked'',''off''),',...'grid off'];hm_gridon=uimenu(hm,'label','grid on',...'checked','on',...'callback',huidiao1);hm_gridoff=uimenu(hm,'label','grid off',...'checked','off',...'callback',huidiao2);实例40:UIMENU菜单的应用h0=figure('toolbar','none',...'position',[200 150 450 250],...'name','实例40');h1=uimenu(gcf,'label','函数');h11=uimenu(h1,'label','轮廓图',...'callback',[...'set(h31,''checked'',''on''),',...'set(h32,''checked'',''off''),',...'[x,y,z]=peaks;,',...'contour3(x,y,z,30)']);h12=uimenu(h1,'label','高斯分布',...'callback',[...'set(h31,''checked'',''on''),',...'set(h32,''checked'',''off''),',...'mesh(peaks);,',...'axis tight']);h13=uimenu(h1,'label','Sinc函数',...'callback',[...'set(h31,''checked'',''on''),',...'set(h32,''checked'',''off''),',...'[x,y]=meshgrid(-8:0.5:8);,',...'r=sqrt(x.^2+y.^2)+eps;,',...'z=sin(r)./r;,',...'mesh(x,y,z)']);h2=uimenu(gcf,'label','色彩');hl2(1)=uimenu(h2,'label','Default',...'checked','on',...'callback',...[...'set(hl2,''checked'',''off''),',...'set(hl2(1),''checked'',''on''),',...'colormap(''default'')']);hl2(2)=uimenu(h2,'label','spring',...'callback',...[...'set(hl2,''checked'',''off''),',...'set(hl2(2),''checked'',''on''),',...'colormap(spring)']);hl2(3)=uimenu(h2,'label','Summer',...'callback',...[...'set(hl2,''checked'',''off''),',...'set(hl2(3),''checked'',''on''),',...'colormap(summer)']);hl2(4)=uimenu(h2,'label','Autumn',...'callback',...[...'set(hl2,''checked'',''off''),',...'set(hl2(4),''checked'',''on''),',...'colormap(autumn)']);hl2(5)=uimenu(h2,'label','Winter',...'callback',...[...'set(hl2,''checked'',''off''),',...'set(hl2(5),''checked'',''on''),',...'colormap(winter)']);h3=uimenu(gcf,'label','坐标选项');h31=uimenu(h3,'label','Axis on',...'callback',...[...'axis on,',...'set(h31,''checked'',''on''),',...'set(h32,''checked'',''off'')']); h32=uimenu(h3,'label','Axis off',...'callback',...[...'axis off,',...'set(h32,''checked'',''on''),',...'set(h31,''checked'',''off'')']); 实例41:除法计算器h=figure('toolbar','none',...'position',[200 150 450 250],...'name','实例41');h1=uicontrol(gcf,'style','edit',...'position',[80 200 100 20],...'HorizontalAlignment','right',...'callback',['m=get(h1,''string'');,',...'a=str2num(m);']);h2=uicontrol(gcf,'style','edit',...'HorizontalAlignment','right',...'position',[80 150 100 20],...'callback',['n=get(h2,''string'');,',...'b=str2num(n);']);h3=uicontrol(gcf,'style','text',...'string','被除数',...'position',[80 230 100 20]);h4=uicontrol(gcf,'style','edit',...'position',[80 50 100 20]);h5=uicontrol(gcf,'style','pushbutton',...'position',[80 100 100 20],...'string','=',...'callback',[...'if b==0,',...'h7=errordlg(''除数不能为0!'',''error'',''on'');,',...'else,',...'k=a/b;,',...'c=num2str(k);,',...'set(h4,''string'',c),',...'end']);h8=uicontrol(gcf,'style','text',...'string','除数',...'position',[80 175 100 20]);h9=uicontrol(gcf,'style','text',...'string','商',...'position',[80 75 100 20]);实例42:单选框的使用h0=figure('toolbar','none',...'position',[200 150 450 250],...'name','实例42');x=0:0.5:2*pi;y=sin(x);plot(x,y)grid onset(gcf,'toolbar','none')g=set(gca,'position',[0.2 0.2 0.6 0.6]); huidiao1=[...'grid on,',...'set(box_on,''value'',1),',...'set(box_off,''value'',0),']; huidiao2=[...'grid off,',...'set(box_off,''value'',1),',...'set(box_on,''value'',0),']; box_on=uicontrol(gcf,'style','radio',...'position',[5 50 50 20],...'string','grid on',...'value',1,...'callback',huidiao1);box_off=uicontrol(gcf,'style','radio',...'position',[5 20 50 20],...'string','grid off',...'value',0,...'callback',huidiao2);title('无线按钮的使用')实例43:添加环境效果h0=figure('toolbar','none',...'position',[198 56 450 468],...'name','实例43');h1=axes('parent',h0,...'position',[0.15 0.45 0.7 0.5],...'visible','off');sphereh=findobj('type','surface');shading interpaxis equall=light('position',[0 -2 1]);k(1)=get(h,'specularstrength');k(2)=get(h,'diffusestrength');k(3)=get(h,'specularexponent');k(4)=get(h,'specularcolorreflectance');u1=uimenu('parent',h0,...'label','灯光效果',...'tag','u1',...'backgroundcolor',[0.75 0.75 0.75]);u11=uimenu('parent',u1,...'label','gouraud',...'tag','u11',...'backgroundcolor',[0.75 0.75 0.75],...'callback',[...'set(u11,''checked'',''on'');,',...'set(u12,''checked'',''off'');,',...'set(h,''facelighting'',''gouraud'')']); u12=uimenu('parent',u1,...'label','phong',...'tag','u12',...'backgroundcolor',[0.75 0.75 0.75],...'callback',[...'set(u11,''checked'',''off'');,',...'set(u12,''checked'',''on'');,',...'set(h,''facelighting'',''gouraud'')']);u2=uimenu('parent',h0,...'label','背面灯光',...'tag','u2',...'backgroundcolor',[0.75 0.75 0.75]);u21=uimenu('parent',u2,...'label','reverselit',...'tag','u21',...'checked','on',...'backgroundcolor',[0.75 0.75 0.75],...'callback',[...'set(u21,''checked'',''on'');,',...'set(u22,''checked'',''off'');,',...'set(h,''backfacelighting'',''reverselit'')']); u22=uimenu('parent',u2,...'label','reverselit',...'tag','u22',...'backgroundcolor',[0.75 0.75 0.75],...'callback',[...'set(u21,''checked'',''off'');,',...'set(u22,''checked'',''on'');,',...'set(h,''backfacelighting'',''reverselit'')']);s1=uicontrol('parent',h0,...'units','points',...'style','slider',...'tag','s1',...'min',0,...'max',1,...'value',k(1),...'position',[20 80 100 15],...'callback',[...'s1value=get(s1,''value'');,',...'set(h,''specularstrength'',s1value)']); t1=uicontrol('parent',h0,...'units','points',...'style','text',...'tag','t1',...'string','镜面反射强度',...'position',[20 97 100 15]);s2=uicontrol('parent',h0,...'units','points',...'style','slider',...'tag','s2',...'min',0,...'max',1,...'value',k(2),...'position',[20 30 100 15],...'callback',[...'s2value=get(s2,''value'');,',...'set(h,''diffusestrength'',s2value)']); t2=uicontrol('parent',h0,...'units','points',...'style','text',...'tag','t2',...'string','漫反射强度',...'position',[20 47 100 15]);s3=uicontrol('parent',h0,...'units','points',...'style','slider',...'tag','s3',...'min',0.1,...'max',1,...'value',k(3)/20,...'position',[220 80 100 15],...'callback',[...'s3value=get(s3,''value'')+eps;,',...'set(h,''specularexponent'',20*s3value)']);t3=uicontrol('parent',h0,...'units','points',...'style','text',...'tag','t3',...'string','镜面指数',...'position',[220 97 100 15]);s4=uicontrol('parent',h0,...'units','points',...'style','slider',...'tag','s4',...'min',0,...'max',1,...'value',k(4),...'position',[220 30 100 15],...'callback',[...'s4value=get(s4,''value'');,',...'set(h,''specularcolorreflectance'',s4value)']); t4=uicontrol('parent',h0,...'units','points',...'style','text',...'tag','t1',...'string','镜面颜色反射比',...'position',[220 47 100 15]);b1=uicontrol('parent',h0,...'units','points',...'style','pushbutton',...'tag','b1',...'string','关闭',...'position',[145 45 50 30],...'callback','close');实例44:改变坐标轴范围h0=figure('toolbar','none',...'position',[198 56 408 468],...'name','实例44');h1=axes('parent',h0,...'position',[0.15 0.45 0.7 0.5],...'visible','on');e1=uicontrol('parent',h0,...'style','edit',...'string',1,...'position',[50 120 50 20]);t1=uicontrol('parent',h0,...'style','text',...'string','X轴最小值',...'position',[35 150 80 20]); e2=uicontrol('parent',h0,...'style','edit',...'string',5,...'position',[50 60 50 20]); t2=uicontrol('parent',h0,...'style','text',...'string','X轴最大值',...'position',[35 90 80 20]); e3=uicontrol('parent',h0,...'style','edit',...'string',1,...'position',[150 120 50 20]); t3=uicontrol('parent',h0,...'style','text',...'string','Y轴最小值',...'position',[135 150 80 20]); e4=uicontrol('parent',h0,...'style','edit',...'string',5,...'position',[150 60 50 20]);t4=uicontrol('parent',h0,...'style','text',...'string','Y轴最大值',...'position',[135 90 80 20]);e5=uicontrol('parent',h0,...'style','edit',...'string',20,...'position',[250 120 50 20]);t5=uicontrol('parent',h0,...'style','text',...'horizontalalignment','left',...'string','点数',...'position',[250 150 30 20]);b1=uicontrol('parent',h0,...'style','pushbutton',...'string','绘图',...'position',[250 60 60 40],...'callback',[...'a=str2num(get(e1,''string''));,',...'b=str2num(get(e2,''string''));,',...'c=str2num(get(e3,''string''));,',...'d=str2num(get(e4,''string''));,',...'n=str2num(get(e5,''string''));,',...'xgrid=linspace(-abs(a),abs(a),n);,',...'ygrid=linspace(-abs(b),abs(b),n);,',...'[x,y]=meshgrid(xgrid,ygrid);,',...'z=c*sqrt(d-y.*y/b/b-x.*x/a/a);,',...'u=1;,',...'z1=real(z);,',...'for k=2:n-1,',...'for j=2:n-1,',...'if imag(z(k,j))~=0,',...'z1(k,j)=0;,',...'end,',...'if all(imag(z([k-1:k+1],[j-1:j+1])))~=0,',... 'z1(k,j)=nan;,',...'end,',...'end,',...'end,',...'surf(x,y,z1),',...'hold on,',...'if u==1,',...'z2=-z1;,',...'surf(x,y,z2),',...'axis([-abs(a),abs(a),-abs(b),abs(b),-abs(c),abs(c)]);,',...'end,',...'xlabel(''x'');,',...'ylabel(''y'');,',...'zlabel(''z'');,',...'hold off']);b2=uicontrol('parent',h0,...'style','pushbutton',...'string','关闭',...'position',[150 10 60 20],...'callback','close');实例45:简单运算器h1=uicontrol(gcf,'style','radio',...'string','加',...'value',1,...'position',[20 150 40 20],...'callback',[...'k=1;,',...'set(h1,''value'',1),',...'set(h2,''value'',0),',...'set(h3,''value'',0)']); h2=uicontrol(gcf,'style','radio',...'string','减',...'position',[20 110 40 20],...'callback',[...'k=2;,',...'set(h2,''value'',1),',...'set(h1,''value'',0),',...'set(h3,''value'',0)']); h3=uicontrol(gcf,'style','radio',...'string','乘',...'position',[20 70 40 20],...'callback',[...'k=3;,',...'set(h3,''value'',1),',...'set(h2,''value'',0),',...'set(h1,''value'',0)']); e1=uicontrol(gcf,'style','edit',...'position',[80 150 100 20]); e2=uicontrol(gcf,'style','edit',...'position',[80 110 100 20]); e3=uicontrol(gcf,'style','edit',...'position',[80 70 100 20]);b1=uicontrol(gcf,'style','pushbutton',...'string','运算',...'position',[200 150 80 30],...'callback',[...'x=str2num(get(e1,''string''));,',...'y=str2num(get(e2,''string''));,',...'switch k,',...'case 1,',...'z=x+y;,',...'case 2,',...'z=x-y;,',...'case 3,',...'z=x*y;,',...'end,',...'set(e3,''string'',num2str(z))']); b2=uicontrol(gcf,'style','pushbutton',...'string','退出',...'position',[200 100 80 30],...'callback','close');实例46:曲线色彩的修改h0=figure('toolbar','none',...'position',[198 56 408 468],...'name','my second gui');h1=axes('parent',h0,...'position',[0.15 0.45 0.7 0.5],...'visible','on');x=0:0.1:2*pi;k=plot(x,sin(x));xlabel('自变量X');ylabel('函数值Y');title('图形色彩改变');p1=uicontrol('parent',h0,...'style','pushbutton',...'backgroundcolor','r',...'position',[60 100 50 30],...'callback','set(k,''color'',''r'')'); p2=uicontrol('parent',h0,...'style','pushbutton',...'backgroundcolor','g',...'position',[170 100 50 30],...'callback','set(k,''color'',''g'')'); p3=uicontrol('parent',h0,...'style','pushbutton',...'backgroundcolor','b',...'position',[280 100 50 30],...'callback','set(k,''color'',''b'')'); p4=uicontrol('parent',h0,...'style','pushbutton',...'backgroundcolor',[1 1 1],...'fontsize',20,...'fontweight','demi',...'string','关闭',...'position',[150 30 80 60],...'callback','close');t1=uicontrol('parent',h0,...'style','text',...'string','红色',...'fontsize',12,...'fontweight','demi',...'position',[60 120 50 20]);t2=uicontrol('parent',h0,...'style','text',...'string','绿色',...'fontsize',12,...'fontweight','demi',...'position',[170 120 50 20]);t3=uicontrol('parent',h0,...'style','text',...'string','蓝色',...'fontsize',12,...'fontweight','demi',...'position',[280 120 50 20]);实例47:曲线标记h0=figure('toolbar','none',...'position',[198 56 408 468],...'name','my second gui');h1=axes('parent',h0,...'position',[0.15 0.45 0.7 0.5],...'visible','on');x=0:0.1:2*pi;k=plot(x,sin(x),'*');xlabel('自变量X');ylabel('函数值Y');title('标记类型的改变');p1=uicontrol('parent',h0,...'style','pushbutton',...'string','+',...'fontsize',20,...'foregroundcolor',[1 1 1],...'backgroundcolor',[0 0 0],...'position',[60 100 50 20],...'callback','set(k,''marker'',''+'')'); p2=uicontrol('parent',h0,...'style','pushbutton',...'string','o',...'fontsize',20,...'foregroundcolor',[1 1 1],...'backgroundcolor',[0 0 0],...'position',[170 100 50 20],...'callback','set(k,''marker'',''o'')'); p3=uicontrol('parent',h0,...'style','pushbutton',...'string','x',...'fontsize',20,...'foregroundcolor',[1 1 1],...'backgroundcolor',[0 0 0],...'position',[280 100 50 20],...'callback','set(k,''marker'',''x'')'); p4=uicontrol('parent',h0,...'style','pushbutton',...'backgroundcolor',[1 1 1],...'fontsize',20,...'fontweight','demi',...'string','关闭',...'position',[150 30 80 60],...'callback','close');t1=uicontrol('parent',h0,...'style','text',...'string','星号',...'fontsize',12,...'fontweight','demi',...'position',[60 120 50 20]);t2=uicontrol('parent',h0,...'style','text',...'string','圆圈',...'fontsize',12,...'fontweight','demi',...'position',[170 120 50 20]);t3=uicontrol('parent',h0,...。
Matlab的gui界面设计实例练习
一个不错的Matlab的gui界面设计实例%非常漂亮的日历,function CalendarTable;% calendar 日历% Example:% CalendarTable;S=datestr(now);[y,m,d]=datevec(S);% d is day% m is month% y is yearDD={'Sun','Mon','Tue','Wed','Thu','Fri','Sat'};close allfigure;for k=1:7;uicontrol(gcf,'style','text',...'unit','normalized','position',[0.02+k*0.1,0.55,0.08,0.06],...'BackgroundColor',0.6*[1,1,1],'ForegroundColor','b',...'String',DD(k),'fontsize',16,'fontname','times new roman');endh=1;ss='b';qq=eomday(y,m);for k=1:qq;n=datenum(y,m,k);[da,w] = weekday(n);if k==d;ss='r';enduicontrol(gcf,'style','push',...'unit','normalized','position',[0.02+da*0.1,0.55-h*0.08,0.08,0.06],... 'BackgroundColor',0.6*[1,1,1],'ForegroundColor',ss,...'String',num2str(k));ss='b';if da==7;h=h+1;endenduicontrol(gcf,'style','push',...'unit','normalized','position',[0.6,0.66,0.12,0.08],...'BackgroundColor',0.6*[1,1,1],'ForegroundColor',ss,...'String','clock','fontsize',18,'fontname','times new roman');Tq=uicontrol(gcf,'style','push',...'unit','normalized','position',[0.74,0.66,0.17,0.08],...'BackgroundColor',0.6*[1,1,1],'ForegroundColor',[0.1,0.9,0.9],...'fontsize',18,'fontname','times new roman');sq='The calendar';uicontrol(gcf,'style','push',...'unit','normalized','position',[0.14,0.86,0.37,0.08],...'BackgroundColor',0.6*[1,1,1],'ForegroundColor',[0.1,0.9,0.9],...'fontsize',18,'fontname','times new roman','string',sq);trywhile 1set(Tq,'String',datestr(now,13));pause(1);endend计算万年历的Matlab程序(2008-12-21 13:59:19)标签:matlab万年历杂谈分类:Matlab实例function test_calendar(year,month)% 输入年份,月份,打印这个月的月历run = 0;ping = 0;fprintf('\n%s %s %s %s %s %s %s\n',...'日','一','二','三','四','五','六');% 计算从第一年到前一年的闰年和平年的个数for i =1:year-1if (mod(i,4)==0 & mod(i,100)~=0) | mod(i,400)==0run = run+1;elseping = ping+1;endend% 计算从第一年到当年前一个月的天数sum = 366*run+365*ping;for i = 1:month-1sum = sum+monthday(year,i);end% 获得这个月的天数n = monthday(year,month);temp = zeros(n,1);sum = sum+1;% 计算这个月第一天是星期几wkd = mod(sum,7);for i = 1:ntemp(wkd+i) = i;endl = 1;m = 1;% 打印日历for i = 1:length(temp)if temp(i) ==0temp2(l,m) = ' ';fprintf(' ');m = m+1;elsetemp2(l,m) = temp(i);if temp(i) >= 10fprintf('%d ',temp(i)); elsefprintf('%d ',temp(i)); endm = m+1;endif mod(i,7)==0fprintf('\n');m = 1;l = l+1;endendfprintf('\n');% 闰年和平年每月的天数function out = monthday(year,i)if mod(year,4)==0 & mod(year,100)~=0 | mod(year,400)==0data = [31 29 31 30 31 30 31 31 30 31 30 31];elsedata = [31 28 31 30 31 30 31 31 30 31 30 31];endout = data(i);举例:输入:>> test_calendar(2008,12)返回:日一二三四五六1 2 3 4 5 67 8 9 10 11 12 1314 15 16 17 18 19 2021 22 23 24 25 26 2728 29 30 31闲来无事,学了一些Matlab GUI的基础知识,想找个东西练一下手。
MATLAB设计_13_用户界面设计

什么是用户界面?王玉顺:MATLAB程序设计13用户界面设计本章内容(1(1(2■figure 王玉顺:MATLAB 程序设计8(3■MenuBar 王玉顺:MATLAB 程序设计10■Name 属性的取值可以是任何字符串,它的缺省值为空。
这个字符串将作为图形窗口的标题。
一般情况下,其标题形式为:“Figure No.1:”字符串。
(4)Name 属性图形窗口属性控制属性名称,属性值13.1窗口设计(5(6(6王玉顺:MATLAB 程序设计14(7王玉顺:MATLAB 程序设计16程序示例:hf=figure('Color',[0,1,0],'Position',[1,1,300,150], 'Name','图形窗口示例','NumberTitle','off','MenuBar','none', 'KeyPressFcn','disp(''Hello,Keyboard Key Pressed.'')');set(gcf, 'KeyPressFcn','disp(''Why'')');(7)set 函数__对象属性设置13.1窗口设计王玉顺:MATLAB 程序设计17(8(8(1(2■调用格式:(3(3(4(4■菜单系统的功能:如果选择(5(4screen=get(0,'ScreenSize');W=screen(3);H=screen(4);hf=figure('Color',[0.8,0.8,0.8],'Position',[1,1,0.4*W,0.3*H],...'Name','(5close all;if (k1==0)&(k2==1);x=[0:0.15:2*pi];y=[0:0.35:2*pi];[x,y]=meshgrid(x,y);z=cos(x).*sin(y);王玉顺:MATLAB程序设计30王玉顺:MATLAB 程序设计31王玉顺:MATLAB 程序设计32王玉顺:MATLAB 程序设计33王玉顺:MATLAB 程序设计3413.3对话框设计13用户界面设计王玉顺:MATLAB 程序设计35(1)对话框类型13.3对话框设计1.按钮(Push Button )2.单选按钮(Radio Button )3.复选框(Check Box )4.列表框(List Box )5.弹出式列表框(Popup List Box )6.编辑框(Edit Box )7.滑动条(Slider )8.静态文本(Static Text )9.边框(Frame )(2(3%在上述菜单设计示例基础上,在窗口右侧建立GUI控王玉顺:MATLAB程序设计3813.4一个完整例子—数据拟合操作界面(1)用户界面的程序模块简介■程序组成:fitting.m、fitdone.m、openfile.m、savefile.m、test.dat■程序功能:建立图形用户界面,建立GUI控件及子程序调用关系,编辑试验数据并存盘,绘试验数据的散点图,进行多项式拟合或指数拟合的计算,绘散点图及拟合曲线,显示拟合结果,存储拟合数据。
Matlab界面设计的例子
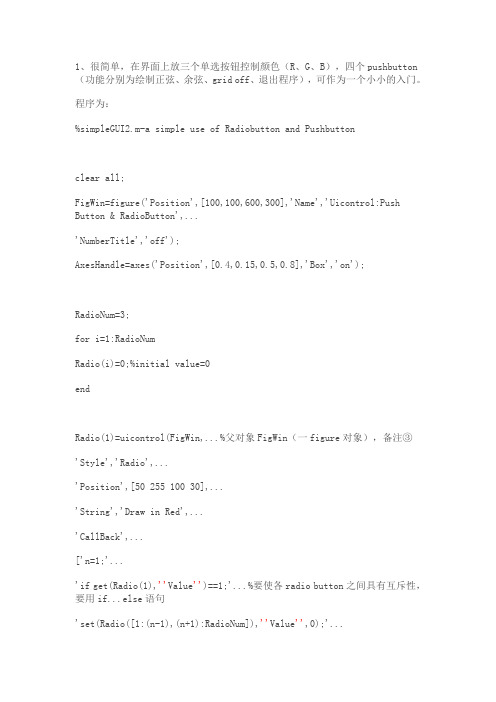
1、很简单,在界面上放三个单选按钮控制颜色(R、G、B),四个pushbutton (功能分别为绘制正弦、余弦、grid off、退出程序),可作为一个小小的入门。
程序为:%simpleGUI2.m-a simple use of Radiobutton and Pushbuttonclear all;FigWin=figure('Position',[100,100,600,300],'Name','Uicontrol:Push Button & RadioButton',...'NumberTitle','off');AxesHandle=axes('Position',[0.4,0.15,0.5,0.8],'Box','on');RadioNum=3;for i=1:RadioNumRadio(i)=0;%initial value=0endRadio(1)=uicontrol(FigWin,...%父对象FigWin(一figure对象),备注③'Style','Radio',...'Position',[50 255 100 30],...'String','Draw in Red',...'CallBack',...['n=1;'...'if get(Radio(1),''Value'')==1;'...%要使各radio button之间具有互斥性,要用if...else语句'set(Radio([1:(n-1),(n+1):RadioNum]),''Value'',0);'...'else;'...%要加上分号,一种规定?参备注①'set(Radio(1),''Value'',1);'...'end;'...'ColorStr=''r'';'...'set(FunHandle,''Color'',''red'')']);%曲线颜色根据radio button的选项实时变化,ColorStr是一个全局变量Radio(2)=uicontrol(FigWin,...'Style','Radio',...'Position',[50 215 100 30],...'String','Draw in Green',...'CallBack',...['n=2;'...'if get(Radio(2),''Value'')==1;'...'set(Radio([1:(n-1),(n+1):RadioNum]),''Value'',0);'...'else;'...'set(Radio(2),''Value'',1);'...'end;'...'ColorStr=''g'';'...'set(FunHandle,''Color'',''green'')']);Radio(3)=uicontrol(FigWin,...'Style','Radio',...'Position',[50 175 100 30],...'String','Draw in Blue',...'CallBack',...['n=3;'...'if get(Radio(3),''Value'')==1;'...'set(Radio([1:(n-1),(n+1):RadioNum]),''Value'',0);'...'else;'...'set(Radio(3),''Value'',1);'...'end;'...'ColorStr=''b'';'...'set(FunHandle,''Color'',''blue'')']);push1=uicontrol(FigWin,...'Style','pushbutton',...'Position',[50 135 100 30],...'String','Plot sin(x)',...'CallBack',...['subplot(AxesHandle);' ...%注意父对象是AxesHandle而非FigWin!参备注②'x=0:.1:4*pi;'...'FunHandle=plot(x,sin(x),ColorStr);'...%ColorStr变量的值受radiobutton控制'axis([0 4*pi -1 1]);'...'grid on;'...'xlabel(''x'');'...'ylabel(''y=sin(x)'');']);push2=uicontrol(FigWin,...'Style','pushbutton',...'Position',[50 95 100 30],...'String','Plot cos(x)',...'CallBack',...['subplot(AxesHandle);' ...'x=0:.1:4*pi;'...'FunHandle=plot(x,cos(x),ColorStr);'... 'axis([0 4*pi -1 1]);'...'grid on;'...'xlabel(''x'');'...'ylabel(''y=cos(x)'');']);push3=uicontrol(FigWin,...'Style','pushbutton',...'Position',[50 55 100 30],...'String','Grid off',...'CallBack','grid off;');%参备注①push4=uicontrol(FigWin,...'Style','pushbutton',...'Position',[50 15 100 30],...'String','Exit',...'CallBack','close(FigWin)');%绘制初始曲线ColorStr='r';set(Radio(1),'Value',1);X=0:0.1:4*pi;FunHandle=plot(X,sin(X),ColorStr); axis([0 4*pi -1 1]);xlabel('x');ylabel('y=sin(x)');grid on;运行结果://有些注意的地方用红色标识。
做一个实例,搞定MATLAB界面编程

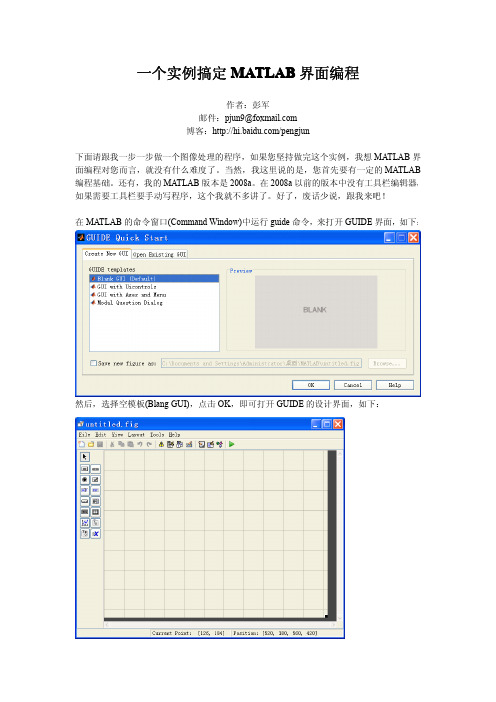
做一个实例,搞定MATLAB界面编程2009-04-12 16:55作者:彭军带插图版本的pdf格式文件,请下载:/source/1144420一个实例搞定MATLAB界面编程作者:彭军邮件:pengjun@博客:/pengjun下面请跟我一步一步做一个图像处理的程序,如果您坚持做完这个实例,我想MATLAB界面编程对您而言,就没有什么难度了。
当然,我这里说的是,您首先要有一定的MATLAB编程基础。
还有,我的MATLAB版本是2008a。
在2008a以前的版本中没有工具栏编辑器,如果需要工具栏要手动写程序,这个我就不多讲了。
好了,废话少说,跟我来吧!1、在MATLAB的命令窗口(Command Window)中运行guide命令,来打开GUIDE界面,如下:2、然后,选择空模板(Blang GUI),点击OK,即可打开GUIDE的设计界面,如下:3、点击工具栏上的菜单编辑器(Menu Editor),打开菜单编辑器,如下:4、在Menu Bar中新建一个菜单项,名字为“文件”,其他设置请看下图:5、在“文件”菜单下添加菜单项:“打开”,“保存”,“退出”。
见下图:如果需要在菜单项“退出”上面添加一个分割线的话,选中“Separator above this item”就行了。
保存我的界面为pjimage.fig. 保存完毕之后,会自动打开pjimage.m文件,而我们所有的程序都是要写在这个M文件里面的。
在编程中,我们的每一个鼠标动作都对应一个Callback函数。
那么我们的菜单项也是如此的。
在界面上,单击鼠标右键选择“Property Inspector”,即可打开属性窗口。
当我们点击不同的控件时,其对应的属性都会在这里显示,我们可以进行修改。
最主要的属性莫过于Tag属性和String属性。
设置当前Figure窗口的Tag属性为:figure_pjimage,窗口的标题(Name属性)为:图像处理实例。
实验六 MATLAB图形用户界面设计
实验六MATLAB图形用户界面设计(3学时)1 实验的目的及意义:(1)熟悉MATLAB图形用户界面开发环境。
(2)掌握MATLAB中图形用户界面程序设计方法。
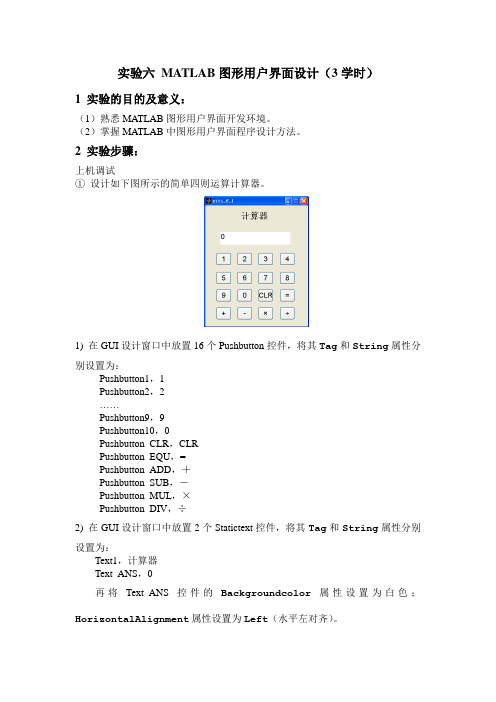
2 实验步骤:上机调试①设计如下图所示的简单四则运算计算器。
1) 在GUI设计窗口中放置16个Pushbutton控件,将其Tag和String属性分别设置为:Pushbutton1,1Pushbutton2,2……Pushbutton9,9Pushbutton10,0Pushbutton_CLR,CLRPushbutton_EQU,=Pushbutton_ADD,+Pushbutton_SUB,-Pushbutton_MUL,×Pushbutton_DIV,÷2) 在GUI设计窗口中放置2个Statictext控件,将其Tag和String属性分别设置为:Text1,计算器Text_ANS,0再将Text_ANS控件的Backgroundcolor属性设置为白色;HorizontalAlignment属性设置为Left(水平左对齐)。
3) 设计Callback函数:(提示)某一数字按键按下时,要将该按键的String属性读出来并连接到Text_ANS的String属性之后。
(使用字符串连接函数Strcat)function pushbutton1_Callback(hObject, eventdata, handles) str=get(handles.pushbutton1,'string');str=strcat(get(handles.text_ANS,'string'),str);set(handles.text_ANS,'string',str);function pushbutton2_Callback(hObject, eventdata, handles) str=get(handles.pushbutton2,'string');str=strcat(get(handles.text_ANS,'string'),str);set(handles.text_ANS,'string',str);....function pushbutton9_Callback(hObject, eventdata, handles) str=get(handles.pushbutton9,'string');str=strcat(get(handles.text_ANS,'string'),str);set(handles.text_ANS,'string',str);function pushbutton10_Callback(hObject, eventdata, handles) str=get(handles.pushbutton10,'string');str=strcat(get(handles.text_ANS,'string'),str);set(handles.text_ANS,'string',str);CLR按键按下时,将Text_ANS的String属性设为空。
matlab图形用户界面编程
Matlab菜单系统设计
菜单系统的生成 菜单项句柄=uimenu(窗口句柄,属性1,属性值1,属 性2,属性值2,…) 子菜单句柄=uimenu(菜单项句柄,属性1,属性值 1,…) 属性:
菜单条名称label 回调函数callback
热键名称accelerator 背景颜色backgroundcolor 前景颜色foregroundcolor 选中状态checked 使能状态enabled 菜单条位置position 分隔符separator
function gui_counter1() %gui_counter is a demo of gui design. h_main=figure('name','a demo of gui design','menubar','none',... 'numbertitle','off','position',[100 100 300 100]); h_edit=uicontrol('style','edit','backgroundcolor',[1 1 1],'position',[20 20 50 20],... 'tag','myedit','string','1','horizontalalignment','left'); h_but1=uicontrol('style','pushbutton','position',[20 50 50 20],'string','INC',... 'callback',['h=findobj(gcf,''tag'',''myedit'');','v=eval(get(h,''string''));',... 'set(h,''string'',int2str(v+1));']); h_but2=uicontrol('style','pushbutton','position',[80 50 50 20],'string','DEC',... 'callback',['h=findobj(gcf,''tag'',''myedit'');','v=eval(get(h,''string''));',... 'set(h,''string'',int2str(v-1));']);
源码-一个实例搞定MATLAB界面编程 pjimage.m
% Get default command line output from handles structure
varargout{1} = handles.output;
% --------------------------------------------------------------------
% existing singleton*. Starting from the left, property value pairs are
% applied to the GUI before pjimage_OpeningFcn gets called. An
% unrecognized property name or invalid value makes property application
% varargin command line arguments to pjimage (see VARARGIN)
% Choose default command line output for pjimage
handles.output = hObject;
% Update handles structure
function m_file_Callback(hObject, eventdata, handles)
% hObject handle to m_file (see GCBO)
% eventdata reserved - to be defined in a future version of MATLAB
% imshow(imread(fpath)) %imread读入图片,imshow显示
img_src=imread(fpath);
MATLAB图形用户界面

MATLAB图形用户界面(GUIDE) MATLAB的图形用户界面(GUI)以其友好性和直观易懂性在软件编程上被广泛使用。
开发一个GUI程序的过程主要有:布局好图形用户界面对象和给这个图形用户界面编写代码。
具体的开发步骤:GUI界面的设计和布局、GUI的编程、菜单的设计和布局以及菜单的编程。
一、GUI界面的设计、布局例1图形用户界面简单例子:分别用mesh和surf图画出函数peaks图形。
见guide1.fig , 同时生成的M文件为:guide1.m二、GUI的编程例2设计一个GUI,通过调节滑块可以画出不同频率的正弦波。
见guide2.fig, 同时编写的M文件为:guide2.mfunction varargout=pushbutton1_Callback(hObject, eventdata, handles,varargin)w=get(handles.frequency_input,'Value');t=0:0.005:2*pi;y=sin(2.*pi.*w.*t);axes(handles.frequency_axes)plot(t,y)grid on% --- Executes on button press in pushbutton2.function varargout=pushbutton2_Callback(hObject, eventdata, handles,varargin)close三、菜单的设计、布局及编程例3菜单例子:例1中分别用mesh和surf图画出函数peaks图形,加菜单条(Menu bar)、弹出菜单(Context Menus)。
见guide3.fig,编写的M文件为:guide3.m四、对话框例4 设计一个GUI,用多种绘图方法显示函数peaks的图像。
见plot_multiple.fig同时生成的M文件为:plot_multiple.m。
第08章_MATLAB图形用户界面设计_例题源程序
第8章MATLAB图形用户界面设计例8.1建立图8.1所示的图形演示系统菜单。
菜单条中含有3个菜单项:Plot、Option 和Quit。
Plot中有Sine Wave和Cosine Wave两个子菜单项,分别控制在本图形窗口画出正弦和余弦曲线。
Option菜单项的内容如图8.1所示,其中Grid on和Grid off控制给坐标轴加网格线,Box on和Box off控制给坐标轴加边框,而且这4项只有在画有曲线时才是可选的。
Window Color控制图形窗口背景颜色。
Quit控制是否退出系统。
screen=get(0,'ScreenSize');W=screen(3);H=screen(4);figure('Color',[1,1,1],'Position',[0.2*H,0.2*H,0.5*W,0.3*H],...'Name','图形演示系统','NumberTitle','off','MenuBar','none');%定义Plot菜单项hplot=uimenu(gcf,'Label','&Plot');uimenu(hplot,'Label','Sine Wave','Call',...['t=-pi:pi/20:pi;','plot(t,sin(t));',...'set(hgon,''Enable'',''on'');',...'set(hgoff,''Enable'',''on'');',...'set(hbon,''Enable'',''on'');',...'set(hboff,''Enable'',''on'');']);uimenu(hplot,'Label','Cosine Wave','Call',...['t=-pi:pi/20:pi;','plot(t,cos(t));',...'set(hgon,''Enable'',''on'');',...'set(hgoff,''Enable'',''on'');',...'set(hbon,''Enable'',''on'');',...'set(hboff,''Enable'',''on'');']);%定义Option菜单项hoption=uimenu(gcf,'Label','&Option');hgon=uimenu(hoption,'Label','&Grid on',...'Call','grid on','Enable','off');hgoff=uimenu(hoption,'Label','&Grid off',...'Call','grid off','Enable','off');hbon=uimenu(hoption,'Label','&Box on',...'separator','on','Call','box on','Enable','off');hboff=uimenu(hoption,'Label','&Box off',...'Call','box off','Enable','off');hwincor=uimenu(hoption,'Label','&Window Color','Separator','on');uimenu(hwincor,'Label','&Red','Accelerator','r',...'Call','set(gcf,''Color'',''r'');');uimenu(hwincor,'Label','&Blue','Accelerator','b',...'Call','set(gcf,''Color'',''b'');');uimenu(hwincor,'Label','&Yellow','Call',...'set(gcf,''Color'',''y'');');uimenu(hwincor,'Label','&White','Call',...'set(gcf,''Color'',''w'');');%定义Quit菜单项uimenu(gcf,'Label','&Quit','Call','close(gcf)');例8.2绘制曲线y=2e-0.5x sin(2πx),并建立一个与之相联系的快捷菜单,用以控制曲线的线型和曲线宽度。
matlab gui实例

matlab gui实例MATLAB GUI实例MATLAB GUI是一种基于图形用户界面的交互式工具,它可以帮助用户快速创建自己的图形界面,并且可以通过简单的拖放操作来实现各种功能。
在本文中,我们将介绍一个简单的MATLAB GUI实例,以帮助初学者更好地理解和掌握这一工具。
首先,我们需要创建一个新的MATLAB GUI。
在MATLAB主界面中,选择“新建”->“GUI”->“App Designer”,然后选择“Blank App”模板。
接下来,我们需要添加一些基本的组件,例如按钮、文本框和列表框。
这些组件可以通过拖放操作从左侧的“组件”面板中添加到GUI窗口中。
在本例中,我们将创建一个简单的计算器应用程序,用户可以通过输入两个数字和选择一个操作符来计算结果。
因此,我们需要添加两个文本框用于输入数字,一个列表框用于选择操作符,一个按钮用于触发计算操作,并且一个文本框用于显示结果。
这些组件可以通过以下代码添加到GUI窗口中:```matlabclassdef Calculator < matlab.apps.AppBase% Properties that correspond to app componentsproperties (Access = public)UIFigure matlab.ui.FigureNumber1EditField matlab.ui.control.NumericEditField Number2EditField matlab.ui.control.NumericEditField OperatorListBox matlab.ui.control.ListBoxCalculateButton matlab.ui.control.ButtonResultEditField matlab.ui.control.NumericEditField end% Callbacks that handle component eventsmethods (Access = private)% Button pushed function: CalculateButtonfunction CalculateButtonPushed(app, event)% Get the input valuesnum1 = app.Number1EditField.Value;num2 = app.Number2EditField.Value;op = app.OperatorListBox.Value;% Calculate the resultswitch opcase '+'result = num1 + num2;case '-'result = num1 - num2;case '*'result = num1 * num2;case '/'result = num1 / num2;end% Display the resultapp.ResultEditField.Value = result; endend% App initialization and constructionmethods (Access = private)% Create UIFigure and componentsfunction createComponents(app)% Create UIFigure and set propertiesapp.UIFigure = uifigure('Name', 'Calculator');app.UIFigure.Position = [100 100 640 480];% Create Number1EditFieldapp.Number1EditField = uieditfield(app.UIFigure,'numeric');app.Number1EditField.Position = [50 400 100 22];% Create Number2EditFieldapp.Number2EditField = uieditfield(app.UIFigure,'numeric');app.Number2EditField.Position = [200 400 100 22];% Create OperatorListBoxapp.OperatorListBox = uilistbox(app.UIFigure);app.OperatorListBox.Items = {'+', '-', '*', '/'};app.OperatorListBox.Position = [350 400 100 80];app.OperatorListBox.Value = '+';% Create CalculateButtonapp.CalculateButton = uibutton(app.UIFigure, 'push'); app.CalculateButton.ButtonPushedFcn = createCallbackFcn(app, @CalculateButtonPushed, true);app.CalculateButton.Position = [500 400 100 22];app.CalculateButton.Text = 'Calculate';% Create ResultEditFieldapp.ResultEditField = uieditfield(app.UIFigure, 'numeric'); app.ResultEditField.Position = [50 300 100 22];app.ResultEditField.Value = 0;endend% App creation and deletionmethods (Access = public)% Construct appfunction app = Calculator% Create UIFigure and componentscreateComponents(app);% Show the figure after all components are createdapp.UIFigure.Visible = 'on';endendend```在上面的代码中,我们定义了一个名为“Calculator”的类,它继承自“matlab.apps.AppBase”类。
MATLAB编程 讲义及实例
4.1程序流程语句
4.1程序流程语句
4.1.3 其他流程控制语句 1.break语句和continue语句 break语句用于终止循环的执行。当在循环体内执行 到该语句时,程序将跳出循环,继续执行循环语句 的下一语句。 continue语句控制跳过循环体中的某些语句。当在循 环体内执行到该语句时,程序将跳过循环体中所有 剩下的语句,继续下一次循环。
给定两个实数a、b,一个自然数n,求解当 n=1,…,10时所有的(a+b)^n和(a-b)^n。
4.1程序流程语句
4.1程序流程语句
4.1.1 选择结构 思考: 给出学生的百分制成绩,要求转化成成绩等级输 出,等级分为‘优秀’,‘良好’,‘中等’, ‘及格’.90分以上的为‘优秀’,80-89的为‘良 好’,70-79的为‘中等’,60-69的为‘及格’,其 他为’不及格’.
4.1程序流程语句
4.1程序流程语句
例:求[100,200]之间第一个能被21整除的整数。
4.1程序流程语句 4.1.3 其他流程控制语句 2.try语句 语句格式为: try 语句组1 catch 语句组2 end try语句先试探性执行语句组1,如果语 句组1在执行过程中出现错误,则将错误信息 赋给保留的lasterr变量,并转去执行语句组2。
例:利用函数的递归调用,求n!。 显然,求n!需要求(n-1)!,这时可采用递归调 用。递归调用函数文件factor.m如下:
§4.2 M命令文件和M函数文件
例 nargin用法示例。 x=[1:3]; y=[1;2;3]; charray(x) charray(x,y') charray(x,y,3)
程序2: 首先建立函数文件f2c.m。 function c=f2c(f) c=5*(f-32)/9
matlab图形界面实验
实验六 图形界面设计实验一 实验目的1、理解图形对象和图形句柄的基本概念2、掌握图形对象属性的基本操作3、掌握利用图形对象进行绘图操作的方法4、掌握菜单的设计方法5、掌握各种控件的属性和创建方法6、图形用户界面设计工具的使用方法二 实验内容1 建立一个图形窗口,标题名称为“我的图形窗口”,起始于屏幕左下角、宽度和高度分别为450像素点和250像素点,保留原有菜单项,背景颜色为红色,且当用户从键盘按下任意一个键时,将在该窗口绘制正弦曲线。
(如图所示) 2利用图形对象绘制下列曲线,要求先用默认属性绘制曲线,然后通过图形句柄操作来改变曲线的颜色、线型和线宽,并利用文本对象给曲线添加文字标注。
(1)1ln(2y x =+(2) 2sin x y x x e =+-3利用坐标轴对象实现图形窗口的任意分割,即在任意位置分别绘制出不同的函数曲线(选作)4 建立一个菜单系统。
菜单条中含有File 和Help 两个菜单项。
如果选择File 中的New 选项,则将显示New Item 字样,如果选择File 中的Open 选项,则将显示出Open Item 字样。
File 中的Save 菜单项初始时处于禁选状态,在选择Help 选项之后将此菜单项恢复成可选状态,如果选择File 中的Save As 选项,则将显示Save As Item 字样。
如果选择File 中的Exit 选项,则将关闭当前窗口。
如果选择Help 中About …选项,则将显示Help Item 字样,并将Save •菜单设置成可选状态。
5 绘制一条抛物线,创建一个与之相联系的菜单,用以控制曲线线型和颜色。
6 建立如图所示的图形演示窗口,在编辑框输入a,b,c的值,当点击绘图按钮时,绘制2++的图像,观察a,b,c对图像的影响。
ax bx c要求:完成后将相关程序和运行结果直接附在相关题号后面提交到FTP上,文件命名为学号和姓名。
一个实例搞定MATLAB界面编程
那么如何来保存一副图片?用imwrite命 令 。但 imwrite命令的第一个参数就是你 读入的图片数据,也就是imread的返回值。这样的话,我们就要将 m_file_open_Callback中的程序做一点小小的改动。将最后一句 (imshow(imread(fpath))),更改为两句,如下: img_src=imread(fpath);imshow(img_src); 不仅如此,我们的保存菜单的Callback函数,如何去获得打开菜单的Callback 函数下的img_src变量呢?这里就要将img_src来作为一个共享的数据。许多界面 编程的朋友,喜欢用global声明。我个人不喜欢这样用,因为有更好的方法。那 就是用setappdata和getappdata两个函数。我们可以为界面上面的任何一个具有 Tag属性的空间添加应用程序数据。当然我比较喜欢将这些共享的应用程序数据 统一添加到Figure窗口上,因为这样容易记,如果一个控件一个,感觉不容易记 。 你在.m文件中会发现除了各个菜单项的Callback函数以外,还有两个函数: pjimage_OpeningFcn和pjimage_OutputFcn.而pjimage_OpeningFcn就相当于界 面的初始化函数,而pjimage_OutputFcn则是界面的输出函数,也就是当你不运 行fig,而调用.m文件时的返回值。 所以,我们要在pjimage_OpeningFcn中添加如下的程序,来共享这个img_src矩 阵。代码如下: setappdata(handles.figure_pjimage,’img_src’,0); 然后,在m_file_open_Callback函数的最后写上如下程序: setappdata(handles.figure_pjimage,’img_src’,img_src); 那么,我们在m_file_save_Callback函数中就可以像这样的来提取img_src,如 下: img_src=getappdata(handles.figure_pjimage,’img_src’); 那么保存的时候,自然会用到保存对话框了。要用保存对话框,就要用到 uiputfile函数了,具体的请用help uiputfile查看。 那么,保存菜单项下的程序(m_file_save_Callback),可以这样写: [filename, pathname] = uiputfile({'*.bmp','BMP files';'*.jpg;','JPG files'}, 'Pick an Image'); if isequal(filename,0) || isequal(pathname,0)