MATLAB实验代码汇总
MATLAB实验代码与运行结果
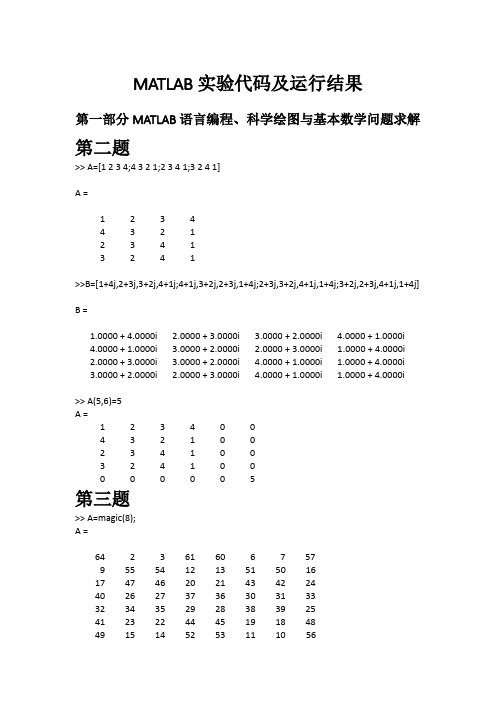
MATLAB实验代码及运行结果第一部分MATLAB语言编程、科学绘图与基本数学问题求解第二题>> A=[1 2 3 4;4 3 2 1;2 3 4 1;3 2 4 1]A =1 2 3 44 3 2 12 3 4 13 24 1>>B=[1+4j,2+3j,3+2j,4+1j;4+1j,3+2j,2+3j,1+4j;2+3j,3+2j,4+1j,1+4j;3+2j,2+3j,4+1j,1+4j]B =1.0000 + 4.0000i2.0000 +3.0000i 3.0000 + 2.0000i4.0000 + 1.0000i4.0000 + 1.0000i 3.0000 + 2.0000i 2.0000 + 3.0000i 1.0000 + 4.0000i2.0000 +3.0000i 3.0000 + 2.0000i4.0000 + 1.0000i 1.0000 + 4.0000i3.0000 + 2.0000i 2.0000 + 3.0000i4.0000 + 1.0000i 1.0000 + 4.0000i >> A(5,6)=5A =1 2 3 4 0 04 3 2 1 0 02 3 4 1 0 03 24 1 0 00 0 0 0 0 5第三题>> A=magic(8);A =64 2 3 61 60 6 7 579 55 54 12 13 51 50 1617 47 46 20 21 43 42 2440 26 27 37 36 30 31 3332 34 35 29 28 38 39 2541 23 22 44 45 19 18 4849 15 14 52 53 11 10 568 58 59 5 4 62 63 1 B=A(2:2:end,:)B =9 55 54 12 13 51 50 1640 26 27 37 36 30 31 3341 23 22 44 45 19 18 488 58 59 5 4 62 63 1 第四题>> format long;sum(2.^[0:63])ans =1.844674407370955e+19>> sum(sym(2).^[0:63])ans =18446744073709551615第五题(1)>> x=[-1:0.001:1];y=sin(1./x);plot(x,y)(2)>>t=[-pi:0.005:pi];y=sin(tan(t))-tan(sin(t));plot(t,y)第六题[x,y]=meshgrid(-2:0.1:2);z=1./(sqrt((1-x).^2+y.^2))+1./(sqrt((1+x).^2+y.^2));subplot(2 24),surf(x,y,z),shadingflat;subplot(221),surf(x,y,z),view(0,90);subplot(222),surf(x,y,z),view(90,0);subplot(22 3),surf(x,y,z),view(0,0)>>Warning: Divide by zero.Warning: Divide by zero.xx=[-2:0.1:-1.2,-1.1:0.02:-0.9,-0.8:0.1:0.8,0.9:0.02:1.1,1.2:0.1:2];yy=[-1:0.1:-0.2,-0.1:0 .02:0.1,0.2:0.1:1];[x,y]=meshgrid(xx,yy);z=1./((sqrt(1-x).^2+y.^2))+1./(sqrt((1+x).^2+y. ^2));subplot(224),surf(x,y,z),shadingflat;zlim([0,15]);subplot(221),surf(x,y,z),view(0,90);subplot(222),surf(x,y,z),view(90,0) ;subplot(223),surf(x,y,z),view(0,0)第七题(1)>> syms x;f=(3^x+9^x)^(1/x);limit(f,x,inf)ans =9(2)>> syms x y;f=x*y/(sqrt(x*y+1)-1);limit(limit(f,y,0),x,0)ans =2(3)>> syms x y;f=(1-cos(x^2+y^2))/((x^2+y^2)*exp(x^2+y^2));limit(limit(f,y,0),x,0) ans =第八题第一步新建脚本function result=paradiff(y,x,t,n)if mod(n,1)~=0,error('n should positive innteger,please correct')else if n==1,result=diff(y,t)/diff(x,t);else result=diff(y,x,t,n-1)/diff(x,t);end,end(1)syms t;x=log(cos(t));y=cos(t)-t*sin(t);f=simplify(paradiff(y,x,t,1))f =(cos(t)*(2*sin(t) + t*cos(t)))/sin(t)(2)syms t;f=(cos(t)*(2*sin(t) + t*cos(t)))/sin(t);f1=diff(f)f1 =(cos(t)*(3*cos(t) - t*sin(t)))/sin(t) - t*cos(t) - (cos(t)^2*(2*sin(t) + t*cos(t)))/sin(t)^2 - 2*sin(t)t=pi/3;f1 =(cos(t)*(3*cos(t) - t*sin(t)))/sin(t) - t*cos(t) - (cos(t)^2*(2*sin(t) + t*cos(t)))/sin(t)^2 - 2*sin(t)f1 =-2.6651第九题>> syms x y t;f=int(exp(-t^2),t,0,x*y);F=(x/y)*(diff(f,x,2))-2*(diff(diff(f,x,1),y,1))+diff(f,y,2)F =2*x^2*y^2*exp(-x^2*y^2) - 2*x^3*y*exp(-x^2*y^2) - 2*exp(-x^2*y^2)第十题(1)>> syms n m;limit(symsum(1/((2*m)^2-1),m,1,n),n,inf)1/2(2)>> syms m n;limit(symsum(n*(1/(n^2+m*pi)),m,1,n),n,inf)ans =1第十一题(1)>> syms t;syms a positive;x=a*(cos(t)+t*sin(t));y=a*(sin(t)-t*cos(t));I=int((x^2+y^2)*sqrt(diff(y,t)^2+diff (x,t)^2),t,0,2*pi)I =2*pi^2*a^3*(2*pi^2 + 1)(2)>> syms t x y;syms a c b positive;x=c*cos(t)/a;y=c*sin(t)/b;F=[y*x^3+exp(y),x*y^3+x*exp(y)-2*y];ds=[diff(x,t); diff(y,t)]; I=int(F*ds,t,pi,0)I =(2*c*(15*b^4 - 2*c^4))/(15*a*b^4)第十二题>> syms a b c d e;A=[a^4,a^3,a^2,a,1;b^4,b^3,b^2,b,1;c^4,c^3,c^2,c,1;d^4,d^3,d^2,d,1;e^4,e^3,e^2,e,1];simplify (det(A))ans =(a - b)*(a - c)*(a - d)*(b - c)*(a - e)*(b - d)*(b - e)*(c - d)*(c - e)*(d - e)第十三题>> A=[2 0.5 -0.5 0.5;0 -1.5 0.5 -0.5;2,0.5 -4.5 0.5;2 1 -2 -2];[V,J]=jordan(sym(A))V =[ 0, 1/8, 1/2, 3/8][ 0, 0, -2, -3][ -1/6, 1/24, -1/2, 1/8][ -1/6, 1/24, -5/2, 9/8]J =[ -4, 0, 0, 0][ 0, 2, 0, 0][ 0, 0, -2, 1][ 0, 0, 0, -2]第十四题编写函数代码function X=lyapsym(A,B,C)if nargin==2,C=B;B=A';end[nr,nc]=size(C);A0=kron(A,eye(nc))+kron(eye(nr),B');tryC1=C';x0=-inv(A0)*C1(:);X=reshape(x0,nc,nr)';catch,error('singular matrix found.'),end>> A=[3 -6 -4 0 5;1 4 2 -2 4;-6 3 -6 7 3;-13 10 0 -11 0;0 4 0 3 4];B=[3 -2 1;-2 -9 2;-2 -1 9];C=-[-2 1 -1;4 1 2;5 -6 1;6 -4 -4;-6 6 -3];X=lyap(A,B,C),norm(A*X+X*B+C);X=lyapsym(sym(A),B,C),norm(A*X+X*B+C)X =4.0569 14.5128 -1.5653-0.0356 -25.0743 2.7408-9.4886 -25.9323 4.4177-2.6969 -21.6450 2.8851-7.7229 -31.9100 3.7634X =[ 434641749950/107136516451, 4664546747350/321409549353, -503105815912/321409549353][ -3809507498/107136516451, -8059112319373/321409549353, 880921527508/321409549353][ -1016580400173/107136516451, -8334897743767/321409549353, 1419901706449/321409549353][ -288938859984/107136516451, -6956912657222/321409549353, 927293592476/321409549353][ -827401644798/107136516451, -10256166034813/321409549353, 1209595497577/321409549353](2)>> A=[3 -6 -4 0 5;1 4 2 -2 4;-6 3 -6 7 3;-13 10 0 -11 0;0 4 0 3 4];B=[3 -2 1;-2 -9 2;-2 -1 9];C=-[-2 1 -1;4 1 2;5 -6 1;6 -4 -4;-6 6 -3];X=lyap(A,B,C),norm(A*X+X*B+C)X =4.0569 14.5128 -1.5653-0.0356 -25.0743 2.7408-9.4886 -25.9323 4.4177-2.6969 -21.6450 2.8851-7.7229 -31.9100 3.7634ans =3.4356e-13第十五题>> syms t;A=[-4.5,0,0.5,-1.5;-0.5,-4,0.5,-0.5;1.5,1,-2.5,1.5;0,-1,-1,-3];B=simplify(expm(A*t))B =[ (exp(-5*t)*(exp(2*t) - t*exp(2*t) + t^2*exp(2*t) + 1))/2, (exp(-5*t)*(2*t*exp(2*t) - exp(2*t) + 1))/2, (t*exp(-3*t)*(t + 1))/2, -(exp(-5*t)*(exp(2*t) + t*exp(2*t) - t^2*exp(2*t) - 1))/2][ (exp(-5*t)*(t*exp(2*t) - exp(2*t) + 1))/2, (exp(-5*t)*(exp(2*t) + 1))/2, (t*exp(-3*t))/2, (exp(-5*t)*(t*exp(2*t) - exp(2*t) + 1))/2][ (exp(-5*t)*(exp(2*t) + t*exp(2*t) - 1))/2, (exp(-5*t)*(exp(2*t) - 1))/2, (exp(-3*t)*(t + 2))/2, (exp(-5*t)*(exp(2*t) + t*exp(2*t) - 1))/2][ -(t^2*exp(-3*t))/2, -t*exp(-3*t), -(t*exp(-3*t)*(t + 2))/2, -(exp(-3*t)*(t^2 - 2))/2]>> C=simplify(sin(A*t))C =[ -sin((9*t)/2), 0, sin(t/2), -sin((3*t)/2)][ -sin(t/2), -sin(4*t), sin(t/2), -sin(t/2)][ sin((3*t)/2), sin(t), -sin((5*t)/2), sin((3*t)/2)][ 0, -sin(t), -sin(t), -sin(3*t)]>> D=simplify(expm(A*t)*sin(A^2*expm(A*t)*t))D =[ (exp(-5*t)*sin((t*exp(-5*t)*(9*t*exp(2*t) - 15*exp(2*t) + 25))/2)*(2*t*exp(2*t) - exp(2*t) + 1))/2 + (exp(-5*t)*sin((t*exp(-3*t)*(9*t^2 - 12*t + 2))/2)*(exp(2*t) + t*exp(2*t) - t^2*exp(2*t) - 1))/2 + (exp(-5*t)*sin((t*exp(-5*t)*(17*exp(2*t) - 21*t*exp(2*t) + 9*t^2*exp(2*t) + 25))/2)*(exp(2*t) - t*exp(2*t) + t^2*exp(2*t) + 1))/2 + (t*exp(-3*t)*sin((t*exp(-5*t)*(3*exp(2*t) + 9*t*exp(2*t) - 25))/2)*(t + 1))/2, (exp(-5*t)*sin((t*exp(-5*t)*(9*exp(2*t) + 25))/2)*(2*t*exp(2*t) - exp(2*t) + 1))/2 + (exp(-5*t)*sin((t*exp(-5*t)*(18*t*exp(2*t) - 21*exp(2*t) + 25))/2)*(exp(2*t) - t*exp(2*t) + t^2*exp(2*t) + 1))/2 + (exp(-5*t)*sin(3*t*exp(-3*t)*(3*t - 2))*(exp(2*t) + t*exp(2*t) - t^2*exp(2*t) - 1))/2 + (t*exp(-3*t)*sin((t*exp(-5*t)*(9*exp(2*t) - 25))/2)*(t + 1))/2, (exp(-5*t)*sin((3*t*exp(-3*t)*(3*t - 2))/2)*(2*t*exp(2*t) - exp(2*t) + 1))/2 - (exp(-5*t)*sin((t*exp(-3*t)*(- 9*t^2 + 3*t + 4))/2)*(exp(2*t) - t*exp(2*t) + t^2*exp(2*t) + 1))/2 + (exp(-5*t)*sin((t*exp(-3*t)*(9*t^2 + 6*t - 10))/2)*(exp(2*t) + t*exp(2*t) - t^2*exp(2*t) - 1))/2 + (t*exp(-3*t)*sin((3*t*exp(-3*t)*(3*t + 4))/2)*(t + 1))/2, (exp(-5*t)*sin((t*exp(-5*t)*(9*t*exp(2*t) - 15*exp(2*t) + 25))/2)*(2*t*exp(2*t) - exp(2*t) + 1))/2 - (exp(-5*t)*sin((t*exp(-5*t)*(exp(2*t) + 21*t*exp(2*t) - 9*t^2*exp(2*t) - 25))/2)*(exp(2*t) - t*exp(2*t) + t^2*exp(2*t) + 1))/2 - (exp(-5*t)*sin((t*exp(-3*t)*(- 9*t^2 + 12*t + 16))/2)*(exp(2*t) + t*exp(2*t) - t^2*exp(2*t) - 1))/2 + (t*exp(-3*t)*sin((t*exp(-5*t)*(3*exp(2*t) + 9*t*exp(2*t) - 25))/2)*(t + 1))/2][ (exp(-5*t)*sin((t*exp(-5*t)*(1 7*exp(2*t) - 21*t*exp(2*t) + 9*t^2*exp(2*t) + 25))/2)*(t*exp(2*t) - exp(2*t) + 1))/2 - (exp(-5*t)*sin((t*exp(-3*t)*(9*t^2 - 12*t + 2))/2)*(t*exp(2*t) - exp(2*t) + 1))/2 + (t*exp(-3*t)*sin((t*exp(-5*t)*(3*exp(2*t) + 9*t*exp(2*t) - 25))/2))/2 + (exp(-5*t)*sin((t*exp(-5*t)*(9*t*exp(2*t) - 15*exp(2*t) + 25))/2)*(exp(2*t) + 1))/2, (exp(-5*t)*sin((t*exp(-5*t)*(18*t*exp(2*t) - 21*exp(2*t) + 25))/2)*(t*exp(2*t) - exp(2*t) + 1))/2 - (exp(-5*t)*sin(3*t*exp(-3*t)*(3*t - 2))*(t*exp(2*t) - exp(2*t) + 1))/2 + (t*exp(-3*t)*sin((t*exp(-5*t)*(9*exp(2*t) - 25))/2))/2 + (exp(-5*t)*sin((t*exp(-5*t)*(9*exp(2*t) + 25))/2)*(exp(2*t) + 1))/2, (exp(-3*t)*sin((3*t*exp(-3*t)*(3*t - 2))/2))/2 + (exp(-5*t)*sin((3*t*exp(-3*t)*(3*t - 2))/2))/2 + (exp(-3*t)*sin((t*exp(-3*t)*(- 9*t^2 + 3*t + 4))/2))/2 - (exp(-5*t)*sin((t*exp(-3*t)*(- 9*t^2 + 3*t + 4))/2))/2 + (exp(-3*t)*sin((t*exp(-3*t)*(9*t^2 + 6*t - 10))/2))/2 - (exp(-5*t)*sin((t*exp(-3*t)*(9*t^2 + 6*t - 10))/2))/2 + (t*exp(-3*t)*sin((3*t*exp(-3*t)*(3*t + 4))/2))/2 - (t*exp(-3*t)*sin((t*exp(-3*t)*(- 9*t^2 + 3*t + 4))/2))/2 - (t*exp(-3*t)*sin((t*exp(-3*t)*(9*t^2 + 6*t - 10))/2))/2, (exp(-5*t)*sin((t*exp(-3*t)*(- 9*t^2 + 12*t + 16))/2)*(t*exp(2*t) - exp(2*t) + 1))/2 - (exp(-5*t)*sin((t*exp(-5*t)*(exp(2*t) + 21*t*exp(2*t) - 9*t^2*exp(2*t) - 25))/2)*(t*exp(2*t) - exp(2*t) + 1))/2 + (t*exp(-3*t)*sin((t*exp(-5*t)*(3*exp(2*t) + 9*t*exp(2*t) - 25))/2))/2 + (exp(-5*t)*sin((t*exp(-5*t)*(9*t*exp(2*t) - 15*exp(2*t) + 25))/2)*(exp(2*t) + 1))/2][ (exp(-5*t)*sin((t*exp(-5*t)*(17*ex p(2*t) - 21*t*exp(2*t) + 9*t^2*exp(2*t) + 25))/2)*(exp(2*t) + t*exp(2*t) - 1))/2 - (exp(-5*t)*sin((t*exp(-3*t)*(9*t^2 - 12*t + 2))/2)*(exp(2*t) + t*exp(2*t) - 1))/2 + exp(-3*t)*sin((t*exp(-5*t)*(3*exp(2*t) + 9*t*exp(2*t) - 25))/2)*(t/2 + 1) + (exp(-5*t)*sin((t*exp(-5*t)*(9*t*exp(2*t) - 15*exp(2*t) + 25))/2)*(exp(2*t) - 1))/2, exp(-3*t)*sin((t*exp(-5*t)*(9*exp(2*t) - 25))/2)*(t/2 + 1) + (exp(-5*t)*sin((t*exp(-5*t)*(9*exp(2*t) + 25))/2)*(exp(2*t) - 1))/2 + (exp(-5*t)*sin((t*exp(-5*t)*(18*t*exp(2*t) - 21*exp(2*t) + 25))/2)*(exp(2*t) + t*exp(2*t) - 1))/2 - (exp(-5*t)*sin(3*t*exp(-3*t)*(3*t - 2))*(exp(2*t) + t*exp(2*t) - 1))/2, exp(-3*t)*sin((3*t*exp(-3*t)*(3*t + 4))/2)*(t/2 + 1) - (exp(-5*t)*sin((t*exp(-3*t)*(9*t^2 + 6*t - 10))/2)*(exp(2*t) + t*exp(2*t) - 1))/2 - (exp(-5*t)*sin((t*exp(-3*t)*(- 9*t^2 + 3*t + 4))/2)*(exp(2*t) + t*exp(2*t) - 1))/2 + (exp(-5*t)*sin((3*t*exp(-3*t)*(3*t - 2))/2)*(exp(2*t) - 1))/2, (exp(-5*t)*sin((t*exp(-3*t)*(- 9*t^2 + 12*t + 16))/2)*(exp(2*t) + t*exp(2*t) - 1))/2 + exp(-3*t)*sin((t*exp(-5*t)*(3*exp(2*t) + 9*t*exp(2*t) - 25))/2)*(t/2 + 1) + (exp(-5*t)*sin((t*exp(-5*t)*(9*t*exp(2*t) - 15*exp(2*t) + 25))/2)*(exp(2*t) - 1))/2 - (exp(-5*t)*sin((t*exp(-5*t)*(exp(2*t) + 21*t*exp(2*t) - 9*t^2*exp(2*t) - 25))/2)*(exp(2*t) + t*exp(2*t) - 1))/2][exp(-3*t)*sin((t*exp(-3*t)*(9*t^2 - 12*t + 2))/2)*(t^2/2 - 1) - (t^2*exp(-3*t)*sin((t*exp(-5*t)*(17*exp(2*t) - 21*t*exp(2*t) + 9*t^2*exp(2*t) + 25))/2))/2 - t*exp(-3*t)*sin((t*exp(-5*t)*(9*t*exp(2*t) - 15*exp(2*t) + 25))/2) - (t*exp(-3*t)*sin((t*exp(-5*t)*(3*exp(2*t) + 9*t*exp(2*t) - 25))/2)*(t + 2))/2, exp(-3*t)*sin(3*t*exp(-3*t)*(3*t - 2))*(t^2/2 - 1) - t*exp(-3*t)*sin((t*exp(-5*t)*(9*exp(2*t) + 25))/2) - (t^2*exp(-3*t)*sin((t*exp(-5*t)*(18*t*exp(2*t) - 21*exp(2*t) + 25))/2))/2 - (t*exp(-3*t)*sin((t*exp(-5*t)*(9*exp(2*t) - 25))/2)*(t + 2))/2, -(exp(-3*t)*(2*sin((t*exp(-3*t)*(9*t^2 + 6*t - 10))/2) - t^2*sin((t*exp(-3*t)*(- 9*t^2 + 3*t + 4))/2) - t^2*sin((t*exp(-3*t)*(9*t^2 + 6*t - 10))/2) + 2*t*sin((3*t*exp(-3*t)*(3*t - 2))/2) + 2*t*sin((3*t*exp(-3*t)*(3*t + 4))/2) + t^2*sin((3*t*exp(-3*t)*(3*t + 4))/2)))/2, exp(-3*t)*sin((t*exp(-3*t)*(- 9*t^2 + 12*t + 16))/2) - (t^2*exp(-3*t)*sin((t*exp(-3*t)*(- 9*t^2 + 12*t + 16))/2))/2 - t*exp(-3*t)*sin((t*exp(-5*t)*(3*exp(2*t) + 9*t*exp(2*t) - 25))/2) - t*exp(-3*t)*sin((t*exp(-5*t)*(9*t*exp(2*t) - 15*exp(2*t) + 25))/2) - (t^2*exp(-3*t)*sin((t*exp(-5*t)*(3*exp(2*t) + 9*t*exp(2*t) - 25))/2))/2 + (t^2*exp(-3*t)*sin((t*exp(-5*t)*(exp(2*t) + 21*t*exp(2*t) - 9*t^2*exp(2*t) - 25))/2))/2]第二部分数学问题求解与数据处理第一题(1)>> syms a t;f=sin(a*t)/t;F=simplify(laplace(f))F =atan(a/s)(2)>> syms a t;f=t^5*sin(a*t);F=simplify(laplace(f))F =(240*a*s*(3*a^4 - 10*a^2*s^2 + 3*s^4))/(a^2 + s^2)^6(3)>> syms a t;f=t^8*cos(a*t);F=simplify(laplace(f))F =(40320*s*(9*a^8 - 84*a^6*s^2 + 126*a^4*s^4 - 36*a^2*s^6 + s^8))/(a^2 + s^2)^9 第二题(1)>> syms a s b t;f=1/(sqrt(s*s)*(s^2-a^2)*(s+b));f1=ilaplace(f,s,t)f1 =-ilaplace(1/((b + s)*(a^2 - s^2)*(s^2)^(1/2)), s, t)(2)>> syms s a b t;f=sqrt(s-a)-sqrt(s-b);f1=ilaplace(f,s,t)f1 =ilaplace((s - a)^(1/2), s, t) - ilaplace((s - b)^(1/2), s, t)(3)>> syms a b s t;f=log((s-a)/(s-b));f1=ilaplace(f,s,t)f1 =exp(b*t)/t - exp(a*t)/t第三题(1)>> syms x t;f=x^2*(3*pi-abs(2*x));f1=ifourier(f,x)f1 =-(24/x^4 + 6*pi^2*dirac(x, 2))/(2*pi)(2)>> syms t;f=t^2*(t-2*pi);f1=ifourier(f,t)f1 =(pi*dirac(t, 3)*2*i + 4*pi^2*dirac(t, 2))/(2*pi)第四题(1)>> syms a T K;f=cos(K*a*T);f1=ztrans(f);f2=iztrans(f1)f2 =cos(K*T*n)(2)>> syms a T K;f=(K*T)^2*exp(-a*K*T);f1=ztrans(f);f2=iztrans(f1)f2 =K^2*T^2*kroneckerDelta(n, 0) - K^2*T^2*exp(-K*T)*(exp(K*T)*kroneckerDelta(n, 0) - exp(-K*T)^n*exp(K*T))(3)>> syms a K T;f=(a*T*K-1+exp(-a*T*K))/a;f1=ztrans(f);f2=iztrans(f1)f2 =exp(-K*T)^n/n - 1/n - K*T*(kroneckerDelta(n, 0) - 1) + K*T*kroneckerDelta(n, 0)第五题(1)>> syms x;f=exp(-(x+1)^2+pi/2)*sin(5*x+2);t=solve(f)t =-2/5>> subs(f,x,-2/5)ans =(2)>> syms x y;f=(x^2+y^2+x*y)*exp(-x^2-y^2-x*y);x1=solve('(x^2+y^2+x*y)*exp(-x^2-y^2-x*y)','x') x1 =- y/2 + (3^(1/2)*y*i)/2- y/2 - (3^(1/2)*y*i)/2>> simplify(subs(f,x,x1))ans =第六题>> syms c x;solve(diff(int((exp(x)-c*x)^2,x,0,1),c))ans =3第七题写函数: function [c,ce]=c6exmcon(x)ce=[];c=[x(1)+x(2);x(1)*x(2)-x(1)-x(2)+1.5;-10-x(1)*x(2)];>> clear P;P.nonlcon=@c6exmcon;P.solver='fmincon';P.options=optimset;P.objective=@(x)exp(x(1))*(4*x( 1)^2+2*x(2)^2+4*x(1)*x(2)+2*x(2)+1);...ff=optimset;ff.TolX=1e-20;ff.TolFum=1e-20;P.options=ff;P.lb=[-10;-10];P.ub=-P.lb;P.x0=[0;0];[x,f1,fla g]=fmincon(P)Local minimum found that satisfies the constraints.Optimization completed because the objective function is non-decreasing infeasible directions, to within the default value of the function tolerance,and constraints are satisfied to within the default value of the constraint tolerance.<stopping criteria details>x =1.1825-1.7398f1 =3.0608flag =1第八题N=10;[x1,x2,x3,x4,x5,x6,x7]=ndgrid(1:N,1:N,4:N,1:N,2:N,5:N,6:N);i=find((-x1<=0)&(-x2<=0)&(-x3< =0)&(-x4<=0)&(-x5<=0)&(-x6<=0)&(-x7<=0)&(3534*x1+2356*x2+1767*x3+589*x4+528*x5+451* x6+304*x7<=119567));x1=x1(i);x2=x2(i);x3=x3(i);x4=x4(i);x5=x5(i);x6=x6(i);x7=x7(i);f=592*x1+381 *x2+273*x3+55*x4+48*x5+37*x6+23*x7;[fmax,ii]=sort(f);index=ii(1);x=[x1(index),x2(index),x3(in dex),x4(index),x5(index),x6(index),x7(index)]x =1 1 4 12 5 6第九题syms x y;y1=dsolve('D2y-(2-1/x)*Dy+(1-1/x)*y=x^2*exp(-5*x)','x');simplify(y1)ans =(exp(-5*x)*(30*x - 6*ei(-6*x)*exp(6*x) + 36*x^2 + 1296*C7*exp(6*x) + 1296*C8*exp(6*x)*log(x) + 11))/1296>> y=dsolve('D2y-(2-1/x)*Dy+(1-1/x)*y=x^2*exp(-5*x)','y(1)=sym(pi)','y((pi))=1','x');simplify(y)ans =(exp(-5*x)*(30*x + 6*log(x) + 108*x^2*log(x) + 216*x^3*log(x) - 6*ei(-6*x)*exp(6*x) + 36*x*log(x) + 36*x^2 + 11))/1296 - (exp(-5*x)*log(x)*(216*x^3 + 108*x^2 + 36*x + 6))/1296 + (exp(-6)*exp(x)*(6*ei(-6)*exp(6) + 1296*exp(5)*sym(pi) - 77))/1296 - (exp(-6*pi)*exp(-6)*exp(x)*log(x)*(11*exp(6) - 77*exp(6*pi) + 30*pi*exp(6) + 36*pi^2*exp(6) - 1296*exp(5*pi)*exp(6) + 6*ei(-6)*exp(6*pi)*exp(6) + 1296*exp(6*pi)*exp(5)*sym(pi) - 6*exp(6*pi)*exp(6)*ei(-6*pi)))/(1296*log(pi))第十题(1)>> syms t;x=dsolve('D2x+2*t*Dx+t^2*x=t+1');simplify(x)ans =C4*exp(-(t*(t - 2))/2) + C5*exp(-(t*(t + 2))/2) - (2^(1/2)*pi^(1/2)*erf(2^(1/2)*((t*i)/2 - i/2))*exp(-(t - 1)^2/2)*i)/2(2)>> syms x y;y=dsolve('Dy+2*x*y=x*exp(-x^2)')y =(exp(-x^2)*(C2*exp(-2*t*x) + 1))/2第十一题>>f=@(t,x)[-x(2)-x(3);x(1)+0.2*x(2);0.2+(x(1)-5.7)*x(3)];[t,x]=ode45(f,[0,100],[0;0;0]);plot(t,x) ;grid ;view(0,90)第十二题>>f=inline(['[x(2);-x(1)-x(3)-(3*x(2))^2+(x(4))^3+6*x(5)+2*t;','x(4);x(5);-x(5)-x(2)-exp(-x(1))-t]'],'t','x'); [t1,x1]=ode45(f,[1,0],[2,-4,-2,7,6]'); [t2,x2]=ode45(f,[1,2],[2,-4,-2,7,6]'); t=[t1(end:-1:1);t2];x=[x1(end:-1:1,:);x2];plot(x(:,1),x(:,3));plot(t,x)>> plot(x(:,1),x(:,3))第十三题[t,x,y]=sim('untitled12',[0,10]);plot(t,x)figure;plot(t,y)第十四题t=0:0.2:2; y=t.^2.*exp(-5*t).*sin(t);plot(t,y,'o')ezplot('t.^2.*exp(-5*t).*sin(t)',[0,2]);hold on;x1=0:0.01:2;y1=interp1(t,y,x1,'spline');plot(x1,y1)。
MATLAB实验代码
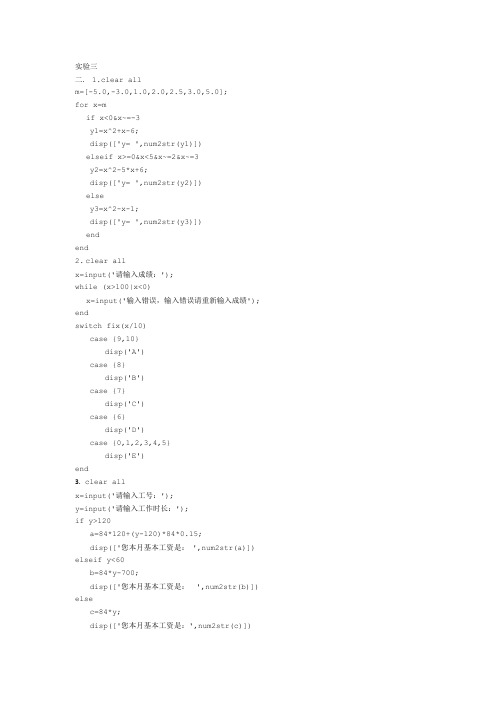
二. 1.clear allm=[-5.0,-3.0,1.0,2.0,2.5,3.0,5.0];for x=mif x<0&x~=-3y1=x^2+x-6;disp(['y= ',num2str(y1)])elseif x>=0&x<5&x~=2&x~=3y2=x^2-5*x+6;disp(['y= ',num2str(y2)])elsey3=x^2-x-1;disp(['y= ',num2str(y3)])endend2.clear allx=input('请输入成绩:');while (x>100|x<0)x=input('输入错误,输入错误请重新输入成绩'); endswitch fix(x/10)case {9,10}disp('A')case {8}disp('B')case {7}disp('C')case {6}disp('D')case {0,1,2,3,4,5}disp('E')end3. clear allx=input('请输入工号:');y=input('请输入工作时长:');if y>120a=84*120+(y-120)*84*0.15;disp(['您本月基本工资是: ',num2str(a)]) elseif y<60b=84*y-700;disp(['您本月基本工资是: ',num2str(b)]) elsec=84*y;disp(['您本月基本工资是:',num2str(c)])4. clear alla=fix(rand(1)*89)+10;disp(['a=',num2str(a)])b=fix(rand(1)*89)+10;disp(['b=',num2str(b)])x=input('输入一个四则运算符号:','s');if abs(x)==43c=a+b;elseif abs(x)==45c=a-b;elseif abs(x)==42c=a*b;elseif abs(x)==47c=a/b;enddisp(['计算结果是:',num2str(c)])5. clear alla=fix(rand(5,6)*89)+10;n=input('输入一个数(输出是一个5*6的矩阵该行元素):');if n>5|n<0b=a(5:5,:);disp(['输入错误,程序输出最后一行的元素: ',num2str(b)]) elsec=a(n:n,:);disp(['输出结果是:',num2str(c)])end实验四二.1. clear alls1=0;for n=1:100x=1/(n^2);s1=s1+x;enddisp(['当N=100时:',num2str(s1)])s2=0;for n=1:1000x=1/(n^2);s2=s2+x;enddisp(['当N=1000时: ',num2str(s2)])s3=0;for n=1:10000x=1/(n^2);s3=s3+x;disp(['当N=10000时:',num2str(s3)])2. clear alln=1;y=0;while (y<3)x=1/(2*n-1);n=1+n;y=y+x;enddisp(['y<3时n的最大值是:',num2str(n-2)]) disp(['相应的y值是: ',num2str(y-x)])3. clear allx=input('请输入x的初始值:');a=input('请输入常数a的值:');b=input('请输入常数b的值:');g=a/(b+x);n=0;while ((abs(x-g))>10^-5)g=a/(b+x);x=a/(b+g);n=n+1;if n>499breakendenddisp(['迭代结果是:',num2str(x)])disp(['循环次数:',num2str(n),'´Î'])r1=(-b+sqrt(b^2+4*a))/2;r2=(-b-sqrt(b^2+4*a))/2;disp(['如果迭代收敛,准确值:',num2str(r2)]) 4. clear allfor n=1:4if n==1f1=1;elseif n==2f2=0;elseif n==3f3=1;elsea=f3-2*f2+f1;b=a-2*f3+f2;c=b-2*a+f3;d=c-2*b+a;H=[1,0,1,a,b,c,d];for m=8:4:99a=d-2*c+b;b=a-2*d+c;c=b-2*a+d;d=c-2*b+a;H=[H,a,b,c,d];endf100=d-2*c+b;endendmax=max(H);min=min(H);sum=sum(H);disp(['最大值是:',num2str(max)]) disp(['最小值是:',num2str(min)]) disp(['各数和是:',num2str(sum)]) k=0;l=0;p=0;for e=Hif e>0k=k+1;elseif e<0l=l+1;elsep=p+1;endenddisp(['正数的个数是:',num2str(k)]) disp(['负数的个数是:',num2str(l)]) disp(['零的个数是: ',num2str(p)]) 5. clear allp=0;l=0;H=[];for m=2:49a=m;b=m+1;c=a*b-1;for k=1:cif rem(c,k)==0l=l+1;endendif l==2disp(['亲密数对是','(',num2str(a),' ,',num2str(b),')']) p=p+1;H=[H,c];endl=0;endsum=sum(H);disp(['亲密数对的个数是:',num2str(p)])disp(['亲密数对的和是: ',num2str(sum)])实验五 1.clear alla=input('请输入一个复数:');[e,l,s,c]=fushu(a);函数文件名:fushu.mfunction [e,l,s,c]=fushu(x)e=exp(x);l=log(x);s=sin(x);c=cos(x);disp(['复数e的指数是:',num2str(e)])disp(['复数e的对数是:',num2str(l)])disp(['复数e的正弦是:',num2str(s)])disp(['复数e的余弦是:',num2str(c)])2. clear allm1=input('请输入m1的值:');m2=input('请输入m2的值:');m3=input('请输入θ的值:');J=jiefangcheng(m1,m2,m3);函数文件名:jiefangcheng.mfunction J=jiefangcheng(m1,m2,m3)H=[m1*cos(m3*pi/180) -m1 -sin(m3*pi/180) 0m1*sin(m3*pi/180) 0 cos(m3*pi/180) 00 m2 -sin(m3*pi/180) 00 0 -cos(m3*pi/180) 1];K=[0;m1*9.8;0;m2*9.8];J=inv(H)*K;disp(['方程组的解是:',num2str(J')])3. clear allfor n=10:99a=sushu(n);end函数文件名:sushu.mfunction a=sushu(b)x=fix(b/10);y=rem(b,10);c=0;d=0;for m=1:bif rem(b,m)==0c=c+1;endendfor n=1:10*y+xif rem((10*y+x),n)==0d=d+1;endendif c==2&d==2a=b;disp(['绝对素数是:',num2str(a)])elsea=0; %这里可以赋值,目的是请程序执行end4. clear ally=input('请输入一个数或矩阵:');disp('输入的数或矩阵x是:')disp(y)L=fx(y);函数文件名:fx.mfunction L=fx(y)[m,n]=size(y); K=[];for a=1:nfor b=1:mx=sub2ind(size(y),b,a);h=1/((x-2)^2+0.1)+1/((x-3)^4+0.01); K=[K,h];endendL=reshape(K,n,m);disp('则f(x)=')disp(L')5. clear allfor n=20:10:40if n==20;[f1,f2]=f(n);a=f1;b=f2;elseif n==30;[f1,f2]=f(n);c=f1;d=f2;else[f1,f2]=f(n);e=f1;f=f2;endendy1=e/(a+c);y2=f/(b+d);disp(['(1) y=',num2str(y1)]) disp(['(2) y=',num2str(y2)])函数文件名:f.mfunction [f1,f2]=f(n)f1=n+10*log(n^2+5);x=0;for a=1:nb=a*(a+1);x=x+b;endf2=x;实验八章1.clear all;n=0;A=rand(1,30000);meanA=mean(A);stdA=std(A,1,2);maxA=max(A);minA=min(A);for x=Aif x>0.5n=n+1;else continue;endendp=n/30000;disp(['均值=' ,num2str(meanA)]); disp(['标准差=',num2str(stdA)]);disp(['最大值max=',num2str(maxA)]); disp(['最小值min=',num2str(minA)]); disp([ '百分比P=',num2str(p)]);。
MATLAB-实验代码
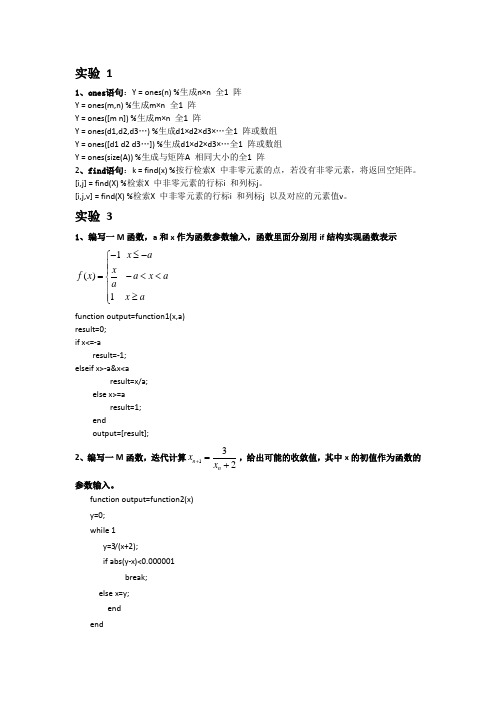
实验 11、ones 语句:Y = ones(n) %生成n×n 全1 阵Y = ones(m,n) %生成m×n 全1 阵Y = ones([m n]) %生成m×n 全1 阵Y = ones(d1,d2,d3…) %生成d1×d2×d3×…全1 阵或数组Y = ones([d1 d2 d3…]) %生成d1×d2×d3×…全1 阵或数组Y = ones(size(A)) %生成与矩阵A 相同大小的全1 阵2、find 语句:k = find(x) %按行检索X 中非零元素的点,若没有非零元素,将返回空矩阵。
[i,j] = find(X) %检索X 中非零元素的行标i 和列标j 。
[i,j,v] = find(X) %检索X 中非零元素的行标i 和列标j 以及对应的元素值v 。
实验 31、编写一M 函数,a 和x 作为函数参数输入,函数里面分别用if 结构实现函数表示1()1x a x f x a x a ax a-≤-⎧⎪⎪=-<<⎨⎪≥⎪⎩function output=function1(x,a)result=0;if x<=-aresult=-1;elseif x>-a&x<aresult=x/a;else x>=aresult=1;endoutput=[result]; 2、编写一M 函数,迭代计算132n n x x +=+,给出可能的收敛值,其中x 的初值作为函数的参数输入。
function output=function2(x)y=0;while 1y=3/(x+2);if abs(y-x)<0.000001break;else x=y;endendoutput=[y]; end3、编写一M函数,实现212!!nxx xe xn=+++++L L近似计算指数,其中x为函数参数输入,当n+1步与n步的结果误差小于0.00001时停止,分别用for和while 结构实现。
信号与系统实验MATLAB实验代码
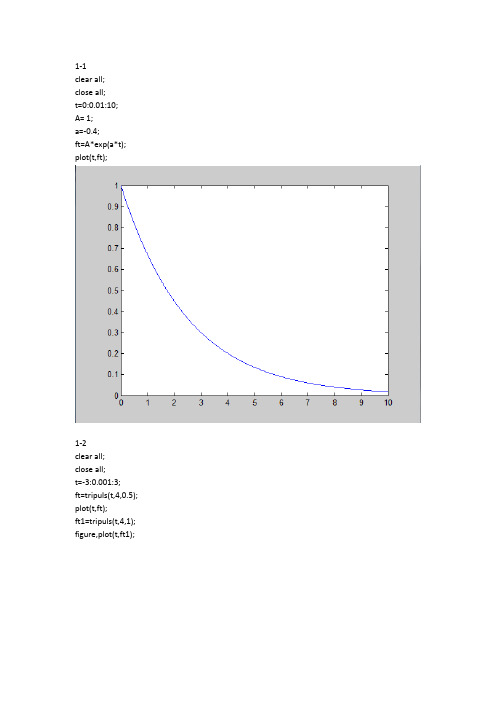
1-1clear all;close all;t=0:0.01:10;A= 1;a=-0.4;ft=A*exp(a*t); plot(t,ft);1-2clear all;close all;t=-3:0.001:3;ft=tripuls(t,4,0.5); plot(t,ft);ft1=tripuls(t,4,1); figure,plot(t,ft1);1-3clear all;close all;t=0:0.001:4;T= 1;Ft=rectpuls(t-2*T,T); plot(t,Ft);1-4clear all;close all;k=-50:50;delta=[zeros(1,50),1,zeros(1,50)]; stem(k,delta);1-5clear all;close all;k=-50:50;uk=[zeros(1,50),ones(1,51)]; stem(k,uk);2-1clear all;close all;t=-3:0.001:3;ft=tripuls(t,4,0.5); subplot(3,1,1);plot(t,ft);title('f(t)');ft1=tripuls((2*t),4,0.5); subplot(3,1,2);plot(t,ft1);title('f(2t)');ft2=tripuls((2-2*t),4,0.5); subplot(3,1,3);plot(t,ft2);title('f(2-2t)');2-2clear all;close all;h=0.001;t=-3:h:3;ft=tripuls(t,4,0.5);subplot(3,1,1);plot(t,ft);title('f(t)');y1=diff(ft)*1/h;subplot(3,1,2);plot(t(1:length(t)-1),y1);title('the differentiation of f(t)');3-1clear all;close all;t=-10:0.01:10;A= 1;a=-0.4;ft=A*exp(a*abs(t)); plot(t,ft);3-2clear all;close all;r=0.02;t=-5:r:5;f1=1/2*exp(-2*t).*stepfun(t,0);f2=1/2*exp(-2*(t-1)).*stepfun(t-1,0); ft1=diff(f1)*1/r;ft2=diff(f2)*1/r;subplot(3,1,1);plot(t,f1);grid on;xlabel('t');ylabel('f(t)');title('f(t)');subplot(3,1,2);plot(t(1:length(t)-1),ft1);title('diff1');subplot(3,1,3);plot(t(1:length(t)-1),ft2);title('diff2');4-1clear all;close all;syms t f;f= fourier(exp((-2)*abs(t))); ezplot(f);4-2clear all;close all;syms t w;f=ifourier(1/(1+(w^2)),t); ezplot(f);a ns1/2*exp(-t)*heaviside(t)+1/2*exp(t)*heaviside(-t) 4-3clear all;close all;r=0.02;t=-5:r:5;N=200;w=2*pi;k=-N:N;w=k*w/N;f1=1/2*exp(-2*t).*stepfun(t,0);F=r*f1*exp(-j*t'*w);F1=abs(F);P1=angle(F);subplot(3,1,1);plot(t,f1);grid on;xlabel('t');ylabel('f(t)');title('f(t)');subplot(3,1,2);plot(w,F1);xlabel('w');grid on;ylabel('F(jw)');subplot(3,1,3);plot(w,P1*180/pi);grid;xlabel('w');ylabel('W');4-4clear all;close all;R=0.02;t=-2:R:2;f=stepfun(t,-1)-stepfun(t,1); f1=f.*exp(-j*5*t);f2=f.*exp(j*5*t);W1=pi*5;N=500;k=-N:N;W=k*W1/N;F1=f1*exp(-j*t'*W)*R;F2=f2*exp(-j*t'*W)*R;F1=real(F1);F2=real(F2); subplot(2,1,1); plot(W,F1); xlabel('w'); ylabel('F1(jw)'); title('频谱F1(jw)'); subplot(2,1,2); plot(W,F2); xlabel('w'); ylabel('F2(jw)'); title('频谱F2(jw)');。
MATLAB实验指令

常用指令1,G=tf(num,den);系统传函2,C=conv(A,B);求卷积3,get=(G);查看系统G的所有参数4,sys=zpk(z,p,k);系统零极点模型5,[z,p,k]=tf2zp(num,den);传函→零极点6,[num,den]=zp2tf(z,p,k);零极点→传函7,sys=parallel(sys1,sys2);两个系统并联8,sys=series(sys1,sys2);两个系统串联9,sys=feedback(Gg,1);由开环求闭环10,[p,z]=pzmap(sys);求零极点11,r=roots(p);求特征方正跟12,disp(‘****’);显示输出****内容13, step(sys);求闭环系统的阶跃响应14,axis();坐标设定函数15,rolcus(Gg);绘制系统根轨迹16,gtext(‘*’);放置标识*17,figure(2);新开图形窗口18,zeta=0:0.001:0.99;sigma=f(zeta);z=spline(sigma,zeta,C);求sigma=C时的zeta值19,[mag,phase,w]=bode(G);绘制系统Bode图20,[re,im,w]=nyquist(sys);绘制系统Nyquist图21,[Gm,Pm,wg,wp]=margin(G);绘制系统Bode图22,y = polyval(p,x); 多项式的估值运算具体补充pi 表示π;inf 表示无穷,例如S=1/0,将得出:S=inf;NaN 是一个与inf 有关的而又有不同性质的数,它表示不定数“Not a Number”,并通过计算象 inf / inf 或0 / 0 这样的表达式获得;数组的乘法用.* 表示符号.^ 表示数组的乘方。
矩阵A的N次方可表示为:A^Ninv (A):方阵 A 的逆A’: 转置矩阵X=from:step:to,其中step:步距。
Matlab实验程序汇总
1.求解左边的线性代数方程:A=[1 0 2; 1 1 3;3 1 2]; b=[2 1 1]'; B=[A b]; n=3; RA=rank(A)RB=rank(B)if RA==RB&RA==nX=A\bD=null(A,'r')else fprintf('方程组无解')End2.已知矩阵1)试分别求出A 阵和B 阵的秩、转置、行列式、逆矩阵以及特征值。
2)求C=A23)矩阵D 为A 中每个元素平方组成的矩阵4)矩阵E 为A 乘以B5) 矩阵F 为A 和B 数组乘积(即对应元素分别相乘的积构成的矩阵),6)将C 矩阵的右下角2×3子矩阵赋给G 矩阵。
(1)A=[0 1 3;1 2 1;5 4 2];B=[2 1 8;4 1 4;3 3 2];r=rank(A)R=rank(B)A.'B.'d=det(A)D=det(B)i=inv(A)I=inv(B)e=eig(A)E=eig(B)(2)A=[0 1 3;1 2 1;5 4 2];B=[2 1 8;4 1 4;3 3 2]; 123102211313121x x x ⎡⎤⎡⎤⎡⎤⎢⎥⎢⎥⎢⎥=⎢⎥⎢⎥⎢⎥⎢⎥⎢⎥⎢⎥⎣⎦⎣⎦⎣⎦013=121542⎡⎤⎢⎥⎢⎥⎢⎥⎣⎦A 218=414332⎡⎤⎢⎥⎢⎥⎢⎥⎣⎦Bc=A^2C=B^2(3)A=[0 1 3;1 2 1;5 4 2];D=A.^2(4)A=[0 1 3;1 2 1;5 4 2];B=[2 1 8;4 1 4;3 3 2];E=A*B(5)A=[0 1 3;1 2 1;5 4 2];B=[2 1 8;4 1 4;3 3 2];F=A.*B(6)A=[0 1 3;1 2 1;5 4 2];C=A^2g=C(:,1:3);G=g(2:3,1:3)3. 求复数矩阵的转置C1与共轭转置C2。
程序如下:C=[1+3*i 5-i 7+3*i;6+2*i 3+2*i 4-3*i]C1=C.'C2=C'135********i i i i i i +-+⎡⎤=⎢⎥++-⎣⎦C ⎥⎦⎤⎢⎣⎡=⨯⨯⨯⨯22322333 S O R E A ⎥⎦⎤⎢⎣⎡+=22 S O RS R E A 4.设有分块矩其中E ,R ,O ,S 分别为单位阵、随机阵、零阵和对角矩阵,试通过数值计算验证S=[1 0;0 4];[eye(3) rand(3,2)+ rand(3,2)*S;zeros(2,3) S^2程序如下:E=eye(3);R=rand(3,2);O=zeros(2,3);S=[1 0;0 4];A=[E R;O S];D=[E R+R*S;O S^2]5分别举例说明关系运算(>,>=,= =,~=)和逻辑运算(&,│,~) (1)A=[1 2;3 4];B=[5 6;7 8];A>B(2)A=[1 2;3 4];B=[5 6;7 8];A>=B(3)A=[1 2;3 4];B=[5 6;7 8];A==B(4)A=[1 2;3 4];B=[5 6;7 8];A~=B(5)A=[1 0 ;3 4];B=[5 6;7 8];A&BA|B~A~B6编写两个m文件,分别使用for和while循环语句计算程序如下:(1)s=0;for k=1:100 10031=∑kks=s+k^3;if k==100disp(s)endEnd(2)s=0;k=1;while k<=100s=s+k^3;k=k+1;endS7一个三位整数各位数字的立方和等于该数本身则称该数为水仙花数。
matlab源代码实例
1.硬币模拟试验源代码:clear;clc;head_count=0;p1_hist=[0];p2_hist=[0];n=1000;p1=0.3;p2=0.03;head=figure(1);rand('seed',sum(100*clock));for i=1:ntmp=rand(1);if(tmp<=p1)head_count=head_count+1;endp1_hist(i)=head_count/i;endfigure(head);subplot(2,1,1);plot(p1_hist);grid on;hold on;xlabel('重复试验次数');ylabel('正面向上的比率');title('p=0.3试验次数N与正面向上比率的函数图');head_count=0;for i=1:ntmp=rand(1);if(tmp<=p2)head_count=head_count+1;endp2_hist(i)=head_count/i;endfigure(head);subplot(2,1,2);plot(p2_hist);grid on;hold on;xlabel('重复试验次数');ylabel('正面向上的比率');title('p=0.03试验次数N与正面向上比率的函数图');实验结果:2.不同次数的随机试验均值方差比较源代码:clear;clc;close;rand('seed',sum(100*clock));Titles=['n=5时''n=20时''n=25时''n=50时''n=100时'];Titlestr=cellstr(Titles);X_n_bar=[0];%the samples of the X_n_barX_n=[0];%the samples of X_nN=[5,10,25,50,100];j=1;num_X_n=100;num_X_n_bar=100;h_X_n_bar=figure(1);for n=1:num_X_nfor i=1:num_X_n_barX_n=rand(1,n);X_n_bar(i)=mean(X_n);%X_n是我们模拟的对象endmean_X_n_bar(n)=mean(X_n_bar);%均值var_X_n_bar(n)=var(X_n_bar);%方差if(n==5||n==10||n==25||n==50||n==100)figure(h_X_n_bar)subplot(2,2,j);plot(X_n_bar);grid on;hold on;xlabel('重复试验次数');ylabel('Xn_bar');axis([010001]);title(Titlestr(j));j=j+1;endendtheory_mean_X_n_bar=[num_X_n];theory_var_X_n_bar=[num_X_n];for n=1:100theory_mean_X_n_bar(n)=0.5;theory_var_X_n_bar(n)=1/(12*n);endfigure;subplot(2,1,1);plot(theory_mean_X_n_bar,'-r');grid on;hold on;plot(mean_X_n_bar,'bo-');xlabel('n');ylabel('样本均值的均值');legend('theory value','sampled value');subplot(2,1,2);plot(theory_var_X_n_bar,'-r');grid on;hold on;plot(var_X_n_bar,'bo-');xlabel('n');ylabel('样本均值的方差');legend('theory value','sampled value');实验结果:。
Matlab100个实例程序(精编文档).doc
【最新整理,下载后即可编辑】程序代码:(代码标记[code]...[/code] ) 1-32是:图形应用篇33-66是:界面设计篇67-84是:图形处理篇85-100是:数值分析篇实例1:三角函数曲线(1)function shili01h0=figure('toolbar','none',...'position',[198 56 350 300],...'name','实例01');h1=axes('parent',h0,...'visible','off');x=-pi:0.05:pi;y=sin(x);plot(x,y);xlabel('自变量X');ylabel('函数值Y');title('SIN( )函数曲线');grid on实例2:三角函数曲线(2)function shili02h0=figure('toolbar','none',...'position',[200 150 450 350],... 'name','实例02');x=-pi:0.05:pi;y=sin(x)+cos(x);plot(x,y,'-*r','linewidth',1);grid onxlabel('自变量X');ylabel('函数值Y');title('三角函数');实例3:图形的叠加function shili03h0=figure('toolbar','none',...'position',[200 150 450 350],... 'name','实例03');x=-pi:0.05:pi;y1=sin(x);y2=cos(x);plot(x,y1,...'-*r',...x,y2,...'--og');grid onxlabel('自变量X');ylabel('函数值Y');title('三角函数');实例4:双y轴图形的绘制function shili04h0=figure('toolbar','none',...'position',[200 150 450 250],...'name','实例04');x=0:900;a=1000;b=0.005;y1=2*x;y2=cos(b*x);[haxes,hline1,hline2]=plotyy(x,y1,x,y2,'semilogy','plot'); axes(haxes(1))ylabel('semilog plot');axes(haxes(2))ylabel('linear plot');实例5:单个轴窗口显示多个图形function shili05h0=figure('toolbar','none',...'position',[200 150 450 250],...'name','实例05');t=0:pi/10:2*pi;[x,y]=meshgrid(t);subplot(2,2,1)plot(sin(t),cos(t))axis equalsubplot(2,2,2)z=sin(x)-cos(y);plot(t,z)axis([0 2*pi -2 2])subplot(2,2,3)h=sin(x)+cos(y);plot(t,h)axis([0 2*pi -2 2])subplot(2,2,4)g=(sin(x).^2)-(cos(y).^2);plot(t,g)axis([0 2*pi -1 1])实例6:图形标注function shili06h0=figure('toolbar','none',...'position',[200 150 450 400],...'name','实例06');t=0:pi/10:2*pi;h=plot(t,sin(t));xlabel('t=0到2\pi','fontsize',16);ylabel('sin(t)','fontsize',16);title('\it{从0to2\pi 的正弦曲线}','fontsize',16) x=get(h,'xdata');y=get(h,'ydata');imin=find(min(y)==y);imax=find(max(y)==y);text(x(imin),y(imin),...['\leftarrow最小值=',num2str(y(imin))],...'fontsize',16)text(x(imax),y(imax),...['\leftarrow最大值=',num2str(y(imax))],...'fontsize',16)实例7:条形图形function shili07h0=figure('toolbar','none',...'position',[200 150 450 350],...'name','实例07');tiao1=[562 548 224 545 41 445 745 512];tiao2=[47 48 57 58 54 52 65 48];t=0:7;bar(t,tiao1)xlabel('X轴');ylabel('TIAO1值');h1=gca;h2=axes('position',get(h1,'position'));plot(t,tiao2,'linewidth',3)set(h2,'yaxislocation','right','color','none','xticklabel',[])实例8:区域图形function shili08h0=figure('toolbar','none',...'position',[200 150 450 250],...'name','实例08');x=91:95;profits1=[88 75 84 93 77];profits2=[51 64 54 56 68];profits3=[42 54 34 25 24];profits4=[26 38 18 15 4];area(x,profits1,'facecolor',[0.5 0.9 0.6],... 'edgecolor','b',...'linewidth',3)hold onarea(x,profits2,'facecolor',[0.9 0.85 0.7],... 'edgecolor','y',...'linewidth',3)hold onarea(x,profits3,'facecolor',[0.3 0.6 0.7],... 'edgecolor','r',...'linewidth',3)hold onarea(x,profits4,'facecolor',[0.6 0.5 0.9],... 'edgecolor','m',...'linewidth',3)hold offset(gca,'xtick',[91:95])set(gca,'layer','top')gtext('\leftarrow第一季度销量') gtext('\leftarrow第二季度销量')gtext('\leftarrow第三季度销量')gtext('\leftarrow第四季度销量')xlabel('年','fontsize',16);ylabel('销售量','fontsize',16);实例9:饼图的绘制function shili09h0=figure('toolbar','none',...'position',[200 150 450 250],...'name','实例09');t=[54 21 35;68 54 35;45 25 12;48 68 45;68 54 69];x=sum(t);h=pie(x);textobjs=findobj(h,'type','text');str1=get(textobjs,{'string'});val1=get(textobjs,{'extent'});oldext=cat(1,val1{:});names={'商品一:';'商品二:';'商品三:'};str2=strcat(names,str1);set(textobjs,{'string'},str2)val2=get(textobjs,{'extent'});newext=cat(1,val2{:});offset=sign(oldext(:,1)).*(newext(:,3)-oldext(:,3))/2;pos=get(textobjs,{'position'});textpos=cat(1,pos{:});textpos(:,1)=textpos(:,1)+offset;set(textobjs,{'position'},num2cell(textpos,[3,2]))实例10:阶梯图function shili10h0=figure('toolbar','none',...'position',[200 150 450 400],...'name','实例10');a=0.01;b=0.5;t=0:10;f=exp(-a*t).*sin(b*t);stairs(t,f)hold onplot(t,f,':*')hold offglabel='函数e^{-(\alpha*t)}sin\beta*t的阶梯图'; gtext(glabel,'fontsize',16)xlabel('t=0:10','fontsize',16)axis([0 10 -1.2 1.2])实例11:枝干图function shili11h0=figure('toolbar','none',...'position',[200 150 450 350],...'name','实例11');x=0:pi/20:2*pi;y1=sin(x);y2=cos(x);h1=stem(x,y1+y2);hold onh2=plot(x,y1,'^r',x,y2,'*g');hold offh3=[h1(1);h2];legend(h3,'y1+y2','y1=sin(x)','y2=cos(x)') xlabel('自变量X');ylabel('函数值Y');title('正弦函数与余弦函数的线性组合');实例12:罗盘图function shili12h0=figure('toolbar','none',...'position',[200 150 450 250],...'name','实例12');winddirection=[54 24 65 84256 12 235 62125 324 34 254];windpower=[2 5 5 36 8 12 76 14 10 8];rdirection=winddirection*pi/180;[x,y]=pol2cart(rdirection,windpower);compass(x,y);desc={'风向和风力','北京气象台','10月1日0:00到','10月1日12:00'};gtext(desc)实例13:轮廓图function shili13h0=figure('toolbar','none',...'position',[200 150 450 250],...'name','实例13');[th,r]=meshgrid((0:10:360)*pi/180,0:0.05:1); [x,y]=pol2cart(th,r);z=x+i*y;f=(z.^4-1).^(0.25);contour(x,y,abs(f),20)axis equalxlabel('实部','fontsize',16);ylabel('虚部','fontsize',16);h=polar([0 2*pi],[0 1]);delete(h)hold oncontour(x,y,abs(f),20)实例14:交互式图形function shili14h0=figure('toolbar','none',...'position',[200 150 450 250],...'name','实例14');axis([0 10 0 10]);hold onx=[];y=[];n=0;disp('单击鼠标左键点取需要的点'); disp('单击鼠标右键点取最后一个点'); but=1;while but==1[xi,yi,but]=ginput(1);plot(xi,yi,'bo')n=n+1;disp('单击鼠标左键点取下一个点'); x(n,1)=xi;y(n,1)=yi;endt=1:n;ts=1:0.1:n;xs=spline(t,x,ts);ys=spline(t,y,ts);plot(xs,ys,'r-');hold off实例15:变换的傅立叶函数曲线function shili15h0=figure('toolbar','none',...'position',[200 150 450 250],...'name','实例15');axis equalm=moviein(20,gcf);set(gca,'nextplot','replacechildren')h=uicontrol('style','slider','position',...[100 10 500 20],'min',1,'max',20)for j=1:20plot(fft(eye(j+16)))set(h,'value',j)m(:,j)=getframe(gcf);endclf;axes('position',[0 0 1 1]);movie(m,30)实例16:劳伦兹非线形方程的无序活动function shili15h0=figure('toolbar','none',...'position',[200 150 450 250],...'name','实例15');axis equalm=moviein(20,gcf);set(gca,'nextplot','replacechildren')h=uicontrol('style','slider','position',... [100 10 500 20],'min',1,'max',20) for j=1:20plot(fft(eye(j+16)))set(h,'value',j)m(:,j)=getframe(gcf);endclf;axes('position',[0 0 1 1]);movie(m,30)实例17:填充图function shili17h0=figure('toolbar','none',...'position',[200 150 450 250],...'name','实例17');t=(1:2:15)*pi/8;x=sin(t);y=cos(t);fill(x,y,'r')axis square offtext(0,0,'STOP',...'color',[1 1 1],...'fontsize',50,...'horizontalalignment','center')实例18:条形图和阶梯形图function shili18h0=figure('toolbar','none',...'position',[200 150 450 250],... 'name','实例18');subplot(2,2,1)x=-3:0.2:3;y=exp(-x.*x);bar(x,y)title('2-D Bar Chart')subplot(2,2,2)x=-3:0.2:3;y=exp(-x.*x);bar3(x,y,'r')title('3-D Bar Chart')subplot(2,2,3)x=-3:0.2:3;y=exp(-x.*x);stairs(x,y)title('Stair Chart')subplot(2,2,4)x=-3:0.2:3;y=exp(-x.*x);barh(x,y)title('Horizontal Bar Chart')实例19:三维曲线图function shili19h0=figure('toolbar','none',...'position',[200 150 450 400],... 'name','实例19');subplot(2,1,1)x=linspace(0,2*pi);y1=sin(x);y2=cos(x);y3=sin(x)+cos(x);z1=zeros(size(x));z2=0.5*z1;z3=z1;plot3(x,y1,z1,x,y2,z2,x,y3,z3) grid onxlabel('X轴');ylabel('Y轴');zlabel('Z轴');title('Figure1:3-D Plot')subplot(2,1,2)x=linspace(0,2*pi);y1=sin(x);y2=cos(x);y3=sin(x)+cos(x);z1=zeros(size(x));z2=0.5*z1;z3=z1;plot3(x,z1,y1,x,z2,y2,x,z3,y3) grid onxlabel('X轴');ylabel('Y轴');zlabel('Z轴');title('Figure2:3-D Plot')实例20:图形的隐藏属性function shili20h0=figure('toolbar','none',...'position',[200 150 450 300],... 'name','实例20');subplot(1,2,1)[x,y,z]=sphere(10);mesh(x,y,z)axis offtitle('Figure1:Opaque') hidden onsubplot(1,2,2)[x,y,z]=sphere(10);mesh(x,y,z)axis offtitle('Figure2:Transparent') hidden off实例21:PEAKS函数曲线function shili21h0=figure('toolbar','none',...'position',[200 100 450 450],...'name','实例21');[x,y,z]=peaks(30);subplot(2,1,1)x=x(1,:);y=y(:,1);i=find(y>0.8&y<1.2);j=find(x>-0.6&x<0.5);z(i,j)=nan*z(i,j);surfc(x,y,z)xlabel('X轴');ylabel('Y轴');zlabel('Z轴');title('Figure1:surfc函数形成的曲面')subplot(2,1,2)x=x(1,:);y=y(:,1);i=find(y>0.8&y<1.2);j=find(x>-0.6&x<0.5);z(i,j)=nan*z(i,j);surfl(x,y,z)xlabel('X轴');ylabel('Y轴');zlabel('Z轴');title('Figure2:surfl函数形成的曲面')实例22:片状图function shili22h0=figure('toolbar','none',...'position',[200 150 550 350],...'name','实例22');subplot(1,2,1)x=rand(1,20);y=rand(1,20);z=peaks(x,y*pi);t=delaunay(x,y);trimesh(t,x,y,z)hidden offtitle('Figure1:Triangular Surface Plot');subplot(1,2,2)x=rand(1,20);y=rand(1,20);z=peaks(x,y*pi);t=delaunay(x,y);trisurf(t,x,y,z)title('Figure1:Triangular Surface Plot');实例23:视角的调整function shili23h0=figure('toolbar','none',...'position',[200 150 450 350],... 'name','实例23');x=-5:0.5:5;[x,y]=meshgrid(x);r=sqrt(x.^2+y.^2)+eps;z=sin(r)./r;subplot(2,2,1)surf(x,y,z)xlabel('X-axis')ylabel('Y-axis')zlabel('Z-axis')title('Figure1')view(-37.5,30)subplot(2,2,2)surf(x,y,z)xlabel('X-axis')ylabel('Y-axis')zlabel('Z-axis')title('Figure2')view(-37.5+90,30)subplot(2,2,3)surf(x,y,z)xlabel('X-axis')ylabel('Y-axis')zlabel('Z-axis')title('Figure3')view(-37.5,60)subplot(2,2,4)surf(x,y,z)xlabel('X-axis')ylabel('Y-axis')zlabel('Z-axis')title('Figure4')view(180,0)实例24:向量场的绘制function shili24h0=figure('toolbar','none',...'position',[200 150 450 350],... 'name','实例24');subplot(2,2,1)z=peaks;ribbon(z)title('Figure1')subplot(2,2,2)[x,y,z]=peaks(15);[dx,dy]=gradient(z,0.5,0.5); contour(x,y,z,10)hold onquiver(x,y,dx,dy)hold offtitle('Figure2')subplot(2,2,3)[x,y,z]=peaks(15);[nx,ny,nz]=surfnorm(x,y,z); surf(x,y,z)hold onquiver3(x,y,z,nx,ny,nz)hold offtitle('Figure3')subplot(2,2,4)x=rand(3,5);y=rand(3,5);z=rand(3,5);c=rand(3,5);fill3(x,y,z,c)grid ontitle('Figure4')实例25:灯光定位function shili25h0=figure('toolbar','none',...'position',[200 150 450 250],... 'name','实例25');vert=[1 1 1;1 2 1;2 2 1;2 1 1;1 1 2;12 2;2 2 2;2 1 2];fac=[1 2 3 4;2 6 7 3;4 3 7 8;15 8 4;1 2 6 5;5 6 7 8];grid offsphere(36)h=findobj('type','surface');set(h,'facelighting','phong',...'facecolor',...'interp',...'edgecolor',[0.4 0.4 0.4],...'backfacelighting',...'lit')hold onpatch('faces',fac,'vertices',vert,... 'facecolor','y');light('position',[1 3 2]);light('position',[-3 -1 3]); material shinyaxis vis3d offhold off实例26:柱状图function shili26h0=figure('toolbar','none',...'position',[200 50 450 450],...subplot(2,1,1)x=[5 2 18 7 39 8 65 5 54 3 2];bar(x)xlabel('X轴');ylabel('Y轴');title('第一子图');subplot(2,1,2)y=[5 2 18 7 39 8 65 5 54 3 2];barh(y)xlabel('X轴');ylabel('Y轴');title('第二子图');实例27:设置照明方式function shili27h0=figure('toolbar','none',...'position',[200 150 450 350],...subplot(2,2,1) sphere shading flat camlight left camlight right lighting flat colorbaraxis offtitle('Figure1')subplot(2,2,2) sphere shading flat camlight left camlight right lighting gouraud colorbaraxis offtitle('Figure2')subplot(2,2,3) sphere shading interp camlight right camlight left lighting phongcolorbaraxis offtitle('Figure3')subplot(2,2,4)sphereshading flatcamlight leftcamlight rightlighting nonecolorbaraxis offtitle('Figure4')实例28:羽状图function shili28h0=figure('toolbar','none',...'position',[200 150 450 350],... 'name','实例28');subplot(2,1,1)alpha=90:-10:0;r=ones(size(alpha));m=alpha*pi/180;n=r*10;[u,v]=pol2cart(m,n);feather(u,v)title('羽状图')axis([0 20 0 10])subplot(2,1,2)t=0:0.5:10;x=0.05+i;y=exp(-x*t);feather(y)title('复数矩阵的羽状图')实例29:立体透视(1)function shili29h0=figure('toolbar','none',...'position',[200 150 450 250],... 'name','实例29');[x,y,z]=meshgrid(-2:0.1:2,...-2:0.1:2,...-2:0.1:2);v=x.*exp(-x.^2-y.^2-z.^2); grid onfor i=-2:0.5:2;h1=surf(linspace(-2,2,20),...linspace(-2,2,20),...zeros(20)+i);rotate(h1,[1 -1 1],30)dx=get(h1,'xdata');dy=get(h1,'ydata');delete(h1)slice(x,y,z,v,[-2 2],2,-2)hold onslice(x,y,z,v,dx,dy,dz)hold offaxis tightview(-5,10)drawnowend实例30:立体透视(2)function shili30h0=figure('toolbar','none',...'position',[200 150 450 250],... 'name','实例30');[x,y,z]=meshgrid(-2:0.1:2,...-2:0.1:2,...-2:0.1:2);v=x.*exp(-x.^2-y.^2-z.^2); [dx,dy,dz]=cylinder;slice(x,y,z,v,[-2 2],2,-2)for i=-2:0.2:2h=surface(dx+i,dy,dz);rotate(h,[1 0 0],90)xp=get(h,'xdata');yp=get(h,'ydata');delete(h)hold onhs=slice(x,y,z,v,xp,yp,zp);axis tightxlim([-3 3])view(-10,35)drawnowdelete(hs)hold offend实例31:表面图形function shili31h0=figure('toolbar','none',...'position',[200 150 550 250],... 'name','实例31');subplot(1,2,1)x=rand(100,1)*16-8;y=rand(100,1)*16-8;r=sqrt(x.^2+y.^2)+eps;z=sin(r)./r;xlin=linspace(min(x),max(x),33); ylin=linspace(min(y),max(y),33); [X,Y]=meshgrid(xlin,ylin);Z=griddata(x,y,z,X,Y,'cubic'); mesh(X,Y,Z)axis tighthold onplot3(x,y,z,'.','Markersize',20)subplot(1,2,2)k=5;n=2^k-1;theta=pi*(-n:2:n)/n;phi=(pi/2)*(-n:2:n)'/n;X=cos(phi)*cos(theta);Y=cos(phi)*sin(theta);Z=sin(phi)*ones(size(theta)); colormap([0 0 0;1 1 1])C=hadamard(2^k);surf(X,Y,Z,C)axis square实例32:沿曲线移动的小球h0=figure('toolbar','none',...'position',[198 56 408 468],... 'name','实例32');h1=axes('parent',h0,...'position',[0.15 0.45 0.7 0.5],... 'visible','on');t=0:pi/24:4*pi;y=sin(t);plot(t,y,'b')n=length(t);h=line('color',[0 0.5 0.5],...'linestyle','.',...'markersize',25,...'erasemode','xor');k1=uicontrol('parent',h0,...'style','pushbutton',...'position',[80 100 50 30],...'string','开始',...'callback',[...'i=1;',...'k=1;,',...'m=0;,',...'while 1,',...'if k==0,',...'break,',...'end,',...'if k~=0,',...'set(h,''xdata'',t(i),''ydata'',y(i)),',...'drawnow;,',...'i=i+1;,',...'if i>n,',...'m=m+1;,',...'i=1;,',...'end,',...'end,',...'end']);k2=uicontrol('parent',h0,... 'style','pushbutton',...'position',[180 100 50 30],... 'string','停止',...'callback',[...'k=0;,',...'set(e1,''string'',m),',...'p=get(h,''xdata'');,',...'q=get(h,''ydata'');,',...'set(e2,''string'',p);,',...'set(e3,''string'',q)']);k3=uicontrol('parent',h0,... 'style','pushbutton',...'position',[280 100 50 30],... 'string','关闭',...'callback','close');e1=uicontrol('parent',h0,... 'style','edit',...'position',[60 30 60 20]);t1=uicontrol('parent',h0,...'style','text',...'string','循环次数',...'position',[60 50 60 20]);e2=uicontrol('parent',h0,... 'style','edit',...'position',[180 30 50 20]);t2=uicontrol('parent',h0,...'style','text',...'string','终点的X坐标值',... 'position',[155 50 100 20]);e3=uicontrol('parent',h0,...'style','edit',...'position',[300 30 50 20]);t3=uicontrol('parent',h0,...'style','text',...'string','终点的Y坐标值',... 'position',[275 50 100 20]);实例33:曲线转换按钮h0=figure('toolbar','none',...'position',[200 150 450 250],... 'name','实例33');x=0:0.5:2*pi;y=sin(x);h=plot(x,y);grid onhuidiao=[...'if i==1,',...'i=0;,',...'y=cos(x);,',...'delete(h),',...'set(hm,''string'',''正弦函数''),',...'h=plot(x,y);,',...'grid on,',...'else if i==0,',...'i=1;,',...'y=sin(x);,',...'set(hm,''string'',''余弦函数''),',...'delete(h),',...'h=plot(x,y);,',...'grid on,',...'end,',...'end'];hm=uicontrol(gcf,'style','pushbutton',... 'string','余弦函数',...'callback',huidiao);i=1;set(hm,'position',[250 20 60 20]);set(gca,'position',[0.2 0.2 0.6 0.6])title('按钮的使用')hold on实例34:栅格控制按钮h0=figure('toolbar','none',...'position',[200 150 450 250],...'name','实例34');x=0:0.5:2*pi;y=sin(x);plot(x,y)'set(h_toggle2,''value'',0),',...'grid on,',...];huidiao2=[...'set(h_toggle1,''value'',0),',...'grid off,',...];h_toggle1=uicontrol(gcf,'style','togglebutton',... 'string','grid on',...'value',0,...'position',[20 45 50 20],...'callback',huidiao1);h_toggle2=uicontrol(gcf,'style','togglebutton',... 'string','grid off',...'value',0,...'position',[20 20 50 20],...'callback',huidiao2);set(gca,'position',[0.2 0.2 0.6 0.6])title('开关按钮的使用')实例35:编辑框的使用h0=figure('toolbar','none',...'position',[200 150 350 250],...'name','实例35');f='Please input the letter';'g=upper(f);,',...'set(h2_edit,''string'',g),',...];huidiao2=[...'g=lower(f);,',...'set(h2_edit,''string'',g),',...];h1_edit=uicontrol(gcf,'style','edit',...'position',[100 200 100 50],...'HorizontalAlignment','left',...'string','Please input the letter',...'callback','f=get(h1_edit,''string'');',...'background','w',...'max',5,...'min',1);h2_edit=uicontrol(gcf,'style','edit',...'HorizontalAlignment','left',...'position',[100 100 100 50],...'background','w',...'max',5,...'min',1);h1_button=uicontrol(gcf,'style','pushbutton',... 'string','小写变大写',...'position',[100 45 100 20],...'callback',huidiao1);h2_button=uicontrol(gcf,'style','pushbutton',... 'string','大写变小写',...'position',[100 20 100 20],...'callback',huidiao2);实例36:弹出式菜单h0=figure('toolbar','none',...'position',[200 150 450 250],...'name','实例36');x=0:0.5:2*pi;y=sin(x);h=plot(x,y);grid onhm=uicontrol(gcf,'style','popupmenu',...'string',...'sin(x)|cos(x)|sin(x)+cos(x)|exp(-sin(x))',... 'position',[250 20 50 20]);set(hm,'value',1)huidiao=[...'v=get(hm,''value'');,',...'switch v,',...'case 1,',...'delete(h),',...'y=sin(x);,',...'h=plot(x,y);,',...'grid on,',...'case 2,',...'delete(h),',...'y=cos(x);,',...'h=plot(x,y);,',...'grid on,',...'case 3,',...'delete(h),',...'y=sin(x)+cos(x);,',...'h=plot(x,y);,',...'grid on,',...'case 4,',...'delete(h),',...'y=exp(-sin(x));,',...'h=plot(x,y);,',...'grid on,',...'end'];set(hm,'callback',huidiao)set(gca,'position',[0.2 0.2 0.6 0.6]) title('弹出式菜单的使用')实例37:滑标的使用h0=figure('toolbar','none',...'position',[200 150 450 250],... 'name','实例37');[x,y]=meshgrid(-8:0.5:8);r=sqrt(x.^2+y.^2)+eps;z=sin(r)./r;h0=mesh(x,y,z);h1=axes('position',...[0.2 0.2 0.5 0.5],...'visible','off');htext=uicontrol(gcf,...'units','points',...'position',[20 30 45 15],...'string','brightness',...'style','text');hslider=uicontrol(gcf,...'units','points',...'position',[10 10 300 15],...'min',-1,...'max',1,...'style','slider',...'callback',...'brighten(get(hslider,''value''))');实例38:多选菜单h0=figure('toolbar','none',...'position',[200 150 450 250],...'name','实例38');[x,y]=meshgrid(-8:0.5:8);r=sqrt(x.^2+y.^2)+eps;z=sin(r)./r;h0=mesh(x,y,z);hlist=uicontrol(gcf,'style','listbox',...'string','default|spring|summer|autumn|winter',...'max',5,...'min',1,...'position',[20 20 80 100],...'callback',[...'k=get(hlist,''value'');,',...'switch k,',...'case 1,',...'colormap default,',...'case 2,',...'colormap spring,',...'case 3,',...'colormap summer,',...'case 4,',...'colormap autumn,',...'case 5,',...'colormap winter,',...'end']);实例39:菜单控制的使用h0=figure('toolbar','none',...'position',[200 150 450 250],... 'name','实例39');x=0:0.5:2*pi;y=cos(x);h=plot(x,y);grid onset(gcf,'toolbar','none')hm=uimenu('label','example');huidiao1=[...'set(hm_gridon,''checked'',''on''),',...'set(hm_gridoff,''checked'',''off''),',...'grid on'];huidiao2=[...'set(hm_gridoff,''checked'',''on''),',...'set(hm_gridon,''checked'',''off''),',...'grid off'];hm_gridon=uimenu(hm,'label','grid on',... 'checked','on',...'callback',huidiao1);hm_gridoff=uimenu(hm,'label','grid off',... 'checked','off',...'callback',huidiao2);实例40:UIMENU菜单的应用h0=figure('toolbar','none',...'position',[200 150 450 250],...'name','实例40');h1=uimenu(gcf,'label','函数');h11=uimenu(h1,'label','轮廓图',...'callback',[...'set(h31,''checked'',''on''),',...'set(h32,''checked'',''off''),',...'[x,y,z]=peaks;,',...'contour3(x,y,z,30)']);。
matlab代码大全
matlab代码大全MATLAB主要命令汇总MATLAB函数参考附录1.1 管理用命令函数名功能描述函数名功能描述addpath 增加一条搜索路径 rmpath 删除一条搜索路径demo 运行Matlab演示程序 type 列出.M文件doc 装入超文本文档 version 显示Matlab的版本号help 启动联机帮助 what 列出当前目录下的有关文件lasterr 显示最后一条信息 whatsnew 显示Matlab的新特性lookfor 搜索关键词的帮助 which 造出函数与文件所在的目录path 设置或查询Matlab路径附录1.2管理变量与工作空间用命令函数名功能描述函数名功能描述clear 删除存中的变量与函数 pack 整理工作空间存disp 显示矩阵与文本 save 将工作空间中的变量存盘length 查询向量的维数 size 查询矩阵的维数load 从文件中装入数据 who,whos 列出工作空间中的变量名附录1.3文件与操作系统处理命令函数名功能描述函数名功能描述cd 改变当前工作目录 edit 编辑.M文件delete 删除文件 matlabroot 获得Matlab的安装根目录diary 将Matlab运行命令存盘 tempdir 获得系统的缓存目录dir 列出当前目录的容 tempname 获得一个缓存(temp)文件! 执行操作系统命令附录1.4窗口控制命令函数名功能描述函数名功能描述echo 显示文件中的Matlab中的命令 more 控制命令窗口的输出页面format 设置输出格式附录1.5启动与退出命令函数名功能描述函数名功能描述matlabrc 启动主程序 quit 退出Matlab环境startup Matlab自启动程序附录2 运算符号与特殊字符附录2.1运算符号与特殊字符函数名功能描述函数名功能描述+ 加 ... 续行标志- 减 , 分行符(该行结果不显示)* 矩阵乘 ; 分行符(该行结果显示).* 向量乘 % 注释标志^ 矩阵乘方 ! 操作系统命令提示符.^ 向量乘方矩阵转置kron 矩阵kron积 . 向量转置\ 矩阵左除 = 赋值运算/ 矩阵右除 == 关系运算之相等.\ 向量左除 ~= 关系运算之不等./ 向量右除 < 关系运算之小于: 向量生成或子阵提取 <= 关系运算之小于等于() 下标运算或参数定义 > 关系运算之大于[] 矩阵生成 >= 关系运算之大于等于{} & 逻辑运算之与. 结构字段获取符 | 逻辑运算之或. 点乘运算,常与其他运算符联合使用(如.\) ~ 逻辑运算之非xor 逻辑运算之异成附录2.2逻辑函数函数名功能描述函数名功能描述all 测试向量中所用元素是否为真is*(一类函数) 检测向量状态.其中*表示一个确定的函数(isinf)any 测试向量中是否有真元素*isa 检测对象是否为某一个类的对象exist 检验变量或文件是否定义 logical 将数字量转化为逻辑量find 查找非零元素的下标附录3 语言结构与调试附录3.1编程语言函数名功能描述函数名功能描述builtin 执行Matlab建的函数 global 定义全局变量eval 执行Matlab语句构成的字符串 nargchk 函数输入输出参数个数检验feval 执行字符串指定的文件 script Matlab语句及文件信息function Matlab函数定义关键词附录3.2控制流程函数名功能描述函数名功能描述break 中断循环执行的语句 if 条件转移语句case 与switch结合实现多路转移otherwise 多路转移中的缺省执行部分else 与if一起使用的转移语句 return 返回调用函数elseif 与if一起使用的转移语句 switch 与case结合实现多路转移end 结束控制语句块 warning 显示警告信息error 显示错误信息 while 循环语句for 循环语句附录3.3交互输入函数名功能描述函数名功能描述input 请求输入 menu 菜单生成keyboard 启动键盘管理 pause 暂停执行附录3.4面向对象编程函数名功能描述函数名功能描述class 生成对象 isa 判断对象是否属于某一类double 转换成双精度型 superiorto 建立类的层次关系inferiorto 建立类的层次关系unit8 转换成8字节的无符号整数inline 建立一个嵌对象附录3.5调试函数名功能描述函数名功能描述dbclear 清除调试断点 dbstatus 列出所有断点情况dbcont 调试继续执行 dbstep 单步执行dbdown 改变局部工作空间存 dbstop 设置调试断点dbmex 启动对Mex文件的调试sbtype 列出带命令行标号的.M 文件dbquit 退出调试模式 dbup 改变局部工作空间容dbstack 列出函数调用关系附录4 基本矩阵与矩阵处理附录4.1基本矩阵函数名功能描述函数名功能描述eye 产生单位阵 rand 产生随机分布矩阵linspace 构造线性分布的向量 randn 产生正态分布矩阵logspace 构造等对数分布的向量 zeros 产生零矩阵ones 产生元素全部为1的矩阵 : 产生向量附录4.2特殊向量与常量函数名功能描述函数名功能描述ans 缺省的计算结果变量 non 非数值常量常由0/0或Inf/Inf获得computer 运行Matlab的机器类型 nargin 函数中参数输入个数eps 精度容许误差(无穷小) nargout 函数中输出变量个数flops 浮点运算计数 pi 圆周率i 复数单元 realmax 最大浮点数值inf 无穷大 realmin 最小浮点数值inputname 输入参数名 varargin 函数中输入的可选参数j 复数单元 varargout 函数中输出的可选参数附录4.3时间与日期函数名功能描述函数名功能描述calender 日历 eomday 计算月末clock 时钟 etime 所用时间函数cputime 所用的CPU时间 now 当前日期与时间date 日期 tic 启动秒表计时器datenum 日期(数字串格式) toc 读取秒表计时器datestr 日期(字符串格式) weekday 星期函数datevoc 日期(年月日分立格式)附录4.4矩阵处理函数名功能描述函数名功能描述cat 向量连接 reshape 改变矩阵行列个数diag 建立对角矩阵或获取对角向量 rot90 将矩阵旋转90度fliplr 按左右方向翻转矩阵元素 tril 取矩阵的下三角部分flipud 按上下方向翻转矩阵元素 triu 取矩阵的上三角部分repmat 复制并排列矩阵函数附录5 特殊矩阵函数名功能描述函数名功能描述compan 生成伴随矩阵 invhilb 生成逆hilbert矩阵gallery 生成一些小的测试矩阵 magic 生成magic矩阵hadamard 生成hadamard矩阵 pascal 生成pascal矩阵hankel 生成hankel矩阵 toeplitz 生成toeplitz矩阵hilb 生成hilbert矩阵 wilkinson 生成wilkinson特征值测试矩阵附录6 数学函数附录6.1三角函数函数名功能描述函数名功能描述sin/asin 正弦/反正弦函数 sec/asec 正割/反正割函数sinh/asinh 双曲正弦/反双曲正弦函数 sech/asech 双曲正割/反双曲正割函数cos/acos 余弦/反余弦函数 csc/acsc 余割/反余割函数cosh/acosh 双曲余弦/反双曲余弦函数csch/acsch 双曲余割/反双曲余割函数tan/atan 正切/反正切函数 cot/acot 余切/反余切函数tanh/atanh 双曲正切/反双曲正切函数coth/acoth 双曲余切/反双曲余切函数atan2 四个象限反正切函数附录6.2指数函数函数名功能描述函数名功能描述exp 指数函数 log10 常用对数函数log 自然对数函数 sqrt 平方根函数附录6.3复数函数函数名功能描述函数名功能描述abs 绝对值函数 imag 求虚部函数angle 角相位函数 real 部函数conj 共轭复数函数附录6.4数值处理函数名功能描述函数名功能描述fix 沿零方向取整 round 舍入取整floor 沿-∞方向取整 rem 求除法的余数ceil 沿+∞方向取整 sign 符号函数附录6.5其他特殊数学函数函数名功能描述函数名功能描述airy airy函数 erfcx 比例互补误差函数besselh bessel函数(hankel函数) erfinv 逆误差函数bessili 改进的第一类bessel函数 expint 指数积分函数besselk 改进的第二类bessel函数 gamma gamma函数besselj 第一类bessel函数 gammainc 非完全gamma函数bessely 第二类bessel函数 gammaln gamma对数函数beta beta函数 gcd 最大公约数betainc 非完全的beta函数 lcm 最小公倍数betaln beta对数函数 log2 分割浮点数elipj Jacobi椭圆函数 legendre legendre伴随函数ellipke 完全椭圆积分 pow2 基2标量浮点数erf 误差函数 rat 有理逼近erfc 互补误差函数 rats 有理输出附录7 坐标转换函数名功能描述函数名功能描述cart2pol 笛卡儿坐标到极坐标转换 pol2cart 极坐标到笛卡儿坐标转换cart2sph 笛卡儿坐标到球面坐标转换 sph2cart 球面坐标到笛卡儿坐标转换附录8 矩阵函数附录8.1矩阵分析函数名功能描述函数名功能描述cond 求矩阵的条件数 rcond LINPACK倒数条件估计det 求矩阵的行列式 rref 矩阵的行阶梯型实现norm 求矩阵的数 rrefmovie 消元法解方程演示null 右零空间 subspace 子空间orth 正交空间 trace 矩阵的迹rank 求矩阵的秩附录8.2线性方程函数名功能描述函数名功能描述/,\ 线性方程求解 nnls 非零最小二乘chol Cholesky分解 pinv 求伪逆矩阵inv 矩阵求逆 qr 矩阵的QR分解lscov 最小二乘方差 qrdelete QR分解中删除一行lu 矩阵的LU三角分解 qrinsert QR分解中插入一行附录8.3特征值与奇异值函数名功能描述函数名功能描述banlance 改进特征值精度的均衡变换 qz QZ算法求矩阵特征值cdf2rdf 复块对角阵到实块对角阵转换 rdf2cdf 实块对角阵到复块对角阵转换eig 求矩阵的特征值和特征向量 schur Schur分解hess 求Hessenberg矩阵 svd 奇异值分解poly 求矩阵的特征多项式附录8.4矩阵函数函数名功能描述函数名功能描述expm 矩阵指数函数 logm 矩阵对数函数funm 矩阵任意函数 sqrtm 矩阵平方根附录9 数据分析与Fourier变换函数附录9.1基本运算函数名功能描述函数名功能描述cumprod 向量累积 prod 对向量中各元素求积cumsum 向量累加 sort 对向量中各元素排序max 求向量中最大元素 sortrows 对矩阵中各行排序min 求向量中最小元素 std 求向量中各元素标准差mean 求向量中各元素均值 sum 对向量中各元素求和median 求向量中中间元素 trapz 梯形法求数值积分附录9.2微分计算函数名功能描述函数名功能描述del2 离散Laplace变换 gradient 梯度计算diff 差分于近视微分附录9.3滤波与卷积函数名功能描述函数名功能描述Conv 卷给与多项式乘法 filter 一维数字滤波conv2 二维卷积 filter2 二维数字滤波Deconv 因式分解与多项式乘法附录9.4方差处理函数名功能描述函数名功能描述corrcoef 相关系数计算 cov 协方差计算附录9.5Fourier变换函数名功能描述函数名功能描述abs 绝对值函数 fftshift fft与fft2输出重排angle 相角函数 ifft 离散Fourier逆变换cplxpair 依共轭复数对重新排序 ifft2 二维离散Fourier逆变换fft离散Fourier变换 unwrap 相角矫正fft2 二维离散Fourier变换附录10 多项式处理函数附录10.1多项式处理函数名功能描述函数名功能描述conv 卷机与多项式乘法 polyfit 数据的多项式拟合deconv 因式分解与多项式乘法 polyval 多项式求值poly 求矩阵的特征多项式 polyvalm 多项式矩阵求值polyder 多项式求导 residue 部分分式展开polyeig 多项式特征值 roots 求多项式的根附录10.2数据插值函数名功能描述函数名功能描述griddata 数据网络的插值生成interpft 一维插值(FFT方法)interp1 一维插值(查表) interpn 多维插值(查表)。
(完整word版)MatLab代码大全
第2章图像获取2.3.2 二维连续傅里叶变换例2.2figure(1); %建立图形窗口1[u,v] = meshgrid(-1:0.01:1); %生成二维频域网格F1 = abs(sinc(u.*pi));F2 = abs(sinc(v.*pi));F=F1.*F2; %计算幅度频谱F=|F(u,v)|surf(u,v,F); %显示幅度频谱,如图2.3(b)shading interp; %平滑三维曲面上的小格axis off; %关闭坐标系figure(2); %建立图形窗口2F1=histeq(F); %扩展F的对比度以增强视觉效果imshow(F1); %用图像来显示幅度频谱,如图2.3(c)第3章图像变换3.4.4 二维FFT的MATLAB实现例3.2 简单图像及其傅里叶变换MATLAB程序:%建立简单图像d并显示之d = zeros(32,32); %图像大小32⨯32d(13:20,13:20) = 1; %中心白色方块大小为8⨯8figure(1); %建立图形窗口1imshow(d,'notruesize');%显示图像d如图3.5(a)所示%计算傅里叶变换并显示之D = fft2(d); %计算图像d的傅里叶变换,fft2(d) = fft(fft(d).').'figure(2); %建立图形窗口2imshow(abs(D),[-1 5],'notruesize'); %显示图像d的傅里叶变换谱如3.5(b)所示例3.3 MATLAB图像及其傅里叶变换谱MATLAB程序:figure(1);load imdemos saturn2; %装入MA TLAB图像saturn2imshow(saturn2); %显示图像saturn2如图3.6(a)所示figure(2);S= fftshift(fft2(saturn2)); %计算傅里叶变换并移位imshow(log(abs(S)),[ ]); %显示傅里叶变换谱如3.6(b)所示例3.4 真彩图像及其傅里叶变换谱MATLAB程序:figure(1);A=imread('image1.jpg'); %装入真彩图像,见图1.1(b)B=rgb2gray(A); %将真彩图像转换为灰度图像imshow(B); %显示灰度图像如图3.7(a)所示C=fftshift(fft2(B)); %计算傅里叶变换并移位figure(2);imshow(log(abs(C)),[ ]); %显示傅里叶变换谱如3.7(b)所示3.5.4 离散余弦变换的MATLAB实现例3.5 计算并显示真彩图像余弦变换的MATLAB程序如下:RGB=imread('image2.jpg'); %装入真彩图像figure(1);imshow(RGB); %显示彩色图像GRAY=rgb2gray(RGB); %将真彩图像转换为灰度图像figure(2);imshow(GRAY); %显示灰度图像如图3.10(a)所示DCT=dct2(GRAY); %进行余弦变换figure(3);imshow(log(abs(DCT)),[ ]); %显示余弦变换如图3.10(b)所示。
数值分析数学实验上机实验编程matlab源代码
Newton法及改进的Newton法源程序:clear%%%% 输入函数f=input('请输入需要求解函数>>','s')%%%求解f(x)的导数df=diff(f);%%%改进常数或重根数miu=2;%%%初始值x0x0=input('input initial value x0>>');k=0;%迭代次数max=100;%最大迭代次数R=eval(subs(f,'x0','x'));%求解f(x0),以确定初值x0时否就是解while (abs(R)>1e-8)x1=x0-miu*eval(subs(f,'x0','x'))/eval(subs(df,'x0','x'));R=x1-x0;x0=x1;k=k+1;if (eval(subs(f,'x0','x'))<1e-10);breakendif k>max;%如果迭代次数大于给定值,认为迭代不收敛,重新输入初值ss=input('maybe result is error,choose a new x0,y/n?>>','s');ifstrcmp(ss,'y')x0=input('input initial value x0>>');k=0; elsebreakendendendk;%给出迭代次数x=x0;%给出解Gauss消元法源程序:cleara=input('输入系数阵:>>\n')b=input('输入列阵b:>>\n')n=length(b);A=[a b]x=zeros(n,1);%%%函数主体Yipusilong-1;for k=1:n-1;%%%是否进行主元选取if abs(A(k,k))<yipusilong;%事先给定的认为有必要选主元的小数yzhuyuan=1;elseyzhuyuan=0;endifyzhuyuan;%%%%选主元t=A(k,k);for r=k+1:n;if abs(A(r,k))>abs(t)p=r;else p=k;endend%%%交换元素if p~=k; for q=k:n+1;s=A(k,q);A(k,q)=A(p,q);A(p,q)=s;endendend%%%判断系数矩阵是否奇异或病态非常严重if abs(A(k,k))<yipusilongdisp(‘矩阵奇异,解可能不正确’)end%%%%计算消元,得三角阵for r=k+1:n;m=A(r,k)/A(k,k);for q=k:n+1;A(r,q)=A(r,q)-A(k,q)*m;endendend%%%%求解xx(n)=A(n,n+1)/A(n,n);for k=n-1:-1:1;s=0;for r=k+1:n;s=s+A(k,r)*x(r);endt=(A(k,n+1)-s) x(k)=(A(k,n+1)-s)/A(k,k) end Lagrange插值源程序:n=input('将区间分为的等份数输入:\n');s=[-1+2/n*[0:n]];%%%给定的定点,Rf为给定的函数x=-1:0.01:1;f=0;for q=1:n+1;l=1;%求插值基函数for k=1:n+1;if k~=q;l=l.*(x-s(k))./(s(q)-s(k));elsel=l;endendf=f+Rf(s(q))*l;%求插值函数endplot(x,f,'r')%作出插值函数曲线grid onhold on分段线性插值源程序clearn=input('将区间分为的等份数输入:\n');s=[-1+2/n*[0:n]];%%%给定的定点,Rf为给定的函数m=0;hh=0.001;for x=-1:hh:1;ff=0;for k=1:n+1;%%%求插值基函数switch kcase 1if x<=s(2);l=(x-s(2))./(s(1)-s(2));elsel=0;endcase n+1if x>s(n);l=(x-s(n))./(s(n+1)-s(n)); elsel=0;endotherwiseif x>=s(k-1)&x<=s(k);l=(x-s(k-1))./(s(k)-s(k-1)); else if x>=s(k)&x<=s(k+1);l=(x-s(k+1))./(s(k)-s(k+1)); elsel=0;endendendff=ff+Rf(s(k))*l;%%求插值函数值endm=m+1;f(m)=ff;end%%%作出曲线x=-1:hh:1;plot(x,f,'r');grid onhold on三次样条插值源程序:(采用第一边界条件)clearn=input('将区间分为的等份数输入:\n');%%%插值区间a=-1;b=1;hh=0.001;%画图的步长s=[a+(b-a)/n*[0:n]];%%%给定的定点,Rf为给定的函数%%%%第一边界条件Rf"(-1),Rf"(1)v=5000*1/(1+25*a*a)^3-50/(1+25*a*a)^4;for k=1:n;%取出节点间距h(k)=s(k+1)-s(k);endfor k=1:n-1;%求出系数向量lamuda,miula(k)=h(k+1)/(h(k+1)+h(k));miu(k)=1-la(k);end%%%%赋值系数矩阵Afor k=1:n-1;for p=1:n-1;switch pcase kA(k,p)=2;case k-1A(k,p)=miu(p+1);case k+1A(k,p)=la(p-1);otherwiseA(k,p)=0;endendend%%%%求出d阵for k=1:n-1;switch kcase 1d(k)=6*f2c([s(k) s(k+1) s(k+2)])-miu(k)*v; case n-1d(k)=6*f2c([s(k) s(k+1) s(k+2)])-la(k)*v; otherwised(k)=6*f2c([s(k) s(k+1) s(k+2)]);endend %%%%求解M阵M=A\d';M=[v;M;v];%%%%m=0;f=0;for x=a:hh:b;if x==a;p=1;elsep=ceil((x-s(1))/((b-a)/n));endff1=0;ff2=0;ff3=0;ff4=0;m=m+1;ff1=1/h(p)*(s(p+1)-x)^3*M(p)/6;ff2=1/h(p)*(x-s(p))^3*M(p+1)/6;ff3=((Rf(s(p+1))-Rf(s(p)))/h(p)-h(p)*(M(p+1)-M(p))/6)*(x-s(p));ff4=Rf(s(p))-M(p)*h(p)*h(p)/6;f(m)=ff1+ff2+ff3+ff4 ;end%%%作出插值图形x=a:hh:b;plot(x,f,'k')hold on grid on 多项式最小二乘法源程序clear%%%给定测量数据点(s,f)s=[3 4 5 6 7 8 9];f=[2.01 2.98 3.50 5.02 5.47 6.02 7.05];%%%计算给定的数据点的数目n=length(f);%%%给定需要拟合的数据的最高次多项式的次数m=10;%%%程序主体for k=0:m;g=zeros(1,m+1);for j=0:m;t=0;for i=1:n;%计算内积(fai(si),fai(si))t=t+fai(s(i),j)*fai(s(i),k);endg(j+1)=t;endA(k+1,:)=g;%法方程的系数矩阵t=0;for i=1:n;%计算内积(f(si),fai(si))t=t+f(i)*fai(s(i),k);endb(k+1,1)=t;enda=A\b%求出多项式系数x=[s(1):0.01:s(n)]';y=0;fori=0:m;y=y+a(i+1)*fai(x,i);endplot(x,y)%作出拟合成的多项式的曲线grid onhold onplot(s,f,'rx') %在上图中标记给定的点表中,L10(x)为Lagrang e插值的10次多项式,S10(x),S40(x)分别代表n=10,40的三次样条插值函数,X10(x),X40(x)分别代表n=10,40的线性分段插值函数。
数学实验简单MATLAB代码实现
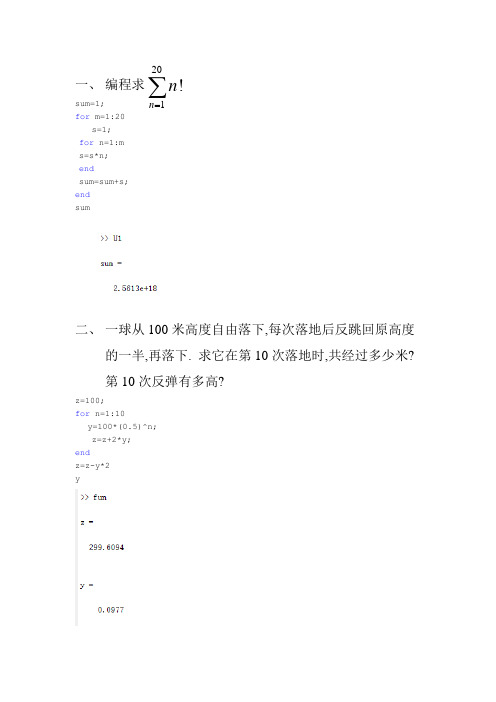
一、编程求sum=1;for m=1:20s=1;for n=1:ms=s*n;endsum=sum+s;endsum二、一球从100米高度自由落下,每次落地后反跳回原高度的一半,再落下. 求它在第10次落地时,共经过多少米?第10次反弹有多高?z=100;for n=1:10y=100*(0.5)^n;z=z+2*y;endz=z-y*2y201!nn =∑三、 画出下列常见曲线的图形(1) 高斯曲线(2) 摆线 (3) 螺旋线 (4) 阿基米德螺线(1)x=-10:10;y=exp(-x.^2);plot(x,y)title('高斯曲线')(2)t=-2*pi:0.1:2*pi;x=t-sin(t);2.x y e -=sin ,2(1cos ).x t t y t =-=-cos ,2sin , 3.x t y t z t===.r θ=y=2*(1-cos(t));plot(x,y)title('摆线')(3)t=-2*pi:0.1:2*pi; x=cos(t);y=2*sin(t);z=3*t;plot3(x,y,z)title(‘螺旋线')(4)theta=-2*pi:0.1:2*pi; r=theta;polar(theta,r)title('阿基米德螺线)四、已知完成以下操作:(1)在同一坐标系下,用不同颜色和线型绘制三条曲线;(2)在同一图形窗口中,以子图的形式绘制三条曲线。
x=-1:0.1:1;y1=x.^2;y2=cos(x*2);y3=y1.*y2;plot(x,y1,'r',x,y2,'b',x,y3,'k')hold onsubplot(1,2,2)21,2cos(2),312, y x y x y y y ===⨯五、设绘制和 曲线,并给图形添加图形标 注(title (标题),xlabel (x 轴),ylabel (y 轴),text (在合适位置标注两曲线名),legend ,axis (指定范围),显示网格,不显示边框)x=0:0.1:2*pi;y1=0.5.*log(x+sin(x));y2=(0.5+3*sin(x)/(1+x.^2)).*cos(x);plot(x,y1,'r',x,y2,'k')title('ÇúÏß')text(y1(end),y2(end),' ');xlabel('X');ylabel('Y');legend('y1','y2');axis([0,2*pi,-5,5]);grid on ;0~2x π=10.5ln(sin )y x x =+23sin 20.5cos 1x y x x ⎛⎫=+ ⎪+⎝⎭。
(完整word版)matlab经典代码大全
(完整word版)matlab经典代码大全哈哈哈MATLAB显示正炫余炫图:plot(x,y1,'* r',x,y2,'o b')定义【0,2π】;t=0:pi/10:2*pi;定义函数文件:function [返回变量列表]=函数名(输入变量列表)顺序结构:选择结构1)if-else-end语句其格式为:if 逻辑表达式程序模块1;else程序模块2;End图片读取:%选择图片路径[filename, pathname] = ...uigetfile({'*.jpg';'*.bmp';'*.gif'},'选择图片');%合成路径+文件名str=[pathname,filename];%为什么pathname和filename要前面出现的位置相反才能运行呢%读取图片im=imread(str);%使用图片axes(handles.axes1);%显示图片imshow(im);边缘检测:global imstr=get(hObject,'string');axes (handles.axes1);switch strcase ' 原图'imshow(im);case 'sobel'BW = edge(rgb2gray(im),'sobel');imshow(BW);case 'prewitt'BW = edge(rgb2gray(im),'prewitt');imshow(BW);case 'canny'BW = edge(rgb2gray(im),'canny');imshow(BW);Canny算子边缘定位精确性和抗噪声能力效果较好,是一个折中方案end;开闭运算:se=[1,1,1;1,1,1;1,1,1;1,1,1]; %Structuring ElementI=rgb2gray(im);imshow(I,[]);title('Original Image');I=double(I);[im_height,im_width]=size(I);[se_height,se_width]=size(se);halfheight=floor(se_height/2);halfwidth=floor(se_width/2);[se_origin]=floor((size(se)+1)/2);image_dilation=padarray(I,se_origin,0,'both'); %Image to be used for dilationimage_erosion=padarray(I,se_origin,256,'both'); %Image to be used for erosion %%%%%%%%%%%%%%%%%% %%% Dilation %%%%%%%%%%%%%%%%%%%%%for k=se_origin(1)+1:im_height+se_origin(1)for kk=se_origin(2)+1:im_width+se_origin(2)dilated_image(k-se_origin(1),kk-se_origin(2))=max(max(se+image_dilation(k-se_origin(1):k+halfh eight-1,kk-se_origin(2):kk+halfwidth-1)));endendfigure;imshow(dilated_image,[]);title('Image after Dilation'); %%%%%%%%%%%%%%%%%%%% Erosion %%%%%%%%%%%%%%%%%%%%se=se';for k=se_origin(2)+1:im_height+se_origin(2)for kk=se_origin(1)+1:im_width+se_origin(1)eroded_image(k-se_origin(2),kk-se_origin(1))=min(min(image_erosion(k-se_origin(2):k+halfwidth -1,kk-se_origin(1):kk+halfheight-1)-se));endendfigure;imshow(eroded_image,[]);title('Image after Erosion'); %%%%%%%%%%%%%%%%%%%%%%%%%%%%% %%%%%%%%%%%%%%%%%%%%% Opening(Erosion first, then Dilation) %%% %%%%%%%%%%%%%%%%%%%%%%%%%% %%%%%%%%%%%%%%%%%%%%%se=se';image_dilation2=eroded_image; %Image to be used for dilationfor k=se_origin(1)+1:im_height-se_origin(1)for kk=se_origin(2)+1:im_width-se_origin(2)opening_image(k-se_origin(1),kk-se_origin(2))=max(max(se+image_dilation2(k-se_origin(1):k+hal fheight-1,kk-se_origin(2):kk+halfwidth-1)));endendfigure;imshow(opening_image,[]);title('OpeningImage'); %%%%%%%%%%%%%%%%%%%%%%%%%%%%%% %%%%%%%%%%%%%%%%%%%% Closing(Dilation first, then Erosion) %%% %%%%%%%%%%%%%%%%%%%%%%%%%% %%%%%%%%%%%%%%%%%%%%%se=se';image_erosion2=dilated_image; %Image to be used for erosionfor k=se_origin(2)+1:im_height-se_origin(2)for kk=se_origin(1)+1:im_width-se_origin(1)closing_image(k-se_origin(2),kk-se_origin(1))=min(min(image_erosion2(k-se_origin(2):k+halfwidt h-1,kk-se_origin(1):kk+halfheight-1)-se));endendfigure;imshow(closing_image,[]);title('Closing Image');Warning: Image is too big to fit on screen; displaying at 31% scale.> In truesize>Resize1 at 308In truesize at 44In imshow at 161图像的直方图归一化:I=imread(‘red.bmp’);%读入图像figure;%打开新窗口[M,N]=size(I);%计算图像大小[counts,x]=imhist(I,32);%计算有32个小区间的灰度直方图counts=counts/M/N;%计算归一化灰度直方图各区间的值stem(x,counts);%绘制归一化直方图图像平移:I=imread('shuichi.jpg');se=translate(strel(1),[180 190]);B=imdilate(I,se);figure;subplot(1,2,1),subimage(I);title('原图像');subplot(1,2,2),subimage(B);title('平移后图像');图像的转置;A=imread('nir.bmp');tform=maketform('affine',[0 1 0;1 0 0;0 0 1]);B=imtransform(A,tform,'nearest');figure;imshow(A);figure;imshow(B);imwrite(B,'nir转置后图像.bmp');图像滤波:B = imfilter(A,H,option1,option2,...)或写作g = imfilter(f, w, filtering_mode, boundary_options, size_options)其中,f为输入图像,w为滤波掩模,g为滤波后图像。
matlab相关代码

matlab相关代码Matlab是一种高级技术计算语言和交互式环境,广泛应用于科学、工程和金融等领域。
它具有强大的数学和图形处理能力,可以快速处理大量数据和进行复杂的算法分析。
以下是一些常用的Matlab相关代码:1. 矩阵操作Matlab中的矩阵操作非常方便,可以使用以下代码实现:a = [1 2 3; 4 5 6; 7 8 9]; % 定义一个3x3的矩阵b = [4 5 6; 7 8 9; 10 11 12]; % 定义另一个3x3的矩阵c = a + b; % 矩阵加法d = a - b; % 矩阵减法e = a * b; % 矩阵乘法f = a .* b; % 矩阵对应元素相乘g = a' % 矩阵转置2. 绘图Matlab中的绘图功能非常强大,可以使用以下代码实现:x = 0:0.1:2*pi; % 定义x轴的范围y = sin(x); % 定义y轴的值plot(x,y); % 绘制sin函数图像xlabel('x'); % 设置x轴标签ylabel('y'); % 设置y轴标签title('sin函数图像'); % 设置图像标题grid on; % 显示网格线3. 数据处理Matlab中的数据处理功能非常强大,可以使用以下代码实现:data = [1 2 3 4 5 6 7 8 9]; % 定义一个数据数组mean_data = mean(data); % 计算平均值std_data = std(data); % 计算标准差max_data = max(data); % 计算最大值min_data = min(data); % 计算最小值median_data = median(data); % 计算中位数4. 机器学习Matlab中的机器学习功能非常强大,可以使用以下代码实现:load fisheriris; % 加载鸢尾花数据集X = meas(:,1:2); % 取前两个特征Y = species; % 取标签svmModel = fitcsvm(X,Y); % 训练SVM模型svmModel.ClassNames % 显示类别名称svmModel.Beta % 显示模型系数总之,Matlab是一种非常强大的工具,可以帮助科学家、工程师和金融分析师等快速处理数据和进行复杂的算法分析。
matlab实验代码(总)
matlab实验代码(总)% 使⽤两种⽅法,创建⼀稀疏矩阵% 使⽤函数sparse,可以⽤⼀组⾮零元素直接创建⼀个稀疏矩阵。
该函数调⽤格式为:% S=sparse(i,j,s,m,n)% 其中i和j都为⽮量,分别是指矩阵中⾮零元素的⾏号与列号,% s是⼀个全部为⾮零元素⽮量,元素在矩阵中排列的位置为(i,j)% m为输出的稀疏矩阵的⾏数,n为输出的稀疏矩阵的列数。
%⽅法1A9=[0 0 1;0 3 0;2 4 0]B9=sparse(A9)C9=full(B9)%⽅法2A10=sparse([1 3 2 4],[2 3 1 4],[1 2 3 4],4,4)C10=full(A10)A11=[1 2 3];B11=[4 5 6];C11=3.^A11D11=A11.^B11%使⽤函数,实现矩阵左旋90°或右旋90°的功能。
A=[ 1 2 3 ; 4 5 6 ; 7 8 9 ]B=rot90(A,1)C=rot90(A,-1)%求S=2^0+2^1+2^2+2^3+2^4+……+2^10的值(提⽰:利⽤求和函数与累乘积函数。
)A=2*ones(1,10)%10个2B=cumprod(A)%平⽅C=sum(B)+1%加上2^0%建⽴⼀个字符串向量,删除其中的⼤写字母(提⽰:利⽤find函数和空矩阵。
)str='AAAbCcd'b=find(str>='A' & str<='Z');str(b)=[];% 输⼊⼀个百分制成绩,要求输出成绩等级A、B、C、D、E。
其中90分~100分为A,80分~89分为B,70分~79为C,60分~69分为D,60分以下为E。
switch(score)case num2cell(90:0.5:100)disp(['成绩等级为:A']);case num2cell(80:0.5:89.5)disp(['成绩等级为:B']);case num2cell(70:0.5:79.5)disp(['成绩等级为:C']);case num2cell(60:0.5:69.5)disp(['成绩等级为:D']);case num2cell(0:0.5:59.5)disp(['成绩等级为:E']);otherwisedisp(['输⼊成绩不合理!']);end%设计程序,完成两位数的加、减、乘、除四则运算,%即产⽣两个两位随机整数,再输⼊⼀个运算符号,做相应的运算,显⽰相应的结果,并要求结果显⽰类似于“a=x+y=34”。
MATLAB-实验代码

实验 11、ones 语句:Y = ones(n ) %生成n×n 全1 阵Y = ones(m ,n) %生成m×n 全1 阵Y = ones ([m n]) %生成m×n 全1 阵Y = ones(d1,d2,d3…) %生成d1×d2×d3×…全1 阵或数组Y = ones ([d1 d2 d3…]) %生成d1×d2×d3×…全1 阵或数组Y = ones (size(A)) %生成与矩阵A 相同大小的全1 阵2、find 语句:k = find(x ) %按行检索X 中非零元素的点,若没有非零元素,将返回空矩阵。
[i ,j] = find(X ) %检索X 中非零元素的行标i 和列标j 。
[i,j ,v] = find(X) %检索X 中非零元素的行标i 和列标j 以及对应的元素值v 。
实验 31、编写一M 函数,a 和x 作为函数参数输入,函数里面分别用if 结构实现函数表示1()1x a x f x a x a ax a-≤-⎧⎪⎪=-<<⎨⎪≥⎪⎩function output=function1(x,a)result=0;if x 〈=—aresult=-1;elseif x 〉-a &x 〈aresult=x/a;else x 〉=aresult=1;endoutput=[result ];2、编写一M 函数,迭代计算132n n x x +=+,给出可能的收敛值,其中x 的初值作为函数的参数输入.function output=function2(x )y=0;while 1y=3/(x+2);if abs(y —x)〈0.000001break ;else x=y ;endendoutput=[y]; end3、编写一M函数,实现212!!nxx xe xn=+++++近似计算指数,其中x为函数参数输入,当n+1步与n步的结果误差小于0。
MATLAB实验代码
MATLAB实验代码实验⼀MATLAB软件使⽤初步⼀、实验⽬的学习MATLAB软件的安装过程,熟悉MATLAB软件界⾯的组成及基本使⽤⽅法。
理解数组(Array)的分类,及标量(scalar)、⽮量(vector)和矩阵(Matrix)的区别,熟悉数组与矩阵的构造⽅法,掌握数组与矩阵的基本运算法则。
⼆、实验要求1、掌握MATLAB软件的启动与退出的⽅法。
2、掌握MATLAB软件的桌⾯环境。
3、掌握MATLAB软件的基本使⽤⽅法。
4、掌握M⽂件编辑器的使⽤。
5、学会使⽤MATLAB的帮助系统。
6、掌握标量、⽮量和矩阵的构造⽅法。
7、掌握数组的四则运算。
8、掌握矩阵的四则运算。
9、掌握基本的数据输⼊和输出函数。
三、实验内容1.通过桌⾯快捷图标或“开始—程序”菜单运⾏MATLAB,熟悉MATLAB的桌⾯环境,如图1所⽰。
图1 MATLAB桌⾯环境2.浏览各个菜单项的内容,试着改变各个窗⼝的字体与字号。
3.熟悉matlab中的特殊变量:i、j、pi、ans等等。
4.在实验报告中回答下⾯哪些赋值语句是正确的,如果不正确给出理由。
a=1 正确a20=1.2; 正确年薪=100000 错误不能是汉字_fee=20.0 错误开头不能下划线coordinate.x=1 正确5.已知1u =,3v =,⽤MATLAB 分别执⾏下列语句。
并在实验报告中记录语句和结果。
a. 43u vb. ()222v u v -+ c. 333v v u - d.243v π u=1,v=3(4*u)/(3*v)(2*v^-2)/(u+v)^2(v^3)/(u^3-v^3)(4**pi*v^2)/3ans=0.4444 0.2222 -1.0385 37.69916. 运⾏以下命令并将运⾏结果与⼯作空间浏览器中的状态进⾏⽐较。
>> a=sin(pi); b=[1, 2]; c=[1; 2]; >> who 所有可⽤变量>> whos 显⽰变量所占的矩阵⼤⼩和所占的字节 Size 下的1x1、1x2、2x1的含义 >> whos Name Size Bytes Classa 1x1 8 double arrayb 1x2 16 double arrayc 16 double array矩阵⼤⼩7.通过⼯作⽬录浏览器(Current Directory Browser )或者“File”菜单中相应菜单项改变当前⼯作⽬录。
- 1、下载文档前请自行甄别文档内容的完整性,平台不提供额外的编辑、内容补充、找答案等附加服务。
- 2、"仅部分预览"的文档,不可在线预览部分如存在完整性等问题,可反馈申请退款(可完整预览的文档不适用该条件!)。
- 3、如文档侵犯您的权益,请联系客服反馈,我们会尽快为您处理(人工客服工作时间:9:00-18:30)。
2、 3vars global help My_exp sin X+Y _input E-4 Abcd AB_C_ ;3、 A = [ 1 2 3;4 5 6;7 8 9]y = [12 + 2 * (7 -4)]/(3^2)4、 A = 15;B = 20;C = A + B c = a + bA = [1 2 3;4 5 6;7 8 9];B = [9 8 7;6 5 4;3 2 1];A *B A .* BA =10;B =20;C =A/BD =A\Ba = [1 -2 3;4 5 -4;5 -6 7]A = [1,2;3,4] + i * [5,6;7,8]A = [1,2;3,4] + i[5,6;7,8]a = [1 2 3;3 4 2;5 2 3];a^2 a.^2clearX = [1 2;8 9;3 6];X( : )A = [ 1 2 3 ];B = [ 4 5 6 ];C = 3. ^AD = A. ^B5、t = -1:0.01:1;y = (sqrt(3)/2).*exp((-4).*t).*sin(t.*4*sqrt(3)+(pi/3))1、clcclearA = [12 34 -4;34 7 87;3 65 7];B = [1 3 -1;2 0 3;3 -2 7];a=A+6*B,I=eye(3),b=A^2-B+I,c=A*B,d=A.*B,e=A^3,f= A.^3,g=[A,B],h= [(A ([1,3],:));B^2]2、clcclearA = [1 2 3 4 5;6 7 8 9 10;11 12 13 14 15;16 17 18 19 20;21 22 23 24 25];B = [3 0 16 ;17 -6 9;0 23 -4;9 7 0;4 13 11];C = A * B ,D = C([3 4 5],[2 3])3、clcclearA = [23 10 -0.778 0; 41 -45 65 5; 32 5 0 32; 6 -9.54 54 3.14];B = A([1:3],:);C = A(:,[1:2]);D = A([2 3 4],[1 2]);E = B * C;a= E<D ,b= E&D,c= E|D ,d=~E|~D,e=(A>=10&A<25)4、clcclear%使用函数实现矩阵左旋90°或右旋90°的功能。
A=magic(3), B=rot90(A),C=rot90(A,3) %B为左旋90°,C为右旋90°5、clcclearA = [1 2 2 2 2 2 2 2 2 2 2],B = cumprod(A),%返回向量A的累乘积向量C = cumsum(B),%返回向量B的累加和向量S = max(C),%求和6、clcclearA = [1 10 11 16 21 2 9 12 17 22 3 8 13 18 23 4 7 14 19 24 5 6 15 20 25];B = reshape(A,5,5)C1 = B(2,[2 3])C2 = B([2 3 4],4)C3 = B([4 5],[1 2 3])实验三1.a=reshape(100:999,30,30);b=rem(a,21) %求余c=find(b==0)length(c) %获取向量长度,若输入参数为矩阵或多维数组,则返回各个维尺寸的最大值2.ch='FrIeNd123'd=find(ch>='A'&ch<='Z')ch(d)=[]3.%若需要在字符串内容中包含单引号,则在键入字符串内容时,连续键入两个单引号即可ch='In GB usage quotation marks are usually singel:''fire!'''5.1A{1,1}=1;A{1,2}='Brenden';A{2,1}=reshape(1:9,3,3);A{2,2}={12,34,2;54,21,3;4,23,67};upper(A{1,2}) %将字符串的字符都转变成为大写字符5.2.1A{1,1}=1;A{1,2}='Brenden';A{2,1}=reshape(1:9,3,3);A{2,2}={12,34,2;54,21,3;4,23,67};A(3)=[] %使用圆括号()直接访问元胞数组的元胞,获取的数据类型是一个元胞5.2.2A{1,1}=1;A{1,2}='Brenden';A{2,1}=reshape(1:9,3,3);A{2,2}={12,34,2;54,21,3;4,23,67};A{3}=[] %使用大括号{}直接访问元胞数组的元胞,获取的数据类型是元胞的数据类型6.a=rand(4,3) %产生均匀分布的随机数4*3矩阵,数值范围(0,1)b=mean(a) %返回一个行向量,其第i个元素是矩阵a的第i列的算术平均值c=median(a) %返回一个行向量,其第i个元素是a的第i列的中值b1=mean(b)c1=median(c)d=max(a)d1=max(d) %求最大值e=min(a)e1=min(e) %求最小值[i1,j1]=find(a==d1) %最大值元素的位置[i2,j2]=find(a==e1) %最小值元素的位置t=sum(a')x=sum(a)y=sum(x) %求和sort(a) %返回一个对A中的每列元素按升序排列的新矩阵sort(a,2,'descend') %返回一个对A中的每列元素按降序排列的新向量降序实验四1.1s=1;for n=1:100s=s*n;if(s>10^100)break;endenda=sprintf('n=%d',n);b=sprintf('%d!=%e>1e100',n,s);disp(b)1.2n=1;s=1;while(s<=10^100)s=s*n;n=n+1;enda=sprintf('n=%d',n-1);b=sprintf('n!=%e>1e100',s); disp(a)disp(b)2f(1)=1;f(2)=0;f(3)=1;for n=4:50f(n)=f(n-1)-2*f(n-2)+f(n-3); end[MAX,x]=max(f)[MIN,y]=min(f)SUM=sum(f)positive=length(find(f>0)) zero=length(find(f==0)) negative=length(find(f<0))3a(1)=1;a(2)=1;for i=1:10000a(i+2)=a(i)+a(i+1);if a(i)>10000break;endenddisp(['i=',num2str(i)])disp(['a(i)=',num2str(a(i))])1x =1 4 9 16 25 36 49 64 81 100 2ans =100实验五1.1score=input('please input grade=');if(score>100|score<0|rem(score,0.5)~=0)disp('输入的成绩不合理');elseif(score>=90&score<=100)disp('the grade = A !');elseif(score>=80&score<=89)disp('the grade = B !');elseif(score>=70&score<=79)disp('the grade = C !');elseif(score>=60&score<=69)disp('the grade = D !');else if(score<60)disp('the grade = E !');endend1.2score=input('please input grade=');if (score<=100&score>=0&rem(score,0.5)==0) switch fix(score/10)case{9,10}disp('grade=A')case{8}disp('grade=A');case{7}disp('grade=C');case{6}disp('grade=D');otherwisedisp('grade=E');endelsedisp('输入的成绩不合理');end2clearclcx=fix(50*(rand(1)-rand(1)))y=fix(50*(rand(1)-rand(1)))k=input('请输入一个运算符号:','s');switch(k)case{'+'}a=x+y;case{'-'}a=x-y;case{'*'}a=x*y;case{'/'}a=x/y;otherwisedisp('输入的运算符有误');break;endstc=sprintf('a=x%sy=%d',k,a)3clearclcx=[];y=[];x=input('请输入x的值:');for k=1:length(x)if x(k)<0 & x(k)~=-3y(k)=x(k).^2+x(k)-6;elseif x(k)>=0&x(k)<10&x(k)~=2&x(k)~=3y(k)=x(k).^2-5*x(k)+6;else y(k)=x(k).^2-x(k)-1;endendfor i=1:length(y)disp(['y(',num2str(x(i)),')','=',num2str(y(i))]);; end实验六:1.function varargout=chengji(a,b)[x,y]=size(a);[xx,yy]=size(b);if xx==yy&x==y&x==xxvarargout{1}=a*b;varargout{2}=a.*b;else if x==xx&y==yyvarargout{1}=a.*b;disp('只能作点乘')varargout{2}=0;else if x==yy&xx==ydisp('可以做两种矩阵乘')varargout{1}=a*b;varargout{2}=b*a;else if x==yy||xx==ytryvarargout{1}=a*b;disp('只能做矩阵乘')varargout{2}=0;catchvarargout{1}=b*a;disp('只能做矩阵乘')varargout{2}=0;endelseerror('这两个矩阵不能乘')endendendend2.function y=qiuhe(a)y=[];[m,n]=size(a);if m==1s=0;for k=1:ns=s+a(1,k);endy=s;elsefor j=1:ns=0;for i=1:ms=s+a(i,j);endy(1,j)=s;endend3.function s=jiecheng(n)s=1;if n==0s=1;else if n<0error('n必须大于等于0') elsefor i=1:ns=s*i;endendend思考题:function y=temf(a)if length(a)<2y=a;elsey=max(a)-min(a);end实验七:7.1clear all;clc;qname=input('Enter file containing question:','s'); ip=fopen(qname,'rt');if (ip<0)disp('could not open input file')endop=fopen('qq.txt','wt');if (op<0)disp('could not open output file');endq=fgetl(ip);while(ischar(q))fprintf('%s\n',q)a=input('Answer Y(yes) or N(not):','s');while((a~='Y')&&(a~='N'))a=input('Answer Y(yes) or N(not):','s');endfprintf(op,'%s\nAnswer:%s\n',q,a);q=fgetl(ip);endfclose(ip);fclose(op);7.2clear all;clc;f=fopen('a.txt');h=fopen('aa.txt','w');fwrite(h,upper(char(fread(f,inf,'char'))),'char');fclose(f);fclose(h);7.3a=1:5;fid=fopen('fdat.bin','w');fwrite(fid,a,'int16');status=fclose(fid);fid=fopen('fdat.bin','r');status=fseek(fid,6,'bof');b=fread(fid,1,'int16');position=ftell(fid);status=fseek(fid,-4,'cof');c=fread(fid,1,'int16');status=fclose(fid);bcPosition实验八:1.clear,clcx=0:1:4*pi;y=sin(x).*exp(-x/5);xi=0:0.3:4*pi;y1=interp1(x,y,xi,'nearset');y2=interp1(x,y,xi,'linear');y3=interp1(x,y,xi,'spline');y4=interp1(x,y,xi,'cubic');plot(x,y,'-m',xi,y1,'*r',xi,y2,'ok',xi,y3,'^b',xi,y4,'+g') legend('原始数据','最近点插值','线性插值','样条插值','立方插值')title('第一题四种插值方法进行插值','fontname','隶书','fontsize',20)xlabel('x轴','fontname','隶书','fontsize',16)ylabel('y轴','fontname','隶书','fontsize',16)2.clear,clct=[13 15 17 19 20];sex=[0,1]';y=[270 290 330 350 380;250 273 310 330 360];x=[13:20];sex_2=[0,1]';y_2=interp2(t,sex,y,x,sex_2)surf(x,sex_2,y_2)3.x=2007:2013;y=[70 122 144 152 174 196 202];k=polyfit(x,y,1);x1=2007:2016;y1=polyval(k,x1);plot(x,y,'-ro',x1,y1,'-b*');title('某乡镇企业2004-2013年的生产利润')legend('07-13年的利润','07-16年的利润趋势线')xlabel('年份');ylabel('利润');text(2015,polyval(k,2015),'<---2015年利润')text(2016,polyval(k,2016),'<---2016年利润')grid on4.clear all ;clc;load('census.mat');nian=[1990:2010];p=polyfit(cdate,pop,2);z=polyval(p,cdate);zz=polyval(p,nian);my=mean(pop);mz=mean(z);R=sum((pop-my).*(z-mz))./sqrt(sum((pop-my).^2).*sum((z-mz).^2))plot(cdate,pop,'*',cdate,z,'r',nian,zz,'b-')xlabel('年份(十年)','fontname','隶书','fontsize',16) ylabel('人口(百万)','fontname','隶书','fontsize',16)title('第四题美国自1790-1990年的总人口','fontname','隶书','fontsize',20)text(1990,248.73,'<---之后为拟合数据')legend('原数据','拟合曲线')实验九1.1clear all;clc;x1=-2:0.1:2;y1=exp(x1);x2=0:0.1:5;y2=log(x2);plot(x1,y1,'-.r',x2,y2,'--b');grid ontitle('二维图');legend('y=exp(x)','y=log(x)');xlabel('x轴坐标数据');ylabel('y轴坐标数据');1.2clear all;clc;x=0:pi/100:pi/2;y=tan(x);plot(x,y,'-+r');title('正切函数');legend('y=tan(x)');xlabel('x轴数据');ylabel('y轴数据');axis([0,pi/2,0,5]);1.3clear all;clc;t=-pi:pi/20:pi;x=t.*cos(3*t);y=t.*(sin(t)).^2;plot(x,y);legend(strvcat('x=tcos(3t)','y=tsin^2t'));xlabel('x轴数据');ylabel('y轴数据');2.clear all;clc;[x,y]=meshgrid(-1.5*pi:1.5*pi);z=cos(x).*sin(y)./y;subplot(1,2,1);surf(x,y,z)title('曲面图');xlabel('x轴数据');ylabel('y轴数据');zlabel('z轴数据');subplot(1,2,2);mesh(x,y,z);title('线框图');xlabel('x轴数据');ylabel('y轴数据');zlabel('z轴数据');3.clear all;clc;data=[10 2 3 5;5 8 10 3;9 7 6 1;3 5 7 2;4 7 5 3]; a=sum(rand(5,5));theta=2*pi*(0:127)/128;x=cos(theta);y=sin(theta);z=abs(fft(ones(10,1),128))';subplot(2,2,1);bar(data);grid on;title('条状图');subplot(2,2,2);area(data);grid on;title('面积图');subplot(2,2,3);pie(a);grid on;title('饼图');subplot(2,2,4);stem3(x,y,z);grid on; title('火柴杆图');。