13-ClusterAnalysisI(聚类分析)
聚类分析法
聚类分析法聚类分析法(ClusterAnalysis)是一种基于模式识别及统计学理论的数据挖掘技术,它通过让数据集中的项以有联系的方式归入不同的簇(Cluster)来呈现其特征,以此发掘出隐藏在数据背后的所谓的“模式”和知识。
聚类分析法主要应用于定性分析(Qualitative Analysis)、模式识别、决策分析(Decision Analysis)、图象处理(Image Processing)、系统自动推理(System Inference)等领域,其主要性质属于非监督式学习。
基本流程聚类分析法的基本流程包括:数据准备(Data Preparation)、预处理(Pre-processing)、聚类(Clustering)、结果评估(Result Evaluation)等步骤。
在数据准备阶段,需要完成原始数据的清洗、转换、结构化以及标准化等操作。
而预处理步骤同样很重要,在此步骤中,可以得到样本的特征数据,并用于聚类模型的建立。
接下来,便是聚类的核心步骤了,完成聚类需要确定聚类的具体方法,例如层次聚类(Hierarchical Clustering)、基于密度的聚类(Density-Based Clustering)、均值聚类(K-means Clustering)等。
最后便是评估结果,在这一步中,会根据聚类的执行情况以及聚类的结果,采用相应的评估指标,对聚类结果做出评价,确定聚类模型的合理性。
工作原理聚类分析法的工作原理,主要是利用距离函数(Distance Function)来度量数据项之间的距离,从而将数据项归入不同的簇。
常用的距离函数有欧氏距离(Euclidean Distance)、曼哈顿距离(Manhattan Distance)、闵可夫斯基距离(Minkowski Distance)、切比雪夫距离(Chebyshev Distance)等。
其中欧氏距离被广泛应用,由于它比较容易实现,可以很好地表现出数据项之间的相似性。
聚类分析_精品文档
1聚类分析内涵1.1聚类分析定义聚类分析(Cluste.Analysis)是一组将研究对象分为相对同质的群组(clusters)的统计分析技术.也叫分类分析(classificatio.analysis)或数值分类(numerica.taxonomy), 它是研究(样品或指标)分类问题的一种多元统计方法, 所谓类, 通俗地说, 就是指相似元素的集合。
聚类分析有关变量类型:定类变量,定量(离散和连续)变量聚类分析的原则是同一类中的个体有较大的相似性, 不同类中的个体差异很大。
1.2聚类分析分类聚类分析的功能是建立一种分类方法, 它将一批样品或变量, 按照它们在性质上的亲疏、相似程度进行分类.聚类分析的内容十分丰富, 按其聚类的方法可分为以下几种:(1)系统聚类法: 开始每个对象自成一类, 然后每次将最相似的两类合并, 合并后重新计算新类与其他类的距离或相近性测度. 这一过程一直继续直到所有对象归为一类为止. 并类的过程可用一张谱系聚类图描述.(2)调优法(动态聚类法): 首先对n个对象初步分类, 然后根据分类的损失函数尽可能小的原则对其进行调整, 直到分类合理为止.(3)最优分割法(有序样品聚类法): 开始将所有样品看成一类, 然后根据某种最优准则将它们分割为二类、三类, 一直分割到所需的K类为止. 这种方法适用于有序样品的分类问题, 也称为有序样品的聚类法.(4)模糊聚类法: 利用模糊集理论来处理分类问题, 它对经济领域中具有模糊特征的两态数据或多态数据具有明显的分类效果.(5)图论聚类法: 利用图论中最小支撑树的概念来处理分类问题, 创造了独具风格的方法.(6)聚类预报法:利用聚类方法处理预报问题, 在多元统计分析中, 可用来作预报的方法很多, 如回归分析和判别分析. 但对一些异常数据, 如气象中的灾害性天气的预报, 使用回归分析或判别分析处理的效果都不好, 而聚类预报弥补了这一不足, 这是一个值得重视的方法。
聚类分析的基本

聚类分析的基本1、聚类分析(cluster analysis):又被称为群集分析,是一种对多维数据进行分析和探索的统计技术,目的是将许多观测值分类至具有相同特征的聚类,这些观测值之间差别较大,但内部观测差别较小。
聚类分析是一种目的性数据分析,它能够将没有标签分类(unsupervised classification)的不等来源的数据,分组至具有相似性特征的群体中,即对对象或事情按共有特征(feature)将他们分成几个类。
以此弥补“同属一个类别,但又个别有异的”的不足。
2、聚类分析的用途:(1)聚类分析用于数据挖掘,帮助系统提取未知信息,比如通过分析客户购买组合,把客户分成相关性很大的群体,以此帮助商业内容的定位;(2)帮助系统估算和识别多变量的变化趋势;(3)帮助用户从数据大海中获取价值信息,快速实现有效的数据查询;(4)帮助提升机器学习的精度,以及数据挖掘的价值,以此改善系统的性能;(5)可用于新闻分类,通常将同类型或相关性较大的新闻放在一起,进行分类。
3、聚类分析的原理:(1)根据定义与要求来制定聚类算法;(2)构造数据库,合理编码解决聚类分析问题;(3)根据构造好的数据库,提取其中的特征并进行度量,确定分类间的相似程度;(4)建立类内类间的关系,使用hierarchical clustering方法;(5)根据设定的特征度量准则,确定聚类分析后的结果;(6)对结果进行评定,检验聚类的正确性、有效性。
4、聚类分析的类型:(1)层次聚类:hierarchical clustering;(2)partitioning-clustering:将聚类中的各个群体将看作划分问题进行处理;(3)基于密度的聚类:density-based clustering;(4)基于模型的聚类:model-based clustering。
聚类分析也有许多优点,例如:(1)可以将相似的数据聚类在一起,细节化的数据可以表达地更清楚;(2)可以减少错误判断甚至盲目判断的几率,从而提高把握性;(3)可以改进数据查询速度;(4)可以识别数据之间的关联,从而实现对数据的有效分析利用。
聚类分析(clusteranalysis)
聚类分析(cluster analysis)medical aircraftClustering analysis refers to the grouping of physical or abstract objects into a class consisting of similar objects. It is an important human behavior. The goal of cluster analysis is to classify data on a similar basis. Clustering comes from many fields, including mathematics, computer science, statistics, biology and economics. In different applications, many clustering techniques have been developed. These techniques are used to describe data, measure the similarity between different data sources, and classify data sources into different clusters.CatalogconceptMainly used in businessOn BiologyGeographicallyIn the insurance businessOn Internet applicationsIn E-commerceMain stepsCluster analysis algorithm conceptMainly used in businessOn BiologyGeographicallyIn the insurance businessOn Internet applicationsIn E-commerceMain stepsClustering analysis algorithmExpand the concept of editing this paragraphThe difference between clustering and classification is that the classes required by clustering are unknown. Clustering is a process of classifying data into different classes or clusters, so objects in the same cluster have great similarity, while objects between different clusters have great dissimilarity. From a statistical point of view, clustering analysis is a way to simplify data through data modeling. Traditional statistical clustering analysis methods include system clustering method, decomposition method, adding method, dynamic clustering method, ordered sample clustering,overlapping clustering and fuzzy clustering, etc.. Cluster analysis tools, such as k- mean and k- center point, have been added to many famous statistical analysis packages, such as SPSS, SAS and so on. From the point of view of machine learning, clusters are equivalent to hidden patterns. Clustering is an unsupervised learning process for searching clusters. Unlike classification, unsupervised learning does not rely on predefined classes or class labeled training instances. Automatic marking is required by clustering learning algorithms, while instances of classification learning or data objects have class tags. Clustering is observational learning, not sample learning. From the point of view of practical application, clustering analysis is one of the main tasks of data mining. Moreover, clustering can be used as an independent tool to obtain the distribution of data, to observe the characteristics of each cluster of data, and to concentrate on the analysis of specific cluster sets. Clustering analysis can also be used as a preprocessing step for other algorithms (such as classification and qualitative inductive algorithms).Edit the main application of this paragraphCommerciallyCluster analysis is used to identify different customer groups and to characterize different customer groups through the purchase model. Cluster analysis is an effective tool for market segmentation. It can also be used to study consumer behavior, to find new potential markets, to select experimental markets, and to be used as a preprocessing of multivariate analysis.On BiologyCluster analysis is used to classify plants and plants and classify genes so as to get an understanding of the inherent structure of the populationGeographicallyClustering can help the similarity of the databases that are observed in the earthIn the insurance businessCluster analysis uses a high average consumption to identify groups of car insurance holders, and identifies a city's property groups based on type of residence, value, locationOn Internet applicationsCluster analysis is used to categorize documents online to fix informationIn E-commerceA clustering analysis is a very important aspect in the construction of Web Data Mining in electronic commerce, through clustering with similar browsing behavior of customers, and analyze the common characteristics of customers, help the users of e-commerce can better understand their customers, provide more suitable services to customers.Edit the main steps of this paragraph1. data preprocessing,2. defines a distance function for measuring similarity between data points,3. clustering or grouping, and4. evaluating output. Data preprocessing includes the selection of number, types and characteristics of the scale, it relies on the feature selection and feature extraction, feature selection important feature, feature extraction feature transformation input for a new character, they are often used to obtain an appropriate feature set to avoid the "cluster dimension disaster" data preprocessing, including outlier removal data, outlier is not dependent on the general data or model data, so the outlier clustering results often leads to a deviation, so in order to get the correct clustering, we must eliminate them. Now that is similar to the definition of a class based, so different data in the same measure of similarity feature space for clustering step is very important, because the diversity of types and characteristics of the scale, the distance measure must be cautious, it often depends on the application, for example,Usually by definition in the feature space distance metric to evaluate the differences of the different objects, many distance are applied in different fields, a simple distance measure, Euclidean distance, are often used to reflect the differences between different data, some of the similarity measure, such as PMC and SMC, to the concept of is used to characterize different data similarity in image clustering, sub image error correction can be used to measure the similarity of two patterns. The data objects are divided into differentclasses is a very important step, data based on different methods are divided into different classes, classification method and hierarchical method are two main methods of clustering analysis, classification methods start from the initial partition and optimization of a clustering criterion. Crisp Clustering, each data it belonged to a separate class; Fuzzy Clustering, each data it could be in any one class, Crisp Clustering and Fuzzy Clusterin are the two main technical classification method, classification method of clustering is divided to produce a series of nested a standard based on the similarity measure, it can or a class separability for merging and splitting is similar between the other clustering methods include density based clustering model, clustering based on Grid Based clustering. To evaluate the quality of clustering results is another important stage, clustering is a management program, there is no objective criteria to evaluate the clustering results, it is a kind of effective evaluation, the index of general geometric properties, including internal separation between class and class coupling, the quality is generally to evaluate the clustering results, effective index in the determination of the number of the class is often played an important role, the best value of effective index is expected to get from the real number, a common class number is decided to select the optimum values for a particular class of effective index, is the the validity of the standard index the real number of this index can, many existing standards for separate data set can be obtained very good results, but for the complex number According to a collection, it usually does not work, for example, for overlapping classes of collections.Edit this section clustering analysis algorithmClustering analysis is an active research field in data mining, and many clustering algorithms are proposed. Traditional clustering algorithms can be divided into five categories: partitioning method, hierarchical method, density based method, grid based method and model-based method. The 1 division method (PAM:PArtitioning method) first create the K partition, K is the number of partition to create; and then use a circular positioning technology through the object from a division to another division to help improve the quality of classification. Including the classification of typical: K-means, k-medoids, CLARA (Clustering LARge Application), CLARANS (Clustering Large Application based upon RANdomized Search). FCM 2 level (hierarchical method) method to create a hierarchical decomposition of the given data set. The method can be divided into two operations: top-down (decomposition) and bottom-up (merging). In order to make up for the shortcomings of decomposition and merging, hierarchical merging is often combined with other clustering methods, such as cyclic localization. This includes the typical methods of BIRCH (Balanced Iterative Reducing and Clustering using Hierarchies) method, it firstly set the tree structure to divide the object; then use other methods to optimize the clustering. CURE (Clustering, Using, REprisentatives) method, which uses fixed numbers to represent objects to represent the corresponding clustering, and then shrinks the clusters according to the specified amount (to the clustering center). ROCK method, it uses the connection between clusters to cluster and merge. CHEMALOEN method, it constructs dynamic model in hierarchical clustering. 3 density based method, according to the density to complete the object clustering. It grows continuouslyaccording to the density around the object (such as DBSCAN). The typical density based methods include: DBSCAN(Densit-based Spatial Clustering of Application with Noise): the algorithm by growing enough high density region to clustering; clustering can find arbitrary shape from spatial databases with noise in. This method defines a cluster as a set of point sets of density connectivity. OPTICS (Ordering, Points, To, Identify, the, Clustering, Structure): it does not explicitly generate a cluster, but calculates an enhanced clustering order for automatic interactive clustering analysis.. 4 grid based approach,Firstly, the object space is divided into finite elements to form a grid structure, and then the mesh structure is used to complete the clustering. STING (STatistical, INformation, Grid) is a grid based clustering method that uses the statistical information stored in the grid cell. CLIQUE (Clustering, In, QUEst) and Wave-Cluster are a combination of grid based and density based methods. 5, a model-based approach, which assumes the model of each cluster, and finds data appropriate for the corresponding model. Typical model-based methods include: statistical methods, COBWEB: is a commonly used and simple incremental concept clustering method. Its input object is represented by a symbolic quantity (property - value) pair. A hierarchical cluster is created in the form of a classification tree. CLASSIT is another version of COBWEB. It can incrementally attribute continuous attributes. For each node of each property holds the corresponding continuous normal distribution (mean and variance); and the use of an improved classification ability description method is not like COBWEB (value) and the calculation of discrete attributes but theintegral of the continuous attributes. However, CLASSIT methods also have problems similar to those of COBWEB. Therefore, they are not suitable for clustering large databases. Traditional clustering algorithms have successfully solved the clustering problem of low dimensional data. However, due to the complexity of data in practical applications, the existing algorithms often fail when dealing with many problems, especially for high-dimensional data and large data. Because traditional clustering methods cluster in high-dimensional data sets, there are two main problems. The high dimension data set the existence of a large number of irrelevant attributes makes the possibility of the existence of clusters in all the dimensions of almost zero; to sparse data distribution data of low dimensional space in high dimensional space, which is almost the same distance between the data is a common phenomenon, but the traditional clustering method is based on the distance from the cluster, so high dimensional space based on the distance not to build clusters. High dimensional clustering analysis has become an important research direction of cluster analysis. At the same time, clustering of high-dimensional data is also the difficulty of clustering. With the development of technology makes the data collection becomes more and more easily, cause the database to larger scale and more complex, such as trade transaction data, various types of Web documents, gene expression data, their dimensions (attributes) usually can reach hundreds of thousands or even higher dimensional. However, due to the "dimension effect", many clustering methods that perform well in low dimensional data space can not obtain good clustering results in high-dimensional space. Clustering analysis of high-dimensional data is a very active field in clustering analysis, and it is also a challenging task. Atpresent, cluster analysis of high-dimensional data is widely used in market analysis, information security, finance, entertainment, anti-terrorism and so on.。
聚类分析的基本概念与方法
聚类分析的基本概念与方法聚类分析(Cluster Analysis)是一种将数据分组或分类的统计学方法,通过将相似的对象归为同一组,使得组内的对象之间更加相似,而不同组之间的对象则差异较大。
它是数据挖掘和机器学习领域中常用的技术之一,被广泛应用于市场分析、生物信息学、图像处理等领域。
一、聚类分析的基本概念聚类分析基于相似性的概念,即认为具有相似特征的对象更有可能属于同一类别。
在聚类分析中,每个对象都被视为一个数据点,而聚类则是将这些数据点分组。
基本概念包括以下几点:1. 数据点:数据集中的每个样本或对象都被看作是一个数据点,它具有多个特征或属性。
2. 相似性度量:聚类分析的关键是如何计算数据点之间的相似性或距离。
常用的相似性度量包括欧氏距离、曼哈顿距离、闵可夫斯基距离等。
3. 簇/类别:将相似的数据点归为一组,这个组被称为簇或类别。
簇内的数据点相似度较高,而不同簇之间的数据点相似度较低。
4. 聚类算法:聚类分析依赖于具体的算法来实现数据点的分组。
常见的聚类算法有K均值聚类、层次聚类、密度聚类等。
二、聚类分析的方法1. K均值聚类(K-means Clustering):K均值聚类是一种迭代的聚类方法,它将数据点分成K个簇,每个簇代表一个样本集。
算法的基本思想是通过最小化簇内数据点与簇中心之间的平方误差来确定最优的簇中心位置。
2. 层次聚类(Hierarchical Clustering):层次聚类是一种基于树状结构的聚类算法,它根据数据点之间的相似性逐步合并或分割簇。
层次聚类分为凝聚型和分裂型两种方法,其中凝聚型方法从单个数据点开始,逐步合并最相似的簇;分裂型方法从所有数据点开始,逐步分割最不相似的簇。
3. 密度聚类(Density-Based Clustering):密度聚类基于密度可达的概念,将具有足够高密度的数据点归为一簇。
核心思想是在数据空间中通过密度连通性来确定簇的边界,相对于K均值聚类和层次聚类,密度聚类能够有效处理不规则形状和噪声数据。
聚类分析 Cluster Analysis

多组:一个以上判别函数
毛本清 2010.08.27
DA目的
建立判别函数 检查不同组之间在有关预测变量方面是否有显著 差异 决定哪个预测变量对组间差异的贡献最大 根据预测变量对个体进行分类
毛本清 2010.08.27
二、判别分析模型
要先建立判别函数 Y=a1x1+a2x2+...anxn, 其中:Y为判别分数(判别值),x1 x2...xn 为反映研究对象特征的变量,a1 a2...an 为系数
X=V
第i个标准化变量 第i个变量对第p个公因子的标准回归系数 公因子 特殊因子
毛本清 2010.08.27
公因子模型
F1=W11X1+W12X2+ …+W1mXm F2=W21X1+W22X2+ …+W2mXm Fi=Wi1X1+Wi2X2+ …+WimXm Fp=Wp1X1+Wp2X2+ …+WpmXm
Wi — 权重,因子得分系数 Fi — 第i个因子的估计值(因子得分)
毛本清 2010.08.27
二、有关统计量
Bartlett氏球体检验:各变量之间彼此独立 KMO值:FA合适性 因子负荷:相关系数 因子负荷矩阵 公因子方差(共同度) 特征值 方差百分比(方差贡献率) 累计方差贡献率 因子负荷图 碎石图
分层聚类分析的步骤
定义问题与选择分类变量 聚类方法 确定群组数目 聚类结果评估 结果的描述、解释
毛本清 2010.08.27
K-means Cluster(快速样品聚类)过程
属于非层次聚类法的一种 方法原理
选择(或人为指定)某些记录作为凝聚点 按就近原则将其余记录向凝聚点凝集 计算出各个初始分类的中心位置(均值) 用计算出的中心位置重新进行聚类 如此反复循环,直到凝聚点位置收敛为止
聚类分析
C
E
A
F B
重心距离
D
4.中间距离法(Median clustering )
如果类与类之间的距离既不采用两类之间最近的距离,也 不采用两类之间最远的距离,而是采用两者之间的距离, 则称为中间距离法.当两类 G p 和 Gq 合并成新类 Gr Gp Gq 时, Gr 与任一类 Gk 的距离如何决定呢? Gkq 、 G pq 为边作三角形,可设 Gkq Gkp ,按最短 以Gkp、 距离法核算类间距离;若 Gkq Gkp ,按最远距离法核 算类间距离;若 Gkq Gkp 取其中线,由初等几何知这 个中线的平方等于任一类 Gk 与 Gr 间的距离。计算公式 如下: 1 2 1 2 1 2 2 Gkr Gkp Gkq G pq 2 2 4
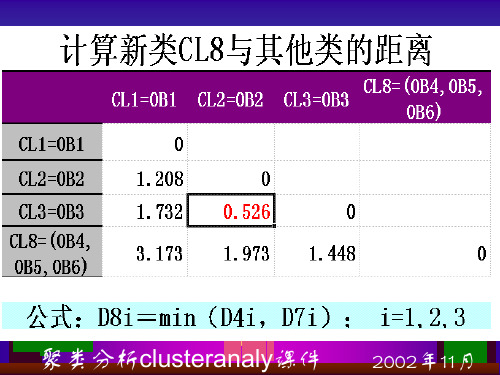
得到新矩阵
G6 G1 G 2 G 5 G 6 0 D1 G1 13.12 0 G 2 24.06 11.67 0 G 5 2.21 12.80 23.54 0
合并类6和类5,得到新类7
类7与剩余的1、2之间的距离分别为:
d(5,6)1=min(d51,d61)=min(12.80,13.12)=12.80 d(5,6)2=min(d52,d62)=min(23.54,24.06)=23.54
0 2.20 3.51
因此将3.4合并为一类,为类6,替代了3、4两类 类6与剩余的1、2、5之间的距离分别为:
d(3,4)1=min(d31,d41)=min(13.80,13.12)=13.12 d(3,4)2=min(d32,d42)=min(24.63,24.06)=24.06 d(3,4)5=min(d35,d45)=min(3.51,2.21)=2.21
聚类分析ClusterAnalysis1聚类分析问题2相似性度量3聚类
系数则越接近于0,相似的为一类,不相似的为不同类。
用 d (x, y) 表示样本x与样本y之间的距离. 用 d i j = d (xi , xj) 表示第样本x i与样本x j之间的距离.
1) 样本之间的相似性度量
① 明科夫斯基距离
p d ( x, y ) | xk yk | k 1
第10章 聚类分析 Cluster Analysis
1 聚类分析问题 2 相似性度量 3 聚类的准则 4 聚类方法
1
聚类分析的基本问题
1)聚类问题 2)对象特征的描述 3)数据的预处理
1) 聚类问题
俗语说,“物以类聚、人以群分” 其含义是:具有类似特性的对象聚集成一类 聚类分析(Cluster Analysis)是研究“物以类聚”的一种多元
统计分析方法。
分类学是人类认识世界的基础科学,在实际问题中经常需要 分类: 古生物研究中,通过挖掘出来的一些骨骼的形状和大小 将它们进行科学的分类; 地址勘探中,通过矿石标本的物探、化探指标要将样本 进行分类;
1) 聚类问题
随着人们对自然、社会问题研究的不断深入,对分类的技术
要求越来越高,仅凭专业知识和经验已经不能满足要求,促
2) 类之间的相似性度量
第j类
用 D( i, j )表示第i类与第j类之间的距离.
① 最短距离
D(i,j)
第i类
D( p, q) min{d ( x, y) / x Cp , y Cq )
② 最长距离
D( p, q) max{d ( x, y) / x Cp , y Cq )
3)类似到什么程度两个县可以聚到同一类?成类准则问题
4)如何聚ቤተ መጻሕፍቲ ባይዱ?聚类策略与方法问题
聚类分析(ClusterAnalysis)
聚类分析(ClusterAnalysis)(一)什么是聚类聚类,将相似的事物聚集在一起,将不相似的事物划分到不同的类别的过程。
是将复杂数据简化为少数类别的一种手段。
(二)聚类的基本思想:•有大量的样本。
•假定研究的样本之间存在程度不同的相似性,可以分为几类;相同类别的样本相似度高,不同类别的样本相似度差。
•用一些数据指标来描述样本的若干属性,构成向量。
•用某种方法度量样本之间或者类别之间的相似性(或称距离),依据距离来进行分类。
•根据分类来研究各类样本的共性,找出规律。
(三)聚类的应用•商业领域-识别顾客购买模式,预测下一次购买行为,淘宝商品推荐等。
•金融领域-股票市场板块分析•安全和军事领域•o破解GPS伪随机干扰码和北斗系统民用版的展频编码密码o识别论坛马甲和僵尸粉o追溯网络谣言的源头•生物领域•o进化树构建o实验对象的分类o大规模组学数据的挖掘o临床诊断标准•机器学习•o人工智能(四)聚类的对象设有m个样本单位,每个样本测的n项指标(变量),原始资料矩阵:image.png指标的选择非常重要:必要性要求:和聚类分析的目的密切相关,并不是越多越好代表性要求:反映要分类变量的特征区分度要求:在不同研究对象类别上的值有明显的差异独立性要求:变量之间不能高度相关(儿童生长身高和体重非常相关)散布性要求:最好在值域范围内分布不太集中(五)数据标准化在各种标准量度值scale差异过大时,或数据不符合正态分布时,可能需要进行数据标准化。
(1)总和标准化。
分别求出各聚类指标所对应的数据的总和,以各指标的数据除以该指标的数据的总和。
image.png这种标准化方法所得到的的新数据满足:image.png(2)标准差标准化,即:image.png这种标准化方法得到的新数据,各指标的平均值为0,标准差为1,即有:image.pngimage.pngPS:比如说大家的身高差异(3)极大值标准差经过这种标准化所得到的新数据,各指标的极大值为1,其余各数值小于1.image.pngPS:课程难易,成绩高低。
ClusterAnalysis(聚类分析)课件

明氏距离有三种特殊形式: (1a)绝对距离(Block距离):当q=1时
dij 1 xik x jk
k 1
p
(1b)欧氏距离(Euclidean distance):当q=2时
2 d ij 2 ( xik x jk ) k 1
x
* ij
xij x j Rj
(i 1, 2,
, n; j 1,
, p)
变换后的数据,每个变量的样本均值为0,极差为1,变 换后的数据也是无量纲的量.
(4) 极差正规化变换(规格化变换)
* xij
xij min xij
1i n
Rj
(i 1, 2,
, n; j 1,
经济管理类研究生专业学位课
Multivariate Statistics Analysis
多元统计分析
第2讲 聚类分析
§2.1 聚类分析的基本思想 §2.2 相似性的度量 §2.3 类和类的特征
§2.4 系统聚类法
§2.5 非系统聚类法简介
§2.1 聚类分析的基本思想
1.什么是聚类分析?
所谓“类”就是相似元素的集合。 聚类就是根据研究对象某一方面的相似性将其归 类,使得同一类中的对象之间的相似性比与其他 类的对象的相似性更强。或者使类内对象的同质 性最大化和类间对象的异质性最大化。 根据研究对象的多个观测指标,具体地找出一些 能够度量各对象之间相似程度的统计量,然后利 用统计量将样品或指标进行归类。把相似的样
§2.2 相似性的度量
一、样本或变量的相似性程度的数量指标:
1、相似系数 性质越接近的变量或样品,它们的 相似系数越接近于1或一l,而彼此无关的变量或样品 ,它们的相似系数则越接近于0,相似的为一类,不相 似的为不同类; 2、距离 它是将每一个样品看作p维空间的一个点 ,并用某种度量方法测量点与点之间的距离,距离较 近的归为一类,距离较远的点应属于不同的类。 样品分类(Q型聚类)常以距离刻画相似性 变量分类(R型聚类)常以相似系数刻画相似性
python数据分析之聚类分析(clusteranalysis)
python数据分析之聚类分析(clusteranalysis)何为聚类分析聚类分析或聚类是对⼀组对象进⾏分组的任务,使得同⼀组(称为聚类)中的对象(在某种意义上)与其他组(聚类)中的对象更相似(在某种意义上)。
它是探索性数据挖掘的主要任务,也是统计数据分析的常⽤技术,⽤于许多领域,包括机器学习,模式识别,图像分析,信息检索,⽣物信息学,数据压缩和计算机图形学。
聚类分析本⾝不是⼀个特定的算法,⽽是要解决的⼀般任务。
它可以通过各种算法来实现,这些算法在理解群集的构成以及如何有效地找到它们⽅⾯存在显着差异。
流⾏的群集概念包括群集成员之间距离较⼩的群体,数据空间的密集区域,间隔或特定的统计分布。
因此,聚类可以表述为多⽬标优化问题。
适当的聚类算法和参数设置(包括距离函数等参数)使⽤,密度阈值或预期聚类的数量)取决于个体数据集和结果的预期⽤途。
这样的聚类分析不是⾃动任务,⽽是涉及试验和失败的知识发现或交互式多⽬标优化的迭代过程。
通常需要修改数据预处理和模型参数,直到结果达到所需的属性。
常见聚类⽅法常⽤的聚类算法分为基于划分、层次、密度、⽹格、统计学、模型等类型的算法,典型算法包括K均值(经典的聚类算法)、DBSCAN、两步聚类、BIRCH、谱聚类等。
K-means聚类算法中k-means是最常使⽤的⽅法之⼀,但是k-means要注意数据异常:数据异常值。
数据中的异常值能明显改变不同点之间的距离相识度,并且这种影响是⾮常显著的。
因此基于距离相似度的判别模式下,异常值的处理必不可少。
数据的异常量纲。
不同的维度和变量之间,如果存在数值规模或量纲的差异,那么在做距离之前需要先将变量归⼀化或标准化。
例如跳出率的数值分布区间是[0,1],订单⾦额可能是[0,10000 000],⽽订单数量则是[0,1000],如果没有归⼀化或标准化操作,那么相似度将主要受到订单⾦额的影响。
DBSCAN有异常的数据可以使⽤DBSCAN聚类⽅法进⾏处理,DBSCAN的全称是Density-Based Spatial Clustering of Applications with Noise,中⽂含义是“基于密度的带有噪声的空间聚类”。
聚类分析的思路和方法ppt课件
14
❖ 1. 绝对距离(Block距离)
p
dij 1 xik xjk k1
❖ 2. 欧氏距离(Euclidean distance)
1
dij 2 p (xikxjk)2 2
k1
精选ppt
15
❖ 3. 明考斯基距离(Minkowski)
❖ 4. 兰氏距离
1
dij
p
(xik xjk)q
k1
n
n
(xki xi )2 (xkj xj )2
k1
k1
❖ 2. 夹角余弦
n
xkixkj
Cij
k 1
1
n xk2i n xk2j 2
k 1 k 1
精选ppt
18
计数变量(Count)(离散变量)的聚类统计量
❖ 对于计数变量或离散变量,可用于度量样本 (或变量)之间的相似性或不相似性程度的 统计量主要有卡方测度(Chi-square measure) 和Phi方测度(Phi-square measure)。
应聘者 1 2 3 4 5 6 7 8 9 10 X 28 18 11 21 26 20 16 14 24 22 Y 29 23 22 23 29 23 22 23 29 27 Z 28 18 16 22 26 22 22 24 24 24
精选ppt
8
精选ppt
9
精选ppt
10
聚类分析根据一批样本的许多观测 指标,按照一定的数学公式具体地计算 一些样本或一些指标的相似程度,把相 似的样本或指标归为一类,把不相似的 归为一类。
精选ppt
19
二值(Binary)变量的聚类统计量
精选ppt
20
聚类分析(Cluster Analysis)简介

从Measure框中点击 Interval项的向下箭头, 将出现如左可选项, 从中选一即可。
3) 常用测度(选项说明): a) Euclidean distance:欧氏距离 (二阶Minkowski距离)
d ( x, y) ( xi yi ) 2
i
用途:聚类分析中用得最广泛的距离 但与各变量的量纲有关,未考虑指标间的相关性, 也未考虑各变量方差的不同
二、聚类对象
要做聚类分析,首先得按照我们聚类的目的,从对 象中提取出能表现这个目的的特征指标;然后根据亲 疏程度进行分类。 聚类分析根据分类对象的不同可分为Q型和R型两大类 Q型是对样本进行分类处理,其作用在于: 1. 能利用多个变量对样本进行分类 2. 分类结果直观,聚类谱系图能明确、清楚地表达 其数值分类结果 3. 所得结果比传统的定性分类方法更细致、全面、 合理
作用:变换后的数据最小为0,最大为1,其余在区 间[0,1]内,极差为1,无量纲。
f) Mean of 1
xij * xij x j x 1 ij 若 x j 0 i 1,2, , n j 1,2, , m 若 xj 0
d1 ( x, y) xi yi
i
用途:计算两个向量的绝对值距离
f) Minkowski:明科夫斯基距离
q dq ( x , y ) xi yi i 1/ q
用途:计算两个向量的明科夫斯基距离 f) Customized:自定义距离
q dq ( x , y) xi yi i 1/ r
b) Squared Eucidean distance:平方欧氏距离
d ( x, y) ( xi yi )2
聚类分析clusteranaly课件
其中D.2. 为欧氏距离的平方
J
n.为各类中所含样品数
聚类分析clusteranaly课件 2002年11月
聚类分析clusteranaly课件 2002年11月
(六)可变类平均法
(flexible-beta method)
K
M
L
类平均法的变型
DM 2 J(1)nnM K DK 2JnnM L DL2JDK 2L J 1;SA软 S 件预置 0.25为
选项
人为固定分类数 ANOVA表,初
读写凝聚点 始凝聚点等
聚类分析clusteranaly课件 2002年11月
(二)SAS聚类分析
样品聚类:PROC CLUSTER pseudo
RSQUARE STD METHOD=(AVE, AVERAGE, CEN,
CENTROID, COM, COMPLETE, DEN, DENSITY, EML, FLE, FLEXIBLE, MCQ, MCQUITTY, MED, MEDIAN, SIN,
聚类分析clusteranaly课件
1,通常情况1下 ~0取 之- 间的数
聚类分析clusteranaly课件 2002年11月
(五)类平均法
(average linkage between group)
K
M
L SPSS作为默认方法 ,称为 between-
groups linkage
DM2 J
nK nM
DK2J
nL nM
DL2J
冰柱的方向
聚类分析clusteranaly课件 2002年11月
Method
聚类方法
亲疏关系指标
标准化变换
聚类分析clusteranaly课件
13ClusterAnalysisI(聚类分析)精品PPT课件
Partitional
Hierarchical
8
Clustering Types
•Exclusive vs Overlapping vs Fuzzy
Cluster Analysis
Definition
•Cluster analysis: groups data objects based on information found in
the data that describes object relationships
Minimize distance
•Goal:
between points in same clusters
• Objects within a group are similar/related
• Objects in different groups are different/unrelated •Applications:
Maximize distance between points in different clusters
7
Clustering Types
•Hierarchical vs Partitional:
• Partitional: divides data points into non-overlapping subsets • Hierarchical: divides into nested clusters, organized as tree
• Group similar documents in entire collection: Improve search results
3
Applications
•Biology:
聚类分析(ClusterAnalysis)及操作过程,附加重磅资讯

聚类分析(ClusterAnalysis)及操作过程,附加重磅资讯物以类聚,人以群分,聚类分析是一种重要的多变量统计方法,但记住其实它是一种数据分析方法,不能进行统计推断的。
当然,聚类分析主要应用在市场细分等领域,我们也经常采用聚类分析技术来实现对抽样框的分层,我就不多罗嗦了。
聚类分析:顾名思义是一种分类的多元统计分析方法。
按照个体或样品(individuals, objects or subjects)的特征将它们分类,使同一类别内的个体具有尽可能高的同质性(homogeneity),而类别之间则应具有尽可能高的异质性(heterogeneity)。
我们也可以对变量进行聚类—分类,但是更常见的还是对个体分类(样本聚类——细分)。
为了得到比较合理的分类,首先要采用适当的指标来定量地描述研究对象(样本或变量,常用的是样本)之间的联系的紧密程度。
常用的指标为“距离”和“相似系数”,假定研究对象均用所谓的“点”来表示。
在聚类分析中,一般的规则是将“距离”较小的点或“相似系数”较大的点归为同一类,将“距离”较大的点或“相似系数”较小的点归为不同的类!(一般的相似系数就是相关系数了)基本概念:需要一组表示个体性质或特征的变量,称之为聚类变量。
根据个体或样本之间联系的紧密程度进行分类。
一般来说分类变量的组合都是由研究者规定的,不是像其它多元分析方法那样估计推导出来的。
聚类分析前所有个体或样本所属的类别是未知的,类别个数一般也是未知的,分析的依据就是原始数据,没有任何事先的有关类别的信息可参考。
所以:严格说来聚类分析并不是纯粹的统计技术,它不像其它多元分析法那样,需要从样本去推断总体。
聚类分析一般都涉及不到有关统计量的分布,也不需要进行显著性检验。
聚类分析更像是一种建立假设的方法,而对假设的检验还需要借助其它统计方法。
聚类方法:•聚类分析简单、直观。
•聚类分析主要应用于探索性的研究,其分析的结果可以提供多个可能的解,选择最终的解需要研究者的主观判断和后续的分析;•不管实际数据中是否真正存在不同的类别,利用聚类分析都能得到分成若干类别的解;•聚类分析的解完全依赖于研究者所选择的聚类变量,增加或删除一些变量对最终的解都可能产生实质性的影响。
cluster analysis和lpa法 -回复
cluster analysis和lpa法-回复1. 什么是聚类分析(Cluster Analysis)?聚类分析(Cluster Analysis)是一种数据分析方法,它通过将相似的对象或者样本分组在一起,形成不同的簇(cluster),来揭示数据之间的内在结构和关系。
聚类分析的目标是将数据集中的样本划分为不相交的子集,并使得同一子集内的对象之间具有高度的相似性,而不同子集之间的对象之间差异较大。
2. 聚类分析的应用领域有哪些?聚类分析在许多领域中都有广泛的应用,包括:市场研究、社会科学、生物学、医学、计算机科学等。
在市场研究领域,聚类分析可以用于消费者细分,以便进行精确的市场定位和定制的营销策略。
在社会科学领域,聚类分析可以用于对人群进行分类,以便研究他们的行为和特征。
在生物学和医学领域,聚类分析可以用于对基因或者蛋白质进行分类,以揭示它们之间的功能和关联等。
3. 怎样进行聚类分析?聚类分析的过程可以分为以下几个步骤:步骤1:选择适当的变量和数据样本。
在进行聚类分析之前,需要先确定要用于分析的变量和数据样本。
变量是用于描述事物或者对象的特征或属性,比如身高、体重、收入等。
数据样本是指要进行聚类分析的个体、对象或者样本。
步骤2:选择合适的距离度量和聚类算法。
聚类分析的核心是计算样本之间的相似性或者距离,以便对它们进行分组。
常用的相似性度量包括欧氏距离、曼哈顿距离、闵可夫斯基距离等。
聚类算法有很多种,比如层次聚类、k均值聚类、密度聚类等。
步骤3:进行聚类分析。
根据选择的相似性度量和聚类算法,对数据样本进行聚类分析。
具体方法会根据不同的算法而有所不同。
步骤4:评估和解释结果。
得到聚类结果后,需要对聚类结果进行评估和解释。
评估可以通过计算聚类的有效性指标,比如轮廓系数、Davies-Bouldin指数等。
解释聚类结果可以通过对每个簇进行特征分析和关联分析。
4. LPA法是什么?LPA法(Louvain Method)是一种用于社交网络分析的聚类算法。
- 1、下载文档前请自行甄别文档内容的完整性,平台不提供额外的编辑、内容补充、找答案等附加服务。
- 2、"仅部分预览"的文档,不可在线预览部分如存在完整性等问题,可反馈申请退款(可完整预览的文档不适用该条件!)。
- 3、如文档侵犯您的权益,请联系客服反馈,我们会尽快为您处理(人工客服工作时间:9:00-18:30)。
• Techniques with high complexity such as PCA/Regression • Instead of applying technique to a large dataset, pick a prototype for each cluster
Cluster Analysis
Definition
•Cluster analysis: groups data objects based on information found in the data that describes object relationships Minimize distance
•Capability for dealing with high dimensions
•Ability to handle constraints
•Interpretability
7
Clustering Types
•Hierarchical vs Partitional:
• Partitional: divides data points into non-overlapping subsets • Hierarchical: divides into nested clusters, organized as tree
•Goal of clustering: expressed by an objective function
•When objective function given: centroid can be computed mathematically •Sum of Squared Error:
SSE dist2 (mi , x)
•Compression:
• Vector quantization of images, audio and video data
•Nearest Neighbor:
• Instead of computing all pairwise distances, only compute distance to prototypes • Rational: If an object is far from the prototype of a cluster, it is far from all points in the cluster
•Complete vs Partial
• Complete: every object is assigned to a cluster • Partial: some objects (noise for example) may not be assigned to a cluster
9
Types of Clusters
d (a, b) (a1 b1 ) 2 (a 2 b2 ) 2 (a n bn ) 2
d (a, b) | a1 b1 | | a2 b2 | | an bn |
Suitable for points in Euclidean space
Typically as the mean of each cluster
14
Example
15
K-Means
•K: user-specified parameter
Select k points as initial centroids Repeat Form k-clusters by assigning each point to the closest centroid Recompute the centroid of each cluster Until small enough change
•Applications:
• Clustering for understanding • Clustering for utility: as a starting point for other purposes • Clustering for outlier detection
2
Applications
13
K-Means
•K: user-specified parameter
How? Need a proximity measure
Select k points as initial centroids Repeat Form k-clusters by assigning each point to the closest centroid Recompute the centroid of each cluster Until centroids do not change
i 1 xCi K
• The mean of the cluster minimized SSE
•Document Data:
T otalCohesion cosine( x, ci )
i 1 xCi
k
18
Choosing initial centroids
(1) Random initialization: Different initial points result in different final clusters Try different random runs and select best one. Might not always generate a good choice
Weaker condition for stopping: for example: until only 1% of points change clusters
16
Finding the closest centroid
•Proximity measures to quantify the notion of “closest” •Euclidean distance: •Manhattan distance:
Partitional
Hierarchical
8
ering Types
•Exclusive vs Overlapping vs Fuzzy
• Exclusive: each object belongs to one cluster • Overlapping: an object can simultaneously belong to multiple groups • Fuzzy: each object belongs to each cluster with a given weight between 0 (does not belong) and 1 (definitely belongs)
•Customer Relationships:
• Divide customers into groups according to their business patterns • Develop campaigns to target each group specifically
•Credit Card Customers:
•Well-Separated: each object is closer to every other object in its cluster than any object in another cluster
•Prototype-Based: each object is closer to the prototype (center) that defines the cluster than to the prototype of any other cluster
•Cosine similarity measure:
cos(a, b)
a b
i
i i
a b
•Jaccard measure: (for binary data)
J
f11 f10 f 01 f11
Suitable for documents and binary data
17
Recomputing the centroid
10
Types of Clusters
•Contiguity based: each object is closer to some point in its cluster than any other point outside its cluster
•Density-Based: a cluster is a dense region surrounded by a region of low density
•Medicine: one illness can have different variations for example different types of depression, spatial/temporal distribution of a disease
4
Applications
3
Applications
•Biology:
• Hierarchical clustering for living things: Kingdom: Animals, Plants, Bacteria, … Phylum: Vertebrates, Invertebrates, Arthropods, Mollusks, … Class: Vertebrates divided into Mammals, Birds, Amphibians, ... … … … Species: Tiger, Canary, … • Genetic information analysis: find groups of genes with similar functions