中国农产品贸易竞争力分析外文翻译文献
农产品销售外文翻译文献
文献信息文献标题:Marketing Agricultural Products through ICT-An acceptance study(信息通信技术在农产品营销中的应用研究)文献作者:Banu C S, Reddy N, Gondkar R R文献出处:《International Journal of Research in IT and Management》,2017, 7(2): 21-27字数统计:英文2400单词,3723字符;中文11993汉字外文文献Marketing Agricultural Products through ICT-An acceptance studyAbstract The paper is a study of the impact of various agricultural schemes introduced in the Karnataka state by the Givernment to enhance better market availability to farmers. Marketing in the state of Karnataka –Gauribidanur Taluk, Chickballapur Dist, Karnataka is considered in this study. This geogrophical region is choosen as it close to the IT hub of the country – Bangalore and is well connected by roads and various information sources. The introduction of ICT is the most obvious means to enhance the lives of farmers. However it is to be studied why the previously introduced measures are not so effective and the reasons for farmers to rollback to older methods of marketing. This paper makes an attempt to understand the various reasons and then use this as a basis to develop a new model of ICT which will be implemented and used for a more effective reform. The design and changes in the questionnaire were prompted by the need of data. The reasons for people to stop using a specific scheme gave us the insight of the problems faced. It was interesting to note that social status and the economic factors also played an important role in adopting the marketing schemes and methods.Keywords: Agricultural marketing, awareness of marketing schemes, problemsof marketing, target section for ICT, factors effecting ICT.IntroductionThe history of Indian agriculture can be traced back to Indus valley civilization era and is said to be main occupation of Southern India even before the civilization existed. The Gross Domestic Product (GDP) was contributed to the extent of 13.7% in 2013. Workforce of about 50% of the country was involved in farming and other allied sectors of agriculture. Agricultural products marketing started with the most primitive style of weekly gatherings in villages where the products needed for the succeeding week were exchanged or bought. The storage mechanism being poor, the quantity of purchase and sale was also limited and many vendors travelled with long life products like the food grains to various village gatherings also called as “Santhe” which would be a business day in a week. Each village had such gatherings on different days of the week facilitating the merchants to move from one location to another.The increase in food production and better transport facilitated transport of goods and movement of agricultural stock from one place to another leading to opening up of marketing and better marketing practices.The penetration of Information Technology (IT) in all walks of life has not spared the marketing or the rural markets and agricultural products’ marketing from rural places of agricultural production. The paper is an attempt to study the existing ICT effect and the factors that press for better facilities as ICT is not completely blended in marketing of agricultural products.ICT in Karnataka is at its peak for more than two decades now and has enriched the lives of millions with its durability, reliability, robustness, dependability, ease of use and simplified solutions/implementation to real world problems. The life of the urban people is so much filled with these solutions that they tend to suffocate without even one of them in their daily life. This is a clear indication that the solutions produced thus far are competitive enough to provide natural easiness to the process of agricultural marketing.The paper is based on the study in Gauribidanur Taluk, Chickballapur Dist,Karnataka, India. It is our serious concern to provide a viable solution to the farmers to sell the products of hard earned and toiled agricultural products to a good price in the market. We have collected data through a survey conducted to understand the problems faced by them in marketing the produced agricultural goods and the hardships in the process of marketing the agricultural products produced.The taluk is chosen because agriculture is the main activity of the taluk and is close to the silicon city of the country – Bangalore. The area has an overall cultivation area of 58,510 hectors of land out of the total geographical area of 86,726.98 hectors. This is a clear indication highlighting that 67.46% of the geographical area is cultivated and the pond area marked as 6,637.17 hectors enhances the overall land used for agricultural activities to more than 72% of the geographical land in the Gauribidanur taluk.Existing Marketing SystemThe taluk is close to Bangalore, the capital city of Karnataka and hence has better transport facility, telephone connectivity, and access to agricultural university, farmer’s call center through mobile, marketing yard and other basic amenities needed for marketing the agricultural products. Some of the prominent methods of marketing observed during the survey are as follows:Marketing YardMarketing yard is a facility provided by the state government to sell the agricultural products produced by the farmers. The government has a minimum price fixed for all the items. This price is fixed based on the demand and production as per the statistics available with the government.AgenciesThere are a number of agencies who would provide all the inputs for agricultural, these include rain data, seeds, manure, fertilizers, insecticides, relevant information at the right time and finally tools’ support if needed. These agencies provide the far mer with agreed sum and take the crop. The method though is not very popular, is picking up in areas where perishable products are grown and on a small time farming basis.Wholesale purchase at the fieldThis is the process of selling the crop at a very early stage of growth. The buyer after an inspection of the field fixes a price and buys the crop even before the crop begins to show up. This is a gamble on both the parties as the expectancy is evaluated even before the right time. The farmer gets respite and protection from fall of price that may happen. However though not a popular method, it is still in practice for vegetables and other preliminary crops.Marketing AgentsThe marketing agents fund the farmers in time of need and ensure that the farmer sells his crops to them. This is a very old practice followed from ages and though has been severely criticized by the Governments and various other organizations has still managed to survive due to the loop holes and hardships that prevail in a farmer at various stages of farming. This leads to selling of crops at a much lower price in comparison to the market price. The farmers usually take comfort in the fact that the cost of transportation, harassment in open market and a long wait for settlement are not suffered.Contract farmingThe method though not implemented in all the states still has a good amount of effect on the perishable agricultural products. This scheme is more modified by the private players to ensure that all the initial investment need for farming is provided by them and would have a price fixed well in advance so that the farmers have a ready market in hand.Major Problems Faced by the FarmersThere are a number of problems that ponder during the farming cycle. The process of farming depends on number of parameters like the climate, rain, fertility of the soil, quality of seeds, manure, fertilizers, availability of labor, transportation, availability of tools, in-time information of change in water flow in canals, quantity of water that will be made available to them, market fluctuations and so on. All these factors should come clean, good and in time for a crop to be harvested and sold at aprofit! These parameters are only an indication to the complexity faced by our farmers.Survey of the Geoerophical areaThe geographical area of Gauribidanur Taluk, Chickballapur Dist, Karnataka is divided into six hoblies (defined as a cluster of adjoining villages administered together for tax and land tenure purposes in the states of Karnataka and Andhra Pradesh, India). Each of these hoblies has an average of 39 villages in each. There is a total of 86,27 hectors of geographical land of which 37,962 hectors of land depends on rain water for agriculture (dry land), 9,942 hectors of land is wet land and 10,605 hectors of land is irrigated land. This land is distributed among 49,246 farmers of which 43,788 farmers are small & medium farmers and 5,458 farmers are big farmers. It was interesting to know that there are 137 small & medium ponds and 7,595 bore wells in this area. There is a bore well for every 11.46 hectors of total land in this taluk which should have been sufficient for all the needs. But it is the failure of these bore wells which leads to more severe consequences especially for agricultural purposes.Sample collectionThere are a number of ways in which data can be gathered to understand the behavior of the masses. Our study is an investigation about the reasons for farmers’ inability to harvest the advantages the information technology though the place geographically close to the IT hub of the country –Bangalore. The birds view suggests that not many of the farmers are doing well. There seems to be different faces of spoil sport engulfing the profits year after year and the farmer only hoping for the best nest year.This study focuses on unearthing the various difficulties of the farmers at the grass root level and in this paper we concentrate on the behavior of the farmers to adopt new technology if provided to them at an affordable and an easy to use way.Sample collection through questionnaireThe questionnaire is designed to meet the objectives of the study in seven different segments of the questionnaires. The segments can broadly be classified as personal details, type of farmer, type of land held, water source, investment for cultivation, marketing strategy adopted and the reasons for such marketing strategy. Open ended questions form the basis of understanding the behavior of the farmer with respect to marketing. The questionnaire was formulated and on beginning of the piolet study it was found that there existed many more customized reasons for the farmers not to avail facilities extended by marketing yards. This lead to restructuring of our questionnaire where in two prongs of questions were introduced like the one allowing them to express themselves in form the most difficulty faced during transactions with marketing yards and the other an open ended question of how they felt the situation on the ground could be improved based on the problems with marketing.Sampling sizeThe sample size based on the population is considered. The sampling is done based on the “type of farmer” so that the study addresses both the geographical and the economic status of the farmers. The sampling was considered at a confidence level of 90% allowing for a margin of error of 10% and the response distribution of 25%. The following tables provide a hobli wise collection of data. Total number of respondents is 699 out of which 405 farmers were small farmers and the remaining 294 farmers are big/large farmers with over five acers of land.Type of farmer: Small FarmersType of farmer: Big/Large FarmersAnalytical studyAnalytical study of the data was performed to study the awareness of new schemes launched by the government and to understand the percentage of people who would be willing to use ICT in marketing. The analysis was carried out to understand the awareness of various Government schemes and the number of people using it. This was to identify the percentage of people who actually gave a try to these new schemes and are using it. If they have discontinued using the scheme then we concentrate on collecting the reasons. If a person is aware of the schemes but is not using it, it is an indication of lack of motivation or apprehension to use new technology. The reasons for this apprehension form the basis for our development of an ICT model.Fig 1: Small / Medium farmers using various Government schemesFig 2: Large / Big farmers using various Government schemesInferenceThe analysis of collected data provides us with a broader view when it is divided into small/medium farmers and large/big farmers. It is seen that:a.The awareness about new schemes for marketing/betterment of farmers is equally known to both the categories.b.The ignorance level of various schemes of the government is very high in small/medium farmers.rge/Big farmers are making better usage of the facilities provided by the government.d.The number of small farmers who are well informed about the new schemes but are not using it are high in small farmers.e.Discontinued using marketing schemes and sale through marketing yards are almost the same in both the categories and the reasons for it was analyzed as follows: -Unaware of grading methods-Absence of common brands of crops-Middle men offering better prices-High transport cost-Lack of understanding Market trends-Lack of storage facilityf.Farmers selling through government marketing yard methods are people who understand the market and trends in marketing. These are people willing to wait for the proper price and have moderate storage facility.ConclusionThe paper attempts to understand the reasons for farmers not making good profits despite good yield. In this process the application of ICT is being tried. There are a number of new marketing models proposed but not all are implementable more due to fact that the ground realities differ from geographical region to region and from one social status to another. The further study would deal with development of a model using available ICT tools in the region along with the other facilities in place. The model hence developed would be closer to reality and would definitely be more easily implementable and would retain the farmers in using the model. Further analysis of data is also considered to understand the finer social parameters leading to implementation of ICT managed marketing.中文译文信息通信技术在农产品营销中的应用研究摘要本文研究了政府在卡纳塔克邦实施的各种农业计划对为农民提供更好的市场供应状况的影响。
中国农产品贸易的国际竞争力分析

中国农产品贸易的国际竞争力分析作者:王璐来源:《中国市场》2024年第06期摘要:農业,一直是一国发展中不可忽视的基础型产业,粮食问题关乎国家稳定,而中国已经是一个拥有人口14亿的发展型大国,早已引起亚洲乃至世界各国的广泛关注,中国近年来与世界各国的农产品贸易额也在不断增长。
在全球贸易竞争日益激烈的背景下,特别是在当今新冠肺炎疫情影响下,需加快我国农产品贸易发展,对于带动我国整体经济的发展具有重要意义。
文章主要计算了四个指标,采用定量分析法来考察中国各农产品对外优势状况,分别是各农产品的国际市场占有率、竞争力指数、显性比较优势指数和产业内贸易指数。
同时,文章以文献分析法作为研究的辅助方法。
通过上述的研究可以发现,我国劳动密集型的农产品更具竞争优势,而土地密集型农产品与技术密集型农产品则相对处于劣势。
这些有针对性的政策建议和保障措施对于充分发挥我国农产品在国际农产品市场中的竞争优势,迅速提升我国农产品的国际竞争力有较强的理论价值与现实意义。
此外,农产品国际竞争力的提升,对于加快我国农产品贸易发展,带动我国整体经济的发展同样具有重要意义。
关键词:农产品贸易;国际竞争力;基础型产业中图分类号:F304.3文献标识码:A文章编号:1005-6432(2024)06-0005-04DOI:10.13939/ki.zgsc.2024.06.0021研究背景及意义1.1研究背景近年来,中国农产品贸易经历了快速增长的过程,并逐渐在世界农产品贸易中占据重要的一席之地。
中国农产品贸易发展迅速,贸易规模也在持续扩大,在如此背景下,势必面临着无数的机遇与挑战。
此后,中国2001年正式加入WTO,我国农产品贸易开始在世界上占据重要地位,中国农产品进出口企业开始面临国际上各种新形势下的挑战,农产品作为各国民生的重要一环,势必要做出长远打算。
总体上,我国农产品出口额和进口额呈现出双增长的态势,但是“入世”后,农产品的贸易顺差呈现不断恶化趋势,贸易逆差严重。
中国农产品贸易的国际竞争力探析

毕业论文题目中国农产品贸易的国际竞争力探析英文题目 The Analysis of International Competitive Ability of theChinese Agricultural ProductTrade院系商学院专业国际经济与贸易姓名 ####班级学号 ####指导教师 ##########年五月毕业论文《选题报告》院(系):商学院摘要中国是一个农业大国,从上个世纪到2003年入世之初,农产品贸易一直保持顺差,但2004年,也就是入世的第三年,农产品贸易出现了逆差,严峻形势凸现。
因此,分析并提高我国农产品贸易的国际竞争力,是一个亟待解决的问题,具有很强的现实意义。
本文概述了入世前中国农产品贸易取得的成绩并提出当前农产品贸易面临的严峻形势,通过分析制约我国农产品国际竞争力的一系列问题来探求对策,从而提高农产品贸易的国际竞争力。
【关键词】农产品贸易竞争力要素农业产业化ABSTRACTChina is a large agricultural country. From last century to 2003, the beginning of being a member of the World Trade Organization, the agricultural product trade continuously maintains the favorable balance. But in 2004, it occurred the trade deficit and stern situation appeared. Therefore, it is a question which urgently awaits to be solved to analyze and enhance the international competitive ability of Chinese agricultural product trade. It has strong practical significance. This article summarizes the agricultural progress before entering the WTO and points out the stern situation at present. According to analyze the problems which restrict the competitive ability to seek strategies, thus, enhance the international competitive ability of Chinese agricultural product trade.【KEYWORDS】Agricultural product trade Competitive ability essential factor Agricultural industry目录引言 (1)第一章我国农产品贸易概况 (1)1.1 入世前我国农产品贸易取得的成绩 (1)1.2 入世后我国农产品贸易出现的问题 (2)第二章农产品的国际竞争力分析 (3)2.1 影响农产品竞争力的要素分析 (3)2.1.1 农产品的质量 (3)2.1.2 农产品的价格 (4)2.1.3 商业信誉 (4)2.1.4 土地资源和人力资源等生产要素条件 (4)2.1.5 政府作用 (5)2.2我国农产品国际竞争力的优势表现 (5)2.2.1低成本竞争优势 (5)2.2.2 农业资源多样性优势 (5)2.2.3 市场区位优势 (6)2.3.4 大国效应与后发优势 (6)2.3制约我国农产品国际竞争力的主要问题 (6)2.3.1农产品贸易遭遇壁垒狙击 (6)2.3.2农产品出口反倾销问题 (9)2.3.3 国内出口企业的无序竞争 (9)2.3.4农产品出口结构的不合理 (10)第三章提高我国农产品贸易的国际竞争力的对策建议 (10)3.1实施农业产业化经营 (10)3.2促进农产品出口结构的调整 (13)3.3建立农产品的“绿色通道” (14)3.3.1积极适应正当的绿色贸易壁垒 (14)3.3.2坚决抵制不正当的绿色贸易壁垒 (15)3.4 改革外贸管理体制,实现对反倾销的快速反应 (15)3.5 锻造中国农产品品牌 (16)3.6 推行农产品国内支持政策 (16)参考文献 (19)致谢.................................................... 错误!未定义书签。
英语作文-农业科学研究和试验发展行业的市场竞争力分析
英语作文-农业科学研究和试验发展行业的市场竞争力分析The agricultural science research and experimental development industry is a critical component of the global economy, contributing to food security, environmental sustainability, and economic growth. This sector is characterized by a high degree of innovation and competition, where market competitiveness is determined by several key factors.Innovation is the lifeblood of agricultural science. Research and development (R&D) in new farming techniques, crop varieties, and agricultural technologies drive the industry forward. Companies that invest heavily in R&D often gain a competitive edge by bringing new products to market faster and adapting to changes in environmental conditions and consumer preferences.Another significant aspect of market competitiveness is sustainability. With the increasing emphasis on sustainable practices, companies that develop eco-friendly solutions are likely to attract more customers and funding. This includes organic farming methods, precision agriculture, and the use of biodegradable materials.The integration of technology in agriculture, often referred to as 'AgriTech', is revolutionizing the industry. From drone technology for crop monitoring to AI-driven predictive analytics for yield optimization, technology is enhancing productivity and efficiency. Companies at the forefront of AgriTech are setting industry standards and shaping the competitive landscape.Market access and global reach are also crucial. Companies that can navigate international trade regulations and tap into emerging markets often find greater success. This requires a deep understanding of local cultures, economies, and agricultural needs.Collaboration and partnerships can be a strategic approach to increase market competitiveness. By collaborating with research institutions, governments, and other companies, businesses can share resources, knowledge, and risks associated with R&D.Lastly, the ability to respond to market demands and consumer trends is essential. Companies that are agile and customer-focused, offering products that meet the evolving needs and preferences of consumers, tend to maintain a strong market position.In conclusion, the market competitiveness of the agricultural science research and experimental development industry hinges on innovation, sustainability, technological integration, market access, collaboration, and consumer responsiveness. Companies that excel in these areas are well-positioned to lead the industry and contribute to the advancement of global agriculture. The ongoing challenge for these entities is to balance profitability with the responsibility of feeding a growing population while preserving the environment for future generations. 。
中国农产品贸易竞争力分析外文翻译文献

中国农产品贸易竞争力分析外文翻译文献(文档含英文原文和中文翻译)译文:中国主要农产品的显性比较优势及竞争力分析摘要:本文在大量数据的基础上测算了1980-2003年期间中国部分农产品的显性比较优势指数及其比较竞争力。
测算结果表明中国在可食用蔬菜、茶叶等农产品上仍然具有比较优势,但是24 年来中国农产品的显性比较优势指数呈现下降趋势。
关键词:农产品; 国际贸易; 显性比较优势(RCA); 竞争力中国的农产品出口,为增加外汇、就业机会及城乡居民收入做出了重大贡献。
2003年农产品贸易余额为2.5美元亿美元,占外贸顺差总额的9.8%。
诚(2003)报道,由农产品出口可直接和间接创造19.88个就业机会。
巴拉萨(1965)在全球层面上首次提出了中国农产品的相对竞争力可以通过显示性比较优势分析(RCA),这对意识到中国农产品的竞争地位有作用的。
显示性比较优势的公式有某些类型的测量方法可以判定一个产业的竞争力,其中RCA指数就是重要的一个,RCA的概念基于的是传统的贸易理论。
原来的RCA指数,由巴拉萨(1965),可以被定义为:RCA= (X ij /X it) / (X nj / X nt)其中x表示出口,i代表一个国家,j是一种商品,x ij表示i国用来出口商品j。
t代表一组商品和n代表一组国家。
因此,该方程分析一个国家的出口占世界出口的商品与该国的出口总额占世界出口总额。
如果i国家j商品的世界出口份额,占i国的所有产品的世界出口份额越大,RCA将越大于1,这表明一个国家在生产特定商品上有一个“显性”比较优势。
RCA是基于观察贸易模式。
RCA价值的增加意味着在一国一种商品的竞争力增加。
这种测量是很容易,它被广泛采用。
但在现实中,可以观察到的贸易格局被政策和干预扭曲,因此可能会歪曲潜在的比较优势。
这在农业部门尤其如此,政府的干预是司空见惯的,这一点由巴拉萨(1965)指出。
进口限制的程度,出口补贴和其他的保护政策可能会扭曲的显示性比较优势指数正在成为关注的问题。
中国产业的出口竞争力评估外文文献翻译最新译文
文献出处:Fetscherin M, Alon I, Johnson J P. Assessing the export competitiveness of Chinese industries[J]. Asian Business & Management, 2010, 9(3): 401-424.原文Assessing the export competitiveness of Chinese industriesMarc; Ilan; JohnsonIntroductionCompetitiveness has been assessed and studied at various levels: country (Jones, 1994; Murtha and Lenway, 1994; Enright et al , 1999), region (Uysal et al , 2000), industry (Roth and Morrison, 1992; Mitchell et al, 1993; Contractor et al, 2005; Fetscherin and Alon, 2007) and network/group (Peng et al, 2001). Country-level assessments are provided in The Global Competitiveness Report(World Economic Forum, 2008), the World Competitiveness Yearbook(Institute for Management Development, 2008) and elsewhere (Eckhard, 2006), but are often too general to be applied to a single country (Krugman, 1994). In contrast, individual company cases and studies are too specific and may not be applicable to an entire industry or to all industries from a single country (Peng et al , 2001). Analyzing competitiveness at the industry level, however, provides greater detail and a better understanding of the competitive dynamics of an industry than the country or company level, for several reasons: (i) examining the degree of specialization for a given industry can identify the comparative (dis)advantage of a national industry; (ii) industry-specific analysis permits international comparisons of an industry's degree of specialization and rate of growth; and (iii) an industry-level analysis permits comparisons with other industries.One dimension of industry competitiveness is export competitiveness. A key indicator of the extent of export competitiveness of an industry is the degree of its participation in international trade. According to data published by the World Trade Organization (WTO, 2007), the volume of world merchandise trade in 2006 grew by 8 per cent to about US$11.8 trillion, compared to world gross domestic product growth ofjust 3.5 per cent. In the past two decades, world trade has grown much faster than world GDP, suggesting that the international economy is a source of dynamism and opportunity.The theory of comparative advantage (Smith, 1776; Ricardo, 1871; Ohlin, 1933; Heckscher, 1949) underscores the importance of specialization and trade in enhancing productivity and consumer well-being. Smith (1776) argued that, under free unregulated trade, each nation should specialize in the production of the goods that it can make most efficiently, and import those goods in which it has a comparative disadvantage. In order to sustain export competitiveness in an industry, companies operating within that industry must understand the concept of revealed comparative advantage, because it allows them to understand and benchmark their position within an industry in terms of, for example, specialization, growth rate and export market share. How to model the export competitiveness of an industry has hitherto remained unresolved, however, particularly when comparing across industries within one country. The purpose of this article is to present a framework that measures, illustrates and compares the export competitiveness of an industry compared to other industries from the same country. Although this framework can also be applied to compare a single industry across various countries, cross-country comparison is not the focus of this article.China‟s globalization has been one of the most dramatic economic evelopments of recent decades (Alon and McIntyre, 2008). During the period 1979–2005, China‟s annual growth rate averaged 9.6 per cent, and its integration into the world trading system has been remarkable. Its share in world merchandise trade increased from less than 1 per cent in 1979 to 7.4 per cent in 2005. In the same year, China became the third largest trading nation after the United States and Germany (Greene et al, 2006). The expansion of China‟s international trade has been the key to its rising prominence in the world economy, and China‟s economy has a strong potential to becom e the world‟s top exporter by the beginning of the next decade (Greene et al, 2006). Currentstudies investigating and assessing Chinese export competitiveness can be grouped into two main research streams. One stream focuses on the relationship between FDI and China‟s trade performance (for example Liu et al, 2001; Khun and Xing, 2007; Xing, 2007). This is an important topic, and most of these studies use the country as the unit of analysis, although some studies use China‟s provinces. The other stream focuses on the export performance of industries (for example Greene et al, 2006; Van Assche et al, 2008). As the unit of analysis of this study is the industry, its contribution is to the second stream of research.Greene et al (2006) provide an overview of C hina‟s trade policy environment and examine China‟s impact on world prices and the deterioration of its own terms of trade. The study by Van Assche et al (2008) focused on export market share only and concluded that China continues to have a comparative advantage in low-technology activities and a comparative disadvantage in high-technology activities. Our study contributes to this literature by providing a multi-dimensional framework that allows us to measure, identify and compare which Chinese industries have a comparative advantage/disadvantage, which are growing faster or slower than the world average, and their relative importance in international trade.Measuring export competitivenessThe industry is the location where firms win or lose market share and it is the industry level that permits an examination of the dynamic nature of industrial evolution and reformation in the global business environment (Passemard and Kleiner, 2000). In the academic literature, there is still a general paucity of research on industry export competitiveness, with previous studies consisting mostly of examinations of a single domestic industry and the use of subjective measures (Makhija et al , 1997). Multiple measures have been suggested: Mandeng (1991) examined the size or increase of export market share, while others have used export competitiveness (for example Balassa, 1965; Balassa and Bauwens, 1987), price ratios (for example Durand and Giorno, 1987) and cost competitiveness (for example Siggel and Cockburn, 1995). Our conceptualization of export competitiveness attempts to combine appropriate elementsfrom previous studies and follows the recommendation of Buckley et al (1992) and Porter (1990) for the use of multiple indicators. Specifically, the framework that we present here contributes to existing literature as it not only uses multi-dimensional measures, but also allows an examination of industry export competitiveness using either an intra- or inter-country analysis. The use of multiple dimensions is superior to the use of single measures as it puts into better perspective an industry's export competitiveness (Balassa Index), dynamism (growth rate) and importance (export market share) in comparison with other industries. For example, an industry that is highly specialized but not important in terms of export market share can be compared with one that might be less specialized but has a larger world export market share. Having only one dimension might lead to a wrong assessment and conclusion. The proposed framework tries to address some of those issues.Industry specialization (IS )The concept of comparative advantage has been widely accepted as one of the foundations for international trade. A country has a pattern of specialization that is determined by what goods it exports and the volume of each good it exports, both of which change over time (Vernon, 1966; Hoskisson and Yiu, 2003; Kelleher, 2003). Krugman (1994) argues that international trade is not a zero-sum game and that the rise or fall of particular industries and nations reflects changing factor endowments and the need to shift to new areas of competitive advantage. When a nation enjoys a comparative advantage in a particular industry, it is natural that firms make investments in order to profit from this advantage, resulting in a relatively high degree of specialization within that industry (Dunning, 1993). A commonly used measure of industry specialization, based on export data, is revealed comparative advantage, often referred to as the Balassa Index ( BI ) (Balassa, 1965). Richardson and Zhang (1999) used the Balassa Index for the United States to analyze variations in patterns of trade across time, sectors and regions. They found that patterns differed by region and over time and also for different levels of aggregation of the export data.Industry growth (IG )Studies of industry competitiveness have tended to take a static rather than dynamic or longitudinal perspective, and have provided little insight into globalization trends. As we want to assess the past, present and future export competitiveness of Chinese industries, an assessment of industry trends can shed light on the manner in which Chinese industry as a whole is globalizing and at what pace (Makhija et al, 1997). Our framework includes industry export growth because, over time, a country may start to specialize more in some industries and less in others, thus changing its pattern of specialization. This also highlights the difference between dynamic and static industries. Some studies (for example Hinloopen and van Marrewijk, 2001; Alessandrini et al, 2007) measure this change of pattern of specialization by using Shorrocks‟ (1978) mobility index. However, the mobility index does not provide sufficiently detailed information, as it just ranks industries or sectors of a country according to export volume, groups them into quintiles and calculates the net change between quintiles; industries that do not have a net change between quintiles are considered to be static rather than dynamic. Other studies (for example Baldwin and Gu, 2004; Amador et al, 2006; Cooper, 2006) have used a simpler but perhaps more precise measure of changes in specialization by calculating the compound annual growth rate (CAGR) of exports in certain sectors over a certain period of time. It can be assumed that export growth in a given industry and country, particularly growth that is higher than the average global industry growth, implies a greater degree of globalization for that industry. However, this measure suffers from the weakness that domestic production and consumption, which are important for competitiveness, are omitted. Nevertheless, given the focus of our framework on export competitiveness, this weakness is not significant. Therefore, we use CAGR as a measure of growth in exports.Methodology and data collectionWe used data from the UNCTAD and the WTO for the years 2001-2005. The 5-year time period in our data allows for an analysis of changing global dynamics, especially important in the case of China. During the period of our investigation, Chinaundertook many market reforms and joined the WTO in 2001, events which changed the competitive position of its industries.We first provide a brief overview of the overall pattern of international trade for China compared to other Asian countries. Then, for the 97 Chinese industries, we calculate the degree of industry specialization and the industry growth rate in terms of exports over the selected period of time. Finally, we apply our framework to assess the degree of export competitiveness of the various industries in China.ResultsInternational trade comparisonTable 1 provides an overview of the total export value in US dollars for various countries from Asia for the years 2001-2005 as well as the corresponding CAGR.Overall, during the period 2001–2005, all countries in Table 1 registered a positive CAGR in terms of exports, ranging from 10 per cent in the case of Japan to 30 per cent in case of China (with India the next highest, with 4 per cent). In absolute terms, the highest value of exports for the main Asian countries in 2005 was recorded by China with US$762 billion, followed by Japan with US$595 billion and Hong-Kong (SAR) and South Korea with US$292 billion and US$284 billion, respectively. In the same year, India had only US$103 billion worth of exports, positioning it as a relatively weak exporting country.It also shows that countries from Asia, and specifically China, continue to gain importance in the global market as, for most of these countries, the average growth rate of exported products is higher than the average global export growth rate of 14 per cent between 2001 and 2005. The main product groups exported by China were 'Electrical, electronic equipment' (US$172.3 billion); 'Boilers, machinery, nuclear reactors' (US$149.6 billion); 'Articles of apparel, accessories not knit or crochet' (US$35 billion); 'Articles of apparel, knit and crochet' (US$30.8 billion) and 'Optical, photo, technical, medical apparatus' (US$25.4 billion).However, understanding international trade data in terms of absolute and relativevalues at the country level is necessary (Table 1), it is insufficient for assessing the export competitiveness of industries because it lacks specificity and comparative data at the industry level across multiple indicators. Our proposed framework will take these factors into account and this will be discussed in the next section.Industry export competitivenessWe calculated values for the three key variables for each of the 97 Chinese industries. Figure 2 - See PDF, provides an overview of the different industries from China and their degree of export competitiveness in terms of industry specialization, growth and size. The reference point for the Balassa Index (horizontal axis) was a threshold value of 1 (which, as mentioned before, has been used in previous studies); while for industry growth (vertical axis), the reference point was the world average export growth of 14 per cent for the period 2001-2005.One interesting result is that the majority of Chinese industries (73 per cent) are categorized as …dynamic‟, either domestic (39 per cent) or global (34 percent), both having a higher than average export growth rate (30 and 28 percent, respectively) compared to the world average of 14 per cent. For the period of the investigation, most Chinese industries grew faster than their world counterparts, not surprisingly, given the higher relative GDP growth of China in general.In China, the 'global static' category consists of light manufacturing, such as travel goods, clocks, umbrellas, textiles and commodities such as wool, silk, bird skin, and salt, earth and stone. China has established a specialization in international markets for these types of products, thus exhibiting a high Balassa Index, but the growth rate of these industries lags behind the world average.Conclusions and Future ResearchThe purpose of this study was to present a novel framework that allows us to measure, illustrate and compare the export competitiveness of industries. The framework is innovative as it takes into account multiple measures: (i) the degree of industry specialization, (ii) the industry export growth rate and (iii) the export marketshare. Using these variables, this model provides a basis for intra-country comparisons of industries of various competitive postures. It could also be used for inter-country comparisons of one industry among countries (not shown in this article). The use of multiple variables in the framework provides more meaningful information than the single variable analyses which previous studies have generally used (for example Van Assche et al, 2008). The use of multiple measures, such as specialization, growth rate and export market share of an industry, allows us to put into perspective the competitiveness, dynamism and importance of one industry compared to others. Our framework also allows for a comparative analysis of sub-industries or product groups depending on the data set usedThe proposed framework has been applied to China, a leading emerging economy and one of the largest trading nations in the world. Most of China‟s industries (73 per cent) are dynamic, showing above-average export growth rates. Many reasons account for this rapid growth, including market liberalization, falling trade barriers and a favorable exchange rate. Our results show that most Chinese industries have increased their specialization over time, which is in line with various OECD studies (for example Greene et al, 2006). However, our study further reveals t hat less than half of these …dynamic‟ industries are globally competitive, according to the Balassa Index. China therefore still has a long way to go in fortifying its position as a leader in world exports across a spectrum of various industries.Two important relationships are confirmed by our study. First, there is a positive and significant correlation between degree of specialization and relative market share, and, secondly, there is no significant correlation between degree of specialization and export growth rate. In other words, industry specialization may affect the relative market share of Chinese exports, but not their rate of growth. Overall, 46 per cent of Chinese industries are categorized as …global‟ in our framework, with a world export market share of between 19 and 24 percent. This finding indicates that these industries are not only strong global players, but are also influencing the international competitive landscape. Over 70 per cent of those industries are also …dynamic‟, withexports growing on average at about 28 per cent annually, compared to the remaining 30 per cent, which are …static‟ and growing at 11 per cent on average over the period 2001–2005. This result further suggests that the more an industry is specialized, the higher its world market share in terms of exports.译文中国产业的出口竞争力评估马克;伊兰;约翰逊引言专家学者们对竞争力已经进行了多方面的研究:有国家层次的竞争力评估(琼斯,1994;恩莱特等,1999),有地区层次竞争力的评估(索尔等,2000)、也有对行业竞争力的评估(罗斯和莫里森,1992;米切尔等,1993;菲斯坦因和艾伦,2007)等。
农产品出口竞争力研究英语

农产品出口竞争力研究英语The global agricultural trade landscape has undergone significant transformations in recent years, driven by evolving consumer preferences, technological advancements, and shifting economic dynamics. In this context, the competitiveness of agricultural product exports has become a crucial factor in determining the success and sustainability of nations' agricultural sectors. This essay delves into the multifaceted aspects of research on the competitiveness of agricultural product exports, exploring the key determinants, challenges, and strategies for enhancing export performance.One of the primary factors influencing the competitiveness of agricultural product exports is the production efficiency and cost structure of the exporting country. Nations with advanced agricultural technologies, efficient farming practices, and effective supply chain management can often offer their products at more competitive prices in the global market. This may involve investments in modern irrigation systems, precision farming techniques, and post-harvest processing and storage facilities. Additionally, the availability of arable land, favorable climaticconditions, and access to skilled labor can contribute to enhanced productivity and lower production costs.Another crucial aspect of export competitiveness is product quality and differentiation. Consumers in international markets increasingly demand high-quality, safe, and sustainable agricultural products. Countries that can consistently deliver products that meet or exceed these expectations can often command premium prices and maintain a competitive edge. This may involve implementing rigorous quality control measures, adopting international food safety standards, and promoting the unique characteristics or certifications of their agricultural goods.The ability to adapt to changing consumer preferences and market trends is also a significant determinant of export competitiveness. Successful exporting nations closely monitor evolving consumer demands, such as the growing preference for organic, locally sourced, or environmentally-friendly agricultural products. By aligning their production and marketing strategies with these trends, countries can capitalize on emerging market opportunities and maintain a competitive position.Effective trade policies and market access agreements play a crucial role in shaping the competitiveness of agricultural product exports. Governments can implement supportive policies, such as exportpromotion programs, trade agreements that reduce tariff and non-tariff barriers, and targeted investments in infrastructure and logistics. These measures can help domestic producers gain better access to foreign markets, reduce transaction costs, and enhance the overall competitiveness of their agricultural exports.Furthermore, the ability to diversify export markets and products can contribute to the resilience and competitiveness of a country's agricultural exports. By not relying on a single dominant market or product, nations can mitigate the risks associated with market fluctuations, trade disruptions, or changes in consumer preferences. This diversification strategy can involve exploring new geographical markets, developing complementary agricultural products, or expanding the range of value-added or processed goods.In addition to these factors, research on the competitiveness of agricultural product exports must also consider the impact of external forces, such as global economic conditions, exchange rate fluctuations, and the evolving landscape of international trade agreements and regulations. Monitoring and adapting to these dynamic factors can help countries maintain a competitive edge in the global agricultural marketplace.To enhance the competitiveness of agricultural product exports, countries can implement a comprehensive strategy that addressesthe multifaceted aspects of production, quality, market adaptation, trade policies, and diversification. This may involve fostering public-private partnerships, investing in research and development, promoting sustainable agricultural practices, and strengthening the capacity of domestic producers and exporters.By continuously monitoring and addressing the key determinants of export competitiveness, countries can position their agricultural sectors for long-term success in the global market. This research-driven approach can help nations capitalize on emerging opportunities, mitigate risks, and maintain a sustainable and competitive advantage in the dynamic landscape of agricultural trade.。
农产品贸易壁垒外文文献翻译

文献信息标题: Green Barriers and China's Agricultural Product Export: Is There Any Relationship?作者: Kuppusamy, Mudiarasan; Gharleghi, Behrooz出版物名称: Asian Social Science卷: 10期: 16页: 34-41页数: 8出版年份: 2014出版日期: Aug 2014年份: 2014出版商: Canadian Center of Science and Education出版物地点: Toronto出版物国家/地区: Canada出版物主题: Social Sciences: Comprehensive Works原文Green Barriers and China's Agricultural Product Export: Is There AnyRelationship?Kuppusamy, Mudiarasan; Gharleghi, BehroozAbstractAs an agricultural country, the export of China's agricultural products are often suffered the restrictions from the green barriers. The positive green barriers canregulate the agricultural production in China, and promote the agricultural development and international trade; on the other hand, the negative green barriers would increase the cost of trade, trade friction, and prevent the development of international trade. So the research of influence of green barriers on China's agricultural products is very realistic. According to the influence of green barriers on China's agricultural exports, the corresponding countermeasures can be made to deal with the green barriers and improvement of China's competitiveness in the international competition. This study examines the causes, influences and methods of green barriers on China's agricultural products export based on the questionnaires of 200 staffs of agricultural trade companies in Xi'an of Shaanxi province in China. To address this issue, Partial Least Square method is applied and the empirical result shows that there is a positive and significant effect from causes, influences, and methods towards the China's agricultural products export.Keywords: green barriers, agricultural product, export, China1. IntroductionThe green barrier is one of the most frequent measures in developed countries from the 1990's (Feng, 2007). As an agricultural country, the export of China's agricultural products are often suffered the restrictions from the green barriers. The positive green barriers can regulate the agricultural production in China, and promote the agricultural development and international trade; on the other hand, the negative green barriers would increase the cost of trading, even cause trade friction, and prevent the development of international trade.Green barriers are also called environmental barriers and green protectionism, which is a new trade barrier since 1990s. Buyers will impose green barriers on sellers' export when the buyers want to protect their own limited resources, human, animal, plant health and ecological environment in the modern international trade. Green barriers take place when importers have strict environmental protection laws and regulations to manage their own environment and technology standards.The green barriers are becoming not only the serious challenges faced by China's agricultural export products but also the biggest obstacle for China's agricultural exports (Yu, 2010). To deal with the green barriers, it is important to identify the causes of green barriers on China's agricultural products export, which are from bothimport and export countries. The limited agricultural technology of China is one significant cause. Due to the limited agricultural technology of China, the agricultural export products can't meet the high environmental standards mentioned in "green barriers" of the import countries. In the process of export, the quarantine system, import standards and complex inspection process that are regulated by the import countries are also the main causes. The complex process built by import countries is the biggest obstacle for China's agricultural products export.As agricultural trade plays a key role in China's foreign trade, how to break restrictions of green barriers impacted on agricultural export products and how to effectively regulate China's agricultural production with the correct use of the green barriers are the big problems for China's future development (Wang &Liu, 2007). By changing the negative influence and making use of the positive in influences of green barriers in China, the sustainable development of China's agricultural trade can also be promoted in the future.In most previous researches, the authors focus on the negative influences of green barriers. But the green barriers also have positive influences on the agricultural products export. The most significant issue for further exploration in the study is to effectively take use of the positive influences to improve China's agricultural products export. This study will make an empirical analysis of the positive influences of green barriers with questionnaires. Therefore, examining the relationship between green barriers and China's agricultural products export is the general objective of this study. More specifically the examination of the relationship between the causes, influences, and methods of green barriers with China's agricultural product export is taken into account in this paper.The focus of geographic location is Xi'an of Shaanxi province in China. One of the core industries in Xi'an is agricultural products export, and recently the agricultural products export in Xi'an is developing increasingly. So Xi'an is chosen to be the geographic location for this research. The unit of analysis focus of the study is 200 staffs of agricultural trade companies in Xi'an of Shaanxi province in China. The agricultural trade companies have comprehensive views about the green barriers. The research methods in this paper are questionnaire survey. SPSS and PLS will be used to analyze the data collecting from the survey.The organization of this paper is as follow: section 2 reviews the literature, section 3describes the methods used, section 4 presents the empirical results and section 5 concludes.2. Literature ReviewGreen barriers are also called environment barriers, and green protectionism. Because the importers of products want to protect their own limited resources, human, animal, plant health and ecological environment in the modern international trade, through the formulation and implementation, they issued strict environmental protection laws and regulations to achieve environment protection and technology standards. The green barriers prevent foreign products enter into the domestic markets. Their aim is to protect domestic products and one of the new type non-tariff barriers (Feng, 2007). 2.1 Causes of Green BarriersAfter China entered into WTO, most of the developed countries set up green restrictions to the export products of China. This leads the dramatic dropping of China's commodities, especially the agricultural products. The domestic and foreign experts have done a lot of research about the green barriers in China.As mentioned by Zhu, Guo and Lan (2008), the environmental standards of developed countries are generally much higher than those of the developing countries. Especially a few developed countries make different standards for the imported products and domestic products, which makes the products of developing countries have more difficult to enter into the developed markets.The comparative advantage of price in developing countries is an indirect cause of green barriers (Ren, 2010). Developing countries are often rich in resources, especially China. The rich natural resources make the lower price of exported products from developing countries. With the comparative advantage of price, the developing and developed countries will have an enormous trade surplus. The developed countries due to the protection of their domestic market, will work out a policy with strict technical standards (Zhao, 2004).2.2 Influence of Green BarriersSong (2009) analyses the formation and the new characteristics of green barriers in the global economic crisis. The author also points out that the new developing dynamic of each country's green barriers in the global economic crisis, and mainly from the laws and regulations puts forward the measures of green barriers for China.ChenXu (2009), points out that green barriers has the duality, on the one hand, they are used by some developed countries as a limit or hinder of foreign products or services to enter into the international market and the developed countries, and have certain "legitimate" status; On the other hand, they objectively protect the global natural environment, original resources and human health. In view of this situation, on the one hand China can strengthen the propaganda of education and legislation to solve the green barriers in the international trade (Huang, 2007); On the other hand, China should reasonably use the green barriers in the international trade to improve the agricultural products' quality, and improve the technology innovation of China's agricultural products.At present many areas of China have make corresponding measures for the green barriers. For example, the implementation of "Definite List System" in Japan has affected the exports of eel and tea in Jiang Xi province. In order to solve the problem, the Inspection and Quarantine Institutions of Jiang Xi province add a technology group to deal with the "Definite List System" and the new European Food Hygiene Regulations. This technology group specially analyses the influence and measures for Jiang Xi export commodities to deal with "Definite List System", and report information to the relevant departments and enterprises, give consultation, and solve problems (Green, 2012). To some degree, the technology group has made great progress. The Chinese products that are most seriously affected by "green barriers" in global trade include agricultural products, textiles and clothing, leather products, electronic products and so on (Chen, 2009).The WTO accession has significantly lowered the tariff level to an average of 3.8% in developed countries and 14% for developing countries (Huang, 2007). The drop in tariff should presumably increase the market share of Chinese tea in importing countries, but that unfortunately did not happen. China's tea export, with its major markets in EU and Japan, has been substantially affected by the increasingly stringent pesticide residue control standards promulgated by China's trading partners (Zheng, 2003).2.3 Methods to Deal with Green BarriersYu (2010) mentioned that many global experts have done quite a lot research about the negative influence of the green barriers on China agricultural products export and made deeply detailed analysis of the countermeasures, but proposed less ideas on thepositive impact. Only through analyzing both the positive and negative influences, China can put forward the corresponding measures for the green barriers in the light of these influences.Yin (2009) argued that developing green industries and enhancing China's international image are the necessary methods to deal with green barriers. At present, China's trade dependence has been higher than the U.S., Japan, India and Brazil. If China only focuses on improving openness, due to the deteriorating terms of trade, it will result in an outflow of resources. Therefore China should improve the quality of trade and optimize trade structure, which make China's products achieve the environmental standards and improve the quality of export products. There are three important factors.As a developing country, China has little environmental and security standards and even no standards for majority products. So an effective measurement to deal with green barriers is to improve the domestic environmental and safety standards. Efforts to integrate the standards of international and developed country are still a beginning and continue to advance slowly. The Measures on the Management of Environmental Standards, promulgated by SEPA, reflect a growing awareness and recognition of international or developed-country environmental standards (Seffens, 2011). It provides that the Chinese monitoring organization may use current international standards and standards in developed countries when verbalizing new environmental standards.Therefore, based on the literature above quoted and also the objectives of the paper, following hypotheses will be tested:Hypothesis 1: There is a significant relationship between the causes of green barriers and China's agricultural product export.Hypothesis 2: The impact of green barriers influencers toward China's agricultural product export is significant.Hypothesis 3: The impact of effective solutions of green barriers toward China's agricultural product export is significant.2.4 Research ModelIn this paper, the relationship between green barriers and China's agricultural products export (dependent variable) is investigated. In order to vividly show the green barriersin China, this study will identify three aspects of green barriers, which are causes, influences and methods (independent variables). The three aspects are also the three steps to analyse green barriers in China. To analyse green barriers, the causes are the first step. Then identifying the influences is the second step. The last step is the suitable methods based on causes and influences.3. Research MethodQuantitative research is chosen to be the main approach of this research. The data collection of this study will use survey, which is a non-experimental method. In survey research, respondents answer questions through interviews or questionnaires. In order to ensure the reliability of the survey, it is important that the questions are made appropriately. This research will use cross-sectional surveys. Cross-sectional surveys are used to gather information on a population at a single point in time. The sampling technique used in this paper is Cluster Sampling. This research focuses on the agricultural trade companies in China. All the samples are collected in Xi'an of Shaanxi province since the core industry of Xi'an is agriculture.译文绿色贸易壁垒与中国的农产品出口:他们的关系是什么?摘要:作为一个农业大国,中国农业产品的出口往往受到绿色壁垒的限制。
绿色贸易壁垒对我国农产品出口的影响及研究对策外文文献原文及译文

中 北 大 学 信 息 商 务 学 院毕业论文外文文献原文及译文学号:系 别:专指导教师:2012年 6 月08090444X17 经济与管理系 国际经济与贸易绿色贸易壁垒及其对中国对外贸易的影响萨金特莱斯大学经济管理学院摘要:近年来,绿色消费在许多发达国家中已成为一个主要的消费趋势,这些发达国家开始采取严格的措施来限制一些国家的产品进入其国内市场。
这些国家主要是其产品低于发达国家制定的环境保护标准。
关键词:绿色壁垒;农产品;贸易近年来,绿色消费在许多发达国家中已成为一个主要的消费趋势,这些发达国家开始采取严格的措施来限制一些国家的农产品进入其国内市场。
这些国家主要是其产品低于发达国家制定的环境保护标准。
这些规定对发展中国家的出口有许多不利的影响,这些规定一般被称为“绿色贸易壁垒”。
绿色贸易壁垒的有关规定与世界贸易组织的有关协议相一致。
绿色贸易壁垒的定义是:以保护整个人类赖以生存的自然环境和保护人体健康为的名义,制定一系列的规则条款,以达到发达国家保护其国内市场和国内产品的目的。
1、分析绿色贸易壁垒的形成原因首先,生态环境的恶化是绿色贸易壁垒形成的主要原因。
随着工业和技术的发展,社会经济飞速发展,人民生活水平得到显著改善。
但与此同时,经济的发展也以生态环境的破坏为代价。
环境问题已经引起社会公众的注意而且国际社会也已开始制定法律来保护生态环境。
在1972年6月,联合国发表的斯德哥尔摩宣言,强调了保护环境的重要性。
从那时起,越来越多的人开始关注的环境问题。
环境的概念应景影响人类生活的各个层面,在社会公众的压力下发达国家开始制定严格的措施来保护生态环境。
这也就逐渐形成了国际贸易的绿色壁垒。
其次,国与国之间在技术水平,环境标准和对外直接投资等方面的差异导致了绿色贸易壁垒的形成。
正如我们所知,发达国家在社会整体水平和科学技术水平上远远领先发展中国家。
即使他们作出非常严格的环境保护标准,其国内的产品可以达到严格的环境保护标准的要求,而这些标准则可能对来自发展中国家的产品构成障碍。
中国主要农产品的显性比较优势及竞争力分析_英文_
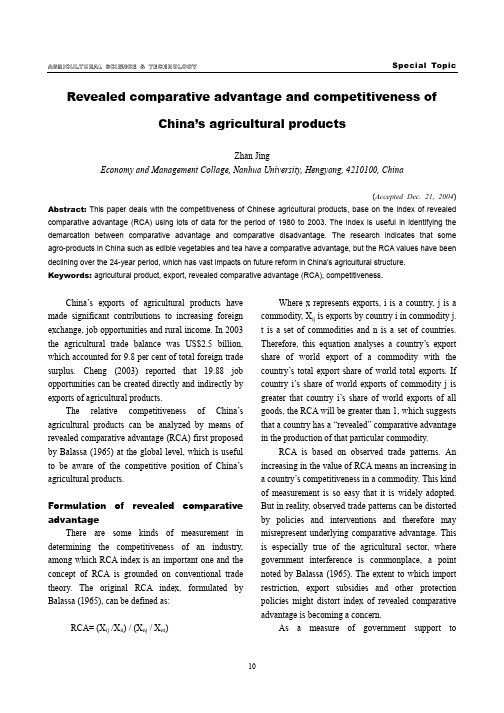
Revealed comparative advantage and competitiveness ofChina’s agricultural productsZhan JingEconomy and Management Collage, Nanhua University, Hengyang, 4210100, China(Accepted Dec. 21, 2004) Abstract: This paper deals with the competitiveness of Chinese agricultural products, base on the index of revealed comparative advantage (RCA) using lots of data for the period of 1980 to 2003. The index is useful in identifying the demarcation between comparative advantage and comparative disadvantage. The research indicates that some agro-products in China such as edible vegetables and tea have a comparative advantage, but the RCA values have been declining over the 24-year period, which has vast impacts on future reform in China’s agricultural structure.Keywords: agricultural product, export, revealed comparative advantage (RCA), competitiveness.China’s exports of agricultural products have made significant contributions to increasing foreign exchange, job opportunities and rural income. In 2003 the agricultural trade balance was US$2.5 billion, which accounted for 9.8 per cent of total foreign trade surplus. Cheng (2003) reported that 19.88 job opportunities can be created directly and indirectly by exports of agricultural products.The relative competitiveness of China’s agricultural products can be analyzed by means of revealed comparative advantage (RCA) first proposed by Balassa (1965) at the global level, which is useful to be aware of the competitive position of China’s agricultural products.Formulation of revealed comparative advantageThere are some kinds of measurement in determining the competitiveness of an industry, among which RCA index is an important one and the concept of RCA is grounded on conventional trade theory. The original RCA index, formulated by Balassa (1965), can be defined as:RCA= (X ij /X it) / (X nj / X nt)Where x represents exports, i is a country, j is a commodity, X ij is exports by country i in commodity j. t is a set of commodities and n is a set of countries. Therefore, this equation analyses a country’s export share of world export of a commodity with the country’s total export share of world total exports. If country i’s share of world exports of commodity j is greater that country i’s share of world exports of all goods, the RCA will be greater than 1, which suggests that a country has a “revealed” comparative advantage in the production of that particular commodity.RCA is based on observed trade patterns. An increasing in the value of RCA means an increasing in a country’s competitiveness in a commodity. This kind of measurement is so easy that it is widely adopted. But in reality, observed trade patterns can be distorted by policies and interventions and therefore may misrepresent underlying comparative advantage. This is especially true of the agricultural sector, where government interference is commonplace, a point noted by Balassa (1965). The extent to which import restriction, export subsidies and other protection policies might distort index of revealed comparative advantage is becoming a concern.As a measure of government support toagriculture, the OECD (1999) estimates total support equivalents (TSEs) by country and industry. It is natural to think that the higher the TSEs is, the more support the industry gets. It is evident that the level of support was highest in the UN, then in the USA, and lowest in China. As a commitment to the World Trade Organization, government intervention in all member countries is expected to diminish. Nevertheless, agriculture is unlikely to be completely free of government intervention for some considerate time.The welfare gains result from agricultural trade liberalization, e.g. Tyers and Anderson (1988 and 1992) and OECD (1995), which implies that agricultural policies must have an impact on trade flow (i.e. volume) and possibly on trade patterns (i.e. direction ). The free is superior to various degree of trade restriction. V ollrath and V o (1990) found export performance to be more affected by economic fundamentals than by government intervention, whereas the reverse applied to import behavior.V ollrath (1989) noted that government intervention and competitiveness tend to be inversely related. This suggests that those product groups revealing a comparative advantage could become even more competitive if markets were to become more open. The RCA still provide a useful guide to underlying comparative and competitive advantage, although the index is not beyond doubt.Revealed comparative advantage in main agricultural products of China The RCA index as defined above is computed for China’s agricultural products for export over the period 1980-2003, with those of the rest of the world as contrast. The data are supplied by National Bureau of Statistics (NBS) of China. The all samples cover 17 product categories and trade flows over the 24-year period. Annual RCA index is calculated at the four-digit level, but reported at the three-digit level.Table 1 The RCA indexes of main agro-products of China, 1980-2003.year 1980 1985 1990 1995 1997 1999 2001 2003 Cereals 0.699 1.104 0.414 0.080 0.150 0.558 0.586 0.739 Wheat 0.000 0.000 0.001 0.002 0.000 0.000 0.002 0.000 Bean 0.337 1.584 1.052 0.265 0.133 0.117 0.144 0.107 Rice 5.417 2.376 0.639 0.148 0.357 0.651 1.530 1.369 Oilseeds 0.015 0.226 0.026 0.006 0.013 0.000 0.000 0.003 Tobacco 0.929 0.302 0.356 0.414 0.342 0.522 0.618 0.401 Cotton 0.019 2.041 0.965 0.094 0.031 0.011 0.887 0.662 Meat 1.335 1.327 1.200 1.302 1.320 0.639 0.460 0.459 Beef 0.133 0.251 0.450 0.173 0.176 0.145 0.076 0.066 Chicken 1.589 0.329 0.664 1.484 1.627 1.346 1.343 1.383 Pork 3.098 3.669 3.091 3.326 2.948 0.727 0.133 0.109 Porkproducts 4.605 3.924 2.556 1.968 1.478 1.231 1.429 1.294 Fruits 2.475 1.476 1.217 1.040 0.940 0.876 0.847 0.804 Vegetables 0.994 0.930 0.615 0.741 0.785 0.666 0.569 0.530 Vegetableproducts0.000 0.000 0.111 1.233 1.496 1.233 1.695 2.852Tea 6.424 4.541 4.199 2.528 2.453 2.145 2.299 1.925 Mushroom 0.096 0.078 0.325 3.991 3.743 3.346 2.903 2.637 Source: Authors’ calculations based on NBS’s data at four-digit levelThe following two fields of RCA value can be defined: high for RCA>2, low for 2>RCA>1. In addition, if the RCA value<1, it denotes that a country has revealed comparative disadvantage (RCD) in a particular commodity. Thus, several observations can be made from Table 1.1. In 1980 China had the revealed comparative advantage for 7 of 17 product groups. They were tea,rice, pork products, pork, fruits, chicken and meat. For the others China had the revealed comparative disadvantage. In 2003 tea, rice, chicken and pork products maintained their competitive position. Moreover, vegetable products and mushroom gained competitiveness.2. Among all product groups with revealed comparative advantage, five of them ware high, two of them low in 1980; while in 2003 only two of them ware high.3. Chicken, pork and tea had maintained their competitiveness during the whole 24-year period.4. Meat, pork and fruits were the product groups with a RCA in 1980 but a RCD in 2003. However, vegetable products and mushroom were the product categories with a RCD in 1980 but with a RCA in 2003. These two categories were all processed products.5. During the 24-year period, four agricultural product groups in China experienced an improvement: mushroom and vegetable products improved from “RCD” to “RCA”; the RCA value of cotton and cereals also had increased, although they were still in RCD position.6. For most kinds of agricultural products, China’s competitiveness had weakened. The RCA value of 12 of 17 product groups experienced a fall.Conclusion and prospectsThe above findings suggest that most of the agricultural products with revealed comparative advantage in China are labor-intensive products. The rise in vegetable products is encouraging partly because of China’s low cost labor in agriculture.The decreasing level of comparative advantage index means that the competitiveness in China’s agricultural products is weakening which would have resulted from the following reasons. Externally, many economic integrated organizations have been established and merged the economies of their member states, thus forming a solid regional trading blockage. Internally, the quality of many agricultural products can’t come up to international standards; most agro enterprises are weak in technological innovation. What’s more, industrial association and intermediary agencies have not brought their potentialities into full play in advancing the agricultural processing industry and maintaining market order.To strengthen China’s agricultural products competitiveness, further efforts should be made to push agricultural industrialization forward by developing leading agricultural enterprises. The domestic major agricultural producers are individual farmer households. Agricultural enterprises are only in the initial stage of development.When farmers are organized by enterprises and /or co-operative organizations to carry out industrialized management on the basis of the household responsibility contract system, they will get more comprehensive services, and agricultural resources will be better allocated.In the meantime, the enterprises should be highly conscious of market demands and make full use of information technology and modern sales methods to keep abreast with the latest supply and demand trends in the market and to better organize their marketing.These enterprises should also pump more funds into R&D programs, technology spreading and brand marketing. Standardized management should be applied in producing, processing, packaging, transporting, selling and hygienic quarantining of agricultural products to meet the requirement of international quality certification.In addition, the government of China should consider establishing special schools for farmers’ education and training to raise their qualities and competitiveness, boosting the long-term growth of agriculture and rural economy.Accordingly, industrialization can advance the strategic adjustment of the country’s agricultural structure with reference to the RCA of agriculturalproducts and will sharpen the competitive edge of the industry in the international market.ReferencesBalassa, B. 1965. Trade liberalization and revealed comparative advantage. The Manchester School, 33: 99-123C. M. Shuai. 2002. An analysis on costs and benefits of agricultural sectors in China. Research of Agricultural Modernization. 4: 11-16Dimelis, S, and K. Gatsios. 1995. Trade with Central and Eastern Europe: The Case of Greece. In: R. Faini and R. Portes (eds.), EU Trade with Eastern Europe: Adjustment and Opportunities (London:CEPR)Gual, J. and C. Martin. 1995. Trade and Foreign Investment with Central and Eastern Europe: Its Impacts on Spain. In: R. Faini and R. Portes (eds.), EU Trade with Eastern Europe: Adjustment and Opportunities (London:CEPR)G. Q. Cheng. 2003. An estimate of Chinese agricultural producsts. Journal of Management World. 1: 1519.L. Xue. 2003. Impacts on agriculture after China’s entryto WTO. Journal of Management World. 3:26-30 Peterson, E. W.F. and S. R. K. Valluru. 2000. Agricultural comparative advantage and government policy interventions. Journal of Agricultural Economics. 51: 371-387Tyers, R. and K. Anderson. 1988. Liberalizing OECD agricultural policies in the Uruguay Round: effects on trade and welfare. Journal of Agricultural Economics. 39: 197-216.Tyers, R. and K. Anderson. 1992. Disarray in World Food Markets: A Quantitative Assessment (Cambridge: New York)Vollrath, T. L. 1989. Competitiveness and protection in world agriculture. Agricultural Information Bulletin No.567, Economic Research Service (US Department of Agriculture, Washington DC.)Vollrath, T. L. 1991. A Theoretical Evaluation of Altenative Trade Intensity Measure of Revealed ComparativeVollrath, T. L. and De Huu Vo. 1990. Agricultural Competitiveness in an Independent World, In: Agriculture and Government in an Independent World, International Association of Agricultural Economists Occasional Paper No. 5 (Aldershot: Gower).W. Q. Pan. 2000. Countermeasures to increasing international competitiveness in Chinese agriculture. Research on Economy and Management. 4:8-12.中国主要农产品的显性比较优势及竞争力分析詹 晶(南华大学经济管理学院,湖南 衡阳,421001)摘要:本文在大量数据的基础上测算了1980-2003年期间中国部分农产品的显性比较优势指数及其比较竞争力。
中国产品出口竞争力外文翻译文献
中国产品出口竞争力外文翻译文献(文档含英文原文和中文翻译)China’s Competitive Performance: A Threat To East Asian Manufactured Exports?There is growing concern in Southeast and East Asia about the competitive threat posed by China’s burgeoning exports, exacerbated by its accession to the WTO. The threat is not confined to labor-intensive products but spans the whole technological and skill range. At the same time, China is rapidly raising its imports from the region, and it is not clear whether its burgeoning exports will damag e its neighbors. We examine the dimensions of China’s competitive threat in the 1990s, benchmarking competitive performance by technology and market, and finds that market share losses are so far mainly in low technology products, with Japan being the most vulnerable market. We analyze market share changes and highlight product groups that are directly or indirectly exposed to a competitive threat. We examine intra-regional trade and find that China and its neighbors are raising high technology exports in tandem: the nature of theinternational production systems involved lead to complementarily rather than confrontation. China is thus acting as an engine of export growth for its neighbors in terms of direct trade. However, this will change as China moves up the value chain and takes on the activities that have driven East Asian export growth.IntroductionConcern about China’s competitive threat is widespread (in developed economies like US as well as developing ones like Mexico), but is strongest in East an d Southeast Asia. China’s burgeoning exports–backed by cheap and productive labor, a large stock of technical manpower, huge and diversified industrial sector, attractiveness to foreign investors, pragmatic use of industrial policy, and, now, freer access to world markets under WTO – lead to apocalyptic visions of export losses.2 China is most threatening to neighbors that rely primarily on low wages for their export advantage. However, as it upgrades its export structure, the more advanced economies (Singapore, Hong Kong, Korea and Taiwan) also fear for their competitiveness. The current hollowing out of their low-end manufacturing may soon extend to complex production, design, development and related services. Domestic markets are also threatened by China, but so far most attention seems to have been on exports.Offsetting this threat are the promise of the giant Chinese market (WTO accession is only one of several initiatives to liberalize regional trade) and the potential for collaboration with it in exporting to the rest of the world. Trade within the East Asian region is flourishing. China is a growing importer from the region of natural resources that it does not possess. It is also raisin g imports of manufactured products. Its advanced neighbors are selling it sophisticated consumer and producer goods, and using it as a base for processing exports to third countries. The multinational companies (MNCs) that now account for around half of Chinese exports (and far more of its high technology exports, UNCTAD,2002) are incorporating China into production systems spanning the region (‘fragmentation’ and‘segmentation’ are used to describe this phenomenon3), so promoting considerable intra-firm trade with other regional bases. China’s own enterprises are like ly to specialize with respect to regional counterparts and so raise intra-industry trade in differentiated products. Perhapsworryingly for competitors in other regions, such integration can lead China to complement regional competitiveness as a whole, rather than substitute its exports for those of its neighbors.It is difficult to assess, however, whether complementarily between China and the regional economies will fully offset its competitive threat. The dynamics and complexity of the interactions make it impossible to quantify the outcome, even to predict broad directions. The basic issue is whether China’s higher wage neighbors can move into more advanced export activities or functions rapidly enough to permit continued export expansion. If they can, they can continue with export-led growth. If they cannot, they will suffer export deceleration and/or a shift in specialization towards primary products or slow-growing segments of manufactured exports. The outcome, in other words, will depend on the relative growth of technological and other capabilities in Chinese and regional enterprises, with the former having such advantages as lower wages, larger scale economies, greater industrial depth, pools of technical skill and a proactive government. However, as East Asian countries differ widely in these factors (Lall, 2001), they face different kinds and intensity of competitive threat. The nature of the threat depends, moreover, on the organization of the production and marketing system: independent local firms are likely to compete more directly than affiliates of the same MNC spread over different countries in an integrated system.This paper does not try to measure China’s competitive threat or its effects, but to map relative export performance in the 1990s by technology and destination and so assess where the threat appears most intense. We focus on major East Asian exporters5 and on exports to third markets, but we also analyses complementarities between China and East Asia, particularly in electronics, th e region’s largest export and the one where MNC systems dominate. As the 1990s predate China’s WTO accession, we do not go into the implications of this accession; however, the analysis of competitive trends has implications for the evolution of future trade by the region as liberalization grows.Background on Chinese export performanceChinese manufactured exports grew by 16.9% per annum over 1990-2000, compared to 6.4% for the world, 12.0% for all developing countries and 10.3%for the rest of East Asia. Its share of world manufactured exports rose from 1.7% to 4.4% over the decade and continued rising rapidly. 6 Thus, by 2002 China accounted for 5.1% of world merchandise exports; it was then the fifth largest exporter (after USA, Germany, Japan and France, and ahead of the UK). China’s share of developing world manufactured exports rose from 11% to 20% over the 1990s and of the East Asian region excluding China from 18.7% to 41.8%. Its export gains (see below) spanned the entire technological spectrum, and were most dynamic in the complex end of the range, in products that have recently driven the export growth of the rest of East Asia.This export surge is likely to be sustained for some time to come. China has ‘spare capacity’ in that its per capita exports are still relatively small,7 wages are much lower than in its main neighbors and it has large reserves of cheap and disciplined labor (though drawing it into exports will involve the cost of building links with the interior).8 More importantly, its advantages are not static (confined to cheap labor); they are upgrading rapidly. China is investing heavily in technology and advanced skills; for example, the share of the relevant age group enrolled in tertiary education rose from 9 percent in 1997 to 13 percent in 2000 (UNESCO website). It is exploiting the scale offered by its giant market to become competitive in capital-intensive activities beyond the reach of many neighbors. It is using its diverse industrial base to deepen local content. It is drawing in export-oriented FDI at an impressive rate, using its market attractions to induce investors to raise local R&D and linkages; till now it has been able to impose performance requirements of the type soon to be banned under WTO rules.WTO accession may con strain China’s ability to use industrial policy (Nolan, 2001) but it will also open up new export opportunities, particularly in textiles and garments.9 Accession may also enhance its domestic competitiveness: it will improve the investment climate for FDI, make imported inputs cheaper (for enterprises outside special export regimes) and induce faster restructuring of domestic enterprises (Ianchovichinaetal, 2003, and Lemoyne and Unal-Kesenci, 2002).Market share changes in major developed country marketsWe analyze market shares of China and its neighbors in three major markets: Japan, the US and West Europe, according to technology categories (Annex Table 1). In terms of value, the most important market for China in 2000 is the US ($49 billion), followed by Japan ($36 billion) and West Europe ($38 billion). However, the rest of the world is almost as large a destination for Chinese exports as these together ($106 billion in 2000) and within this the rest of East Asia is larger than any major OECD market by itself ($74.6 billion).The competitive position of each country can be analyzed in terms of the market share in 1990 and 2000 and the change over the decade. The annex table shows the following:Total manufactured exports: China does best in Japan, followed at some distance by the US. In common with most neighbors, its market share gain is weakest in West Europe. Korea loses market shares in both Japan and US, while Taiwan loses only in the US. Hong Kong’s loses market shares in all markets, particularly in the US and Japan. Like Taiwan, Singapore loses only in the US. The new Tigers gain share in all markets. With the exception of Indonesia, with a rather tepid performance, the others all gain most share in the Japanese market. Resource based products: China again leads the region in terms of market share increases, with a pattern similar to that for total exports. However, Korea has a large gain in Japan, in contrast to Taiwan and Singapore, which lose shares; the latter two also lose in the US. Thailand is a big gainer in Japan while Indonesia and the Philippines lose out in the US. Low technology products: China’s massive market share gains are again concentrated in Japan. The four mature Tigers generally suffer losses in market share, but Singapore sees an increase in Japanese market share. The best overall performance among the new Tigers is by Indonesia.Medium technology products: While the Chinese pattern of success recurs, the new Tigers make significant gains in Japan and Korea incurs a significant loss. Taiwan and Singapore suffer losses in the US market. High technology exports: Taiwan again diverges from Korea in its performance in Japan, the former showing the second largest gain in the group (after China) and the latter the largest loss. In the US market, the situation is reversed, with Singapore joiningTaiwan in losing market shares. Among the new Tigers, Malaysia and the Philippines are the big gainers in Japan, but the other two also benefit significantly. The Philippines is the second largest winner in the group in the US market. In sum, China’s main market share gains in the developed world are concentrated in Japan (though the US accounts for a larger dollar value of export growth). This is also true of its neighbors with the exceptions of Korea and Indonesia (Hong Kong was an all-round loser). To the extent that we can interpret market share changes to be causally related to China’s export surge, it would seem that the mature Tigers suffered the most from Chinese competition. The largest such loss is in low technology products, which is to be expected, but this not take into account the growth of LT exports by Korea and Taiwan to China. The relatively low gains by the lower-income new Tigers in LT may also reflect the impact of Chinese competition – without the offsetting increase in exports of intermediates to China.ConclusionsChina’s export surge has raised grave concerns in the region. While some of the apocalyptic predictions may have been overdone, it is certainly possible that rapid export growth by such a massive entrant will adversely affects export growth in its neighbors. As this analysis shows,however, the outcome is complex. For a start, the rise in China’s exports is matched by that in its imports – within the region its import growth outpaces its export growth. With appropriate restructuring of activities to match new competitive needs, its neighbors should be able to maintain high rates of export growth.There are two main drivers of regional exports to China. The first is to meet its burgeoning demand for imported products: primary products and resource-based manufactures that it cannot produce capital goods and intermediates for domestic -oriented production and more sophisticated consumer goods than its industry can currently provide. The second is to meet the needs of its export industries. This has two components: ‘processing’ activity in special economic zones that use imported inputs for export activities, and other exporters that also need imports. Processing activity is increasingly organized as part of integrated production systems, particularly its high technology segments, thoughsome domestic oriented industries are also being plugged into this system as they realize scale and learning economies and become globally competitive. Both drivers are likely to continue into the foreseeable future, though their composition will change as Chinese and regional capabilities develop.中国竞争力的表现:是对东亚制成品出口的威胁吗?越来越多的东南亚和东亚地区关注中国出口的迅速增长所带来的竞争威胁,中国加入WTO后,更加剧了这种情况。
关于我国农产品的国际竞争力分析研究

关于我国农产品的国际竞争力分析研究第一篇:关于我国农产品的国际竞争力分析研究我国农产品的国际竞争力分析摘要:随着世界经济的不断发展,全球呈现贸易自由化趋势,这使得国际竞争力本就不是很高的中国农产品在国际贸易中受到了前所未有的挑战,WTO所提倡的自由贸易政策会对我国国民经济产生巨大的影响,甚至在短期内会对我国部分弱势行业形成巨大的冲击,农业一直是人们所关心的重点,考虑到我国各种主要农产品国际竞争力上的巨大差距,本文大致介绍了我国的农产品出口现状,我国农产品出口的竞争优势与不足,以及解决的对策。
关键词:农产品出口;竞争优势;竞争劣势;解决方案;随着我国加WTO,经济全球化得进程加快,农业国际化不断推进并将成为经济全球化得重要组成部分,农业国际化竞争给全世界各国农业带来了深刻而广泛得影响,推动者全球农业快速向前发展。
尤其是21世纪的经济是全球化的经济,国际分工将空前发展,区域集团化和全球一体化都将成为世界经济发展的主要特征。
中国农业所处的国际环境发生了重大的变化:农产品贸易要按照国际通用规则运行。
由此,我国农产品的发展进入了一个新的阶段。
在国际竞争力日益激烈的背景下,抓住机遇,迎接挑战促进发展,不断提高我国农产品的国际竞争力,变得尤为重要。
一、我国农产品现状(一)我国农产品的竞争优势一是中国农业劳动力严重过剩,为出口农产品的生产、加工和服务能够在较长的时期内提供低成本、充裕的劳动力供给。
二是生产要素。
一个国家的生产要素状况直接影响到其对外经贸活动地位。
从土地、资本和劳动力三大要素状况比较,中国劳动力资源具有明显优势,而人均资本和土地拥有量,美国、欧洲和日本分别占有绝对优势。
三是我国出口商品产量占优势。
我国是世界上第一大渔业生产国,1997年我国的水产品产量达到3602万吨,总产量占世界首位,人均水产品占有量为29.87千克,比世界平均水平高54%。
2000年我国肉类产量达6270万吨,成为世界上最大的肉类生产国。
我国农产品对外贸易竞争力分析

Competitive Analysis on Agricultural Products
Trade in our Country at the Present Time 作者: 李丽[1]
作者机构: [1]北京工商大学经济学院,北京100037
出版物刊名: 哈尔滨商业大学学报:社会科学版
页码: 35-37页
主题词: 农产品;对外贸易;农业;竞争力分析
摘要:农业国际化和全球农业一体化经营是世界经济全球化和集团化的组成部分。
当今世界各国农业都是在这一总体趋势下发展的,我国作为一个以农业为第一产业的农业大国也概莫能外。
如何建立和推动外向型农业的发展,以此促进农业国际化经营是中国面临的一个重大课题和挑战,而怎样提高我国农产品的国际竞争力问题也就显得尤为紧迫。
农产品贸易技术性贸易壁垒外文文献翻译2010年3000多字
文献出处:Weyerbrock, S., & Xia, T. (2010). Technical trade barriers in US/Europe agricultural trade. Agribusiness, 16(2), 235-251.Technical Trade Barriers in US/EuropeAgricultural TradeSilvia Weyerbrock and Tian XiaABSTRACTTechnical barriers strongly affect US/European agricultural and food trade. A 1996 USDA survey identifies 57 questionable European regulations affecting US agricultural exports with an estimated trade impact of $899.55 million. This article identifies European and US technical regulations that impede bilateral trade. The article provides a background for case studies and draws conclusions regarding the future role of technical barriers. We expect that technical barriers in US/Europe trade will proliferate in the future because of changes in trade rules, higher demand for food safety and various food quality attributes, and EU membership of Eastern European countries. © 2000 John Wiley & Sons, Inc.1. INTRODUCTIONTechnical trade barriers strongly impede trade in agricultural and food products. In this article we use the term technical barriers to trade (TBTs) to refer to obstacles arising from both sanitary and phytosanitary (SPS) and technical regulations and measures. Although such regulations and measures are frequently motivated by domestic health and safety concerns, they may be used as non-transparent, difficult-to-challenge trade barriers.A1996 US Department of Agriculture (USDA) survey finds that the US may be losing $4.97 billion exports because of questionable regulations (Thornsbury, Roberts, DeRemer, & Orden, 1997; Roberts & DeRemer, 1997). In future, technical barriers are likely to increase because of increased demand for food and environmental safety.Moreover, owing to the recent strengthening of World Trade Organization (WTO) rules on traditional barriers such as tariffs and quantitative non-tariff barriers, countries may substitute traditional by technical barriers (Roberts & DeRemer, 1997; Hooker and Caswell, 1995; Wang and Caswell, 1997). Finally, new technologies and new products will lead to changes in regulatory policies, which may create trade frictions.This article identifies European and US SPS and technical barriers that impede bilateral food trade. We concentrate on US/Europe agricultural trade for four reasons:1. Europe is an important trading partner of the US. In 1997, 20% of US exports were directed to Europe, while 20.6% of US imports originated from Europe (USDA/ FAS, 1998).2. A 1996 USDA survey, put together by Roberts and DeRemer, identifies 57 questionable European regulations affecting US agricultural exports with an estimated trade impact of $899.55 million. Six regulations account for 61.8% of the trade impact (Thornsbury et al., 1997; Roberts & DeRemer, 1997). For confidentiality reasons, Roberts and DeRemer could not identify specific issues. Our article identifies recent and current specific European and US technical barriers that affect bilateral food trade.3. Given their high income, US and European consumers demand a high level of food and environmental safety. Moreover, the strong US and European farmers’ lobbies demand support. The efforts of both groups will contribute to stricter SPS and technical regulations and the growing incidence of technical trade barriers.4. Europe and the US are pioneers in developing new technologies and products and, therefore, new regulations.The literature on technical barriers is in its infancy. This is due to the lack of a commonly agreed upon definition and comprehensive data on the incidence of these measures. Moreover, estimating the trade and welfare effects of technical barriers is difficult. Roberts and DeRemer (1997) describe several challenges. One challenge is to estimate compliance costs based on often merely qualitative information. Estimating thebenefits of technical barriers is also difficult, because they may be based on preventing low-probability, highconsequence events. Finally, because of the bilateral nature of many technical barriers, economic models need to incorporate product differentiation and market power.Most empirical studies of technical barriers at this point consist of case studies that provide evidence of specific disputes (Ndayisenga & Kinsey, 1994). Other researchers or policymakers have put a figure on selected technical barriers by approximating the amount of trade affected by the regulation. The objective of this article is to pinpoint questionable technical barriers in US/Europe trade. The survey provides a background for case studies and permits conclusions regarding the future role of technical barriers in US/Europe trade. In Section 2, we provide an overview of agricultural trade between the US and Europe. Section 3 defines technical trade barriers and surveys WTO rules applying to such measures. In Section 4, we first report results of the 1996 USDA survey on technical trade barriers (Thornsbury et al., in press; Roberts & DeRemer, 1997). We then identify specific problem areas. Section 5 includes our conclusion.2. TRADEThis section surveys bilateral US/Europe trade and trade within Europe of agricultural and food products. For this purpose, we divide most of Europe into three blocs: the European Union (EU), Eastern Europe (EE), and the former Soviet Union (FSU)/Russia.2.1. US/Europe TradeIn 1997, the US agricultural exports to European countries amounted to $11.3 billion and US imports from Europe to $7.4 billion (Table 1). Twenty percent of US exports were directed to Europe, whereas 21.4% of US imports originated from Europe (USDA/FAS, 1998).US/EU. Within Europe, the EU is the largest export market for US food products. In 1997, 77.9% of US exports to Europe went to the EU. Major US exports are soybeans, feed and fodder, and tree nuts. The EU is also the dominant European source of US agricultural and food imports. The US imported $7 billion agriculturalgoods from the EU—mainly snack food, vegetable oils, and cheese (USDA/FAS, 1998). US/Russia. The second most important trading partner of the US in Europe, the FSU, received $1.5 billion of US agricultural exports (Table 1). More than 80% of these exports (mainly poultry meat, red meat, and wheat) go to Russia. US poultry exports are highly dependent on the Russian market. Russia’s imports from the US vastly exceeded its exports to the US of $29 million. The US imports Russian dairy products, hides and skins, and essential oils (USDA/FAS, 1998). US/Eastern Europe. The agricultural and food trade between the US and Eastern Europe has been volatile in recent years. In 1997, the US merely exported $282 million US agricultural goods to Eastern European countries. Wheat, poultry meat, and coarse grains dominate US exports. The US import shares for Poland, Romania, Hungary, and the Czech Republic are 5.7%, 8.0%, 4.4%, and 0.6%, respectively (USDA/FAS, 1997a, 1997b, 1997c, 1997e). The US import shares are small because of unfavorable import access conditions. Compared to the US, members of the EU, Central European Free TradeArea (CEFTA), and European Free Trade Area (EFTA), and many developing countries have preferential access to Eastern European markets. For example, Romanian tariffs on EU cheese imports are 18.8% whereas tariffs on US cheese imports amount to 240.0% (USDA/FAS, 1997e). Nevertheless, the US Foreign Agricultural Service (FAS) considers Poland, the most populouscountry in Eastern Europe, as a top 10 emerging market worldwide (USDA/FAS, 1997c). About 2.86% or $212.1 million of US agricultural and food imports came from Eastern Europe. Eastern Europe’s most important export goods are fruit and vegetable juice, tobacco, and red meat (USDA/FAS, 1998).2.2. Intra-Europe TradeEU/Eastern Europe. The EU dominates Eastern Europe’s agricultural trad e. In 1995, EU exports to Eastern Europe totaled $4.4 billion—15.5 times the value of the US exports to Eastern Europe (Table 1). In most Eastern European countries imports from the EU exceed 40% of total imports. The top three EU exports were meat, fruits and vegetables, and coffee, tea, and spices. During the same time period, EU imports from Eastern Europe were $3.3 billion. Top EU imports from Eastern Europe were meat, fruits and vegetables, and live animals (OECD, 1996).The EU’s large market s hare in Eastern Europe is due to geographic proximity and the Europe Agreements. The Europe Agreements establish bilateral preferential trade between the EU and various Eastern European and Baltic countries. Overall, the agreements appear to have promoted EU exports to Eastern Europe rather than Eastern European exports to the EU. Only Bulgaria and Hungary now have an agricultural trade surplus with the EU (Bojenc, 1996). The EU has granted limited access to Eastern European food products for which it has a surplus—often products of interest to Eastern Europe (Tangermann, 1994). Because of administrative problems, Eastern European countries have not used many preferential agreements (Frohberg & Hartmann, 1996). EU/Russia. Russia is also a major trading partner of the EU. Russia imported $4.6 billion agricultural and food products from the EU and exported $812 million products to the EU in 1995. The major EU exports to Russia are beverages, meat, and coffee, tea, and spices; top EU imports from Russia are fish, hides and skins, and oil seeds (Table 1).In 1996, the EU accounted for 15.0% of total Russian agricultural imports while the USrepresented 9.9% of Russian imports (OECD, 1996). The EU and Russia signed a partnership and cooperation agreement in 1994. There is no evidence that US exporters face discriminatory tariffs compared to their Western European competitors.3. WHAT IS A TECHNICAL BARRIER TO TRADE?US/Europe agricultural trade is strongly affected by technical barriers to trade. As mentioned above there is no commonly agreed upon definition of technical barriers to trade. Researchers have proposed definitions based on intent, economic impact, and instruments used.In this survey we follow a definition proposed by Thornsbury et al. (1997) and Roberts and DeRemer (1997). They define technical barriers as “in ternationally divergent regulations and standards governing the sale of products in national markets which have as their prima facie objective the correction of market inefficiencies stemming from externalities associated with the production, distribution, and consumption of these p roducts.” This definition includes standards of identity, measure, and quality, and SPS, global commons,and packaging measures. It, however, excludes incentive measures such as subsidies and taxes (Roberts & DeRemer, 1997). In addition to the technical regulations, Roberts and DeRemer stress that demonstrating conformity to a foreign regulation can be a technical barrier.Technical trade barriers differ from many other trade barriers because they can be eco nomically efficient. Moreover, SPS regulations are not “most favored nation,” i.e., different trading partners may need to comply with different conditions for gaining access to, an importing country’s market. Consequently, designing effective rules for such measures is difficult (Roberts & DeRemer, 1997). To stem the proliferation of technical barriers in recent years, GATT members negotiated Agreements on Sanitary and Phytosanitary Measures (SPS) and Technical Barriers to Trade (TBT) as part of the Uruguay Round Agreement (World Trade Organization, 1994a, 1994b). These agreements considerably strengthen international rules on the use of technical barriers. All WTO members are now subject to these agreements. The agreements specify that SPS and technical measures should not be used as disguised trade barriers or in an arbitrary or discriminatory manner. They should only be applied to the extent necessary and must be based on scientific principles and on risk assessment (World Trade Organization, 1994a, 1994b). Countries are encouraged to use international standards developed by international scientific organizations such as the Codex Alimentarius Commission, the International Office of Epizootics (OIE), and the International Plant Protection Convention (IPPC). Countries, however, may maintain standards that are stricter than international standards, if they are justified by science or by a nondiscriminatory lower level of risk. In the absence of harmonization, WTO members are encouraged to apply the principle of equiv alency and negotiate, for example, veterinary equivalence agreements. Equivalency implies that the same level of health protection can be achieved by different methods (World Trade Organization, 1994b). Regulations and standards should be considered equivalent if one country can show that its measures—albeit different—meet the other country’s legitimate objectives. Equivalence agreements allow products to be traded with minimal customschecks. If each side recognizes the other party’s plant insp ection procedures, visits of in spectors to foreign production and processing facilities become unnecessary. Another novel feature of the SPS agreement, the principle of regionalization, suggests that disease or pest free status should be considered on the regional rather than the country level. If a country can demonstrate that an area of its country is, and is likely to remain, disease or pest-free than importing countries should not place restrictions on goods from this area. Finally, countries cannot easily reject a panel decision based on the newly established dispute settlement mechanism any longer.4. TECHNICAL REGULATIONS IN US/EUROPE TRADE4.1. OverviewIn a survey of FAS attaches, USDA regulatory agencies, and US trade organizations, Roberts and DeRemer (1997) identify questionable regulations in the EU, Eastern Europe, and the FSU that affected US agricultural exports in June 1996. Such barriers include market access, market expansion, and market retention barriers. Market access barriers include import bans; market expansion barriers limit but do not preclude US exports; and market retention barriers are measures under consideration, which may adversely affect US exports, if enacted. Roberts and DeRemer asked the attaches and trade organizations to estimate the trade impact of such barriers in terms of the value of current US export revenue that is threatened and could be potentially lost. Please note that the survey only covers questionable measures affecting US exports to countries covered by overseas FAS offices. It does neither cover questionable European measures affecting countries other than the US nor US measures affecting European imports.The survey finds 57 questionable measures in Europe with an estimated trade impact on US agricultural and food exports of $899.55 million. Six of these questionable measures have an estimated individual trade impact of more than $50 million each (Table 2). Together these barriers account for 61.8% of the totalestimated trade impact. Survey respondents identified only 12 other measures worldwide with such a large impact. Roberts and DeRemer (1997) find 23 regulations in US/Europe trade with an estimated trade impact of more than $5 million.Considering the product coverage of questionable measures, the survey shows that many barriers affecting US exports to Europe affect trade in animal products (Table 2). The estimated trade impact of all barriers on animal products is $477.3 million and accounts for 53% of estimated total trade impacts of all European barriers. By comparison, in all other countries of the world only $107.3 million exports of animal products are subjected to questionable barriers. Moreover, exports of processed foods and grains exceeding $100 million respectively are affected by questionable barriers (Roberts & DeRemer, 1997).The USDA survey is the first comprehensive survey of technical trade barriers affecting US agricultural exports. It has shed the light on TBTs by detailing how pervasive such barriers are. However, its results should be interpreted carefully for several reasons.1. The experts consulted are likely to be biased: the goal of FAS attaches and trade organizations is to promote US agricultural exports. The regulatory agencies used to vet their estimates are likely to take the US stance on issues such as the scientific justification and conformity of various measures with the new trade agreements.2. Some experts may have been aware that the US may consider initiating WTO dispute settlement procedures based on their reports.3. The survey covers market retention barriers (i.e., barriers under consideration) whose adoption and implementation are uncertain.4. Finally, for confidentiality reasons, Roberts and DeRemer (1997) could not identify specific issues. Lacking this information, it is difficult to assess the reliability of various estimates.Source: Thornsbury et al. (1997); Roberts and DeRemer (1997).4.2. Specific MeasuresThis section identifies recent and current specific technical barriers in US/Europe agricultural trade. In addition to studying European barriers on US imports, we also explore US barriers on European imports. We identify sectors in which such barriers are prevalent and attempt to approximate their trade impact.Our survey does not provide systematic evidence on technical barriers in US/Europe trade. This requires a detailed assessment of many standards and regulations and a comprehensive survey of exporters in many countries. Instead, our study is based on information found in research papers, newspapers, and industry and agency publications such as Agra-Europe, documents of the US Foreign Agricultural Service, and a European Commission Report on US Barriersto Trade and Investment. We omit questionable measures not mentioned in such publications and, possibly, many TBTs related to conformity assessment and enforcement.In this article, we attempt to approximate the trade impact of various TBTs. Unfortunate ly, with the exception of Peterson, Paggi, and Henry’s paper (1998) on the US/EU hormone dispute, quantitative economic studies on the price and welfare effects of TBTs in US/Euope trade are unavailable at this point. Occasionally, news and other sources identify the trade impact of threatened or existing barriers. If no data are available, we approximate the maximum possible impact of, for example, an import ban, by giving information on the trade volume before the ban. Note, however, that this estimate is likely to be an overstatement. Import bans are frequently linked to specific production and processing techniques. If a US processing firm follows EU guidelines, it may still be able to do business with the EU.TABLE 3. The Approximate Trade Impact of Selected US/Europe Technical BarriersA ine and olive oil exports correspond to total exports in the quoted year. Not all wine and olive oil may be affected by the ban.B igure applies to total red meat rather than pork.C astern Europe’s poultry meat imports amounted to $160 million in 1997.Finally, please note that we do not attempt to merely pinpoint Roberts and DeRemer’s list of European technical barriers affecting US agricultural exports. The USDAsurvey constitutes a snapshot of questionable foreign technical barriers facing US agricultural exports in June 1996. Second-guessing measures identified by the USDA survey would have led us to neglect important current issues such as the EU’s threatened ban on specified risk materials. Other issues may have been resolved in the meantime. In what follows, we discuss technical barriers by region. Table 3 summarizes such barriers.美国/欧洲农产品贸易的技术性贸易壁垒摘要技术性贸易壁垒严重影响了美国/欧洲的农产品贸易。
中国农产品贸易竞争力分析外文翻译文献
中国农产品贸易竞争力分析外文翻译文献(文档含英文原文和中文翻译)译文:中国主要农产品的显性比较优势及竞争力分析摘要:本文在大量数据的基础上测算了1980-2003年期间中国部分农产品的显性比较优势指数及其比较竞争力。
测算结果表明中国在可食用蔬菜、茶叶等农产品上仍然具有比较优势,但是24 年来中国农产品的显性比较优势指数呈现下降趋势。
关键词:农产品; 国际贸易; 显性比较优势(RCA); 竞争力中国的农产品出口,为增加外汇、就业机会及城乡居民收入做出了重大贡献。
2003年农产品贸易余额为2.5美元亿美元,占外贸顺差总额的9.8%。
诚(2003)报道,由农产品出口可直接和间接创造19.88个就业机会。
巴拉萨(1965)在全球层面上首次提出了中国农产品的相对竞争力可以通过显示性比较优势分析(RCA),这对意识到中国农产品的竞争地位有作用的。
显示性比较优势的公式有某些类型的测量方法可以判定一个产业的竞争力,其中RCA指数就是重要的一个,RCA的概念基于的是传统的贸易理论。
原来的RCA指数,由巴拉萨(1965),可以被定义为:RCA= (X ij /X it) / (X nj / X nt)其中x表示出口,i代表一个国家,j是一种商品,x ij表示i国用来出口商品j。
t代表一组商品和n代表一组国家。
因此,该方程分析一个国家的出口占世界出口的商品与该国的出口总额占世界出口总额。
如果i国家j商品的世界出口份额,占i国的所有产品的世界出口份额越大,RCA将越大于1,这表明一个国家在生产特定商品上有一个“显性”比较优势。
RCA是基于观察贸易模式。
RCA价值的增加意味着在一国一种商品的竞争力增加。
这种测量是很容易,它被广泛采用。
但在现实中,可以观察到的贸易格局被政策和干预扭曲,因此可能会歪曲潜在的比较优势。
这在农业部门尤其如此,政府的干预是司空见惯的,这一点由巴拉萨(1965)指出。
进口限制的程度,出口补贴和其他的保护政策可能会扭曲的显示性比较优势指数正在成为关注的问题。
浅谈我国农产品贸易的影响因素及国际竞争力的提升
浅谈我国农产品贸易的影响因素及国际竞争力的提升叶沙千【期刊名称】《物流工程与管理》【年(卷),期】2013(000)011【摘要】With the deepening of economic globalization, especially after China's accession to the WTO, China's agricultural trade was more serious challenge. To this end, the text on the current economic environment, how to enhance the international competitiveness of China's agricultural products were studied, with an aim to enhance the international competitiveness of agricultural products and other aspects of trying to do something useful.%随着经济全球化的不断深入,尤其是我国加入世贸组织以后,我国农产品贸易受到的挑战越来越严重。
为此,文中就当前经济环境下,如何提升我国农产品的国际竞争力进行了研究探讨,旨在为提升农产品国际竞争力等方面做些有益的研究尝试。
【总页数】2页(P35-36)【作者】叶沙千【作者单位】我国热带农业科学院试验场,海南儋州 571737【正文语种】中文【中图分类】F250【相关文献】1.浅谈我国文化贸易的国际竞争力及影响因素 [J], 赵璇;2.浅谈我国国际竞争力的提升 [J], 马素珍3.我国制造业国际竞争力影响因素及提升建议 [J], 黄荣华;姚天强4.浅谈如何提升我国教育服务贸易的国际竞争力 [J], 白颖5.浅谈我国农产品贸易的影响因素及国际竞争力的提升 [J], 叶沙千因版权原因,仅展示原文概要,查看原文内容请购买。
农产品贸易绿色壁垒中英文对照外文翻译文献

农产品贸易绿色壁垒中英文对照外文翻译文献(文档含英文原文和中文翻译)The green barrier to free tradeC. P. ChandrasekharJayati GhoshAs the March 31 deadline for completing the "modalities" stage of the proposed new round of negotiations on global agricultural trade nears, hopes of an agreement are increasingly waning. In this edition of Macroscan, C. P. Chandrasekhar and Jayati Ghosh examine the factors and the players constraining the realisation of such an agreement.AT THE END of the latest round of meetings of the agricultural negotiations committee of the WTO, the optimism that negotiators would meet the March 31 deadline for working out numerical targets, formulas and other "modalities" through which countries can frame their liberalisation commitments in a new full-fledged round of trade negotiations has almost disappeared. That target was important for two reasons.First, it is now becoming clear, that even more than was true during the Uruguay Round, forging an agreement in the agricultural area is bound to prove extremely difficult.Progress in the agricultural negotiations was key to persuading the unconvinced that a new `Doha Round' of tradenegotiations is useful and feasible.Second, the Doha declaration made agricultural negotiations one part of a `single undertaking' to be completed by January 1, 2005. That is, in a take `all-or-nothing' scheme, countries had to arrive at, and be bound by, agreements in all areas in which negotiations were to be initiated in the new round. This means that if agreement is not worked out with regard to agriculture, there would be no change in the multilateral trade regime governing industry, services or related areas and no progress in new areas, such as competition policy, foreign investment and public procurement, all of which are crucial to the economic agenda of the developed countries.The factors making agriculture the sticking point on this occasion are numerous. As in the last Round, there is little agreement among the developed countries themselves on the appropriate shape of the global agricultural trade regime.There are substantial differences in the agenda of the US, the EU and the developed countries within the Cairns group of agricultural exporters. When the rich and the powerful disagree, a global consensus is not easy to come by.But that is not all. Even if an agreement is stitched up between the rich nations, through manoeuvres such as the BlairHouse accord, getting the rest of the world to go along would be more difficult this time.This is because the outcomes in the agricultural trade area since the implementation of the Uruguay Round (UR) Agreement on Agriculture (AoA) began have fallen far short of expectations. In the course of Round, advocates of the UR regime had promised global production adjustments that would increase the value of world agricultural trade and an increase in developing country share of such trade.As Chart 1 shows, global production volumes continued to rise after 1994 when the implementation of the Uruguay Round began, with signs of tapering off only in 2000 and 2001. As is widely known, this increase in production occurred in the developed countries as well.Not surprisingly, therefore, the volume of world trade continued to rise as well after 1994 (Chart 2). The real shift occurred in agricultural prices which, after some buoyancy between 1993 and 1995, have declined thereafter, and particularly sharply after 1997. It is this decline in unit values that resulted in a situation where the value of world trade stagnated and then declined after 1995, when the implementation of the Uruguay Round began.As Table 1 shows, there was a sharp fall in the rate of growth of global agricultural trade between the second half of the 1980s and the 1990s, with the decline in growth in the 1990s being due to the particularly poor performance during the 1998 to 2001 period.Price declines and stagnation in agricultural trade values in the wake of the UR Agreement on Agriculture were accompanied and partly influenced by the persisting regionalisation of world agricultural trade.The foci of such regionalisation were Western Europe and Asia, with 32 and 11 per cent of global agricultural trade being intra-Western European and intra-Asian trade respectively (Chart 3). What is noteworthy, however, is that agricultural exports accounted for a much higher share of both merchandise and primary products trade in North America and Western Europe (besides Latin America and Africa) than it did for Asia.Thus, despite being the developed regions of the world, agricultural production and exports were important influences on the economic performance of North America and Western Europe.It is, therefore, not surprising that Europe is keen on maintaining its agricultural sector through protection, while the US is keenon expanding its role in world agricultural markets by subsidising its own farmers and forcing other countries to open up their markets. The problem is that the US has been more successful in prising open developing country markets than the large EU market.Thus, out of $104 billion worth of exports from North America in 2001, $34 billion went to Asia and $15 billion to Latin America, whereas exports to Europe amounted to $14 billion.The Cairns group of exporting countries (Argentina, Australia, Bolivia, Brazil, Canada, Chile, Colombia, Costa Rica, Guatemala, Indonesia, Malaysia, New Zealand, Paraguay, the Philippines, South Africa, Thailand and Uruguay), for some of whom at least agricultural exports are extremely important, want world market to be freed of protection as well as the surpluses that result from huge domestic support in the US and the EC.We must note that $35 billion of the $63 billion of exports from Latin America went to the US and the EU. More open markets and less domestic support in those destinations is, therefore, crucial for the region.The fact that Europe has been successful in its effort at retaining its agricultural space with the help of a CommonAgricultural Policy that both supports and subsidises its agricultural producers is clear from Chart 4, which shows that intra-EC trade which accounted for 74 per cent of EU exports in 1990, continued to account for 73 per cent of total EU exports in 1995 and 2001.But North America, with far fewer countries in its fold, has also been quite insular. Close to a third of North American exports are inter-regional. Little has changed since the Uruguay Round Agreement on Agriculture.It is widely accepted that three sets of actors account for this failure of the AoA:First, in order to push through an agreement when there were signs that the Uruguay Round was faltering, the liberalisation of agricultural trade in the developed countries was not pushed far enough;Second, is the ability to use "loopholes", especially those in the form of inadequately well-defined Green and Blue Box measures, in the AoA, to continue to support and protect farmers on the grounds that such support was non-trade distorting; and Finally, there are violations of even the lax UR rules in the course of implementation, which have been aided by the failure of the agreement to ensure transparency in implementation.Not surprisingly, some countries, especially the Cairns group of exporting countries, have proposed an ambitious agenda of liberalisation in the agricultural area.Tariffs are to be reduced sharply, using the "Swiss formula", which would ensure that the proportionate reduction in the tariffs imposed by a country would be larger, the higher is the prevailing bound or applied tariff in that country.翻译:题目:自由贸易中的绿色壁垒作者:C. P. Chandrasekhar 、Jayati Ghosh随着对全球农产品贸易“模式”阶段新一轮谈判完成的截止时间3月31日的临近,要想达成一致的希望越来越弱。
国际贸易:论文中英文附录-浅析绿色壁垒对我国农产品出口的影响

毕业论文英文参考资料姓名学号年级专业系(院)指导教师20xx年x月x日原文部分(英文)(3500个单词左右)Analysis of the impact of green barriers on China's exports of agricultural products(From: Journal of Northeast Agricultural University, 2005, (2))In recent years, the environment-protection in international trade inclines to be stronger and stronger, the new developing non-tariff trade barriers such as the green (organic) trade barrier have become certain rationality, disguise and technology under the title of environmental protection, and become the effective weapon of trade protectionism more and more. It has already formed the difficult door hank for us through the swift and violent development in a few years, assaulting the export of our agricultural products seriously. Whether we could cross this green protective screen become the key problem for the continuous and constant development of our agricultural products export under the new situation of China's accession to the WTO.1.Implications, Characteristics and Formulation of Green Barrier1.1 Implication of the green barrierThe meaning of trade barrier includes tariff barrier and non-tariff trade barriers, and the technological barrier is the main form of non-tariff trade barriers. With the constant development of TBT(Technical barriers to trade),the green barrier has already become the important component of TBT.Green barrier is a kind of neutral barrier. Normal green barrier means to take rational measure of trade actually to protect environment legally. And the rational green barrier means that the importer implement import restrictions on ecological environment protection, natural environment, the health animals and plants. Up to now, it has already permeated through planning from the initial raw materialsof products to each link, such as production procedure, packing and selling, consumer’s usage and scrap and dealing, etc. Progressively. It stipulates according to relevant environmental protection standards, requires the import goods should not only be in accordance with the quality level, and should also be in accordance with the environmental protection request from designing, making, packing to consuming link of handing etc., and can't cause danger to ecological environment and human health. Such new trade protective measure can stop abroad products effectively, especially environmental consciousness bad, backward in technique entry of product of developing country.1.2 The formulation of the green barrierWith the rapid economic growing of various countries, the global environmental question is aggravated day by day after the World War II. In face of the ecological environment that is destroyed and polluted miserably, the green peace organization has sent out the sharp accusation: the mankind has made the paradise of a piece of rubbish, world people increasing at double and spreading like the pestilence have caused the extinction of 500 animals and plants, it is robbing the fuel on the earth. When the holding capacity of the ecological environment reaches limit, it will begin to carry the terrible vindictiveness to the mankind. In face of the severe vindictiveness of natural environment, day-by-day the international community has lifted the powerful environmental tide. People also gradually realize that it is mankind's common responsibility to protect the environment, and we must adopt the common action.The formulation of the green barrier of trade protectionism and needs are not out of ecological environment protection and human health there is one side reason is that trade of its rationality. But its profound reason is that trade protectionism resumes, and several negotiations between GATT and WTO have already kept the tariff very low, cariouscountries are unable to achieve the goal of exercising restraint in importing to cause through the tariff. "Protecting the national economic benefits" is basic hopes when various countries carry on international trade, so adopting restriction when foreign products enter national market, and guaranteeing national products that occupied domestic market become natural acts1.3 Characteristics of the green trade barrioThere are era backgrounds in appearances of the green trade barrier of rationality of the surface content. "Limit increased" which Club of Rome published in 1972. The report and the first world environments summit meeting holding at Stockholm of Sweden in the same year have promoted the development of environmental protection sport of the world. Mankind begin to think the relations of the environment, economic growth and social welfare, to intro-sped the prevailing consumption mode, followed the world environmental doctrine sport, and to think the production, trade and environmental protection factor while consuming be paid more and more concerns. On the other hand, the deterioration of environment is constant day by day, and arouses highly concerns of the people all around the world, especially on the environmental protection of developed country. People care more and more about life quality, pay close attention to the ecological environment, and pursue non-harmful consumption. Although the green trade barrier seems has catered to the public’s needs, and is in accordance with sustainable development goals of various countries, the trade protectionism restrains the foreign products from importing in fact.The legitimacy of the external form lies in a series of countries as a kind of brand-new main difference between green trade barrier and other non-tariff trade barriers. Border legislates in order to legislate to stipulate and implement publicly accusing to using publicly at home. Haveall made the corresponding regulation to the green trade barrier in PTO, relevant trade agreement and international environmental convention. At present, more than 150 multilateral international protocols have already been signed in the world. The extension of the scope of application with various countries actively pursues the sustainable development strategy.The range of the green trade barrier is more and eating, wearing, using, living, transporting to playing, and from means of livelihood to means of production, all products trade related to ecological environment, natural health belong to it and protect resources and human health belong to it and protect the content. In the last few years, some fields, such as service trade, technological trade have expanded beyond the trade of the products.2 Forms of the Green Barrier2.1 Green technical standardIt is usually some countries to pass the legislative means in the name of environmental protection to make a series of mandatory strict environmental protection technical standards, in order to forbid or exercise restraint in importing. These standards are all made according to one' s own production and engineering level by developed countries, so it is very difficult for developing country to reach these standards.2.2 Green packing systemIt means that the packaging of the products is harmless to ecological environment and health, can economize resources, and is easy to resolve naturally. Because of the development of the international economy, the packing article is increasing constantly, caused a large number of rubbish and esource waste. Various countries’ governments adopt countermeasures to use the green pack to promote, the main measures include stipulating legislative form that forbids using a certain material and encourage using resources that can be recycled etc. by way of legislation2.3 System of environmental health quarantineThe government of a country has the right of taking quarantine measures to protect mankind and health of animals and plants, especially to guarantee the people and animals food exempt from the influence of pollutant, toxin, additive, etc., and to guarantee that the mankind exempts from importing the harm with diseases caused by the animals and plants. Regulation of "the hygiene and animal and plant quarantine measure agreement": each member has the right to take the hygiene and animal and plant quarantine measure, but should be by protecting the lives of the mankind, livestock and plant or not exceeding healthily, and should not violate the non-discrimination principle.3.The Impact of“Green Barrier”on the Trade of Chinese Agricultural ProductsAgricultural products have been a competitive product of the foreign export of our country within quite a long time. After reform and opening-up, as our country exports the constant improvement of the product specification, the export of agricultural products has already dropped to the secondary position, but the annual volume of export is still large. At present, main agricultural products that our country exports are meat birds, beasts and eggs, marine product, fruits and vegetables products, etc. Because of the prevailing of green barrier, the export of Chinese agricultural products receives serious influence in recent years3.1 Green barriers have limited the present stage of export range of Chinese agricultural productsThe important export markets of agricultural products of China are developed countries and some new developing industrialized countries, such as USA, Japan, European Union, etc., and these countries implement the green country with more serious barrier exactly. They rely on the advanced technological advantage to examine the system of quarantiningafter making strict hygiene on animals and plants, agricultural products produced with the processing technical standard, residue amount of agriculture chemical and toxicant and require etc., the packing of product and treatment which pack the offal. These complicated, harsh standard and system influence the export range of agricultural products of our country seriously, because a lot of agricultural products can't be exported without according with these regulations and requirement. The agricultural product range of the "green barrier" is bigger and bigger. The implemented technological ranges of barrier in some developed countries for Chinese agricultural products export increase constantly, and have already included most agricultural products, such as grain, fruit, Vegetables, livestock produce, aquatic produces, birds' products, tea, etc.3.2 Green tariff respectsIn recent years, the western countries are collecting, replenishing and carrying on the environment to dump the investigation to the import of agricultural products constantly in the name of protecting the environment, to impose the import surtax with polluting the environment or influencing the ecological agricultural product lesson, even limit, forbid importation.3.3 Market access respectsThe importer should check the production equipment of the exporter, thus guarantee that the imported products can respond to the request that national environmental protection is standard. In this way, the exporter will pay the fund, technology and human extra resources, will increase the cost of goods, and worsen the terms of trade of the exporter.3.4 Strengthen the control on agricultural product trade of Chinafrom developed countriesThe developed countries relying on the status of the big tradingnation and advanced technological advantage make the strict environmental protection regulation and relatively harsh technical standard to control the agricultural product exports of developing countries. Ten addition, World Trade Organization has not made the clear norm to the environmental question in international trade at present, causing developed country members to utilize this "green area" to play "the edge ball", and in the name of taking advantage of protecting the environment to implement trade discrimination against developing countries. China is hurt deeply in this respect4 Countermeasures for Chinese Agricultural Product Trade to Deal with Green Barrier4.1 The green marketing of barrierThe green marketing of barrier which also called environmental marketing or ecological marketing to cross over the green barrier, requires all enterprises to establish environmental consciousness in the whole course of producing and managing with the sustainable development strategy, to launch it in order to dispel, reduce the products and marketing activity to ecological environmental impact of service, and through the micro behavior of enterprises to promote the sustainable development of the human environment and economy. In develop the green products, it should begin with collecting relevant international green information actively in green marketing, research and analyze, and process the information deeply for the use of enterprises. In addition, enterprises should choose the green resource, should pay attention to the green design, develop green packaging, process the link of selling etc. to check strictly in production, in order to improve product quality conscientiously. Enterprises will make the green marketing association, green products and green price, green channel, green will be promoted and combined together organically, implementing the green marketing strategywill be in all round way. Green marketing is based on regular marketing, emphasize that unites the interests three of consumption demand, enterprise's interests and environmental protection organically, it is a kind of more advanced social marketing, green marketing pays attention to environmental protection even more than social marketing. The main content of green marketing is to collect green information, green products, counting and packing, making the green price, setting up green marketing channel and promoting etc. green green, enterprises can already improve the competitiveness in the international market of the products through one's own green image while implementing " green marketing ", can play and lead and strengthen function green on the public consumer behavior, help to open up the green product market4.2 To carry out IS014000 authentication conscientiously, adopt the green standard activelyGuide the new development of the marketing strategy. ISO14000 is the international environmental management standard, its aim is through setting up and implementing environmental management to achieve and improve the environmental behavior, purpose to prevent environmental pollution continuously, it is the new environment management, which is suitable for all enterprises. No matter for enterprises or for the brand, ISO14000 is all the first passport of international trade; it is "green pass" which breaks the green harrier that any country sets up.4.3 The policy of the agriculture4.3.1 Set up to the environmental protection type agricultural production subsidy measure. Improve the “green”content that our country exports agricultural products during a shorter time, should use high-efficient, low-toxicity pesticide, equilibrate fatly and examining the soil and applying fertilizer from encouraging peasants at first, develop " green agriculture " to start with, the government for enoughcompensation to the economic losses that peasants implement the environmental plan and suffer4.3.2 Carry on financial support to the supply of the environmental protection type agricultural assets product. Government to environmental protection research and development and produce, offer, replenish and reward of means of agricultural production, the route to supply from the agricultural goods and materials with is set about, change the thinkings of development of agricultural goods and materials such as the existing chemical fertilizer,etc., develop and produce and turn environmental protection and giving consideration to type means of agricultural production of output to to develop and produce by the high-efficient type means of agricultural production, improve agricultural productivity on the basis of sustainable development.4.3.3 Support environmental protection type research of agricultural science and technology and technology popularization in a more cost-effective manner, encourage the agricultural production structure to optimize. Study on environmental protection type agricultural technology and push away, use, can get up, get, protect the environment and keep the double efficiency of the output.4.3.4 Set up and replenish beasts and birds cultivating, transporting, butchering, environmental protection of the processing course. We should be in propagating, improving the standard of peasant household's animal's welfare consciousness in a more cost-effective manner, help peasant households to carry out cultivating, transportation of the welfare content up to standard with slaue standard in financial support way4.3.5 Support and lead it and study links of popularizing, transporting, processing etc. and offer the service up to standard of high quality in environmental protection type agricultural products in a more cost-effective manner, create conditions for evading the trade barriereffectively4.4 Accelerate the construction of standardized systemPerfect agriculture's standardized system, realize the standardization of agriculture produces, it not merely helps to bring about an agricultural advance to promote agricultural products international competition, can improve the international environment of the agricultural products trade of our country too. It should adopt the international standard and advanced standard of foreign countries actively first to accelerate the construction of standardized system, accelerate formulation and modification of the agricultural quality level of our country; Secondly should pay close attention to the epidemic prevention test work of the animals and plants, define the epidemic-stricken area of the harmful organism, it is not the epidemic-stricken area and the minuent is popular, and then break the green barrier abroad; Accelerate the environmental technological cooperation with the principal trade partner, the agreement signing relevant environmental standards to recognize each other finally. The development of the environmental protection industry of our country is still at primary stage, both environmental technology and environmental management has greater disparity with the developed country, it is unrealistic to reach the strict environmental standard of developed country in a short time, so we should promote the environmental technological cooperation with the principal trade partner while strengthening environmental management, combine environmental technology of my what country have now, management level and economic endurance, through carrying on the bilateral negotiation with the principal trade partner, try to sign the agreement recognizing each other, reduce the trade barrier formed because of difference of environmental standards4.5 Advance agriculture's structural strategical reajustment4.5.1 Improve agricultural products quality in an all-round way. Must accelerate introduction, seed selection and popularize the new variety, develop the characteristic products of high added value in a more cost-effective manner, high-quality ones that realize agricultural products melt, improve the special-purpose and applicability of agricultural products progressively4.5.2 Further speed up the development of animal husbandry. Accelerate the development of the animal husbandry, promote the planting by the development of animal husbandry, drive the processing industry, promote benign cycle between structural rationalization of agriculture and industry. Should take the effective measure at present, strengthen the improved variety of beasts and birds and beed the system and epidemic prevention system construction, develop feed industry and livestock produce deep processing, develop animal husbandry into a great industry4.5.3 Develop agricultural products and enter industry in a more cost-effective manner, expand high value, high added value agricultural product to export, this is an important measure which expands foreign exchange earning of agricultural products, develop deep processing of agricultural product, expand the agricultural product export, the ability to strengthen foreign exchange earning of agricultural products. Accelerate the development of processing of farm products, keeps fresh, the introduction, development of warehousing and transportation technology and apparatus improve the processing of farm products and keep fresh horizontally4.5.4 Optimize agriculture's regional overall arrangement. Adjust and optimize the regional structure rationally, develop characteristic agriculture in a more cost-effective manner. Coastal developed area and big city suburb will develop high-efficient agriculture and agricultureoriented for export and foreign exchange earnings actively; The fragile area of the ecology should devote more efforts to conceding the land to forestry and grass, develop industry of planting forest or fruit tress, grass industry and animal husbandry. Grain-production area take, through structural adjustment, give play to grain-production advantage, develop high-quality, special-purpose grain variety4.5.5 Develop the township enterprise, accelerate rural urbanization paces. Improve the agricultural competitiveness, must accelerate agricultural workforce's shifting, improve the agricultural labor productivity. Advance structural adjustment, system innovation and technology of township enterprise to create, encourage the township enterprise of many kinds of ownership forms to develop, expand the rural employment channel. Speed up the development of small town, reform the household register system of the small town, support peasants to enter the cities and towns and work and do business4.6 Making sustainable strategy4.6.1 Accelerate establishing the system of perfecting agricultural standard; improve the quality leve1 of agricultural products Should participate in the international standardized activity voluntarily, study and follow the trail of the international standard constantly conscientiously, adopt the international standard and advanced standard of foreign countries actively, accelerate the revision of making of the agricultural quality level of our country, in order to strengthen the export competitiveness of agricultural products of Gina. Should strengthen the quality inspection of agricultural products and measure system construction, introduce and develop monitoring technology- and equipment in the same level with the developed country, promote main agricultural products to examine the technology upgrading which measure the system, accelerate the process of connections withinternational standards. At the same time, should do a good job of quality authentication, it is important means to ensure food security quality and break through the "green barrier" of trade to implement quality safety approval to the food and agricultural product.4.6.2 Developing the environmental protection industry activelyThe countries all over the world support the environmental protection industry on legislating and policy, the reason is that its production cost is high, with high technical content, the Fund is intensive, general enterprises are unwilling to make the investment, so need supporting especially. To meet demands of consumer, we should design and develop the green products.4.6.3 Setting up green pack system of export productsGreen packing refers to be packed environmentally friendly, be circulated packaging used in utilization or regeneration. Because the packaging offal has already gradually become one of the important origins of the ecological mentally friendly environment pollution, to a environ-one may choose wrappings of reclaiming, it is already of the world first-selection of wrappings all over current countries References译文部分(中文)浅析绿色壁垒对我国农产品出口的影响近年来,在国际贸易中的环境保护倾向不断增强,在环境保护的名义下新发展的非关税壁垒如绿色(有机)壁垒已经成为合理的,隐蔽性和技术性,也使得贸易保护主义的影响范围越来越广。
- 1、下载文档前请自行甄别文档内容的完整性,平台不提供额外的编辑、内容补充、找答案等附加服务。
- 2、"仅部分预览"的文档,不可在线预览部分如存在完整性等问题,可反馈申请退款(可完整预览的文档不适用该条件!)。
- 3、如文档侵犯您的权益,请联系客服反馈,我们会尽快为您处理(人工客服工作时间:9:00-18:30)。
中国农产品贸易竞争力分析外文翻译文献(文档含英文原文和中文翻译)译文:中国主要农产品的显性比较优势及竞争力分析摘要:本文在大量数据的基础上测算了1980-2003年期间中国部分农产品的显性比较优势指数及其比较竞争力。
测算结果表明中国在可食用蔬菜、茶叶等农产品上仍然具有比较优势,但是24 年来中国农产品的显性比较优势指数呈现下降趋势。
关键词:农产品; 国际贸易; 显性比较优势(RCA); 竞争力中国的农产品出口,为增加外汇、就业机会及城乡居民收入做出了重大贡献。
2003年农产品贸易余额为2.5美元亿美元,占外贸顺差总额的9.8%。
诚(2003)报道,由农产品出口可直接和间接创造19.88个就业机会。
巴拉萨(1965)在全球层面上首次提出了中国农产品的相对竞争力可以通过显示性比较优势分析(RCA),这对意识到中国农产品的竞争地位有作用的。
显示性比较优势的公式有某些类型的测量方法可以判定一个产业的竞争力,其中RCA指数就是重要的一个,RCA的概念基于的是传统的贸易理论。
原来的RCA指数,由巴拉萨(1965),可以被定义为:RCA= (X ij /X it) / (X nj / X nt)其中x表示出口,i代表一个国家,j是一种商品,x ij表示i国用来出口商品j。
t代表一组商品和n代表一组国家。
因此,该方程分析一个国家的出口占世界出口的商品与该国的出口总额占世界出口总额。
如果i国家j商品的世界出口份额,占i国的所有产品的世界出口份额越大,RCA将越大于1,这表明一个国家在生产特定商品上有一个“显性”比较优势。
RCA是基于观察贸易模式。
RCA价值的增加意味着在一国一种商品的竞争力增加。
这种测量是很容易,它被广泛采用。
但在现实中,可以观察到的贸易格局被政策和干预扭曲,因此可能会歪曲潜在的比较优势。
这在农业部门尤其如此,政府的干预是司空见惯的,这一点由巴拉萨(1965)指出。
进口限制的程度,出口补贴和其他的保护政策可能会扭曲的显示性比较优势指数正在成为关注的问题。
作为衡量政府对农业的支持,经济合作与发展组织(1999)按农业与产业估计总支持等值(TSEs)。
这是很自然的认为TSEs越高,产业越会得到支持。
显而易见的是,在联合国的支持水平最高,随后是美国,最低的是中国。
作为世界贸易组织的承诺,所有成员国的政府干预预期减弱。
然而,在一些考虑的时期农业是不可能是完全摆脱政府干预。
福利收益源于农业贸易自由化,例如,泰尔斯和安德森(1988和1992)和经合组织(1995年),这意味着农业政策必须影响贸易流量(即容量)和可能对贸易模式(即方向)。
自由是优于各种程度的贸易限制。
沃华夫和VO(1990)发现出口业绩更受经济基本面影响而不是政府干预,而进口行为正好相反。
沃华夫(1989)指出,政府的干预和竞争力往往是负相关的。
这表明,那些露出了比较优势的产品群可以变得更具竞争力,如果市场变得更加开放。
RCA仍然潜在的比较优势和竞争优势提供了有益的指导,虽然指数是毋庸置疑的。
中国主要农产品的显性比较优势上述所定义的RCA指数计算了1980至2003年期间中国农产品出口与其余的世界对比。
数据来源中国国家统计局(国家统计局)。
所有样品的产品类别和贸易覆盖17流过24期。
年度RCA指数计算这个四位数的水平,但在三位的水平。
以下两个领域的RCA值,可以定义为:高RCA>2,低2> RCA> 1。
此外,如果RCA值小于1时,表示一个国家发现比较劣势(RCD)在一个特定的商品。
因此,一些观察,可以从表1中。
1. 1980年,中国显示性比较优势在17个产品有7种。
他们是茶叶,大米,猪肉制品,猪肉,水果,鸡肉和肉类。
对于其他产品中国是显性比较劣势。
2003年茶叶,大米,鸡肉和猪肉产品继续保持其竞争地位。
此外,蔬菜和蘑菇获得了竞争力。
2. 在所有产品类的显性比较优势中,五种制品的比较优势高,其中两种在1980年优势低,而在2003年只有其中两个制品高。
3. 鸡肉,猪肉和茶叶一直保持他们的竞争力,在整个24年期间。
4. 肉、猪肉和水果是产品类别在1980年用RCA衡量,但是在2003年用RCD。
然而,蔬菜产品和蘑菇的产品类别在1980年用RCD衡量,但是在2003年用RCA。
这两类都是加工产品。
5. 在24年期间,4个农产品类别在中国经历了一个改进:蘑菇和蔬菜产品从“RCD”改为“RCA”,棉花和谷物的RCA值也有所增加,但他们仍然在RCD位置。
6. 对于大多数类型的农业产品,中国的竞争力减弱了。
17产品类别中有12种的RCA价值经历了下降。
结论与展望上述研究结果表明,在中国显性比较优势的农产品大部分是劳动密集型产品。
蔬菜产品的上升是令人鼓舞的,部分原因在于中国在农业的劳动力成本低。
比较优势指数的下降水平意味着在中国的农业产品中的竞争力正在减弱,可能会导致以下原因。
在外部,许多经济一体化的组织已建立和合并其成员国,从而形成固体的区域贸易封锁的经济体。
在内部,许多农产品的质量不能达到国际标准;大多数农业企业是技术创新中的弱者。
更重要的是,工业协会和中介机构没有使其潜能充分发挥在推进农产品加工业,并维护市场秩序。
为加强中国的农业产品竞争力,进一步应努力通过发展农业龙头企业推进农业产业化推进。
国内主要农业生产者是个体农民家庭。
农业企业只有在发展的最初阶段。
当农民被企业和/或合作组织在家庭责任合同制度的基础上组织进行工业化管理,他们将会得到更全面的服务,并将更好地分配农业的资源。
在此期间,企业应高度意识到市场的需求和充分利用信息技术和现代市场供给和需求的最新趋势与时并进,并更好地组织其营销的销售方法。
这些企业应该更多的资金注入R&D程序、技术传播和品牌营销。
规范化的管理应应用在生产、加工、包装、运输、销售、卫生检疫的农业产品,以满足国际质量认证的要求。
此外,中国政府应考虑设立特别学校对农民的教育和培训,提高其素质和竞争力,促进农业和农村经济的长期增长。
因此,工业化可以推进农业产品的RCA关于该国的农业结构的战略性调整和产业的国际市场竞争力。
原文:Revealed comparative advantage and competitiveness ofChina’s agricul tural productsAbstract: This paper deals with the competitiveness of Chinese agricultural products, base on the index of revealed comparative advantage (RCA) using lots of data for the period of 1980 to 2003. The index is useful in identifying the demarcation between comparative advantage and comparative disadvantage. The research indicates that some agro-products in China such as edible vegetables and tea have a comparative advantage, but the RCA values have been declining over the 24-year period, which has vast impacts on future reform in China’s agricultural structure.Keywords: agricultural product, export, revealed comparative advantage (RCA), competitiveness.China’s exports of agricultural products have made significant contributions to increasing foreign exchange, job opportunities and rural income. In 2003 the agricultural trade balance was US$2.5 billion, which accounted for 9.8 per cent of total foreign trade surplus. Cheng (2003) reported that 19.88 job opportunities can be created directly and indirectly by exports of agricultural products.The relative competitiveness of China’s agricultural products can beanalyzed by means of revealed comparative advantage (RCA) first proposed by Balassa (1965) at the global level, which is useful to be aware of the competitive position of China’s agricultural products.Formulation of revealed comparative advantageThere are some kinds of measurement in determining the competitiveness of an industry, among which RCA index is an important one and the concept of RCA is grounded on conventional trade theory. The original RCA index, formulated by Balassa (1965), can be defined as:RCA= (X ij /X it) / (X nj / X nt)Where x represents exports, i is a country, j is a commodity, X ij is exports by country i in commodity j. t is a set of commodities and n is a set of countries. Therefore, this equation analyses a country’s export share of world export of a commodity with the country’s total export share of world total exports. If country i’s share of world exports of commodity j is greater that country i’s share of world exports of all goods, the RCA will be greater than 1, which suggests that a country has a “revealed” comparative advantage in the production of that particular commodity.RCA is based on observed trade patterns. An increasing in the value of RCA means an increasing in a country’s competitiveness in a commodity. This kind of measurement is so easy that it is widely adopted. But in reality, observed trade patterns can be distorted by policies and interventions and therefore may misrepresent underlying comparative advantage. This is especially true of theagricultural sector, where government interference is commonplace, a point noted by Balassa (1965). The extent to which import restriction, export subsidies and other protection policies might distort index of revealed comparative advantage is becoming a concern.As a measure of government support to agriculture, the OECD (1999) estimates total support equivalents (TSEs) by country and industry. It is natural to think that the higher the TSEs is, the more support the industry gets. It is evident that the level of support was highest in the UN, then in the USA, and lowest in China. As a commitment to the World Trade Organization, government intervention in all member countries is expected to diminish. Nevertheless, agriculture is unlikely to be completely free of government intervention for some considerate time.The welfare gains result from agricultural trade liberalization, e.g. Tyers and Anderson (1988 and 1992) and OECD (1995), which implies that agricultural policies must have an impact on trade flow (i.e. volume) and possibly on trade patterns (i.e. direction ). The free is superior to various degree of trade restriction. V ollrath and V o (1990) found export performance to be more affected by economic fundamentals than by government intervention, whereas the reverse applied to import behavior.V ollrath (1989) noted that government intervention and competitiveness tend to be inversely related. This suggests that those product groups revealing a comparative advantage could become even more competitive if markets were tobecome more open. The RCA still provide a useful guide to underlying comparative and competitive advantage, although the index is not beyond doubt. Revealed comparative advantage in main agricultural products of ChinaThe RCA index as defined above is computed for China’s agricultural products for export over the period 1980-2003, with those of the rest of the world as contrast. The data are supplied by National Bureau of Statistics (NBS) of China. The all samples cover 17 product categories and trade flows over the 24-year period. Annual RCA index is calculated at the four-digit level, but reported at the three-digit level.The following two fields of RCA value can be defined: high for RCA>2, low for 2>RCA>1. In addition, if the RCA value<1, it denotes that a countryhas revealed comparative disadvantage (RCD) in a particular commodity. Thus, several observations can be made from Table 1.1. In 1980 China had the revealed comparative advantage for 7 of 17 product groups. They were tea, rice, pork products, pork, fruits, chicken and meat. For the others China had the revealed comparative disadvantage. In 2003 tea, rice, chicken and pork products maintained their competitive position. Moreover, vegetable products and mushroom gained competitiveness.2. Among all product groups with revealed comparative advantage, five of them ware high, two of them low in 1980; while in 2003 only two of them ware high.3. Chicken, pork and tea had maintained their competitiveness during the whole 24-year period.4. Meat, pork and fruits were the product groups with a RCA in 1980 but a RCD in 2003. However, vegetable products and mushroom were the product categories with a RCD in 1980 but with a RCA in 2003. These two categories were all processed products.5. During the 24-year period, four agricultural product groups in China experienced an improvement: mushroom and vegetable products improved from “RCD” to “RCA”; the RCA value of cotton and cereals also had increased, although they were still in RCD position.6. For most kinds of agricultural products, China’s competitiveness had weakened. The RCA value of 12 of 17 product groups experienced a fall.Conclusion and prospectsT he above findings suggest that most of the agricultural products with revealed comparative advantage in China are labor-intensive products. The rise in vegetable products is encouraging partly because of China’s low cost labor in agriculture.The decreasing level of comparative advantage index means that the competitiveness in China’s agricultural products is weakening which would have resulted from the following reasons. Externally, many economic integrated organizations have been established and merged the economies of their member states, thus forming a solid regional trading blockage. Internally, the quality of many agricultural products can’t come up to international standards; most agro enterprises are weak in technological innovation. W hat’s more, industrial association and intermediary agencies have not brought their potentialities into full play in advancing the agricultural processing industry and maintaining market order.To strengthen China’s agricultural products competitiveness, f urther efforts should be made to push agricultural industrialization forward by developing leading agricultural enterprises. The domestic major agricultural producers are individual farmer households. Agricultural enterprises are only in the initial stage of development.When farmers are organized by enterprises and /or co-operative organizations to carry out industrialized management on the basis of thehousehold responsibility contract system, they will get more comprehensive services, and agricultural resources will be better allocated.In the meantime, the enterprises should be highly conscious of market demands and make full use of information technology and modern sales methods to keep abreast with the latest supply and demand trends in the market and to better organize their marketing.These enterprises should also pump more funds into R&D programs, technology spreading and brand marketing. Standardized management should be applied in producing, processing, packaging, transporting, selling and hygienic quarantining of agricultural products to meet the requirement of international quality certification.In addition, the government of China should consider establishing special schools for farmers’ education and training to raise their qualities and competitiveness, boosting the long-term growth of agriculture and rural economy.Accordingly, industrialization can advance the strategic adjustment of the country’s agricultural structure with reference to the RCA of agricultural products and will sharpen the competitive edge of the industry in the international market.谢谢下载,祝您生活愉快!。