TracePro交互式优化工具使用说明
tracepro教程 (2)
TracePro教程简介TracePro是一款先进的光学模拟软件,能够帮助工程师和设计师进行光学系统的设计和优化。
本教程将介绍TracePro的基本用法和常用功能,帮助读者快速上手和熟练使用该软件。
安装和配置在开始使用TracePro之前,首先需要安装该软件并进行必要的配置。
安装TracePro软件请按照软件提供商提供的安装指南,下载和安装TracePro软件。
安装完成后,确保软件已经成功运行并可以正常使用。
配置TracePro软件在使用TracePro之前,需要对软件进行一些配置,以确保软件的正常运行和满足用户特定的需求。
具体的配置步骤如下:1.打开TracePro软件,选择“Options”菜单,再选择“Preferences”选项。
2.在弹出的对话框中,可以进行多种配置操作,包括界面语言、文件保存路径、单位设置等。
根据实际需求,进行相应的配置调整。
3.点击“Apply”按钮,保存配置修改后的设置。
4.关闭对话框,已完成TracePro软件的配置。
创建新项目在开始进行光学系统的设计和优化之前,首先需要创建一个新的TracePro项目。
下面是创建新项目的步骤:1.打开TracePro软件,选择“File”菜单,再选择“NewProject”选项。
2.在弹出的对话框中,输入项目的名称和保存路径。
3.点击“OK”按钮,创建新项目。
4.创建完成后,可以在软件界面中看到新项目的文件结构和相关信息。
导入和编辑模型TracePro支持导入和编辑多种模型,包括几何模型、光学材料、光源等。
下面将介绍导入和编辑模型的方法。
导入模型要导入模型到TracePro项目中,需按照以下步骤操作:1.在软件界面的“Model”选项卡下,选择“Import”按钮。
2.在弹出的对话框中,选择要导入的模型文件,并点击“Open”按钮。
目前TracePro支持常见的模型文件格式,如STEP、IGES、STL等。
3.导入完成后,可以在软件界面中看到导入的模型,并对其进行进一步编辑和设置。
tracepro7.5版新功能介绍
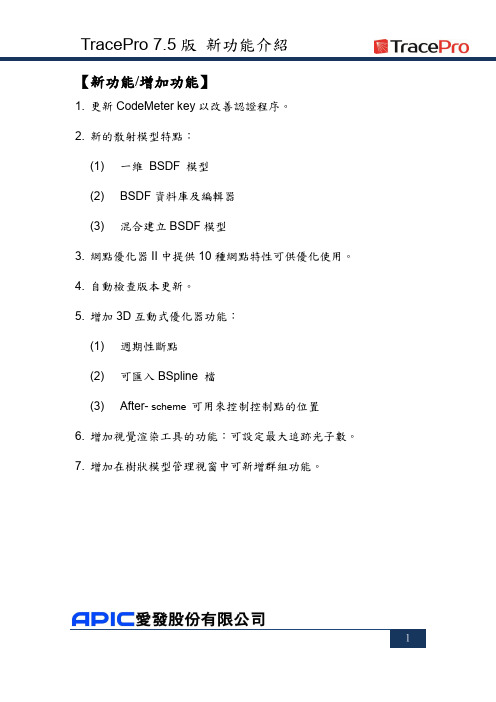
【新功能/增加功能】
1. 更新CodeMeter key以改善認證程序。
2. 新的散射模型特點:
(1) 一維BSDF 模型
(2) BSDF資料庫及編輯器
(3) 混合建立BSDF模型
3. 網點優化器II中提供10種網點特性可供優化使用。
4. 自動檢查版本更新。
5. 增加3D互動式優化器功能:
(1) 週期性斷點
(2) 可匯入BSpline 檔
(3) After- scheme 可用來控制控制點的位置
6. 增加視覺渲染工具的功能:可設定最大追跡光子數。
7. 增加在樹狀模型管理視窗中可新增群組功能。
【更新7.4.X版】
1. 鱗甲:
(1) 新增鱗甲幾何形狀:多邊形
(2) 新增快速檢視減化鱗甲後的顯示模型
2. 新增內件使用說明及可連結線上教程範例。
3. 3D互動式優化器功能:
(1) 可建立曲面反射面
(2) 新增波束寬度選項
(3) 新增物件類型:TIR透鏡、反射器
(4) 在表面編輯器中新增zoom all按鈕
4. IES/LDT 分析器新增路燈。
5. 表面光源特性產生器新增矩形座標編輯器。
6. 網點優化器支援非球面網點。
更完整的功能介紹,煩請參閱TracePro 使用者手冊。
謝謝您。
TracePro_7新功能介绍
同样,在这个例子中,我们在一个双核电脑中,相同条件下 •TracePro7.0 —1分14秒 •TracePro6.0.6—3分17秒 TracePro 7.0 新功能介绍 爱尔发科技上海分公司
新增特性—可重新编排的系统树
在TracePro7中,可以对各模组重新编组,只需要鼠标拖动就可 以编排各组的元件,十分灵活易用 TracePro 7.0 新功能介绍 爱尔发科技上海分公司
交互式优化工具
•只需通过Export按钮就可以实现模型无缝导入TracePro •确认下TracePro中各模组的特性不优化工具是否相同 •从这部分可是,之后功能仅在标准等级及与家等级中实现
TracePro 7.0 新功能介绍 爱尔发科技上海分公司
交互式优化工具
•确定哪些面是作为优化时候可以调节的 •控制变化的面的点的变动实现面的调节 •设定变化点的变化范围 TracePro 7.0 新功能介绍 爱尔发科技上海分公司
新的照度图分析选项
TracePro7 新增特性
新的归一化: 原先单一的归一化被移除,叏而代之的是新的归一化选项表 列: None, Emitted Irrandiance以及Peak. 在照度图的下方会对应罗列出 总的光通量/入射光通量,以及对应原先的归一化后的数值。 TracePro 7.0 新功能介绍 爱尔发科技上海分公司
新增的RepTile网点模型(与家等级中)
Pointed Cone
TracePro7 标准等级新增特性
在新的标准等级中,和先前的与家等级一样拥有了 非对称的散射模型,分别是 •Elliptical Abg •Elliptical Gaussian •Asymmetric Table TracePro 7.0 新功能介绍 爱尔发科技上海分公司
TracePro2D及3D优化功能
TracePro 2D 及3D 优化功能技术支援 > TracePro 2D 及 3D 优化功能 互动式优化让您的设计获得理想结果优化设计流程针对2D 对称式及3D 非对称式的光学与照明系统,TracePro 提供一套精简且功能完整的优化设计流程,并改进传统光学优化其复杂不易使用的缺点,TracePro 的优化工具提供使用者一套简单的互动式优化流程,使用者可藉由观察并操作控制每一个优化环节。
开始设计流程您可以透过CAD 草图描绘功能将初始设计数值化并设定变数范围,同时使用强度、效率、辐照度、颜色和/或均匀性参数来建立评价函数以开始设计流程。
巨集语言能力您可以使用TracePro 强大的巨集语言来控制与建立几何模型、修改每个表面的光学特性及实体物件,控制实体物件的位置。
可以在优化之前、期间和之后检查每个变量。
优化方法TracePro 2D 和3D 优化器使用优化演算法(也称为Nelder-Mead )进行优化。
Downhill Simplex 是一个寻找距离起始点最近的最小解的区域演算法。
在优化过程中,互动式优化器提供完整的功能让您可以控制与观察整个优化的过程。
这其中也包括您可以随时停止优化进而调整变数后再次启动优化以寻求更加的解答。
互动式优化器提供完整的优化功能帮助您在最短的时间里面找到得到最好的设计。
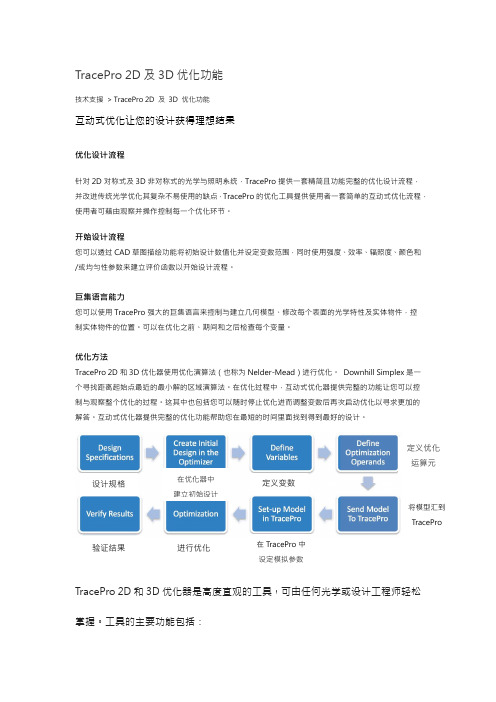
TracePro 2D 和3D 优化器是高度直观的工具,可由任何光学或设计工程师轻松掌握。
工具的主要功能包括:在优化器中建立初始设计设计规格 定义优化运算元定义变数将模型汇到TracePro 在TracePro 中设定模拟参数 进行优化 验证结果∙Surface Lists 面列表包含所有可用面类型,例如Planar,BSpline(自由、X、Y、XY),参数化(双锥曲面),2D剖面(非对称、对称、椭圆),和使用者自订路径(2D、3D)。
∙Property Editor 特性编辑器根据选择的不同而改变显示内容,一般来说包括原点、倾斜中心和角度(X、Y、Z),是否先倾斜然后偏移、厚度、材料类型、表面特性、延伸角度和折射率。
TracePro教程-LED
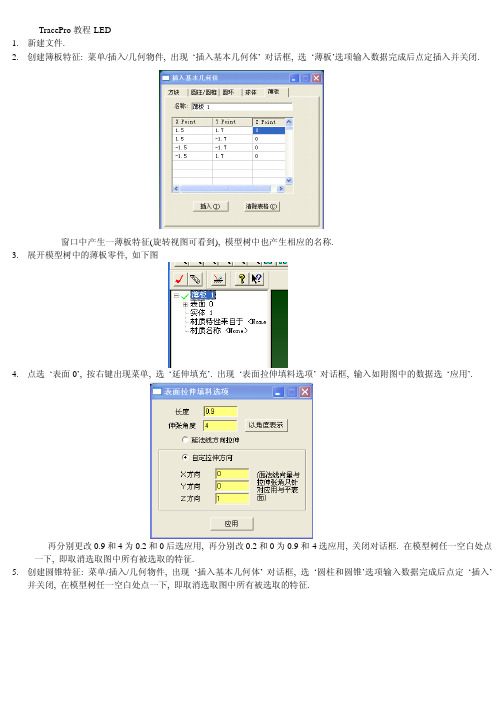
TracePro教程-LED1.新建文件.2.创建簿板特征: 菜单/插入/几何物件, 出现‘插入基本几何体’ 对话框, 选‘薄板’选项输入数据完成后点定插入并关闭.窗口中产生一薄板特征(旋转视图可看到), 模型树中也产生相应的名称.3.展开模型树中的薄板零件, 如下图4.点选‘表面0’, 按右键出现菜单, 选‘延伸填充’. 出现‘表面拉伸填料选项’ 对话框, 输入如附图中的数据选‘应用’.再分别更改0.9和4为0.2和0后选应用, 再分别改0.2和0为0.9和-4选应用, 关闭对话框. 在模型树任一空白处点一下, 即取消选取图中所有被选取的特征.5.创建圆锥特征: 菜单/插入/几何物件, 出现‘插入基本几何体’ 对话框, 选‘圆柱和圆锥’选项输入数据完成后点定‘插入’并关闭, 在模型树任一空白处点一下, 即取消选取图中所有被选取的特征.6.进行布尔运算: 在模型树中先选‘薄板 1’, 再按住Ctrl键选‘圆锥 1’. 菜单/编辑/布林运算/差集.7.慢速点选模型树中‘薄板 1’ 两次, 改名为 ‘Package’. 在模型树任一空白处点一下, 即取消选取图中所有被选取的特征.8.创建圆柱特征做散光板: 菜单/插入/几何物件, 出现‘插入基本几何体’ 对话框, 选‘圆柱和圆锥’选项输入数据完成后点‘插入’ 并关闭. 在模型树任一空白处点一下, 即取消选取图中所有被选取的特征.9.创建方块特征做LED: 菜单/插入/几何物件, 出现‘插入基本几何体’ 对话框, 选‘方块’选项输入数据完成后点‘插入’ 并关闭. 在模型树任一空白处点一下, 即取消选取图中所有被选取的特征.10.关键的来了, 设置三部曲:首先, 在模型树选取散光板特征(不是选展开后的某一面), 定义散光板的材质属性, 菜单/定义/编辑材质/表面材质, 出现对话框, 左侧选‘新增特性’ 按钮, 又出现‘输入一个新的表面特性’ 对话框, 如图设置并确定.然后, 将‘吸收率’ 设置为0, 将‘求解’ 设置为 BTDF, 按保存, 如下图:会自出现 ‘BTDF 符合能量守恒’ 的提示, 按确定后关闭, 再关闭‘表面材质编辑器’ 对话框.选择模型树中的 ‘Diffuser’按右边加号展开, 选择‘表面 1’, 也就是散光板的内侧, 然后按右键, 选菜单中的‘属性’,出现‘应用特性’对话框, 按下图设置后按‘应用’ 并关闭.12.第三步设置 ‘Package’ 上的凹槽的面属性.选择模型树中的 ‘Package’按右边加号展开, 选择‘表面0和表面 1’, 也就是凹槽的底面和侧面, 然后按右键, 选菜单中的‘属性’, 出现‘应用特性’对话框, 按下图设置后按‘应用’ 并关闭. 在模型树任一空白处点一下, 即取消选取图中所有被选取的特征.13.菜单/分析/光线追迹选项, 出现‘光线追迹选项’ 对话框, 照下图输入内容后‘应用/关闭’.14.设置LED光源:选择模型树中LED展开, 选择‘表面 0’ 即LED上表面, 右键出‘应用特性’ 对话框, 设置表面光源后按‘应用/关闭’.15.一切模型都设置完必, 就待分析了.16.菜单/开始光线追踪, 出现‘光线追踪’对话框, 选择追迹光线按钮/应用/关闭.17.菜单/分析/Candela Plots选项, 出现 ‘Candela选项’ 对话框, 选‘方位与光线’选项, 输入数据/应用.再选Candela 分布选项, 输入数据/应用/关闭.18.菜单/分析/Candela Plots/Polar Candela Distribution.。
TracePro实例教程

TracePro实例教程第一步是创建一个新项目。
在启动TracePro后,点击“File”菜单中的“New”选项,然后选择“Project”命令。
在弹出的对话框中,输入项目的名称和路径,并选择模板。
我们选择“General”模板,它提供了一个基础的空白项目。
第二步是设置光线追迹的参数。
在项目创建后,我们需要设置光线追迹的参数,以便进行模拟和分析。
在左侧的“Configuration tree”窗口中,选择“Model”节点,并点击右键,在弹出菜单中选择“Add Model”。
在弹出的对话框中,选择“Ray Trace”模块,并点击“OK”按钮。
然后,在右侧的属性窗口中,设置光线源的类型和位置,以及其他相关参数。
第三步是绘制光学系统。
在项目中,我们需要绘制光学系统的几何形状。
在左侧的“Configuration tree”窗口中,选择“Geometry”节点,并点击右键,在弹出菜单中选择“Add Surface”。
然后,在右侧的属性窗口中,设置表面的类型和位置,例如球面、棱镜等。
通过重复这个过程,我们可以添加多个表面来构建完整的光学系统。
第四步是定义材料属性。
在光学系统设计中,材料的光学特性非常重要。
在左侧的“Configuration tree”窗口中,选择“Materials”节点,并点击右键,在弹出菜单中选择“Add Material”。
然后,在右侧的属性窗口中,设置材料的光学参数,例如折射率、透射率等。
第五步是设置分析和输出参数。
在光学系统设计完成后,我们可以通过模拟和分析来评估其性能。
在左侧的“Configuration tree”窗口中,选择“Analysis”节点,并点击右键,在弹出菜单中选择“Add OutputAnalysis”。
然后,在右侧的属性窗口中,选择要分析的参数和结果的输出格式。
第六步是运行模拟和分析。
在完成了上述的设置后,我们可以点击“Run”按钮来运行模拟和分析。
TracePro将根据设置的参数进行光线追迹,并生成相应的结果。
tracepro使用指南
tracepro使用指南TracePro是一款用于光学和照明系统设计和分析的软件工具。
它具有强大的功能和灵活性,可以帮助用户快速准确地进行光学系统的设计和优化。
本文将为您介绍TracePro的使用指南,帮助您更好地了解和使用这一软件工具。
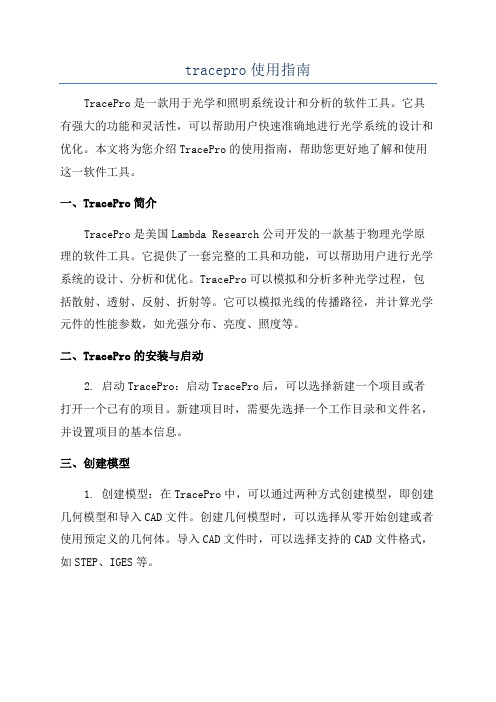
一、TracePro简介TracePro是美国Lambda Research公司开发的一款基于物理光学原理的软件工具。
它提供了一套完整的工具和功能,可以帮助用户进行光学系统的设计、分析和优化。
TracePro可以模拟和分析多种光学过程,包括散射、透射、反射、折射等。
它可以模拟光线的传播路径,并计算光学元件的性能参数,如光强分布、亮度、照度等。
二、TracePro的安装与启动2. 启动TracePro:启动TracePro后,可以选择新建一个项目或者打开一个已有的项目。
新建项目时,需要先选择一个工作目录和文件名,并设置项目的基本信息。
三、创建模型1. 创建模型:在TracePro中,可以通过两种方式创建模型,即创建几何模型和导入CAD文件。
创建几何模型时,可以选择从零开始创建或者使用预定义的几何体。
导入CAD文件时,可以选择支持的CAD文件格式,如STEP、IGES等。
2. 定义材料属性:在创建模型后,需要为模型定义材料属性。
可以从TracePro的数据库中选择预定义的材料属性,也可以手动定义或导入材料属性。
3.修改模型参数:可以对模型的参数进行修改,如几何体的大小、形状等。
也可以对模型的材料属性进行修改,如折射率、吸收率等。
四、设置光源和探测器1. 设置光源:在TracePro中,可以选择不同类型的光源,如点光源、平行光源、球面光源等。
可以设置光源的功率、波长、方向等参数。
2. 设置探测器:在TracePro中,可以选择不同类型的探测器,如粒子探测器、能量探测器、光强度探测器等。
可以设置探测器的位置、形状、大小等参数。
五、设置系统条件1. 设置边界条件:在TracePro中,可以设置系统的边界条件,如外部介质的折射率、吸收率等。
Tracepro学习教程

Tracepro学习教程Tracepro是一款强大的光学设计和仿真软件,广泛应用于光学系统设计和光学元件性能评估。
它提供了一套完整的工具和功能,可用于光学元件分析、衍射和散射分析、非球面镜设计、光学系统优化、发光二极管(LED)设计和非线性光学分析等。
1. Tracepro的安装和基本界面2. Tracepro的基本操作和数据输入在学习Tracepro之前,用户需要了解软件的基本操作和数据输入方式。
Tracepro可以通过输入光源、光学元件和材料等数据来进行光学设计和分析。
用户可以使用Tracepro提供的标准光源模型,也可以导入外部光源数据。
通过设置光源的参数和位置,用户可以模拟不同类型的光源,并观察其在光学系统中的传播和衍射情况。
对于光学元件的设计,用户可以选择使用Tracepro提供的标准元件模型,也可以自定义非球面镜、透镜等元件。
用户可以设置元件的参数和材料属性,并观察它们对光学系统的影响。
3.光学系统设计和优化Tracepro提供了丰富的工具和功能,用于光学系统设计和优化。
用户可以通过在光学系统中添加、删除或调整光学元件,来改变光学系统的传输特性。
用户可以观察光束的传播路径、聚焦性能和光线散射情况,以评估光学系统的性能。
在光学系统优化方面,Tracepro提供了多种优化算法和策略,例如遗传算法、步进法和灵敏度分析等。
用户可以根据需要选择合适的优化方法,并设置优化的目标和约束条件,以实现光学系统的最佳设计。
4.光学元件性能评估和分析5.LED设计和非线性光学分析除了常规光学设计和分析,Tracepro还提供了专门的功能和工具,用于发光二极管(LED)设计和非线性光学分析。
在LED设计方面,用户可以模拟LED光源的发射特性、发光度和色温等,并评估其在光学系统中的光衰情况。
在非线性光学分析方面,Tracepro可以模拟非线性光学效应,例如二次谐波生成(SHG)、三次谐波生成(THG)和光学放大等。
TracePro交互式优化工具

这是一个Side emitting LED,可以通过描光计算验证大多数 光线实现全反射,以及场角是否达到符合要求的角度
爱尔发科技上海分公司 TracePro交互式优化工具
12
导入TracePro
•只需通过Export按钮就可以实现模型无缝导入TracePro •确认下TracePro中各模组的特性与优化工具是否相同 •从这部分可是,之后功能仅在标准等级及专家等级中实现
2
优化工具等级应用
• TracePro 交互式优化工具在不同的等级中有不 同的功能
‐ 在TracePro 简易等级LC中,此优化工具可以构造多 曲面透镜或反射罩,交互式描光计算,基于已有 的图形构造TracePro模型 ‐ TracePro 标准和专家等级中,具有此工具所有完 整功能
爱尔发科技上海分公司 TracePro交互式优化工具
可以更 改直线 成样条 曲线的
可以通过分段更细,以及利用控制点达到精确构造模型
爱尔发科技上海分公司 TracePro交互式优化工具
10
完善设计
这时候检查分段,然后设定属性,你可以在左边窗口中很方 便的察看这些信息。
爱尔发科技上海分公司 TracePro交互式优化工具
11
交互式描光计算验证几何模型
18
最终优化结果
本案例通过84次运行后,我们可以发现其配光曲线已经非常接近我 们设定的目标值。同时也符合我们当初的设计要求:0-40度之间仅少 量光线,大部分集中在70度附近
爱尔发科技上海分公司 TracePro交互式优化工具
19
Misc. Bells and Whistles
•TracePro交互式优化工具还可以用在设计菲涅耳透镜中 •本版本可以设计多达3种不同类型的菲涅透镜: 等宽,等高,DOE
tracepro使用指南
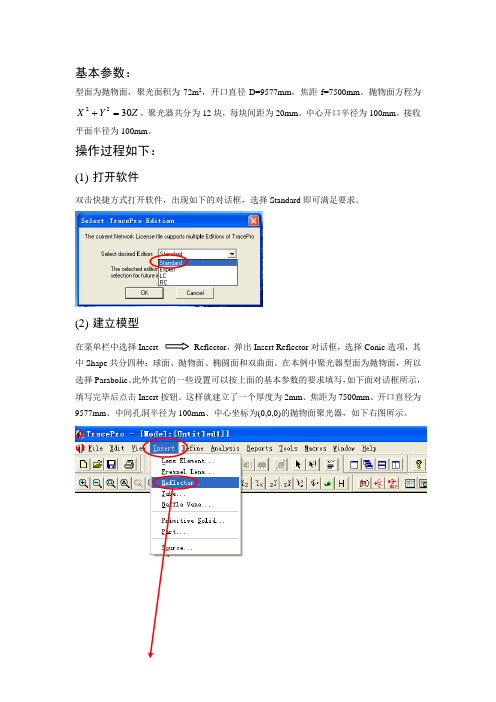
基本参数:型面为抛物面,聚光面积为72m 2,开口直径D=9577mm ,焦距f=7500mm 。
抛物面方程为 Z Y X 3022=+,聚光器共分为12块,每块间距为20mm 。
中心开口半径为100mm 。
接收平面半径为100mm 。
操作过程如下:(1) 打开软件双击快捷方式打开软件,出现如下的对话框,选择Standard 即可满足要求。
(2) 建立模型在菜单栏中选择Insert Reflector ,弹出Insert Reflector 对话框,选择Conic 选项,其中Shape 共分四种:球面、抛物面、椭圆面和双曲面。
在本例中聚光器型面为抛物面,所以选择Parabolic 。
此外其它的一些设置可以按上面的基本参数的要求填写,如下面对话框所示,填写完毕后点击Insert 按钮。
这样就建立了一个厚度为2mm 、焦距为7500mm 、开口直径为9577mm 、中间孔洞半径为100mm 、中心坐标为(0,0,0)的抛物面聚光器,如下右图所示。
要想从不同角度观察模型,可以从通过以下菜单进行操作。
其中和按钮比较常用,为全局放大,为对模型进行旋转观测。
要想观测模型的不同效果可以点击菜单栏View选项,有Silhouettes、Render、Wireframe、Hidden Line四个选项可供选择。
(3)分割聚光器按要求聚光器共分为12块,每块间距为20mm。
此处应用布尔运算对聚光器进行分割。
首先创建X向尺寸为10000mm(要比聚光器的开口直径大一些),Y向尺寸为20mm(为每块聚光镜的间距尺寸),Z向尺寸为5000mm(要比聚光器开口深度略大)的薄板,具体参数设置如下对话框所示。
薄板创建完成后,点击鼠标右键,出现下拉菜单,选择Rotate选项,对应弹出Rotation Selection 对话框,按对话框中参数填写完成按Copy按钮。
此操作共进行5次。
最终完成结果图如下所示。
Ctrl键加鼠标左键依次选择抛物镜面和各个薄板,点击鼠标右键,选择Subtract选项,对其进行布尔减运算。
TracePro教程上海交通大学
用宏语言Scheme语言进行
最早由MIT开发,属于Lisp语言,功能强大,比较复杂
16
建立模型
信息栏
鼠标在窗口移动,信息栏右侧部分显示当前位置 鼠标左键单击,信息栏中间部分显示单击位置的坐标
27
建立模型
Sweep 由Surface沿指定方向扫出实体
28
建立模型
Revolve Surface绕指定轴旋转形成模型
29
建立模型
布尔运算
只针对Object而不能用在Surface上面 首先选择一个实体,按住Ctrl同时选中另外一个 Unite:实体相加 Abstract:实体相减:选择被减实体、再选择减除实体 Intersect:实体交集
Material Properties
Surface Properties
Surface Source Parameters
Importance Sampling Targets
Prescription Data
Object and Surface Names
Exit Surface for Simulation mode
可以直接读取SAT文件不需要转换。 CAD软件导入TracePro时不能保存材料特性,在CAD软
件中修改之后只有SAT文件可以保存材料属性信息。
CATIA, Pro/E Reader & Writer Solidworks Bridge
安装后可以在Solidworks下建立模型、定义材质特性、 建立光源等操作;调用TracePro进行描光和分析。
Tools/Measure...
Tracepro实例学习教程
Tracepro实例学习教程TracePro是一个强大的光学仿真软件,可以帮助工程师和科学家设计和分析光学系统。
本教程将介绍TracePro的基本操作和主要功能。
通过几个实例案例,你将学会如何使用TracePro进行光线追踪、光线分析和优化等。
实例一:透镜系统设计假设我们要设计一个简单的透镜系统,主要包括一个凸透镜和一个凹透镜。
我们首先打开TracePro,创建一个新的项目,并选择“凸透镜”和“凹透镜”作为初始模型。
然后,我们可以设置透镜的物理属性,如曲率半径、折射率等。
接下来,我们需要定义光源。
在TracePro中,我们可以选择不同类型的光源,如点光源、方向光源等。
我们可以通过拖动光源调整其位置和方向,以模拟实际情况。
在设置完透镜和光源后,我们需要设置接收器,即检测光线的位置。
可以选择光强、光通量、光能量等作为接收器参数。
通过选择不同的接收器参数,可以得到不同的光学性能结果。
最后,我们可以通过点击“分析”按钮开始光线追踪。
TracePro会模拟光线在透镜系统中的传播和折射,然后显示光强分布、光通量等结果。
我们可以通过对比不同参数设置下的结果,来优化透镜系统的设计。
实例二:光学元件分析在这个实例中,我们将学习如何使用TracePro对光学元件进行性能分析。
假设我们使用一个平面反射镜作为光路中的一个元件。
我们打开TracePro,创建一个新的项目,并选择“平面反射镜”作为初始模型。
首先,我们需要设置反射镜的物理属性,如尺寸、反射率等。
然后,我们选择一个合适的光源,并设置接收器。
在设置完光源和接收器后,我们可以通过点击“分析”按钮开始光线追踪。
TracePro会模拟光线在反射镜上的反射,然后显示反射效果、光强分布等结果。
我们可以通过对比不同参数设置下的结果,来优化反射镜的设计。
实例三:光学系统优化在这个实例中,我们将学习如何使用TracePro对光学系统进行优化。
假设我们有一个复杂的光学系统,包括多个透镜、反射镜、棱镜等。
TracePro中文使用手册(132-207页)
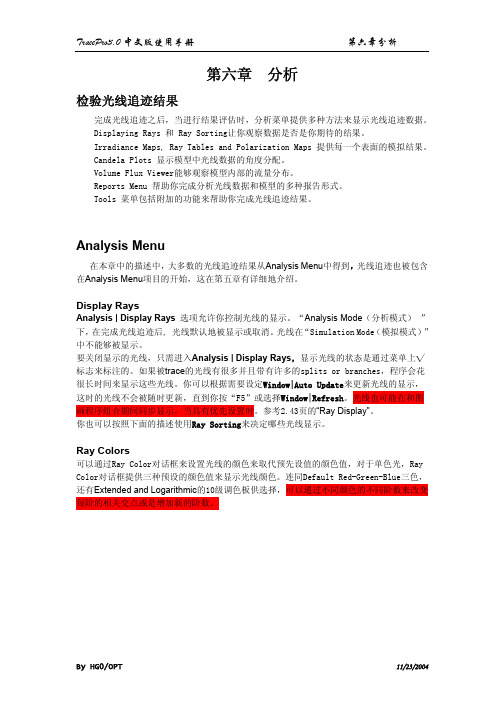
第六章 分析检验光线追迹结果完成光线追迹之后,当进行结果评估时,分析菜单提供多种方法来显示光线追迹数据。
Displaying Rays 和 Ray Sorting让你观察数据是否是你期待的结果。
Irradiance Maps, Ray Tables and Polarization Maps 提供每一个表面的模拟结果。
Candela Plots 显示模型中光线数据的角度分配。
Volume Flux Viewer能够观察模型内部的流量分布。
Reports Menu 帮助你完成分析光线数据和模型的多种报告形式。
Tools 菜单包括附加的功能来帮助你完成光线追迹结果。
Analysis Menu在本章中的描述中,大多数的光线追迹结果从Analysis Menu中得到,光线追迹也被包含在Analysis Menu项目的开始,这在第五章有详细地介绍。
Display RaysAnalysis | Display Rays 选项允许你控制光线的显示。
“Analysis Mode(分析模式)”下,在完成光线追迹后, 光线默认地被显示或取消。
光线在“Simulation Mode(模拟模式)”中不能够被显示。
要关闭显示的光线,只需进入Analysis | Display Rays,显示光线的状态是通过菜单上√ 标志来标注的。
如果被trace的光线有很多并且带有许多的splits or branches,程序会花很长时间来显示这些光线。
你可以根据需要设定Window|Auto Update来更新光线的显示,这时的光线不会被随时更新,直到你按“F5”或选择Window|Refresh。
光线也可能在和图画程序组合期间同步显示,当具有优先设置时。
参考2.43页的“Ray Display”。
你也可以按照下面的描述使用Ray Sorting来决定哪些光线显示。
Ray Colors可以通过Ray Color对话框来设置光线的颜色来取代预先设值的颜色值,对于单色光,Ray Color对话框提供三种预设的颜色值来显示光线颜色。
tracepro教程
TracePro教程简介TracePro是一款广泛应用于光学系统设计和分析领域的光学仿真软件。
它提供了光线追踪和非准直光线追踪两种模式,可以用于设计和优化光学元件、光学系统,以及进行光学性能分析。
本教程将介绍TracePro的基本使用方法和一些常用功能,旨在帮助用户快速上手并利用TracePro进行光学系统设计和分析。
安装和配置在开始使用TracePro之前,首先需要进行软件的安装和配置。
1.下载TracePro的安装包,并根据安装向导进行安装,确保安装过程中选择了合适的安装路径。
2.安装完成后,可以启动TracePro软件,并进行必要的配置。
例如,可以设置默认的工作目录,修改界面语言等。
TracePro界面TracePro的界面简洁直观,提供了丰富的工具和功能来进行光学系统的设计和分析。
以下是TracePro的界面主要组成部分:1.菜单栏:包含各种菜单和下拉列表,用于进行设置、导入导出文件、运行仿真等操作。
2.工具栏:提供了常用的工具按钮,如新建文件、保存文件、运行仿真等。
可以通过自定义工具栏按钮来增加或移除对应的功能按钮。
3.视图栏:显示当前文件的视图类型,可以通过点击视图栏的不同选项来切换视图。
4.图纸窗口:用于绘制光学元件和系统的图纸,可以通过拖拽和绘制的方式添加和调整光学元件的位置和属性。
5.结果窗口:显示仿真结果和分析数据,例如光强分布、传输率、反射率等。
可以通过结果窗口对仿真结果进行分析和调整。
TracePro基本操作1. 创建新项目在菜单栏选择。
tracepro教程
tracepro教程TracePro是一款光学仿真软件,用于设计和分析光学系统的性能。
它是一种强大的工具,可以帮助工程师在设计过程中优化系统,并测试各种设计变量的影响。
在本教程中,我们将介绍如何使用TracePro进行光学系统的建模和仿真。
这些步骤包括创建并定义系统的各个组件、设置光源和检测器的属性、进行光线追踪和分析结果。
下面是一些常用的功能和操作的简要概述。
1. 创建模型在TracePro中,可以通过绘制几何图形、导入CAD文件或使用现有的模型进行模型的创建。
为了简化教程,我们将使用TracePro的绘图工具进行模型的创建。
2. 定义材料在TracePro中,可以根据需要定义不同的材料属性,如折射率、吸收系数、散射系数等。
这些材料属性将用于光线的传播和相应的物理效应。
3. 定义光源在TracePro中,可以定义不同类型的光源,如平行光、点光源、面光源等。
光源的设置通常包括光源位置、光强度和光谱等参数。
4. 定义检测器在TracePro中,可以定义不同类型的检测器,如光敏区域、能量探测器、角度探测器等。
检测器的设置通常包括位置、接收模式和检测范围等参数。
5. 设置光线追踪参数在TracePro中,可以设置光线追踪的相关参数,如追踪模式、光线数量、迭代次数等。
这些参数将影响光线的行为和仿真的准确性。
6. 运行光线追踪在完成模型和参数的设置后,可以通过点击“运行”按钮来执行光线追踪。
TracePro将模拟光线在系统中的传播和相应的物理效应,生成光线追踪结果。
7. 分析结果一旦光线追踪完成,可以进行各种类型的结果分析,如能量分布、角度分布、损耗分析等。
TracePro提供了多种可视化和分析工具,以帮助您更好地理解系统的性能。
通过以上步骤,您可以使用TracePro进行光学系统的建模、仿真和分析。
希望这个简要的教程能够为您提供基本的操作指南,并帮助您在使用TracePro时取得良好的仿真结果。
TracePro于荧光粉LED的模拟与优化

16
实例分析1
17
实例分析2
18
实例分析2
19
总结
1. TracePro为荧光粉LED的模拟与优化提供了良好的平台。
2. 荧光粉材质产生器不仅仅可以用来将厂商提供的资料转换成荧光粉
材质,更对于评估预测荧光粉模型的参数与混色结果有极大的帮助。 3. 对于荧光粉仿真来说,校正是必要的程序。因为大部分的荧光粉激
计算CRI
建立荧光粉特性
• 其他荧光材质相关参数 1. 存放目录/名称 2. 附注说明 3. 量子效率
4. 工作温度
5. 取样点数 • 存储/输入
4
1 2 3
5
12
模拟结果分析
CCT图分析
Fluorescence utility
TracePro 13
优化LED模型
使用交互式优化工具
Target: CIE xy (0.36,0.36)
4
LED 3D模型的建立
交互式优化器可以 协助建立模型与…
寻找适合的模型参数与 优化效能
5
LED 3D模型的建立
荧光粉会形成多重层次(沈积) ,利用交互式优化 器配合剖面图建立实体模型
6
建立荧光粉特性
胶体和荧光粉混合层 (低荧光粉浓度区=1x)
反射杯(有扩散效果 的反射面材质) LED芯片
荧光粉沉基层(高荧光 粉浓度区= 10x)
Байду номын сангаас
7
建立荧光粉特性
发射光谱
吸收(激发)光谱
8
建立荧光粉特性
By Fluorescence property generator
厚度 3x 1x 浓度 1x 10x
1. 假设荧光粉浓度为10x以及树脂混合物部分部分为1x.
TracePro_7新功能介绍
TracePro_7新功能介绍TracePro是一款功能强大的光学仿真软件,用于设计和优化光学系统。
最新发布的TracePro_7带来了许多新功能和增强项,让用户能够更快速、更准确地分析和优化光学系统。
以下是TracePro_7的新功能介绍:1. 快速设置向导:TracePro_7引入了一个全新的快速设置向导,帮助用户更轻松地创建并设置光学系统。
向导提供了一系列易于理解和使用的选项,可以快速配置系统的几何结构、光源、材料和探测器。
用户只需要按照向导的指导,一步步完成设置即可。
2. 多种材料定义方式:TracePro_7提供了多种定义材料的方式,用户可以根据自己的需求选择最合适的方式进行材料的定义。
除了传统的导入折射率数据,TracePro_7还支持使用经验数据和Cauchy模型进行材料定义。
这使得用户能够更灵活地定义复杂的材料属性。
3. 自动优化工具:TracePro_7引入了一套强大的自动优化工具,用于通过调整系统中的参数来最大化系统的性能。
用户只需选择要优化的参数,并为每个参数设置适当的范围和步长。
然后,TracePro_7将使用优化算法自动最佳参数组合,以实现给定的性能目标。
4. 改进的散射分析:TracePro_7提供了更精确和全面的散射分析功能。
新的散射分析工具可以模拟光在材料内部的扩散和传播过程,以及在材料边界上的散射现象。
用户可以通过分析散射过程来评估系统的实际性能,进而优化设计。
5. 聚焦优化:TracePro_7的聚焦优化工具可以自动优化系统中的聚焦性能。
用户只需选择聚焦距离和目标直径,并为系统中的元件设置参数范围和步长。
然后,TracePro_7将自动最佳参数组合以实现最佳聚焦效果。
6. 多GPU加速:TracePro_7支持使用多个GPU进行仿真计算,大大提高了计算速度。
用户可以利用自己的多个GPU资源,加速仿真过程,缩短设计周期。
7. 改进的用户界面:TracePro_7的用户界面进行了全面升级,使得用户能够更直观、更高效地使用软件。
- 1、下载文档前请自行甄别文档内容的完整性,平台不提供额外的编辑、内容补充、找答案等附加服务。
- 2、"仅部分预览"的文档,不可在线预览部分如存在完整性等问题,可反馈申请退款(可完整预览的文档不适用该条件!)。
- 3、如文档侵犯您的权益,请联系客服反馈,我们会尽快为您处理(人工客服工作时间:9:00-18:30)。
1.Introduction1.IntroductionTracePro®Interactive Optimizerhelps users generate and also accomplish the optimization process of the Optical Elements and whole system-quickly and accurately.It provides a convenient and intuitional user interface to create radial free-form optical element(s).While useful for luminaire design,this tool can also be used to optimize LED second optics,reflective optics,projector system,solar concentrator and any other optical system needed optimization.The utility is for use with all TracePro editions and requires the most recent release of TracePro7.0and Microsoft Windows XP or later version.For more information on TracePro,or if you need technical support,please contact Lambda Research Corporation.About Lambda Research CorporationFounded in1992,Lambda Research Corporation is a privately held company based in Littleton, mbda provides optics software and services for government and industry worldwide.The company is an industry pioneer in the areas of stray light analysis,optical system design and analysis,scattering theory,optical testing,process control software and custom software development.Technical SupportIf you are having trouble with TracePro or have questions,please contact your distributor or Lambda Research Corporation directly.Technical support is available to customers with current support contracts.Additional information is also available via:•the World Wide Web at •the user to user e-mail list tracepro-talk•the new version e-mail list tracepro-updatesTo subscribe to one of the e-mail lists,submit a request online at /lists/listinfo.You can call us between the hours of9:00am and5:30p.m.(U.S.Eastern Time)Monday through Friday or reach us by e-mail.Lambda Research Corporation25Porter RoadLittleton MA01460Phone:(978)486-0766Fax:(978)486-0755support@2.Getting Started2.Getting StartedInteractive optimizer offers an intuitive graphical user interface.Its multi-window design makes it easy to initiate a prototype design and monitor the optimization process with the instant simulation data returned from TracePro.This manual generally assumes a working knowledge of Windows.When Interactive Optimizer launched,a MDI window is initiated for starting a new optimization plan.The Interactive Optimizer user interface consists of:•Profile editor window•Toolbox panel•Property window•Export panel•Optimization control panel•Optimization log•Options panelBelow you can find instructions for some of the most basic Surface Source Property Generator operation More:•Profile editor window•Toolbox panel•Property window•Export panel•Optimization control panel•Optimization log•Options panel2.1Interactive Optimizer InterfaceInteractive Optimizer is a pure graphical user interface application.It helps users generate many kinds of freeform geometry and simulate its optical system performance in TracePro®.Furthermore it manipulates TracePro®to accomplish the optimization through DDE channel.To understand the interfaces of Interactive Optimizer,a simple description about each child windows are necessary,they are:3.Interactive Profile EditorOptical designers always have a lot of brilliant ideas to create optical systems.The optics geometry shape that they want to use in their system it’s not a primitive geometry,like sphere or block.Thus,how to create a desired geometry shape is an important issue.Even some people can’t100%simulate their optical system in TracePro,just because of complicate model creating problem.And here,Interactive Optimizer can help designer create their complicate optical components quickly and accurately.Interactive Optimizer provides Interactive Profile Drawer to easily create geometry.In Drawer,user can use straight line and spline to draw an enclosed loop to represent geometry’s profile.And without limiting the number of node point,the profile can fully matches use’s desire.The finished profile can be directly export to TracePro as a3D solid object.Or this profile can be the initial design of a system optimization process.Furthermore,it provides real-time2D raytrace function to speed up create a better initial design.There are a lot of features,such like drawing profile,raytrace,paste background bitmap and so on,that are included in Interactive Profile Drawer.So,for convenient operation,there is an independent“Toolbox”panel to switch Profile Drawer to different function.More:•Interactive Profile Drawer-Segment•Interactive Profile Drawer-Object•Interactive Profile Drawer-Rays•Interactive Profile Drawer-Bitmap3.1Segment ModeAdd Segment/Control PointTo add a segment/control point into the segment,first right-click on the wanted position of the segment and then click on the"Add Segment/Control Pont"command from the pop-up menu.Delete Segment/Control PointRight-click on the wanted segment/control point and then click on the"Delete"command from the pop-up menu.Segment Type SelectionRight-click on the interested segment and then choose the wanted segment type from the pop-up menu. Now there are five segment types provided:•Line:Straight line is used to connect the two adjacent segment points.•Spline:Spline curve is used to fit the control points between the two adjacent segment points.•Sphere:Spherical curve is used to connect the center control point and the two adjacent segment points.•Ellipse:Elliptical curve is used to connect the center control point and the two adjacent segment points.•Conic:Conic curve is used to fit the control points and the two adjacent segment points.Adjust Object ShapeThe shape of the object can be modified by dragging the segment/control points among the segments. 3.2Object ModeAddRight-click on the editing area to determine the center position height of the new object.Then click on the "New Object"command from the pop-up menu will add a new object into the editor window.MoveSelect the wanted object by first locating the mouse on any of the segments of it.Then move the mouse cursor with the left button depressed will move the selected object.DeleteSelect the wanted object by first locating the mouse on any of the segments of it.Then right-click the mouse and select“Delete Object”from the pop-up menu will delete the selected object.3.3Rays ModeAddTo start tracing a single ray,pressing the mouse left button at the interested start position and then drag the mouse to determine the direction of the emitting ray.Two functions are also provided for generating ray array,i.e., ray fan or ray sequence:•Ray fan–First,press and drag the left button to decide the initial ray position and emit direction.Hold on the left button and,meanwhile,press the[ctrl]key.Then drag the mouse around to decide the expanding angle of the ray fan.Once done,release the mouse button and the[ctrl]key,and the ray fan will be added into the editor window.•Ray sequence-First,press and drag the left button to decide the initial ray position and emit direction.Hold on the left button and,meanwhile,press the[Shift]key.Then drag the mouse to decide the extending range of the ray sequence.Once done,release the mouse button and the[shift]key,and the ray sequence will be added into the editor window.Delete RayRight-click on the interested ray and select“Delete Ray”from the pop-up menu will delete the selected ray.Clear all raysRight-click the mouse and select“Clear all rays”from the pop-up menu will delete the whole rays.3.4Bitmap ModeAddTo paste the grabbed picture,right-click on the editing area to determine the center position of the pasted image.Then click on the"Add bitmap from clip board"command from the pop-up menu,the stored picture in the clipboard will be pasted into the editor window.DeleteRight-click on the center point of the pasted bitmap and then click on the“Delete”command from the pop-up menu will delete the pasted bitmap.AdjustThe pasted bitmap can be rotated or scaled by dragging the control points of the bitmap frame.4.ToolboxThe ToolBox Panel is the control panel for users to select the manage mode of the Profile Editor Window.In each manage mode,users can implement different actions to the displayed objects in the model.More:•Toolbox-Mode4.1ModeSegWhen Seg mode is selected,users can reshape the object profile by making adjustment to the segment/control point position in the Profile Editor Window.The way how the segment/control points are connected will base on the curve type selection of each segment.ObjWhen Obj mode is selected,users can select to add,delete,or move an arbitrary object in the model.RaysWhen Rays mode is selected,the raytrace function is enabled,and this helps give a quick check to the designmodel.Show RaysWhen Show Rays icon is checked,the traced rays will be instantly shown in the Profile Editor Window.BitmapWhen Bitmap mode is selected,users can paste,modify,or delete the grabbed image in the Profile Editor Window.Show BitmapWhen Show Bitmap icon is checked,the pasted picture will be shown as the background image in the Profile Editor Window.Opacity TunnerThrough the Opacity Tuner,users can directly tune the opacity of the pasted bitmap.Unit SelectorUsers can select the unit of the editor window to be mm,cm,or m.5.PropertyThe Property Editor allows users define the environment and object property in the model.More:•Property Editor-General Tab•Property Editor-Object Tab5.1General TabThe refractive index data are shown in the Refractive Indices ers can set the refractive index value of each item from the table.5.2Object TabThe detailed property information of an object will be shown in this ers can select to modify the item they want and the corresponding will be highlighted in the Profile Editor Window.6.ExportTo open the Export Panel,click on menu button:"Export".To generate geometry model and apply properties,use Export function to create a complete model including its optics properties in TracePro.Through DDE link,objects with the designated surface profiles can be directly added into the model window of TracePro.The creation mode and the applied property of each object can be checked and modified in the Export PanelMore:•Export Optical Element(s)•Creation Mode6.1Optical Element(s)This window generates optics object(s)in TracePro.Each object's geometry profile bases on”Editor Window”.And then,by different“Creation mode”,3D shape could be“Radial Symmetry”,“Biaxial”andproperty.Export7.OptimizationThere are4regions in the optimization window.They are“Saving Optimization Log Options”,“Optimization Variables List”,“Optical Element Export Options”and“Definitions of Optimization Operands”.All parameters in this window will determine whether Interactive Optimization Utility links TracePro successfully and how to accomplish this optimization.While everything is ready,click"Start"button to begin optimization.More:•Optimization-Options•Optimization-Variables•Optimization-Operands•Optimization-Objects7.1OptionsInteractive Optimization Utility uses DDE(Dynamic Data Exchange),a Windows protocol to share information with TracePro.To establish a full optimization,utility exports geometry to current document, commands that TracePro apply properties to exported object(s),and then initiates raytrace and saves simulation result.The whole optimization process would be saved.Thus,the file path and log file name have to be defined in advance.7.2VariablesAll variables will be listed in this panel.It’s just a simple viewer to monitor all variables in an easy way.We suggest not changing any value in this panel.That may cause some problems.The ideal way to modify variable-related values is through the Property window's Object Tab.Additional VariableIn some complicated case,we need some more advanced optimization skill to optimize our ually advanced optimization skill goes along with using After-scheme.To insert a new user-defined variable,first step is right click on this panel,and insert a user-defined variable.After setting its initial value,upper and lower limits, this variable’s name would be recognized in After-scheme.This new variable can be used to be one parameter of all commands in After-scheme.7.3OperandsAfter you have initiated the design of geometry shape,you need to set up the merit functions for you design system.For the following optimization process,it will take all operands as references and considering individual weight to evaluate the error value of each run.There are five different kinds of operands can be used.They are Flux,CIExy,CIEu’v’,Irradiance Profile and Candela Profile.Besides,each operand has different way to set up.Operand Type-FluxThe calculation of flux operand’s error value bases on the difference value between the target value and total flux of selection area on the observation plane.Operand Type-CIE u'v'&CIE xyThe calculation of CIE operand’s error value bases on the color difference on CIE map between the target color and the average color on selected region on observation plane.Operand Type-Irradiance ProfileThe calculation of Irr Profile operand’s error value bases on the irradiance/illumunance profile similaritybetween the target profile and the profile gotten from observation plane.Operand Type-FluxThe calculation of Irr Profile operand’s error value bases on the irradiance/illumunance profile similarity between the target profile and the profile gotten from observation plane.7.4ObjectsDuring optimization process,Interactive Optimizer follows the variables that optimization algorithm7.Optimizationgenerates to export one or more optics that need to be optimized into TracePro in each iteration.After creating optics,next steps are performing raytrace and analyzing its result.Here,this objects panel manages how to export optics and including applying material property on it.The detailed about exporting object,such as definition of parameters and creation mode,see Export.After-schemeThe last column named“After-scheme”is the only distinction between Export window and this panel.If there’s other specific actions must be executed after creating geometry,people can add additional code at this column.It’s compatible with TracePro Scheme Commands and all commands provided by Interactive Optimizer. Double-click the grid,a Scheme editor window pops up.After coding,press“Apply”button to save it.Scheme ExecutionTo pre-execute the content in after-scheme column,Right click on the grid,a menu pops up.Three different actions as follow:8.Optimization LogThe Optimization Log window helps user monitor the optimization progress.While performing optimization, this window shows up automatically.More:•Optimization Log-Graphs•Optimization Log-Trand Chart8.1GraphsAll iteration will be recorded by Interactive er can check each time simulation result(s)through this graph panel.And all useful analysis values are listed on this panel too.ListGraphsSwitch to Graphs tab,while the selected row is changed,the graphs panel will update to the correlated simulation result map.After selecting a row,if system saved multiple maps,user can choose analysis map through Graph selector.8.2Trand ChartThe trend chart of the Error Value is displayed in this ers can monitor the optimization process by keeping track on the Error Value.By default,this plot will be automatically updated by the simulated result throughout the optimization process.Once the optimization has multiple targets,user can choose to individually view the error value trend chart of each target or just the sum of error values for targets.Interactive Optimization use Simplex as optimization algorithm that uses4kinds of method,including Reflection,Expansion,Contraction and Shrinkage,to manipulate the simplex and try to find the local minimum. So each iteration point in trend chart uses color to indicate its corresponding Simplex Algorithm action.9.OptionsThe Options Panel allows you to specify the drawing preferences and decide the preferred way to initiate the optimization process.More:•Options-Drawing Tab•Options-Optimization Tab9.1Drawing TabIn this tab,it allows you to specify the colors for the drawing items in the profile editor window.Below is a list of drawing items that you can modify:Background,Curve,Highlight curve,Selected Curve, Ray,Highlight Ray,Selected Ray,Ray Fan,Ray Sequence9.2Optimization TabIn this tab,it allows you to specify the way of initiating the Downhill Simplex Method.Two ways are provided:[Generate by Character length]or[Generate by Variable limits].9.3Tool-Reset DDEInteractive Optimizer uses DDE(Dynamic Data Exchange),a Windows protocol to share information with TracePro.Once the utility fails keeping connection with TracePro,users just need to click the[Reset DDE]menu button and the utility will fix the issue automatically.。