经济学原理曼昆课后答案chapter4
曼昆《宏观经济学》(第6、7版)习题精编详解(第4章 货币与通货膨胀)

第4章货币与通货膨胀跨考网独家整理最全经济学考研真题,经济学考研课后习题解析资料库,您可以在这里查阅历年经济学考研真题,经济学考研课后习题,经济学考研参考书等内容,更有跨考考研历年辅导的经济学学哥学姐的经济学考研经验,从前辈中获得的经验对初学者来说是宝贵的财富,这或许能帮你少走弯路,躲开一些陷阱。
以下内容为跨考网独家整理,如您还需更多考研资料,可选择经济学一对一在线咨询进行咨询。
一、判断题1.由实际可变因素带来的货币变化的不相关性被称为货币中性,大多数经济学家认同货币中性的观点,将其作为一种对长期而不是短期的经济的好的描述。
()【答案】T【解析】货币中性是指货币对实际变量的无关性。
大多数经济学家都认同,在长期内,货币是中性的。
2.古典理论使我们可以不用涉及货币供给而研究实际变量的决定。
()【答案】T【解析】古典二分法的产生是因为在古典经济理论中,货币供给的变动不影响实际变量,货币是中性的,因此可以不用涉及货币供给而研究实际变量的决定。
3.货币可以将现在的购买力变成未来的购买力,这是货币交换媒介职能的表现。
()【答案】F【解析】货币可以将现在的购买力变成未来的购买力,这是货币作为价值储藏手段的表现。
4.未预期到的通货膨胀如果高于预期的通货膨胀,那么债权人会受益而债务人受损。
()【答案】F【解析】本题所述条件相当于未预期到的通货膨胀高于实际的通货膨胀,则债权人受损而债务人收益,因为偿还的价值比双方预期的低,也就是比实际应该支付的低。
5.如果通货膨胀被完全的预期到了,那么通货膨胀将是没有成本的。
()【答案】F【解析】预期的通货膨胀的成本包括:①由通货膨胀税产生的人们持有的货币量的扭曲;②因高通货膨胀引起企业更经常地改变它们的价格,从而产生菜单成本;③面临菜单成本的企业不会频繁改变价格,导致资源配置上的无效率;④税法的许多条款并没有考虑通货膨胀的效应;⑤通货膨胀给人们的生活带来不方便。
6.当期物价水平不仅受当期货币供给量的影响,而且还与未来货币供给量预期相关。
曼昆经济学原理第四版课后习题中文答案_百度文库

产大量物品与劳务,才能使本国居民享有在国际贸易环境下的高生活水平。
2.假定社会决定减少消费并增加投资。
A.这种变化会如何影响经济增长?答:当社会决定减少消费并增加投资时,会使社会的储蓄增加,更多的资源用于生产资本品,结果,资本存量增加,引起生产率提高和 GDP 增长得更为迅速。
B.哪些社会群体会从这种变化中获益?哪些集团会受到损害?答:拥有资本品的人会从这种变化中获益,如拥有较多的物质资本和人力资本的人。
而那些依靠政府援助的人将从这种变化中受损,因为社会减少了现期物品与劳务的消费。
3.社会选择把多少资源用于消费和把多少资源用于投资。
这些决策中的一部分涉及私人支出;另一些涉及政府支出。
A.说明代表消费的一些私人支出形式,以及代表投资的一些私人支出形式。
国民收入账户把学费作为消费支出的一部分。
按你的看法,把资源用于教育是一种消费的形式,还是一种投资的形式。
答:如家庭购买食物和服装是消费的私人支出形式,而个人购买新住房、企业对厂房和设备的投资是代表投资的私人支出形式。
资源用于教育即可以看作是一种消费的形式,也可以看作是一种投资的形式。
B.说明代表消费的一些政府支出形式,以及代表投资的一些政府支出形式。
按你的看法,我们应该把政府用于医疗计划的支出作为一种消费的形式,还是投资的形式?你能区分青年人的医疗计划和老年人的医疗计划吗?答:社会保险、国防和退伍军人津贴等是代表消费的一些政府支出形式,政府修筑铁路、核电站是代表投资的一些政府支出形式。
政府用于医疗计划的支出是一种对人力资本的投资。
与老年人的医疗计划相比,青年人的医疗计划更接近对人力资本的投资。
4.投资于资本的机会成本是什么?你认为一国有可能对资本“过度投资”吗?人力资本投资的机会成本是什么?你认为一国可能对人力资本“过度投资”吗?解释之。
答:投资于资本的机会成本是牺牲现期的物品和劳务的消费。
一国有可能对资本“过度投资”。
人力资本投资也有机会成本。
当学生上学时.他们放弃了他们本可以赚到的收入。
微观经济学原理曼昆英文第四章
Markets and Competition
▪ A market is a group of buyers and sellers of a
particular product.
▪ A competitive market is one with many buyers
and sellers, each has a negligible effect on price.
quantities demanded by all buyers at each price.
▪ Suppose Helen and Ken are the only two buyers in
the Latte market. (Qd = quantity demanded)
Price Helen’s Qd Ken’s Qd
14
Demand Curve Shifters: Expectations ▪ Expectations affect consumers’ buying decisions. ▪ Examples:
▪ If people expect their incomes to rise,
their demand for meals at expensive restaurants may increase now.
11
Demand Curve Shifters: Prices of Related Goods
▪ Two goods are substitutes if
an increase in the price of one causes an increase in demand for the other.
经济学原理曼昆课后答案chapter4

经济学原理曼昆课后答案c h a p t e r4本页仅作为文档封面,使用时可以删除This document is for reference only-rar21year.MarchProblems and Applications1. a. Cold weather damages the orange crop, reducing the supply of oranges.This can be seen in Figure 4-6 as a shift to the left in the supply curve fororanges. The new equilibrium price is higher than the old equilibriumprice.Figure 4-6b. People often travel to the Caribbean from New England to escape coldweather, so demand for Caribbean hotel rooms is high in the winter. Inthe summer, fewer people travel to the Caribbean, since northern climesare more pleasant. The result, as shown in Figure 4-7, is a shift to the leftin the demand curve. The equilibrium price of Caribbean hotel rooms isthus lower in the summer than in the winter, as the figure shows.Figure 4-7c. When a war breaks out in the Middle East, many markets are affected.Since much oil production takes place there, the war disrupts oil supplies, shifting the supply curve for gasoline to the left, as shown in Figure 4-8.The result is a rise in the equilibrium price of gasoline. With a higherprice for gasoline, the cost of operating a gas-guzzling automobile, like aCadillac, will increase. As a result, the demand for used Cadillacs willdecline, as people in the market for cars won't find Cadillacs as attractive.In addition, some people who already own Cadillacs will try to sell them.The result is that the demand curve for used Cadillacs shifts to the left,while the supply curve shifts to the right, as shown in Figure 4-9. Theresult is a decline in the equilibrium price of used Cadillacs.Figure 4-8Figure 4-92. The statement that "an increase in the demand for notebooks raises the quantityof notebooks demanded, but not the quantity supplied" is false, in general. AsFigure 4-10 shows, the increase in demand for notebooks results in an increased quantity supplied. The only way the statement would be true is if the supplycurve were perfectly inelastic, as shown in Figure 4-11.Figure 4-10Figure 4-113. a. If people decide to have more children (a change in tastes), they'll wantlarger vehicles for hauling their kids around, so the demand for minivanswill increase. Supply won't be affected. The result is a rise in both priceand quantity, as Figure 4-12 shows.Figure 4-12Figure 4-13b. If a strike by steelworkers raises steel prices, the costs of producing aminivan rise (a rise in input prices), so the supply of minivans decreases.Demand won't be affected. The result is a rise in the price of minivansand a decline in the quantity, as Figure 4-13 shows.c. The development of new automated machinery for the production ofminivans is an improvement in technology. The reduction in firms' costsresults in an increase in supply. Demand isn't affected. The result is a decline in the price of minivans and an increase in the quantity, as Figure 4-14shows.Figure 4-14Figure 4-15d. The rise in the price of station wagons affects minivan demand becausestation wagons are substitutes for minivans (that is, there's a rise in theprice of a related good). The result is an increase in demand for minivans.Supply isn't affected. In equilibrium, the price and quantity of minivansboth rise, as Figure 4-12 shows.e. The reduction in peoples' wealth caused by a stock-market crash reducestheir income, leading to a reduction in the demand for minivans, sinceminivans are a normal good. Supply isn’t affected. As a result, both priceand quantity decline, as Figure 4-15 shows.4. Technological advances that reduce the cost of producing computer chipsrepresent a decline in an input price for producing a computer. The result is ashift to the right in the supply of computers, as shown in Figure 4-16. Theequilibrium price falls and the equilibrium quantity rises, as the figure shows.Figure 4-16Figure 4-17Since computer software is a complement to computers, the increasedequilibriumquantity of computers increases the demand for software. As Figure 4-17 shows, the result is a rise in both the equilibrium price and quantity of software.Since typewriters are substitutes for computers, the increased equilibriumquantity of computers reduces the demand for typewriters. As Figure 4-18shows, the result is a decline in both the equilibrium price and quantity oftypewriters.Figure 4-185. a. When a hurricane in South Carolina damages the cotton crop, it raisesinput prices for producing sweatshirts. As a result, the supply ofsweatshirts shifts to the left, as shown in Figure 4-19. The newequilibrium has a higher price and lower quantity of sweatshirts.b. A decline in the price of leather jackets leads more people to buy leatherjackets, reducing the demand for sweatshirts. The result, shown in Figure 4-20, is a decline in both the equilibrium price and quantity of sweatshirts.Figure 4-20c. The effects of colleges requiring students to engage in morningcalisthenics in appropriate attire raises the demand for sweatshirts, asshown in Figure 4-21. The result is an increase in both the equilibriumprice and quantity of sweatshirts.d. The invention of new knitting machines increases the supply ofsweatshirts. As Figure 4-22 shows, the result is a reduction in theequilibrium price and an increase in the equilibrium quantity ofsweatshirts.Figure 4-226. A temporarily high birth rate in the year 2005 leads to opposite effects on theprice of babysitting services in the years 2010 and 2020. In the year 2010, there are more 5-year olds who need sitters, so the demand for babysitting servicesrises, as shown in Figure 4-23. The result is a higher price for babysitting services in 2010. However, in the year 2020, the increased number of 15-year olds shifts the supply of babysitting services to the right, as shown in Figure 4-24. Theresult is a decline in the price of babysitting services.Figure 4-23Figure 4-247. Since ketchup is a complement for hot dogs, when the price of hot dogs rises,the quantity demanded of hot dogs falls, thus reducing the demand for ketchup, causing both price and quantity of ketchup to fall. Since the quantity of ketchup falls, the demand for tomatoes by ketchup producers falls, so both price andquantity of tomatoes fall. When the price of tomatoes falls, producers of tomato juice face lower input prices, so the supply curve for tomato juice shifts down,causing the price of tomato juice to fall and the quantity of tomato juice to rise.The fall in the price of tomato juice causes people to substitute tomato juice for orange juice, so the demand for orange juice declines, causing the price andquantity of orange juice to fall. Now you can see clearly why a rise in the price ofhot dogs leads to a fall in price of orange juice!Figure 4-258. a. Cigars and chewing tobacco are substitutes for cigarettes, since a higherprice for cigarettes would increase demand for cigars and chewingtobacco.b. An increase in the tax on cigarettes leads to increased demand for cigarsand chewing tobacco. The result, as shown in Figure 4-25 for cigars, is arise in both the equilibrium price and quantity of cigars and chewingtobacco.c. The results in part (b) showed that a tax on cigarettes leads people tosubstitute cigars and chewing tobacco for cigarettes when the tax oncigarettes rises. To reduce total tobacco usage, policymakers might alsowant to increase the tax on cigars and chewing tobacco, or pursue sometype of public education program.9. Quantity supplied equals quantity demanded at a price of $6 and quantity of 81pizzas (Figure 4-26). If price were greater than $6, quantity supplied wouldexceed quantity demanded, so suppliers would reduce their price to gain sales.If price were less than $6, quantity demanded would exceed quantity supplied, so suppliers could raise their price without losing sales. In both cases, the price would continue to adjust until it reached $6, the only price at which there'sneither surplus nor shortage.Figure 4-2610. a. If the price of flour falls, since flour is an ingredient in bagels, the supplycurve for bagels would shift to the right. The result, shown in Figure 4-27,would be a fall in the price of bagels and a rise in the equilibrium quantityof bagels.Since cream cheese is a complement to bagels, the rise in quantitydemanded of bagels increases the demand for cream cheese, as shown inFigure 4-28. The result is a rise in both the equilibrium price and quantityof cream cheese. So, a fall in the price of flour indeed raises both theequilibrium price of cream cheese and the equilibrium quantity of bagels.Figure 4-27Figure 4-28What happens if the price of milk falls Since milk is an ingredient in cream cheese, the fall in the price of milk leads to an increase in the supply of cream cheese. This leads to a decrease in the price of cream cheese (Figure 4-29), rather than a rise in the price of cream cheese. So a fall in the price of milk couldn't have been responsible for the pattern observed.Figure 4-29Figure 4-30b. In part (a), we found that a fall in the price of flour led to a rise in theprice of cream cheese and a rise in the equilibrium quantity of bagels. Ifthe price of flour rose, the opposite would be true; it would lead to a fallin the price of cream cheese and a fall in the equilibrium quantity ofbagels. Since the question says the equilibrium price of cream cheese has risen, it couldn't have been caused by a rise in the price of flour.What happens if the price of milk rises From part (a), we found that a fallin the price of milk caused a decline in the price of cream cheese, so arise in the price of milk would cause a rise in the price of cream cheese.Since bagels and cream cheese are complements, the rise in the price ofcream cheese would reduce the demand for bagels, as Figure 4-30 shows.The result is a decline in the equilibrium quantity of bagels. So a rise inthe price of milk does cause both a rise in the price of cream cheese anda decline in the equilibrium quantity of bagels.11. a. As Figure 4-31 shows, the supply curve is vertical. The constant supplymakes sense because the basketball arena has a fixed number of seats nomatter what the price.Figure 4-31b. Quantity supplied equals quantity demanded at a price of $8. Theequilibrium quantity is 8,000 tickets.c.Price Quantity Demanded Quantity Supplied$ 4 14,0008,0008 11,0008,000128,0008,000165,0008,000202,0008,000The new equilibrium price will be $12, which equates quantity demandedto quantity supplied. The equilibrium quantity is 8,000 tickets.12. The executives are confusing changes in demand with changes in quantitydemanded. Figure 4-32 shows the demand curve prior to the marketing campaign (D1), and after the campaign (D2). The marketing campaign increased the demand for champagne, as shown, leading to a higher equilibrium price and quantity. Theinfluence of the higher price on demand is already reflected in the outcome. It's impossible for the scenario outlined by the executives to occur.Figure 4-32。
曼昆_经济学原理答案_英文版chp4
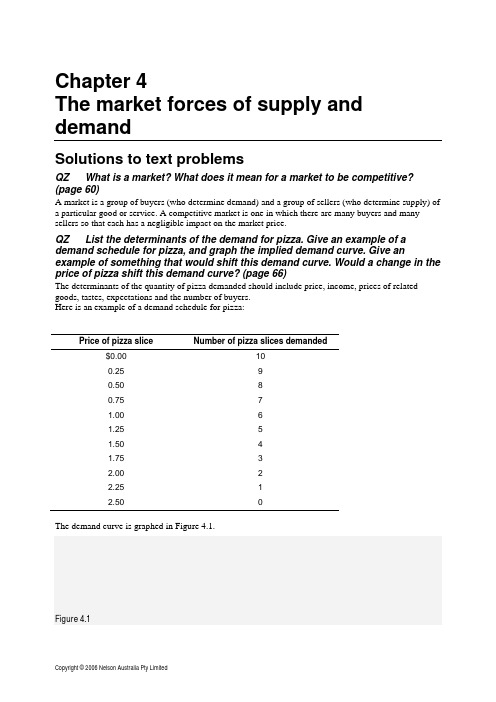
Chapter 4The market forces of supply and demandSolutions to text problemsQZ What is a market? What does it mean for a market to be competitive? (page 60)A market is a group of buyers (who determine demand) and a group of sellers (who determine supply) of a particular good or service. A competitive market is one in which there are many buyers and many sellers so that each has a negligible impact on the market price.QZ List the determinants of the demand for pizza. Give an example of a demand schedule for pizza, and graph the implied demand curve. Give an example of something that would shift this demand curve. Would a change in the price of pizza shift this demand curve? (page 66)The determinants of the quantity of pizza demanded should include price, income, prices of related goods, tastes, expectations and the number of buyers.Here is an example of a demand schedule for pizza:Price of pizza slice Number of pizza slices demanded$0.00 100.25 90.50 80.75 71.00 61.25 51.50 41.75 32.00 22.25 12.50 0The demand curve is graphed in Figure 4.1.Figure 4.1Chapter 4: The market forces of supply and demand 31Examples of things that would shift the demand curve include changes in income, prices of related goods like soft drink or hot dogs, tastes, and expectations about future income or prices.A change in the price of pizza would not shift this demand curve; it would only move from one point to another along the curve.QZ List the determinants of the supply of pizza. Give an example of a supply schedule for pizza, and graph the implied supply curve. Give an example of something that would shift this supply curve. Would a change in the price of pizza shift this supply curve? (page 71)The determinants of the quantity of pizza supplied include the price of pizza, the prices of inputs into pizza production, the technology for producing pizza, expectations about things like the future price of pizza and the number of suppliers of pizza.Here is an example of a supply schedule for pizza:Price of pizza slice Number of pizza slices supplied$0.00 00.25 1000.50 2000.75 3001.00 4001.25 5001.50 6001.75 7002.00 8002.25 9002.50 1000The supply curve is graphed in Figure 4.2.Figure 4.232 Principles of Economics, Third edition, Instructor’s ManualExamples of things that would shift the supply curve include changes in prices of inputs like tomato sauce and cheese, changes in technology like more efficient pizza ovens or automatic dough makers, and changes in expectations about the future price of pizza.A change in the price of pizza would not shift this supply curve; it would only move from one point to another along the curve.QZ Analyse what happens to the market for pizza if the price of tomatoes rises. Analyse what happens to the market for pizza if the price of hamburgers falls. (page 75)If the price of tomatoes rises, the supply curve for pizza shifts to the left because of the increased price of an input into pizza production, however there is no effect on demand. The shift to the left of the supply curve causes the equilibrium price to rise and the equilibrium quantity to decline, as Figure 4.3 shows.Figure 4.3Chapter 4: The market forces of supply and demand 33 If the price of hamburgers falls, the demand curve for pizza shifts to the left because the lower price of hamburgers will lead consumers to buy more hamburgers and less pizza, but there is no effect on supply. The shift to the left of the demand curve causes the equilibrium price to fall and the equilibrium quantity to decline, as Figure 4.4 shows.Figure 4.434 Principles of Economics, Third edition, Instructor’s ManualQuestions for review (page 79)1 A competitive market is a market in which there are many buyers and many sellers so that each has anegligible impact on the market price.2The quantity of a good that buyers demand is determined by the price of the good, income, the prices of related goods, tastes, expectations and the number of buyers.3The demand schedule is a table that shows the relationship between the price of a good and the quantity demanded. The demand curve is the downward-sloping line relating price and quantity demanded. The demand schedule and demand curve are related because the demand curve is simplya graph showing the points in the demand schedule.4The demand curve slopes downward because of the law of demand—other things equal, when the price of a good rises, the quantity demanded of the good falls. People buy less of a good when its price rises, both because they can't afford to buy as much and because they switch to purchasing other goods.5 A change in consumers' tastes leads to a shift of the demand curve. A change in price leads to amovement along the demand curve.6The quantity of a good that sellers supply is determined by the price of the good, input prices, technology, expectations and the number of suppliers.7 A supply schedule is a table showing the relationship between the price of a good and the quantity aproducer is willing and able to supply. The supply curve is the upward-sloping line relating price and quantity supplied. The supply schedule and the supply curve are related because the supply curve is simply a graph showing the points in the supply schedule.8The supply curve slopes upward because when the price is high, suppliers' profits increase, so they supply more output to the market. The result is the law of supply—other things equal, when the price of a good rises, the quantity supplied of the good also rises.9 A change in producers' technology leads to a shift in the supply curve. A change in price leads to amovement along the supply curve.10The equilibrium of a market is the point at which the demand and supply curves intersect. At the equilibrium price, the quantity of the good that buyers are willing and able to buy exactly balances the quantity that sellers are willing and able to sell. If the price is above the equilibrium price, sellers want to sell more than buyers want to buy, so there is a surplus. Sellers try to increase their sales by cutting prices; that continues until they reach the equilibrium price. If the price is below theequilibrium price, buyers want to buy more than sellers want to sell, so there is a shortage. Sellers can raise their price without losing customers; that continues until they reach the equilibrium price. 11When the price of beer rises, the demand for pies declines, because beer and pies are complements and people want to buy less beer. When we say the demand for pies declines, we mean that the demand curve for pies shifts to the left as in Figure 4.5 below. The supply curve for pies isn'taffected. With a shift to the left in the demand curve, the equilibrium price and quantity both decline, as the figure shows. Thus the quantity of pies supplied and demanded both fall. In summary, supply is unchanged, demand is decreased, quantity supplied declines, quantity demanded declines, and the price falls.Chapter 4: The market forces of supply and demand 35Figure 4.512 Prices play a vital role in market economies because they bring markets into equilibrium. If the priceis different from its equilibrium level, quantity supplied and quantity demanded aren't equal. The resulting surplus or shortage leads suppliers to adjust the price until equilibrium is restored. Prices thus serve as signals that guide economic decisions and allocate scarce resources.Problems and applications (page 80)1 a The cyclone damages the banana harvest, reducing the supply of bananas. This can be seen inFigure 4.6 as a shift to the left in the supply curve for bananas. The new equilibrium price is higher than the old equilibrium price. Figure 4.6P r i c e o f p i e sQuantity of bananasP r i c e o f b a n a n a sQuantity of pies36 Principles of Economics, Third edition, Instructor’s Manualb People often go to the pictures during school holidays so demand for picture tickets is highduring school holidays. When school holidays end, fewer people go to the pictures. The result, as shown in Figure 4.7, is a shift to the left in the demand curve. The equilibrium price of picture tickets is thus lower when school holidays end, as the figure shows. Figure 4.7c When a war breaks out in the Middle East, many markets are affected. Since much oilproduction takes place there, the war disrupts oil supplies, shifting the supply curve for petrol tothe left, as shown in Figure 4.8. The result is a rise in the equilibrium price of petrol. With a higher price for petrol, the cost of operating a big car, like a Ford Falcon, will increase. As a result, the demand for used Ford Falcons will decline, as people in the market for cars won't find Falcons as attractive. In addition, some people who already own Falcons will try to sell them. The result is that the demand curve for used Falcons shifts to the left, while the supply curve shifts to the right, as shown in Figure 4.9. The result is a decline in the equilibrium price of used Falcons.Figure 4.8Quantity of theatre tickets P r i c e o f t h e a t r e t i c k e t sP r i c e o f p e t r o l Quantity of petrolChapter 4: The market forces of supply and demand 37Figure 4.92 The statement that ‘an increase in the demand for notebooks raises the quantity of notebooksdemanded, but not the quantity supplied’ is false, in general. As Figure 4.10 shows, the increase in demand for notebooks results in an increased quantity supplied. The only way the statement would be true is if the supply curve were perfectly inelastic, as shown in Figure 4.11. Figure 4.10P r i c e o f u s e d F o r d F a l c o n sQuantity of used Ford Falcons38 Principles of Economics, Third edition, Instructor’s ManualFigure 4.113 a If people decide to have more children (a change in tastes), they'll want larger vehicles forhauling their kids around, so the demand for station wagons will increase. Supply won't be affected. The result is a rise in both price and quantity, as Figure 4.12 shows. Figure 4.12Quantity of Station WagonsP r i c e o f S t a t i o n W a g o n sChapter 4: The market forces of supply and demand 39b If a strike by steelworkers raises steel prices, the costs of producing a station wagon rise (a risein input prices), so the supply of station wagons decreases. Demand won't be affected. The result is a rise in the price of station wagons and a decline in the quantity, as Figure 4.13 shows.Figure 4.13c The development of new automated machinery for the production of station wagons is animprovement in technology. The reduction in firms' costs results in an increase in supply. Demand isn't affected. The result is a decline in the price of station wagons and an increase in the quantity, as Figure 4.14 shows.Figure 4.14d The rise in the price of minivans affects station wagon demand because minivans are substitutesfor station wagons (that is, there's a rise in the price of a related good). The result is an increase in demand for station wagons. Supply isn't affected. In equilibrium, the price and quantity of station wagons both rise, as Figure 4.12 shows.P r i c e o f S t a t i o n W a g o n sQuantity of Station WagonsP r i c e o f S t a t i o n W a g o n sQuantity of Station Wagonse The reduction in peoples' wealth caused by a stock market crash reduces their income, leading toa reduction in the demand for station wagons, since station wagons are a normal good. Supply isn’t affected. As a result, both price and quantity decline, as Figure 4.15 shows. Figure 4.154 Technological advances that reduce the cost of producing computer chips represent a decline in aninput price for producing a computer. The result is a shift to the right in the supply of computers, as shown in Figure 4.16. The equilibrium price falls and the equilibrium quantity rises, as the figure shows. Figure 4.16Quantity of Station WagonsP r i c e o f S t a t i o n W a g o n sSince computer software is a complement to computers, the increased equilibrium quantity of computers increases the demand for software. As Figure 4.17 shows, the result is a rise in both the equilibrium price and quantity of software.Figure 4.17Since typewriters are substitutes for computers, the increased equilibrium quantity of computers reduces the demand for typewriters. As Figure 4.18 shows, the result is a decline in both theequilibrium price and quantity of typewriters.Figure 4.185 a When an outbreak of ‘foot and mouth’ disease hits sheep farms in New Zealand, it raises inputprices for producing woollen jumpers. As a result, the supply of woollen jumpers shifts to the left, as shown in Figure 4.19. The new equilibrium has a higher price and lower quantity of woollen jumpers. Figure 4.19b A decline in the price of leather jackets leads more people to buy leather jackets, reducing thedemand for woollen jumpers. The result, shown in Figure 4.20, is a decline in both theequilibrium price and quantity of woollen jumpers.Figure 4.20Quantity of woollen jumpers P r i c e o f w o o l l e n j u m p e r sQuantity of woollen jumpersP r i c e o f w o o l l e n j u m p e r sc Kylie wearing a woollen jumper raises the demand for woollen jumpers, as shown in Figure4.21. The result is an increase in both the equilibrium price and quantity of woollen jumpers. Figure 4.21d The invention of new knitting machines increases the supply of woollen jumpers. As Figure 4.22shows, the result is a reduction in the equilibrium price and an increase in the equilibriumquantity of woollen jumpers.Figure 4.22P r i c e o f W o o l l e n J u m p e r sQuantity of Woollen Jumpers Quantity of Woollen JumpersP r i c e o f W o o l l e n J u m p e r s6 A temporarily high birth rate in the year 2005 leads to opposite effects on the price of babysittingservices in the years 2010 and 2020. In the year 2010, there are more 5-year-olds who need sitters, so the demand for babysitting services rises, as shown in Figure 4.23. The result is a higher price for babysitting services in 2010. However, in the year 2020, the increased number of 15-year-olds shifts the supply of babysitting services to the right, as shown in Figure 4.24. The result is a decline in the price of babysitting services.Figure 4.23Figure 4.247Since tomato sauce is a complement for hot dogs, when the price of hot dogs rises, the quantity demanded of hot dogs falls, thus reducing the demand for tomato sauce, causing both price and quantity of tomato sauce to fall. Since the quantity of tomato sauce falls, the demand for tomatoes by tomato sauce producers falls, so both price and quantity of tomatoes fall. When the price of tomatoes falls, producers of tomato juice face lower input prices, so the supply curve for tomato juice shifts down, causing the price of tomato juice to fall and the quantity of tomato juice to rise. The fall in the price of tomato juice causes people to substitute tomato juice for orange juice, so the demand for orange juice declines, causing the price and quantity of orange juice to fall. Now you can see clearly why a rise in the price of hot dogs leads to a fall in price of orange juice!8 a Cigars and chewing tobacco are substitutes for cigarettes, since a higher price for cigaretteswould increase demand for cigars and pipe tobacco.b An increase in the tax on cigarettes leads to increased demand for cigars and pipe tobacco. Theresult, as shown in Figure 4.25 for cigars, is a rise in both the equilibrium price and quantity of cigars and pipe tobacco.Figure 4.25c The results in part (b) showed that a tax on cigarettes leads people to substitute cigars and pipetobacco for cigarettes when the tax on cigarettes rises. To reduce total tobacco usage,policymakers might also want to increase the tax on cigars and pipe tobacco, or pursue sometype of public education program.9Quantity supplied equals quantity demanded at a price of $6 and quantity of 81 pizzas (Figure 4.26).If price were greater than $6, quantity supplied would exceed quantity demanded, so suppliers would reduce their price to gain sales. If price were less than $6, quantity demanded would exceed quantity supplied, so suppliers could raise their price without losing sales. In both cases, the price would continue to adjust until it reached $6, the only price at which there is neither surplus nor shortage. Figure 4.2610 a If the price of flour falls, since flour is an ingredient in bagels, the supply curve for bagels wouldshift to the right. The result, shown in Figure 4.27, would be a fall in the price of bagels and arise in the equilibrium quantity of bagels. Since cream cheese is a complement to bagels, the rise in quantity demanded of bagels increases the demand for cream cheese, as shown in Figure 4.28.The result is a rise in both the equilibrium price and quantity of cream cheese. So, a fall in theprice of flour indeed raises both the equilibrium price of cream cheese and the equilibriumquantity of bagels.Figure 4.27Figure 4.28What happens if the price of milk falls? Since milk is an ingredient in cream cheese, the fall in the price of milk leads to an increase in the supply of cream cheese. This leads to a decrease in the price of cream cheese (Figure 4.29), rather than a rise in the price of cream cheese. So a fall in the price of milk couldn't have been responsible for the pattern observed.Figure 4.29b In part (a), we found that a fall in the price of flour led to a rise in the price of cream cheese anda rise in the equilibrium quantity of bagels. If the price of flour rose, the opposite would be true;it would lead to a fall in the price of cream cheese and a fall in the equilibrium quantity ofbagels. Since the question says the equilibrium price of cream cheese has risen, it couldn't have been caused by a rise in the price of flour.What happens if the price of milk rises? From part (a), we found that a fall in the price of milk caused a decline in the price of cream cheese, so a rise in the price of milk would cause a rise in the price of cream cheese. Since bagels and cream cheese are complements, the rise in the price of cream cheese would reduce the demand for bagels, as Figure 4.30 shows. The result is adecline in the equilibrium quantity of bagels. So a rise in the price of milk does cause both a rise in the price of cream cheese and a decline in the equilibrium quantity of bagels.Figure 4.3011 a As Figure 4.31 shows, the supply curve is vertical. The constant supply makes sense because thepicture theatre has a fixed number of seats no matter what the price.Figure 4.31b Quantity supplied equals quantity demanded at a price of $8. The equilibrium quantity is 800tickets. cPriceQuantity demandedQuantity supplied$4 1400 800 8 1100 800 12 800 800 16 500 800 20 200800The new equilibrium price will be $12, which equates quantity demanded to quantity supplied. The equilibrium quantity is 800 tickets.P r i c e o f p i c t u r e t h e a t r e t i c k e t sQuantity of picture theatre tickets 80012The executives are confusing changes in demand with changes in quantity demanded. Figure 4.32 shows the demand curve prior to the marketing campaign (D1), and after the campaign (D2). The marketing campaign increased the demand for champagne, as shown, leading to a higher equilibrium price and quantity. The influence of the higher price on demand is already reflected in the outcome.It's impossible for the scenario outlined by the executives to occur.Figure 4.3213 At equilibrium Q S=Q D. Therefore here:1400 + 700P = 1600 – 300P1000P = 200P = $0.20The equilibrium price is $0.20 per bar of chocolate. Substitute this into either Q S or Q D to get the equilibrium quantity of 1540 bars of chocolate.。
曼昆经济学原理英文版答案
曼昆经济学原理英文版答案As the creator of the Baidu Wenku document "Principles of Economics by Mankiw (English Version) Answers", I would like to provide a comprehensive guide to the solutions of the questions in the book. This document aims to help students better understand the principles of economics and improve their problem-solving abilities.Chapter 1: Ten Principles of Economics。
1. People face trade-offs.2. The cost of something is what you give up to get it.3. Rational people think at the margin.4. People respond to incentives.5. Trade can make everyone better off.6. Markets are usually a good way to organize economic activity.7. Governments can sometimes improve economic outcomes.8. The standard of living depends on a country's production.9. Prices rise when the government prints too much money.10. Society faces a short-run trade-off between inflation and unemployment.Chapter 2: Thinking Like an Economist。
曼昆经济学原理英文版教案加习题答案第4章THE MARKET FORCES OF SUPPLY AND DEMAND
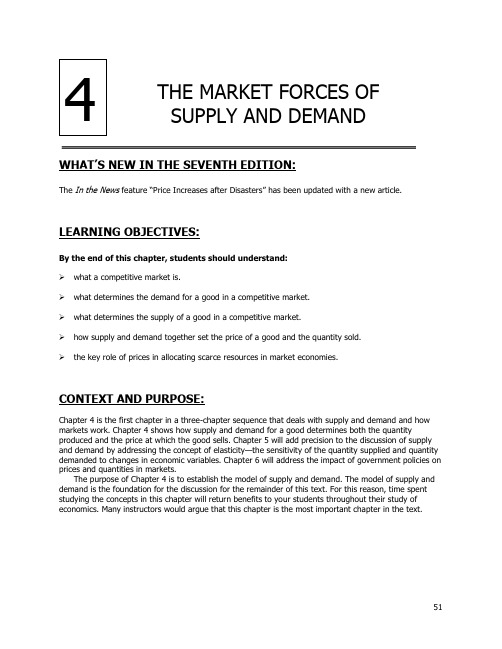
51WHAT’S NEW IN THE S EVENTH EDITION:The In the News feature “Price Increases after Disasters” has been updated with a new article.LEARNING OBJECTIVES:By the end of this chapter, students should understand:➢ what a competitive market is.➢ what determines the demand for a good in a competitive market.➢ what determines the supply of a good in a competitive market.➢ how supply and demand together set the price of a good and the quantity sold.➢ the key role of prices in allocating scarce resources in market economies.CONTEXT AND PURPOSE:Chapter 4 is the first chapter in a three-chapter sequence that deals with supply and demand and how markets work. Chapter 4 shows how supply and demand for a good determines both the quantity produced and the price at which the good sells. Chapter 5 will add precision to the discussion of supply and demand by addressing the concept of elasticity —the sensitivity of the quantity supplied and quantity demanded to changes in economic variables. Chapter 6 will address the impact of government policies on prices and quantities in markets.The purpose of Chapter 4 is to establish the model of supply and demand. The model of supply and demand is the foundation for the discussion for the remainder of this text. For this reason, time spent studying the concepts in this chapter will return benefits to your students throughout their study of economics. Many instructors would argue that this chapter is the most important chapter in the text.THE MARKET FORCES OF SUPPLY AND DEMAND52 ❖Chapter 4/The Market Forces of Supply and DemandKEY POINTS:• Economists use the model of supply and demand to analyze competitive markets. In a competitive market, there are many buyers and sellers, each of whom has little or no influence on the market price.• The demand curve shows how the quantity of a good demanded depends on the price. According to the law of demand, as the price of a good falls, the quantity demanded rises. Therefore, the demand curve slopes downward.• In addition to price, other determinants of how much consumers want to buy include income, the prices of substitutes and complements, tastes, expectations, and the number of buyers. If one of these factors changes, the demand curve shifts.• The supply curve shows how the quantity of a good supplied depends on the price. According to the law of supply, as the price of a good rises, the quantity supplied rises. Therefore, the supply curve slopes upward.• In addition to price, other determinants of how much producers want to sell include input prices, technology, expectations, and the number of sellers. If one of these factors changes, the supply curve shifts.• The intersection of the supply and demand curves determines the market equilibrium. At the equilibrium price, the quantity demanded equals the quantity supplied.• The behavior of buyers and sellers naturally drives markets toward their equilibrium. When the market price is above the equilibrium price, there is a surplus of the good, which causes the market price to fall. When the market price is below the equilibrium price, there is a shortage, which causes the market price to rise.• To analyze how any event influences a market, we use the supply-and-demand diagram to examine how the event affects equilibrium price and quantity. To do this we follow three steps. First, we decide whether the event shifts the supply curve or the demand curve (or both). Second, we decide which direction the curve shifts. Third, we compare the new equilibrium with the initial equilibrium.• In market economies, prices are the signals that guide economic decisions and thereby allocate scarce resources. For every good in the economy, the price ensures that supply and demand are in balance. The equilibrium price then determines how much of the good buyers choose to consume and how much sellers choose to produce.Chapter 4/The Market Forces of Supply and Demand ❖ 53CHAPTER OUTLINE: I. Markets and CompetitionA. What Is a Market?1. Definition of market: a group of buyers and sellers of a particular good or service.2. Markets can take many forms and may be organized (agricultural commodities) or lessorganized (ice creamB. What Is Competition?1. Definition of competitive market: a market in which there are so many buyers andso many sellers that each has a negligible impact on the market price.2. Each buyer knows that there are several sellers from which to choose. Sellers know that each buyer purchases only a small amount of the total amount sold.C. In this chapter, we will assume that markets are perfectly competitive.1. Characteristics of a perfectly competitive market:a. The goods being offered for sale are exactly the same.b. The buyers and sellers are so numerous that no single buyer or seller has any influence over the market price.2. Because buyers and sellers must accept the market price as given, they are often called "price takers."3. Not all goods are sold in a perfectly competitive market.a. A market with only one seller is called a monopoly market.b. Other markets fall between perfect competition and monopoly.54 ❖ Chapter 4/The Market Forces of Supply and DemandD. We will start by studying perfect competition.1. Perfectly competitive markets are the easiest to analyze because buyers and sellers take the price as a given.2. Because some degree of competition is present in most markets, many of the lessons that we learn by studying supply and demand under perfect competition apply in morecomplicated markets.II. DemandA. The Demand Curve: The Relationship between Price and Quantity Demanded1. Definition of quantity demanded: the amount of a good that buyers are willing andable to purchase.2. One important determinant of quantity demanded is the price of the product.a. Quantity demanded is negatively related to price. This implies that the demand curve isdownward sloping.b. Definition of law of demand: the claim that, other things being equal, thequantity demanded of a good falls when the price of the good rises .3. Definition of demand schedule: a table that shows the relationship between theprice of a good and the quantity demanded. Price of Ice-Cream ConeQuantity of Cones Demanded$0.0012 $0.5010 $1.008 $1.506 $2.004 $2.502 $3.00Figure 1Make sure that you explain that, when we discuss the relationship between quantity demanded and price, we hold all other variables constant. You will need toemphasize this more than once to ensure that students understand why a change inprice leads to a movement along the demand curve.Chapter 4/The Market Forces of Supply and Demand ❖ 554. Definition of demand curve: a graph of the relationship between the price of a good and the quantity demanded.a. Price is generally drawn on the vertical axis.b. Quantity demanded is represented on the horizontal axis. B. Market Demand versus Individual Demand1. The market demand is the sum of all of the individual demands for a particular good orservice.2. The demand curves are summed horizontally —meaning that the quantities demanded are added up for each level of price.3. The market demand curve shows how the total quantity demanded of a good varies with the price of the good, holding constant all other factors that affect how much consumers want to buy.C. Shifts in the Demand Curve1. Because the market demand curve holds other things constant, it need not be stable overtime.56 ❖ Chapter 4/The Market Forces of Supply and Demand2. If any of these other factors change, the demand curve will shift.a. An increase in demand is represented by a shift of the demand curve to the right.b. A decrease in demand is represented by a shift of the demand curve to the left.3. Incomea. The relationship between income and quantity demanded depends on what type of good the product is.b. Definition of normal good: a good for which, other things equal, an increase in income leads to an increase in demand.c. Definition of inferior good: a good for which, other things equal, an increase inincome leads to a decrease in demand.4. Prices of Related Goodsa. Definition of substitutes: two goods for which an increase in the price of one good leads to an increase in the demand for the other.b. Definition of complements: two goods for which an increase in the price of one good leads to a decrease in the demand for the other.5. Tastes6. Expectationsa. Future incomeb. Future prices7. Number of BuyersChapter 4/The Market Forces of Supply and Demand ❖57D. Case Study: Two Ways to Reduce the Quantity of Smoking Demanded1. Public service announcements, mandatory health warnings on cigarette packages, and theprohibition of cigarette advertising on television are policies designed to reduce the demandfor cigarettes (and shift the demand curve to the left).2. Raising the price of cigarettes (through tobacco taxes) lowers the quantity of cigarettesdemanded.a. The demand curve does not shift in this case, however.b. An increase in the price of cigarettes can be shown by a movement along the originaldemand curve.3. Studies have shown that a 10% increase in the price of cigarettes causes a 4% reduction inthe quantity of cigarettes demanded. For teens, a 10% increase in price leads to a 12% dropin quantity demanded.4. Studies have also shown that a decrease in the price of cigarettes is associated with greateruse of marijuana. Thus, it appears that tobacco and marijuana are complements.III. SupplyA. The Supply Curve: The Relationship between Price and Quantity Supplied1. Definition of quantity supplied: the amount of a good that sellers are willing andable to sell.a. Quantity supplied is positively related to price. This implies that the supply curve will beupward sloping.b. Definition of law of supply: the claim that, other things equal, the quantitysupplied of a good rises when the price of the good rises.2. Definition of supply schedule: a table that shows the relationship between the priceof a good and the quantity supplied.58 ❖ Chapter 4/The Market Forces of Supply and Demand3. Definition of supply curve: a graph of the relationship between the price of a good and the quantity supplied. Price of Ice-Cream ConeQuantity of Cones Supplied$0.000 $0.50 0 $1.001 $1.502 $2.003 $2.504 $3.005B. Market Supply versus Individual Supply1. The market supply curve can be found by summing individual supply curves.2. Individual supply curves are summed horizontally at every price.3. The market supply curve shows how the total quantity supplied varies as the price of thegood varies.C. Shifts in the Supply Curve1. Because the market supply curve holds other things constant, the supply curve will shift ifany of these factors changes.a. An increase in supply is represented by a shift of the supply curve to the right.b. A decrease in supply is represented by a shift of the supply curve to the left.Figure 5Figure 7Figure 6You will want to take time to emphasize the difference between a “change in supply” and a “change in quantity supplied.”Chapter 4/The Market Forces of Supply and Demand ❖ 592. Input Prices3. Technology4. Expectations5. Number of Sellers IV. Supply and Demand TogetherA. Equilibrium1. The point where the supply and demand curves intersect is called the market’s equilibrium.2. Definition of equilibrium: a situation in which the market price has reached thelevel at which quantity supplied equals quantity demanded.3. Definition of equilibrium price: the price that balances quantity supplied andquantity demanded.4. The equilibrium price is often called the "market-clearing" price because both buyers andsellers are satisfied at this price.Table 2Figure 8 Students will benefit from seeing equilibrium using both a graph and a supply-and-demand schedule. The schedule will also make it easier for students to understand concepts such as shortages and surpluses.60 ❖Chapter 4/The Market Forces of Supply and Demand5. Definition of equilibrium quantity: the quantity supplied and the quantitydemanded at the equilibrium price.6. If the actual market price is higher than the equilibrium price, there will be a surplus of thegood.Figure 9a. Definition of surplus: a situation in which quantity supplied is greater thanquantity demanded.b. To eliminate the surplus, producers will lower the price until the market reachesequilibrium.7. If the actual price is lower than the equilibrium price, there will be a shortage of the good.a. Definition of shortage: a situation in which quantity demanded is greater thanquantity supplied.b. Sellers will respond to the shortage by raising the price of the good until the marketreaches equilibrium.8. Definition of the law of supply and demand: the claim that the price of any goodadjusts to bring the supply and demand for that good into balance.B. Three Steps to Analyzing Changes in Equilibrium 1. Decide whether the event shifts the supply or demand curve (or perhaps both). 2. Determine the direction in which the curve shifts.3. Use the supply-and-demand diagram to see how the shift changes the equilibrium price andquantity. C. Example: A change in market equilibrium due to a shift in demand —the effect of hot weather onthe market for ice cream.D. Shifts in Curves versus Movements along Curves1. A shift in the demand curve is called a "change in demand." A shift in the supply curve iscalled a "change in supply."2. A movement along a fixed demand curve is called a "change in quantity demanded." Amovement along a fixed supply curve is called a "change in quantity supplied." E. Example: A change in market equilibrium due to a shift in supply —the effect of a hurricane thatdestroys part of the sugar-cane crop and drives up the price of sugar.F. Example: Shifts in both supply and demand —the effect of hot weather and a hurricane thatdestroys part of the sugar cane crop. G. Summary1. When an event shifts the supply or demand curve, we can examine the effects on theequilibrium price and quantity.ALTERNATIVE CLASSROOM EXAMPLE:Go through these examples of events that would shift either the demand or supply of #2 lead pencils:▪ an increase in the income of consumers▪ an increase in the use of standardized exams (using opscan forms) ▪ a decrease in the price of graphite (used in the production of pencils) ▪ a decrease in the price of ink pens ▪ the start of a school year▪ new technology that lowers the cost of producing pencils.2. Table 4 reports the end results of these shifts in supply and demand.H. In the News: Price Increases after Disasters1. When a disaster strikes a region, many good experience an increase in demand or a decreasein supply resulting in upward pressure on prices.2. This article from defends price increases following natural disasters as a naturalresult of market interactions.V. Conclusion: How Prices Allocate ResourcesA. The model of supply and demand is a powerful tool for analyzing markets.B. Supply and demand together determine the prices of the economy’s goods and services.1. These prices serve as signals that guide the allocation of scarce resources in the economy.2. Prices determine who produces each good and how much of each good is produced.SOLUTIONS TO TEXT PROBLEMS:Quick Quizzes1. A market is a group of buyers (who determine demand) and a group of sellers (whodetermine supply) of a particular good or service. A perfectly competitive market is one inwhich there are many buyers and many sellers of an identical product so that each has anegligible impact on the market price.2. Here is an example of a monthly demand schedule for pizza:Price of Pizza Slice Number of Pizza Slices Demanded$ 0.00 100.25 90.50 80.75 71.00 61.25 51.50 41.75 32.00 22.25 12.50 0The demand curve is graphed in Figure 1.Figure 1Examples of things that would shift the demand curve include changes in income, prices ofrelated goods like soda or hot dogs, tastes, expectations about future income or prices, andthe number of buyers.A change in the price of pizza would not shift this demand curve; it would only lead to amovement from one point to another along the same demand curve.3. Here is an example of a monthly supply schedule for pizza:Price of Pizza Slice Number of PizzaSlices Supplied$ 0.00 00.25 1000.50 2000.75 3001.00 4001.25 5001.50 6001.75 7002.00 8002.25 9002.50 1000The supply curve is graphed in Figure 2.Figure 2Figure 3Examples of things that would shift the supply curve include changes in prices of inputs like tomato sauce and cheese, changes in technology like more efficient pizza ovens or automatic dough makers, changes in expectations about the future price of pizza, or a change in the number of sellers.A change in the price of pizza would not shift this supply curve; it would only lead to amovement from one point to another along the same supply curve.4. If the price of tomatoes rises, the supply curve for pizza shifts to the left because there hasbeen an increase in the price of an input into pizza production, but there is no shift indemand. The shift to the left of the supply curve causes the equilibrium price to rise and the equilibrium quantity to decline, as Figure 3 shows.If the price of hamburgers falls, the demand curve for pizza shifts to the left because thelower price of hamburgers will lead consumers to buy more hamburgers and fewer pizzas,but there is no shift in supply. The shift to the left of the demand curve causes theequilibrium price to fall and the equilibrium quantity to decline, as Figure 4 shows.Figure 4Questions for Review1. A competitive market is a market in which there are many buyers and many sellers of anidentical product so that each has a negligible impact on the market price. Another type ofmarket is a monopoly, in which there is only one seller. There are also other markets that fallbetween perfect competition and monopoly.2. The demand schedule is a table that shows the relationship between the price of a good andthe quantity demanded. The demand curve is the downward-sloping line relating price andquantity demanded. The demand schedule and demand curve are related because thedemand curve is simply a graph showing the points in the demand schedule.The demand curve slopes downward because of the law of demand—other things beingequal, when the price of a good rises, the quantity demanded of the good falls. People buyless of a good when its price rises, both because they cannot afford to buy as much andbecause they switch to purchasing other goods.3. A change in consumers' tastes leads to a shift of the demand curve. If the change inconsumers' tastes leads to an increase in demand, consumers want to buy more of this goodat every price level. A change in price leads to a movement along the demand curve.Because price is measured on the vertical axis, a change in the price represents a movementalong the demand curve.4. Because Popeye buys more spinach when his income falls, spinach is an inferior good for him.His demand curve for spinach shifts out to the right as a result of the decrease in his income.5. A supply schedule is a table showing the relationship between the price of a good and thequantity a producer is willing and able to supply. The supply curve is the upward-sloping linerelating price and quantity supplied. The supply schedule and the supply curve are related because the supply curve is simply a graph showing the points in the supply schedule.The supply curve slopes upward because when the price is high, suppliers' profits increase, so they supply more output to the market. The result is the law of supply—other things being equal, when the price of a good rises, the quantity supplied of the good also rises.6. A change in producers' technology leads to a shift in the supply curve. A change in priceleads to a movement along the supply curve.7. The equilibrium of a market is the point at which the quantity demanded is equal to quantitysupplied. If the price is above the equilibrium price, sellers want to sell more than buyers want to buy, so there is a surplus. Sellers try to increase their sales by cutting prices. That continues until they reach the equilibrium price. If the price is below the equilibrium price, buyers want to buy more than sellers want to sell, so there is a shortage. Sellers can raise their price without losing customers. That continues until they reach the equilibrium price.8. When the price of beer rises, the demand for pizza declines, because beer and pizza arecomplements and people want to buy less beer. When we say the demand for pizza declines, we mean that the demand curve for pizza shifts to the left as in Figure 5. The supply curve for pizza is not affected. With a shift to the left in the demand curve, the equilibrium price and quantity both decline, as the figure shows. Thus, the quantity of pizza supplied anddemanded both fall. In sum, supply is unchanged, demand is decreased, quantity supplied declines, quantity demanded declines, and the price falls.Figure 59. Prices play a vital role in market economies because they bring markets into equilibrium. Ifthe price is different from its equilibrium level, quantity supplied and quantity demanded are not equal. The resulting surplus or shortage leads suppliers to adjust the price untilequilibrium is restored. Prices thus serve as signals that guide economic decisions andallocate scarce resources.Quick Check Multiple Choice1. b2. b3. d4. b5. a6. cProblems and Applications1. a. Cold weather damages the orange crop, reducing the supply of oranges and raising theprice of oranges. This leads to a decline in the supply of orange juice because orangesare an important input in the production of orange juice. This can be seen in Figure 6 asa shift to the left in the supply curve for orange juice. The new equilibrium price is higherthan the old equilibrium price.Figure 6b. People often travel to the Caribbean from New England to escape cold weather, so thedemand for Caribbean hotel rooms is high in the winter. In the summer, fewer peopletravel to the Caribbean, because northern climates are more pleasant. The result, asshown in Figure 7, is a shift to the left in the demand curve. The equilibrium price ofCaribbean hotel rooms is thus lower in the summer than in the winter, as the figureshows.Figure 7c. When a war breaks out in the Middle East, many markets are affected. Because a largeproportion of oil production takes place there, the war disrupts oil supplies, shifting thesupply curve for gasoline to the left, as shown in Figure 8. The result is a rise in theequilibrium price of gasoline. With a higher price for gasoline, the cost of operating agas-guzzling automobile like a Cadillac will increase. As a result, the demand for usedCadillacs will decline, as people in the market for cars will not find Cadillacs as attractive.In addition, some people who already own Cadillacs will try to sell them. The result isthat the demand curve for used Cadillacs shifts to the left, while the supply curve shifts to the right, as shown in Figure 9. The result is a decline in the equilibrium price of used Cadillacs.Figure 8 Figure 92. The statement is false. As Figure 10 shows, in equilibrium the increase in demand fornotebooks results in an increased quantity demanded and the quantity supplied.Figure 10 Figure 113. a. If people decide to have more children, they will want larger vehicles for hauling theirkids around, so the demand for minivans will increase. Supply will not be affected. The result is a rise in both the price and the quantity sold, as Figure 12 shows.Figure 12 Figure 13b. If a strike by steelworkers raises steel prices, the cost of producing a minivan rises andthe supply of minivans decreases. Demand will not be affected. The result is a rise in the price of minivans and a decline in the quantity sold, as Figure 13 shows.c. The development of new automated machinery for the production of minivans is animprovement in technology. This reduction in firms' costs will result in an increase in supply. Demand is not affected. The result is a decline in the price of minivans and an increase in the quantity sold, as Figure 14 shows.Figure 14d. The rise in the price of sport utility vehicles affects minivan demand because sport utilityvehicles are substitutes for minivans. The result is an increase in demand for minivans.Supply is not affected. The equilibrium price and quantity of minivans both rise, as Figure12 shows.e. The reduction in peoples' wealth caused by a stock-market crash reduces their income,leading to a reduction in the demand for minivans, because minivans are likely a normal good. Supply is not affected. As a result, both the equilibrium price and the equilibrium quantity decline, as Figure 15 shows.Figure 154. a. DVDs and TV screens are likely to be complements because you cannot watch a DVDwithout a television. DVDs and movie tickets are likely to be substitutes because a movie can be watched at a theater or at home. TV screens and movie tickets are likely to besubstitutes for the same reason.b. The technological improvement would reduce the cost of producing a TV screen, shiftingthe supply curve to the right. The demand curve would not be affected. The result is that the equilibrium price will fall, while the equilibrium quantity will rise. This is shown inFigure 16.Figure 16c. The reduction in the price of TV screens would lead to an increase in the demand forDVDs because TV screens and DVDs are complements. The effect of this increase in the demand for DVDs is an increase in both the equilibrium price and quantity, as shown inFigure 17.Figure 17The reduction in the price of TV screens would cause a decline in the demand for movie tickets because TV screens and movie tickets are substitute goods. The decline in thedemand for movie tickets would lead to a decline in the equilibrium price and quantitysold. This is shown in Figure 18.Figure 185. Technological advances that reduce the cost of producing computer chips represent a declinein an input price for producing a computer. The result is a shift to the right in the supply of computers, as shown in Figure 19. The equilibrium price falls and the equilibrium quantity rises, as the figure shows.Figure 19Because computer software is a complement to computers, the lower equilibrium price of computers increases the demand for software. As Figure 20 shows, the result is a rise in both the equilibrium price and quantity of software.Figure 20Because typewriters are substitutes for computers, the lower equilibrium price of computers reduces the demand for typewriters. As Figure 21 shows, the result is a decline in both the equilibrium price and quantity of typewriters.Figure 216. a. When a hurricane in South Carolina damages the cotton crop, it raises input prices forproducing sweatshirts. As a result, the supply of sweatshirts shifts to the left, as shownin Figure 22. The new equilibrium price is higher and the new equilibrium quantity ofsweatshirts is lower.。
经济学原理曼昆第04章
Harcourt, Inc. items and derived items copyright © 2001 by Harcourt, Inc.
竞争: 完全及其它
完全竞争
Harcourt, Inc. items and derived items copyright © 2001 by Harcourt, Inc.
Demand Schedule 需求表
The demand schedule is a table that shows the relationship between the price of the good and the quantity demanded. 需求表 —— 表示一种物品的价格 与需求量之间关系的表格。
Harcourt, Inc. items and derived items copyright © 2001 by Harcourt, Inc.
Catherine’s Demand Schedule
凯瑟琳的需求表
P ric e
价格
$ 0 .0 0 0 .5 0 1 .0 0 1 .5 0 2 .0 0 2 .5 0 3 .0 0
Harcourt, Inc. items and derived items copyright © 2001 by Harcourt, Inc.
Markets
u A market is a group of buyers and sellers of a particular good or service.
Price of Ice-Cream Cone
曼昆哈佛大学经济学原理第四章

Markets
A market is a group of buyers and sellers of a particular good or service.
Harcourt, Inc. items and derived items copyright © 2001 by Harcourt, Inc.
Market Demand
Market demand refers to the sum of all individual demands for a particular good or service.
Harcourt, Inc. items and derived items copyright © 2001 by Harcourt, Inc.
Demand
Quantity demanded is the amount
of a good that buyers are willing and able to purchase.
Change in Quantity Demanded versus Change in Demand
Change in Demand
A shift in the demand curve, either to the left or right.
Caused by a change in a determinant other than the price.
demanded.
Harcourt, Inc. items and derived items copyright © 2001 by Harcourt, Inc.
曼昆经济学原理第六版第4章 供给与需求的市场力量课后习题答案

圣才考研网 ——考研考博专业课辅导―中国第一品牌咨询 QQ:1224978229第2篇 第4章市场如何运行供给与需求的市场力量一、概念题 1.市场(market) 答: 市场指某种物品或劳务的买者与卖者组成的一个群体。
买者作为一个群体决定了一 种物品或劳务的需求,而卖者作为一个群体决定了一种物品或劳务的供给。
市场作为商品经济的范畴,具有三层含义:一是指商品交换的场所;二是指由商品供求 双方及其中介人之间, 围绕着体现各自利益的价格而展开激烈竞争所形成的各种经济关系总 和; 三是指调节社会经济运行的一种关系。
贯穿于这三层含义并能统一于市场这一范畴的核 心是商品交换,或者说是商品流通。
2.竞争市场(competitive market) 答: 竞争市场指有许多买者和卖者, 以至于每一个人对市场价格的影响都微不足道的市 场。
竞争市场一般指完全竞争市场。
完全竞争,又称为纯粹竞争,是指不存在任何阻碍和干 扰竞争因素的市场情况, 亦即没有任何垄断因素的市场结构。
完全竞争市场需要具备以下四 个条件:①市场上有大量的买者和卖者;②市场上每一个厂商提供的商品都是同质的;③所 有的资源具有完全的流动性;④信息是完全的。
3.需求量(quantity demanded) 答: 需求量是指消费者在一定时期内, 在各种可能的价格水平下愿意而且能够购买的商 品的数量。
根据定义,如果消费者对某种商品只有购买的欲望而没有购买的能力,就不能算 作是需求。
需求必须是既有购买欲望又有购买能力的有效需求。
影响商品需求的因素有:该 商品的价格、消费者收入、其他相关商品价格、消费者偏好和消费者对未来的预期等。
在其 他影响因素不变的条件下,需求量与价格的关系可用需求曲线来表示。
一般说来,随着商品 价格的提高,消费者消费商品的数量减少。
4.需求定理(law of demand) 答:需求定理是有关物品价格与需求量之间关系的定理。
该定理的内容是:在其他条件 不变的情况下, 某商品的需求量与价格之间成反方向变动, 即需求量随着商品本身价格的上 升而减少,随商品价格的下降而增加。
(微观 宏观全)曼昆《经济学原理》(第五版)课后习题答案-中文版

曼昆《经济学原理》(第五版)习题解答目录第一章经济学十大原理 (1)第二章像经济学家一样思考 (7)第三章相互依存性与贸易的好处 (14)第四章供给与需求的市场力量 (22)第五章弹性及其应用 (31)第六章供给、需求与政府政策 (41)第七章消费者、生产者与市场效率 (50)第八章应用:赋税的代价 (58)第九章应用:国际贸易 (65)第十章外部性 (75)第十一章公共物品和公共资源 (84)第十二章税制的设计 (91)第十三章生产成本 (99)第十四章竞争市场上的企业 (109)第十五章垄断 (121)第十六章垄断竞争 (135)第十七章寡头 (143)第十八章生产要素市场 (153)第十九章收入与歧视 (162)第二十章收入不平等与贫困 (169)第二十一章消费者选择理论 (177)第二十二章微观经济学前沿 (187)第二十三章一国收入的衡量 (195)第二十四章生活费用的衡量 (204)第二十五章生产与增长 (210)第二十六章储蓄、投资和金融体系 (214)第二十七章基本金融工具 (221)第二十八章失业 (226)第一篇导言第一章经济学十大原理复习题1.列举三个你在生活中面临的重要权衡取舍的例子。
答:①大学毕业后,面临着是否继续深造的选择,选择继续上学攻读研究生学位,就意味着在今后三年中放弃参加工作、赚工资和积累社会经验的机会;②在学习内容上也面临着很重要的权衡取舍,如果学习《经济学》,就要减少学习英语或其他专业课的时间;③对于不多的生活费的分配同样面临权衡取舍,要多买书,就要减少在吃饭、买衣服等其他方面的开支。
2.看一场电影的机会成本是什么?答:看一场电影的机会成本是在看电影的时间里做其他事情所能获得的最大收益,例如:看书、打零工。
3.水是生活必需的。
一杯水的边际利益是大还是小呢?答:这要看这杯水是在什么样的情况下喝,如果这是一个人五分钟内喝下的第五杯水,那么他的边际利益很小,有可能为负;如果这是一个极度干渴的人喝下的第一杯水,那么他的边际利益将会极大。
曼昆经济学原理 第五版 课后答案 第四篇 公共部门经济学
第四篇公共部门经济学第十章外部性复习题1.举出一个负外部性的例子和一个正外部性的例子。
答:负外部性的例子:化工厂排放的化学废气,污染了环境,但它却不必承担污染的全部成本。
正外部性的例子:在临街的自家院子里种花,既美化了自己家的环境,又使邻居和路人可以欣赏到美丽的花,具有正外部性。
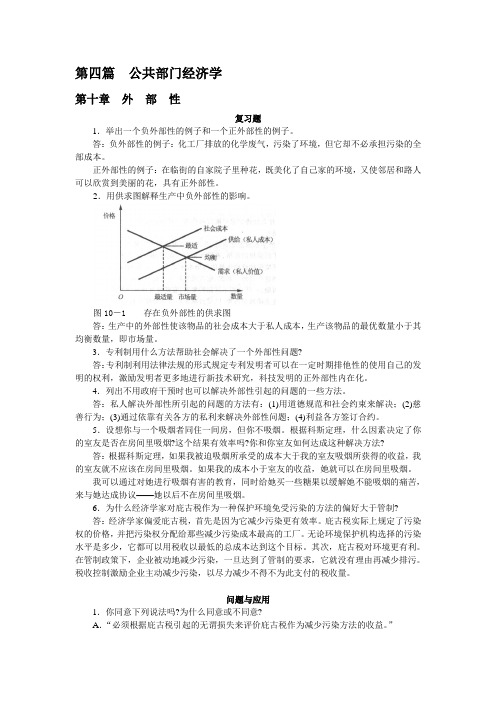
2.用供求图解释生产中负外部性的影响。
图10-1 存在负外部性的供求图答:生产中的外部性使该物品的社会成本大于私人成本,生产该物品的最优数量小于其均衡数量,即市场量。
3.专利制用什么方法帮助社会解决了一个外部性问题?答:专利制利用法律法规的形式规定专利发明者可以在一定时期排他性的使用自己的发明的权利,激励发明者更多地进行新技术研究,科技发明的正外部性内在化。
4.列出不用政府干预时也可以解决外部性引起的问题的一些方法。
答:私人解决外部性所引起的问题的方法有:(1)用道德规范和社会约束来解决;(2)慈善行为;(3)通过依靠有关各方的私利来解决外部性问题;(4)利益各方签订合约。
5.设想你与一个吸烟者同住一间房,但你不吸烟。
根据科斯定理,什么因素决定了你的室友是否在房间里吸烟?这个结果有效率吗?你和你室友如何达成这种解决方法?答:根据科斯定理,如果我被迫吸烟所承受的成本大于我的室友吸烟所获得的收益,我的室友就不应该在房间里吸烟。
如果我的成本小于室友的收益,她就可以在房间里吸烟。
我可以通过对她进行吸烟有害的教育,同时给她买一些糖果以缓解她不能吸烟的痛苦,来与她达成协议——她以后不在房间里吸烟。
6.为什么经济学家对庇古税作为一种保护环境免受污染的方法的偏好大于管制?答:经济学家偏爱庇古税,首先是因为它减少污染更有效率。
庇古税实际上规定了污染权的价格,并把污染权分配给那些减少污染成本最高的工厂。
无论环境保护机构选择的污染水平是多少,它都可以用税收以最低的总成本达到这个目标。
其次,庇古税对环境更有利。
在管制政策下,企业被动地减少污染,一旦达到了管制的要求,它就没有理由再减少排污。
曼昆《经济学原理》第6版-微观经济学分册-第4章-课后习题答案P92-P94.doc

第二篇市场如何运作第四章供给与需求的市场力量复习题1.什么是竞争市场?简单描述除了完全竞争市场之外的市场类型。
答:竞争市场是有许多买者与卖者,以至于每个人对市场价格的影响都微乎其微的市场。
除了完全竞争市场之外,还有垄断市场。
在这个市场上只有一个卖者,他决定价格。
这个卖者被称为垄断者。
还有寡头市场,在这个市场上有几个并不总是主动竞争的卖者,他们提供相似或相同的产品。
通常情况下,寡头们会尽力联合起来,避免激烈的竞争,收取较高的市场价格。
还有垄断竞争市场,这是一个有许多提供相似但不相同产品的企业的市场结构。
由于各自提供的产品不同,每个企业对产品的价格都有一定的影响力。
2.什么是需求表和需求曲线?它们如何相关联?为什么需求曲线向右下方倾斜?答:需求表是表示一种物品价格与需求量之间关系的表格,需求曲线是表示一种物品价格与需求量之间关系的图形。
需求曲线将需求表用图形的形式表现出来,需求表是需求曲线上若干个点的坐标的数字表格排列。
需求曲线向右下方倾斜是因为在其他条件不变的情况下,随着价格上升,需求量会减少。
3.消费者嗜好的变化引起了沿着需求曲线的变动,还是需求曲线的移动,价格的变化引起了沿着需求曲线的变动,还是需求曲线的移动?答:消费者嗜好的变化引起了需求曲线的移动,价格的变化引起了沿着需求曲线的变动。
4.Popeye的收入减少了,结果他买了更多的菠菜。
菠菜是低档物品,还是正常物品? Popeye菠菜的需求曲线是什么样的?答:菠菜对波匹来说是低档物品。
因为Popeye的收入减少了,他对菠菜的需求量反而增大。
波匹菠菜的需求曲线是向右下方倾斜的。
5.什么是供给表和供给曲线,它们如何关联?为什么供给曲线向石上方倾斜?答:供给表是表示一种物品价格与供给量之间关系的表格,供给曲线是表示一种物品价格与供给量之间关系的图形。
供给曲线是供给表的图形表示,供给表是供给曲线上点的坐标的数字排列。
因为在其他因素不变时,价格上升,供给量上升,所以供给曲线向右上方倾斜。
(NEW)曼昆《经济学原理(微观经济学分册)》(第6版)课后习题详解
目 录第1篇 导 言第1章 经济学十大原理第2章 像经济学家一样思考第3章 相互依存性与贸易的好处第2篇 市场如何运行第4章 供给与需求的市场力量第5章 弹性及其应用第6章 供给、需求与政府政策第3篇 市场和福利第7章 消费者、生产者与市场效率第8章 应用:赋税的代价第9章 应用:国际贸易第4篇 公共部门经济学第10章 外部性第11章 公共物品和公共资源第12章 税制的设计第5篇 企业行为与产业组织第13章 生产成本第14章 竞争市场上的企业第15章 垄 断第16章 垄断竞争第17章 寡 头第6篇 劳动市场经济学第18章 生产要素市场第19章 收入与歧视第20章 收入不平等与贫困第7篇 深入研究的论题第21章 消费者选择理论第22章 微观经济学前沿第1篇 导 言第1章 经济学十大原理一、概念题1.稀缺性(scarcity)答:经济学研究的问题和经济物品都是以稀缺性为前提的。
稀缺性指在给定的时间内,相对于人的需求而言,经济资源的供给总是不足的,也就是资源的有用性与有限性。
人类消费各种物品的欲望是无限的,满足这种欲望的物品,有的可以不付出任何代价而随意取得,称之为自由物品,如阳光和空气;但绝大多数物品是不能自由取用的,因为世界上的资源(包括物质资源和人力资源)是有限的,这种有限的、为获取它必须付出某种代价的物品,称为“经济物品”。
正因为稀缺性的客观存在,地球上就存在着资源的有限性和人类的欲望与需求的无限性之间的矛盾。
经济学的一个重要研究任务就是:“研究人们如何进行抉择,以便使用稀缺的或有限的生产性资源(土地、劳动、资本品如机器、技术知识)来生产各种商品,并把它们分配给不同的社会成员进行消费。
”也就是从经济学角度来研究使用有限的资源来生产什么、如何生产和为谁生产的问题。
2.经济学(economics)答:经济学是研究如何将稀缺的资源有效地配置给相互竞争的用途,以使人类的欲望得到最大限度满足的科学。
时下经常见诸国内报刊文献的“现代西方经济学”一词,大多也都在这个意义上使用。
曼昆宏观经济学4精品文档37页

现期财 富
财富
效用函数与风险厌恶
效用
赢得1000美元获 得的效用
输掉1000美 元损失的效
用
由于边际效用递减, 损失1000美元减少的 效用大于得到1000美 元增加的效用
财富 –1000 +1000
保险的风险管理
保险如何起作用:
面临风险的人向保险公司支付一笔保险费,作为 回报,保险公司同意接受所有或部分风险
你会参加这个游戏吗?
如果你是一个风险厌恶者,失去1000美元的痛苦
会大于赢得1000美元的快乐,并且二者的可能性 相同,所以你不会参加这个赌博
效用函数
效用是一个 人福利的主 观衡量,取 决于财富
效用
现期效 用
随着财富的增加,由
于边际效用递减,效用 函数变得越来越平坦。 一个人拥有的财富越多, 从额外一美元中得到的 效用就会越少
C. 当Gertrude停她的克尔维特敞篷车时,她懒得 把把车顶关好,因为她购买的保险能够补偿车 内的任意失窃 道德风险
18
风险的衡量
我们用标准差(衡量变量的变动,即变量的波动
可能有多大)来衡量资产的风险
资产收益标准差越大,该资产的风险越大
保险公司无法充分保护自己免受损失,所以它们会 收取一个较高的保费
结果,低风险的人有时不会购买保险,从而失去了 风险分摊的利益
主动学习 2
逆向选择还是道德风险?
指出下述情形属于逆向选择还是道德风险的例子
A. Joe在买火险之后开始在床上吸烟
B. Susan的父母都因为牙龈疾病而失去了他们的 牙齿,因此Susan购买了牙科保险
4 经济学原理
基本金融工具
本章我们将探索这些问题的答案:
曼昆哈佛大学经济学原理第四章
An increase in income...
0.50
D1
0 1 2 3 4 5 6 7 8 9 10 11 12
Movement along the demand curve. Caused by a change in the price of
the product.
Harcourt, Inc. items and derived items copyright © 2001 by Harcourt, Inc.
Market Type: A Competitive Market
A competitive market is a market. . .
with many buyers and sellers. that is not controlled by any one person. in which a narrow range of prices are established that buyers and sellers act upon.
A
0
12
Harcourt, Inc. items and derived items copyright © 2001 by Harcourt, Inc.
20
D1
Number of Cigarettes Smoked per Day
Change in Quantity Demanded versus Change in Demand
Price of Cigarettes per Pack
$4.00
Changes in Quantity Demanded
A tax that raises the
C
price of cigarettes results in a movement
曼昆《经济学原理(宏观经济学分册)》(第6版)课后习题详解

内容摘要
本书特别适用于参加研究生入学考试指定考研参考书目为曼昆《经济学原理(宏观经济学分册)》的考生, 也可供各大院校学习曼昆《经济学原理(宏观经济学分册)》的师生参考。曼昆的《经济学原理》是世界上最流 行的初级经济学教材,也被众多院校列为经济类专业考研重要参考书目。为了帮助学生更好地学习这本教材,我 们有针对性地编著了它的配套辅导用书(均提供免费下载,免费升级):1.曼昆《经济学原理(微观经济学分 册)》(第6版)笔记和课后习题详解(含考研真题)[视频讲解]2.曼昆《经济学原理(微观经济学分册)》 【教材精讲+考研真题解析】讲义与视频课程【35小时高清视频】3.曼昆《经济学原理(微观经济学分册)》 (第6版)课后习题详解4.曼昆《经济学原理(微观经济学分册)》(第5版)课后习题详解5.曼昆《经济学原 理(微观经济学分册)》配套题库【名校考研真题(视频讲解)+课后习题+章节练习+模拟试题】6.曼昆《经济 学原理(宏观经济学分册)》(第6版)笔记和课后习题详解(含考研真题)[视频讲解]7.曼昆《经济学原理 (宏观经济学分册)》【教材精讲+考研真题解析】讲义与视频课程【27小时高清视频】8.曼昆《经济学原理 (宏观经济学分册)》(第6版)课后习题详解9.曼昆《经济学原理(宏观经济学分册)》(第5版)课后习题 详解10.曼昆《经济学原理(宏观经济学分册)》配套题库【名校考研真题(视频讲解)+课后习题+章节练习+ 模拟试题】本书是曼昆《经济学原理(宏观经济学分册)》(第6版)教材的配套e书,参考国外教材的英文答案 和相关资料对曼昆《经济学原理(宏观经济学分册)》(第6版)教材每章的课后习题进行了详细的分析和解答, 并对个别知识点进行了扩展。课后习题答案久经修改,非常标准,特别适合应试作答和临考冲刺。另外,部分高 校,如武汉大学、深圳大学等,研究生入学考试部分真题就来自于该书课后习题,因此建议考生多加重视。
- 1、下载文档前请自行甄别文档内容的完整性,平台不提供额外的编辑、内容补充、找答案等附加服务。
- 2、"仅部分预览"的文档,不可在线预览部分如存在完整性等问题,可反馈申请退款(可完整预览的文档不适用该条件!)。
- 3、如文档侵犯您的权益,请联系客服反馈,我们会尽快为您处理(人工客服工作时间:9:00-18:30)。
Problems and Applications1. a. Cold weather damages the orange crop, reducing the supply of oranges. This can beseen in Figure 4-6 as a shift to the left in the supply curve for oranges. The newequilibrium price is higher than the old equilibrium price.Figure 4-6b. People often travel to the Caribbean from New England to escape cold weather, sodemand for Caribbean hotel rooms is high in the winter. In the summer, fewer peopletravel to the Caribbean, since northern climes are more pleasant. The result, as shownin Figure 4-7, is a shift to the left in the demand curve. The equilibrium price ofCaribbean hotel rooms is thus lower in the summer than in the winter, as the figureshows.Figure 4-7c. When a war breaks out in the Middle East, many markets are affected. Since much oilproduction takes place there, the war disrupts oil supplies, shifting the supply curve forgasoline to the left, as shown in Figure 4-8. The result is a rise in the equilibrium priceof gasoline. With a higher price for gasoline, the cost of operating a gas-guzzlingautomobile, like a Cadillac, will increase. As a result, the demand for used Cadillacs will decline, as people in the market for cars won't find Cadillacs as attractive. In addition,some people who already own Cadillacs will try to sell them. The result is that thedemand curve for used Cadillacs shifts to the left, while the supply curve shifts to theright, as shown in Figure 4-9. The result is a decline in the equilibrium price of usedCadillacs.Figure 4-8Figure 4-92. The statement that "an increase in the demand for notebooks raises the quantity of notebooksdemanded, but not the quantity supplied" is false, in general. As Figure 4-10 shows, theincrease in demand for notebooks results in an increased quantity supplied. The only way the statement would be true is if the supply curve were perfectly inelastic, as shown in Figure 4-11.Figure 4-10Figure 4-113. a. If people decide to have more children (a change in tastes), they'll want larger vehiclesfor hauling their kids around, so the demand for minivans will increase. Supply won'tbe affected. The result is a rise in both price and quantity, as Figure 4-12 shows.Figure 4-12Figure 4-13b. If a strike by steelworkers raises steel prices, the costs of producing a minivan rise (a risein input prices), so the supply of minivans decreases. Demand won't be affected.The result is a rise in the price of minivans and a decline in the quantity, as Figure 4-13shows.c. The development of new automated machinery for the production of minivans is animprovement in technology. The reduction in firms' costs results in an increase insupply. Demand isn't affected. The result is a decline in the price of minivans and an increase in the quantity, as Figure 4-14 shows.Figure 4-14Figure 4-15d. The rise in the price of station wagons affects minivan demand because station wagonsare substitutes for minivans (that is, there's a rise in the price of a related good). Theresult is an increase in demand for minivans. Supply isn't affected. In equilibrium,the price and quantity of minivans both rise, as Figure 4-12 shows.e. The reduction in peoples' wealth caused by a stock-market crash reduces their income,leading to a reduction in the demand for minivans, since minivans are a normal good.Supply isn’t affected. As a result, both price and quantity decline, as Figure 4-15shows.4. Technological advances that reduce the cost of producing computer chips represent a decline inan input price for producing a computer. The result is a shift to the right in the supply ofcomputers, as shown in Figure 4-16. The equilibrium price falls and the equilibrium quantityrises, as the figure shows.Figure 4-16Figure 4-17Since computer software is a complement to computers, the increased equilibrium quantity ofcomputers increases the demand for software. As Figure 4-17 shows, the result is a rise in both the equilibrium price and quantity of software.Since typewriters are substitutes for computers, the increased equilibrium quantity of computers reduces the demand for typewriters. As Figure 4-18 shows, the result is a decline in both theequilibrium price and quantity of typewriters.Figure 4-185. a. When a hurricane in South Carolina damages the cotton crop, it raises input prices forproducing sweatshirts. As a result, the supply of sweatshirts shifts to the left, asshown in Figure 4-19. The new equilibrium has a higher price and lower quantity ofsweatshirts.Figure 4-19b. A decline in the price of leather jackets leads more people to buy leather jackets,reducing the demand for sweatshirts. The result, shown in Figure 4-20, is a decline in both the equilibrium price and quantity of sweatshirts.Figure 4-20c. The effects of colleges requiring students to engage in morning calisthenics inappropriate attire raises the demand for sweatshirts, as shown in Figure 4-21. Theresult is an increase in both the equilibrium price and quantity of sweatshirts.Figure 4-21d. The invention of new knitting machines increases the supply of sweatshirts. As Figure4-22 shows, the result is a reduction in the equilibrium price and an increase in theequilibrium quantity of sweatshirts.Figure 4-226. A temporarily high birth rate in the year 2005 leads to opposite effects on the price of babysittingservices in the years 2010 and 2020. In the year 2010, there are more 5-year olds who needsitters, so the demand for babysitting services rises, as shown in Figure 4-23. The result is ahigher price for babysitting services in 2010. However, in the year 2020, the increased numberof 15-year olds shifts the supply of babysitting services to the right, as shown in Figure 4-24.The result is a decline in the price of babysitting services.Figure 4-23Figure 4-247. Since ketchup is a complement for hot dogs, when the price of hot dogs rises, the quantitydemanded of hot dogs falls, thus reducing the demand for ketchup, causing both price andquantity of ketchup to fall. Since the quantity of ketchup falls, the demand for tomatoes byketchup producers falls, so both price and quantity of tomatoes fall. When the price oftomatoes falls, producers of tomato juice face lower input prices, so the supply curve for tomato juice shifts down, causing the price of tomato juice to fall and the quantity of tomato juice to rise.The fall in the price of tomato juice causes people to substitute tomato juice for orange juice, sothe demand for orange juice declines, causing the price and quantity of orange juice to fall.Now you can see clearly why a rise in the price of hot dogs leads to a fall in price of orange juice!Figure 4-258. a. Cigars and chewing tobacco are substitutes for cigarettes, since a higher price forcigarettes would increase demand for cigars and chewing tobacco.b. An increase in the tax on cigarettes leads to increased demand for cigars and chewingtobacco. The result, as shown in Figure 4-25 for cigars, is a rise in both the equilibriumprice and quantity of cigars and chewing tobacco.c. The results in part (b) showed that a tax on cigarettes leads people to substitute cigarsand chewing tobacco for cigarettes when the tax on cigarettes rises. To reduce totaltobacco usage, policymakers might also want to increase the tax on cigars and chewingtobacco, or pursue some type of public education program.9. Quantity supplied equals quantity demanded at a price of $6 and quantity of 81 pizzas (Figure 4-26).If price were greater than $6, quantity supplied would exceed quantity demanded, so supplierswould reduce their price to gain sales. If price were less than $6, quantity demanded wouldexceed quantity supplied, so suppliers could raise their price without losing sales. In both cases, the price would continue to adjust until it reached $6, the only price at which there's neithersurplus nor shortage.Figure 4-2610. a. If the price of flour falls, since flour is an ingredient in bagels, the supply curve for bagelswould shift to the right. The result, shown in Figure 4-27, would be a fall in the price ofbagels and a rise in the equilibrium quantity of bagels.Since cream cheese is a complement to bagels, the rise in quantity demanded of bagelsincreases the demand for cream cheese, as shown in Figure 4-28. The result is a rise inboth the equilibrium price and quantity of cream cheese. So, a fall in the price of flourindeed raises both the equilibrium price of cream cheese and the equilibrium quantityof bagels.Figure 4-27Figure 4-28What happens if the price of milk falls Since milk is an ingredient in cream cheese, the fall in the price of milk leads to an increase in the supply of cream cheese. This leads to a decrease in the price of cream cheese (Figure 4-29), rather than a rise in the price of cream cheese. So a fall in the price of milk couldn't have been responsible for the pattern observed.Figure 4-29Figure 4-30b. In part (a), we found that a fall in the price of flour led to a rise in the price of creamcheese and a rise in the equilibrium quantity of bagels. If the price of flour rose, theopposite would be true; it would lead to a fall in the price of cream cheese and a fall inthe equilibrium quantity of bagels. Since the question says the equilibrium price ofcream cheese has risen, it couldn't have been caused by a rise in the price of flour.What happens if the price of milk rises From part (a), we found that a fall in the priceof milk caused a decline in the price of cream cheese, so a rise in the price of milk would cause a rise in the price of cream cheese. Since bagels and cream cheese arecomplements, the rise in the price of cream cheese would reduce the demand for bagels,as Figure 4-30 shows. The result is a decline in the equilibrium quantity of bagels. Soa rise in the price of milk does cause both a rise in the price of cream cheese and adecline in the equilibrium quantity of bagels.11. a. As Figure 4-31 shows, the supply curve is vertical. The constant supply makes sensebecause the basketball arena has a fixed number of seats no matter what the price.Figure 4-31b. Quantity supplied equals quantity demanded at a price of $8. The equilibrium quantityis 8,000 tickets.c.Price Quantity Demanded Quantity Supplied$ 414,0008,000811,0008,000128,0008,000165,0008,000202,0008,000The new equilibrium price will be $12, which equates quantity demanded to quantitysupplied. The equilibrium quantity is 8,000 tickets.12. The executives are confusing changes in demand with changes in quantity demanded. Figure4-32 shows the demand curve prior to the marketing campaign (D1), and after the campaign (D2).The marketing campaign increased the demand for champagne, as shown, leading to a higherequilibrium price and quantity. The influence of the higher price on demand is alreadyreflected in the outcome. It's impossible for the scenario outlined by the executives to occur.Figure 4-32。