系统仿真(MATLAB)实验2
实验二 二阶系统matlab仿真(dg)

利用simulink进行仿真的步骤:1.打开Matlab软件;2.在Command Window命令行>>后输入simulink并回车或点击窗口上部图标直接进入simulink界面;3.点击File-New-Modle就可以在新的界面上建立系统的仿真模型了;4.在左面的器件模型库中找到所需模型,用鼠标将器件模型拖到建立的界面上,然后用鼠标将它们用连线连起来,系统的仿真模型就建立起来了;5.点击界面上部的图标‘’进行仿真,双击示波器就可以看到仿真结果。
实验要用到的元件模型的图标及解释如下:阶跃信号:在simulink-source中可以找到,双击可以设定阶跃时间。
sum:在simulink-math operations中可以找到,双击可以改变器属性以实现信号相加还是相减;比例环节:在simulink-math operations中可以找到,双击可以改变器属性以改变比例系数;积分环节:在simulink-continues中可以找到;传函的一般数学模型表达形式:在simulink-continues中可以找到,双击可以对传递函数进行更改(通过设定系数)。
示波器:在simulink-sinks中可以找到。
实验二二阶系统的Matlab仿真一、实验目的1、研究二阶系统的特征参数―阻尼比ζ和无阻尼自然频率ωn对系统动态性能的影响。
2、利用simulink工具和MATLAB语句实现二阶系统的仿真。
3、熟悉MATLAB语句对二阶系统传函的表达形式以及阶跃响应的表达形式。
二、实验内容1、simulink仿真(标准二阶系统ωn=1,ζ=0.5)2、用Matlab语句实现二阶系统仿真(1)对于标准二阶系统,当ωn=4,改变ζ值对性能的影响-1<ζ<0(负阻尼)>> step(tf(4^2,[1,2*(-0.5)*4,4^2]))ζ<-1(负阻尼)>> step(tf(4^2,[1,2*(-1.5)*4,4^2]))ζ=0(零阻尼)>> step(tf(4^2,[1,2*0*4,4^2]))0<ζ<1(欠阻尼)>> figure>> step(tf(4^2,[1,2*0.1*4,4^2]))>>hold on>> step(tf(4^2,[1,2*0.2*4,4^2]))>> step(tf(4^2,[1,2*0.3*4,4^2]))>> step(tf(4^2,[1,2*0.4*4,4^2]))>> step(tf(4^2,[1,2*0.5*4,4^2]))>> step(tf(4^2,[1,2*0.6*4,4^2]))>> step(tf(4^2,[1,2*0.7*4,4^2]))>> step(tf(4^2,[1,2*0.8*4,4^2]))>> step(tf(4^2,[1,2*0.9*4,4^2]))ζ=1(临界阻尼)>> figure>> step(tf(4^2,[1,2*1*4,4^2]))ζ>1(过阻尼)>> hold on>> step(tf(4^2,[1,2*2.0*4,4^2]))>> step(tf(4^2,[1,2*4.0*4,4^2]))>> step(tf(4^2,[1,2*8.0*4,4^2]))(2)对于标准二阶系统,当ζ=0.5,改变ωn时的情况:>> figure>> step(tf(1^2,[1,2*0.5*1,1^2])) (ωn=1)>> hold on>> step(tf(2^2,[1,2*0.5*2,2^2])) (ωn=2)>> step(tf(4^2,[1,2*0.5*4,4^2])) (ωn=4)>> step(tf(8^2,[1,2*0.5*8,8^2])) (ωn=8)三、实验报告要求:1、记录由matlab仿真所得到的阶跃响应曲线。
MATLAB Simulink系统建模与仿真 实验报告
MATLAB/Simulink 电力系统建模与仿真实验报告姓名:******专业:电气工程及其自动化班级:*******************学号:*******************实验一无穷大功率电源供电系统三相短路仿真1.1 无穷大功率电源供电系统仿真模型构建运行MATLAB软件,点击Simulink模型构建,根据电路原理图,添加下列模块:(1)无穷大功率电源模块(Three-phase source)(2)三相并联RLC负荷模块(Three-Phase Parallel RLC Load)(3)三相串联RLC支路模块(Three-Phase Series RLC Branch)(4)三相双绕组变压器模块(Three-Phase Transformer (Two Windings))(5)三相电压电流测量模块(Three-Phase V-I Measurement)(6)三相故障设置模块(Three-Phase Fault)(7)示波器模块(Scope)(8)电力系统图形用户界面(Powergui)按电路原理图连接线路得到仿真图如下:1.2 无穷大功率电源供电系统仿真参数设置1.2.1 电源模块设置三相电压110kV,相角0°,频率50Hz,接线方式为中性点接地的Y形接法,电源电阻0.00529Ω,电源电感0.000140H,参数设置如下图:1.2.2 变压器模块变压器模块参数采用标幺值设置,功率20MVA,频率50Hz,一次测采用Y型连接,一次测电压110kV,二次侧采用Y型连接,二次侧电压11kV,经过标幺值折算后的绕组电阻为0.0033,绕组漏感为0.052,励磁电阻为909.09,励磁电感为106.3,参数设置如下图:1.2.3 输电线路模块根据给定参数计算输电线路参数为:电阻8.5Ω,电感0.064L,参数设置如下图:1.2.4 三相电压电流测量模块此模块将在变压器低压侧测量得到的电压、电流信号转变成Simulink信号,相当于电压、电流互感器的作用,勾选“使用标签(Use a label)”以便于示波器观察波形,设置电压标签“Vabc”,电流标签“Iabc”,参数设置如下图:1.2.5 故障设置模块勾选故障相A、B、C,设置短路电阻0.00001Ω,设置0.02s—0.2s发生短路故障,参数设置如下图:1.2.6 示波器模块为了得到仿真结果准确数值,可将示波器模块的“Data History”栏设置为下图所示:1.3 无穷大功率电源供电系统仿真结果及分析得到以上的电力系统参数后,可以首先计算出在变压器低压母线发生三相短路故障时短路电流周期分量幅值和冲击电流的大小,短路电流周期分量的幅值为Im=10.63kA,时间常数Ta=0.0211s,则短路冲击电流为Iim=17.3kA。
matlab 模拟 实验报告
matlab 模拟实验报告Matlab模拟实验报告引言:Matlab作为一种功能强大的数学软件,广泛应用于科学研究和工程领域。
本文将通过模拟实验的方式,探讨Matlab在信号处理和控制系统中的应用。
一、信号处理实验在信号处理领域,Matlab提供了丰富的工具和函数,可以对各种类型的信号进行处理和分析。
我们选择了音频信号作为实验对象,通过Matlab模拟实验,探索不同的信号处理技术。
1.1 信号生成与显示首先,我们使用Matlab生成一个正弦信号,并通过plot函数将其显示出来。
代码如下:```matlabt = 0:0.001:1; % 时间范围为0到1秒,采样率为1000Hzf = 10; % 信号频率为10Hzx = sin(2*pi*f*t); % 生成正弦信号plot(t, x); % 显示信号```通过运行以上代码,我们可以在Matlab的图形界面中看到一个频率为10Hz的正弦信号波形。
1.2 信号滤波接下来,我们将对生成的正弦信号进行滤波处理,以去除其中的高频噪声。
我们使用Matlab中的滤波函数fir1来实现。
代码如下:```matlabfs = 1000; % 采样率为1000Hzfc = 100; % 截止频率为100HzN = 50; % 滤波器阶数b = fir1(N, fc/(fs/2)); % 生成滤波器系数y = filter(b, 1, x); % 对信号进行滤波plot(t, y); % 显示滤波后的信号```通过运行以上代码,我们可以观察到滤波后信号中高频成分的减弱。
二、控制系统实验在控制系统领域,Matlab提供了丰富的工具和函数,可以进行系统建模、控制器设计和系统仿真等操作。
我们选择了一个简单的控制系统作为实验对象,通过Matlab模拟实验,探索不同的控制策略。
2.1 系统建模首先,我们需要对控制系统进行建模。
假设我们的控制系统是一个带有传感器、控制器和执行器的闭环系统。
《系统仿真与MATLAB》上机实验报告

上机实验报告
实验项目名称Simulink熟悉及其应用所属课程名称系统仿真与MATLAB 实验日期
班级
学号
姓名
成绩
斜坡输入模型
斜坡响应曲线
Subsystem(PID Controller)内容:
输出指令:
plot(ScopeData(:,1),ScopeData(:,2),'-r') xlabel('Time')
ylabel('Output')
title('阶跃响应输出曲线')
grid on
的数值解并绘制函数
,其初始值为:
微分方程的数值解为:x=0
Workspace输出图像:
操作代码:
plot(ScopeData_exp5.time,ScopeData_exp5.signals.values,'-r') xlabel('Time')
ylabel('Output')
实验五阶跃响应输出曲线')
grid on
输出图像:
仿真输出结果:
y(t)的图像如下所示,每条曲线对应不同的信号(F(t))来源。
说明:
1、将每一道题的程序、建立的模型放置在该题目下方;
2、小结部分为对本次实验的心得体会、思考和建议。
基于MATLAB控制系统仿真实验报告

tf 4
y0
0 1
6、求出 G1(s)
2 (s2 2s 1) 与 G2 (s)
1 (2s3
3s2
1)
的单位阶跃响应,并分别
求出状态空间模型。
解:(1) G1(s) 2 (s2 2s 1) 的状态空间模型求解如下:
function shiyan2 b1=[2];
D(z)
0.62(1 0.136z 1)(1 0.183z (1 0.045z 1)(1 0.53z 1)
1 )
分别用仿真算法得到系统在单位阶跃输入作用下的响应,系统在单位速度输
入是的输出响应。
解:(1)首先将 W1(s)转换为 W1(z),采样周期 T=0.2s,程序清单如下: function shiyan42 num=[10];den=[0.005 0.15 1 0]; ts=0.2;[nc,dc]=c2dm(num,den,ts)
INTRO(注意:intro 为一个用 MATLAB 语言编写的幻灯片程序,主要演示
常用的 MATLAB 语句运行结果。)
然后,根据现实出来的幻灯片右面按钮进行操作,可按 START——NEXT—
—NEXT 按钮一步步运行,观察。
3、自编程序并完成上机编辑,调试,运行,存盘:
(1)用 MATLAB 命令完成矩阵的各种运算,例如:
5、利用 ode23 或 ode45 求解线性时不变系统微分方程 y(t) Ay(t) ,并绘制出 y(t)
曲线,式中
A
0.5
1
1 0.5
t t0 t 如下: function xdot=fun21(t,x) A=[-0.5 1;-1 -0.5]; xdot=A*x; function fzsy22 t0=0;tf=4;tol=1e-6; x0=[0;1];trace=1; [t,x]=ode23('fun21',t0,tf,x0,tol,trace); plot(t,x) 得到的实验结果如下图所示:
电力拖动自动控制系统Matlab仿真实验报告
电力拖动自动控制系统Matlab仿真实验报告实验一单闭环转速反馈控制直流调速系统一.【实验目的】1. 加深对比例积分控制的无静差直流调速系统的理解;2. 研究反馈控制环节对系统的影响和作用 .二.【实验步骤和内容】1. 仿真模型的建立:打开模型编辑窗口,复制相关模块,修改模块参数,模块连接。
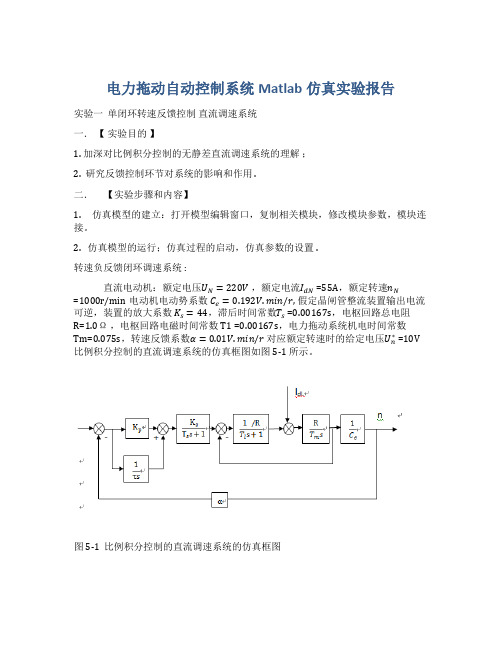
2. 仿真模型的运行;仿真过程的启动,仿真参数的设置 .转速负反馈闭环调速系统 :直流电动机:额定电压U N=220V,额定电流I dN =55A,额定转速n N=1000r/min电动机电动势系数C e=0.192V.min/r, 假定晶闸管整流装置输出电流可逆,装置的放大系数K s=44,滞后时间常数T s =0.00167s,电枢回路总电阻R=1.0Ω,电枢回路电磁时间常数T1 =0.00167s,电力拖动系统机电时间常数Tm=0.075s,转速反馈系数α=0.01V.min/r对应额定转速时的给定电压U n∗ =10V 比例积分控制的直流调速系统的仿真框图如图 5-1 所示。
图 5-1 比例积分控制的直流调速系统的仿真框图图 5-2 开环比例控制直流调速系统仿真模型图图 5-3 开环空载启动转速曲线图图 5-4 开环空载启动电流曲线图图 5-5 闭环比例控制直流调速系统仿真模型图在比例控制直流调速系统中,分别设置闭环系统开环放大系数 k=0.56 , 2.5, 30 ,观察转速曲线图,随着 K 值的增加,稳态速降减小,但当 K 值大于临界值时,系统将发生震荡并失去稳定,所以 K 值的设定要小于临界值。
当电机空载启动稳定运行后,加负载时转速下降到另一状态下运行,电流上升也随之上升。
图 5-6 k=0.56 转速曲线图图 5-7 k=0.56 电流曲线图图 5-8 k= 2.5 转速曲线图图 5-9 k= 30 转速曲线图图 5-10 闭环比例积分控制直流调速系统仿真模型图图 5-11 PI 控制转速 n 曲线图图 5-12 PI 控制电流曲线图在闭环比例积分( PI )控制下,可以实现对系统无静差调节,即, 提高了系统的稳定性。
MATLABSimulink和控制系统仿真实验报告
MATLAB/Simulink与控制系统仿真实验报告姓名:喻彬彬学号:K031541725实验1、MATLAB/Simulink 仿真基础及控制系统模型的建立一、实验目的1、掌握MATLAB/Simulink 仿真的基本知识;2、熟练应用MATLAB 软件建立控制系统模型。
二、实验设备电脑一台;MATLAB 仿真软件一个三、实验内容1、熟悉MATLAB/Smulink 仿真软件。
2、一个单位负反馈二阶系统,其开环传递函数为210()3G s s s =+。
用Simulink 建立该控制系统模型,用示波器观察模型的阶跃响应曲线,并将阶跃响应曲线导入到MATLAB 的工作空间中,在命令窗口绘制该模型的阶跃响应曲线。
3、某控制系统的传递函数为()()()1()Y s G s X s G s =+,其中250()23s G s s s+=+。
用Simulink 建立该控制系统模型,用示波器观察模型的阶跃响应曲线,并将阶跃响应曲线导入到MATLAB 的工作空间中,在命令窗口绘制该模型的阶跃响应曲线。
4、一闭环系统结构如图所示,其中系统前向通道的传递函数为320.520()0.11220s G s s s s s+=+++,而且前向通道有一个[-0.2,0.5]的限幅环节,图中用N 表示,反馈通道的增益为1.5,系统为负反馈,阶跃输入经1.5倍的增益作用到系统。
用Simulink 建立该控制系统模型,用示波器观察模型的阶跃响应曲线,并将阶跃响应曲线导入到MATLAB 的工作空间中,在命令窗口绘制该模型的阶跃响应曲线。
四、实验报告要求实验报告撰写应包括实验名称、实验内容、实验要求、实验步骤、实验结果及分析和实验体会。
五、实验思考题总结仿真模型构建及调试过程中的心得体会。
题1、(1)利用Simulink的Library窗口中的【File】→【New】,打开一个新的模型窗口。
(2)分别从信号源库(Sourse)、输出方式库(Sink)、数学运算库(Math)、连续系统库(Continuous)中,用鼠标把阶跃信号发生器(Step)、示波器(Scope)、传递函数(Transfern Fcn)和相加器(Sum)4个标准功能模块选中,并将其拖至模型窗口。
《MATLAB与控制系统仿真》实验报告
《MATLAB与控制系统仿真》实验报告实验报告:MATLAB与控制系统仿真引言在现代控制工程领域中,仿真是一种重要的评估和调试工具。
通过仿真技术,可以更加准确地分析和预测控制系统的行为和性能,从而优化系统设计和改进控制策略。
MATLAB是一种强大的数值计算软件,广泛应用于控制系统仿真。
实验目的本实验旨在掌握MATLAB在控制系统仿真中的应用,通过实践了解控制系统的建模与仿真方法,并分析系统的稳定性和性能指标。
实验内容1.建立系统模型首先,根据控制系统的实际情况,建立系统的数学模型。
通常,控制系统可以利用线性方程或差分方程进行建模。
本次实验以一个二阶控制系统为例,其传递函数为:G(s) = K / [s^2 + 2ζω_ns + ω_n^2],其中,K表示放大比例,ζ表示阻尼比,ω_n表示自然频率。
2.进行系统仿真利用MATLAB软件,通过编写代码实现控制系统的仿真。
可以利用MATLAB提供的函数来定义传递函数,并通过调整参数来模拟不同的系统行为。
例如,可以利用step函数绘制控制系统的阶跃响应图像,或利用impulse函数绘制脉冲响应图像。
3.分析系统的稳定性与性能在仿真过程中,可以通过调整控制系统的参数来分析系统的稳定性和性能。
例如,可以改变放大比例K来观察系统的超调量和调整时间的变化。
通过观察控制系统的响应曲线,可以判断系统的稳定性,并计算出性能指标,如超调量、调整时间和稳态误差等。
实验结果与分析通过MATLAB的仿真,我们得到了控制系统的阶跃响应图像和脉冲响应图像。
通过观察阶跃响应曲线,我们可以得到控制系统的超调量和调整时间。
通过改变放大比例K的值,我们可以观察到超调量的变化趋势。
同时,通过观察脉冲响应曲线,我们还可以得到控制系统的稳态误差,并判断系统的稳定性。
根据实验结果分析,我们可以得出以下结论:1.控制系统的超调量随着放大比例K的增大而增大,但当K超过一定值后,超调量开始减小。
2.控制系统的调整时间随着放大比例K的增大而减小,即系统的响应速度加快。
MATLAB通信系统仿真实验报告

MATLAB通信系统仿真实验报告实验一、MATLAB的基本使用与数学运算目的:学习MATLAB的基本操作,实现简单的数学运算程序。
内容:1-1 要求在闭区间[0,2π]上产生具有10个等间距采样点的一维数组。
试用两种不同的指令实现。
运行代码:x=[0:2*pi/9:2*pi]运行结果:1-2 用M文件建立大矩阵xx=[ 0.1 0.2 0.3 0.4 0.5 0.6 0.7 0.8 0.91.1 1.2 1.3 1.4 1.5 1.6 1.7 1.8 1.92.1 2.2 2.3 2.4 2.5 2.6 2.7 2.8 2.93.1 3.2 3.3 3.4 3.5 3.6 3.7 3.8 3.9]代码:x=[ 0.1 0.2 0.3 0.4 0.5 0.6 0.7 0.8 0.91.1 1.2 1.3 1.4 1.5 1.6 1.7 1.8 1.92.1 2.2 2.3 2.4 2.5 2.6 2.7 2.8 2.93.1 3.2 3.3 3.4 3.5 3.6 3.7 3.8 3.9]m_mat运行结果:1-3已知A=[5,6;7,8],B=[9,10;11,12],试用MATLAB分别计算A+B,A*B,A.*B,A^3,A.^3,A/B,A\B.代码:A=[5 6;7 8] B=[9 10;11 12] x1=A+B X2=A-B X3=A*B X4=A.*B X5=A^3 X6=A.^3 X7=A/B X8=A\B运行结果:1-4任意建立矩阵A,然后找出在[10,20]区间的元素位置。
程序代码及运行结果:代码:A=[12 52 22 14 17;11 10 24 03 0;55 23 15 86 5 ] c=A>=10&A<=20运行结果:1-5 总结:实验过程中,因为对软件太过生疏遇到了些许困难,不过最后通过查书与同学交流都解决了。
例如第二题中,将文件保存在了D盘,而导致频频出错,最后发现必须保存在MATLAB文件之下才可以。
电力拖动自动控制系统Matlab仿真实验报告
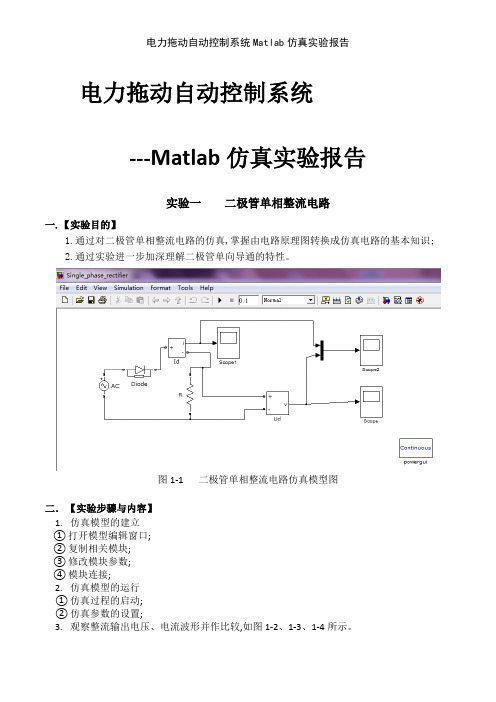
电力拖动自动控制系统---Matlab仿真实验报告实验一二极管单相整流电路一.【实验目的】1.通过对二极管单相整流电路的仿真,掌握由电路原理图转换成仿真电路的基本知识;2.通过实验进一步加深理解二极管单向导通的特性。
图1-1 二极管单相整流电路仿真模型图二.【实验步骤与内容】1.仿真模型的建立①打开模型编辑窗口;②复制相关模块;③修改模块参数;④模块连接;2.仿真模型的运行①仿真过程的启动;②仿真参数的设置;3.观察整流输出电压、电流波形并作比较,如图1-2、1-3、1-4所示。
三.【实验总结】由于负载为纯阻性,故输出电压与电流同相位,即波形相同,但幅值不等,如图1-4所示。
图1-2 整流电压输出波形图图1-3 整流电流输出波形图图1-4 整形电压、电流输出波形图实验二三相桥式半控整流电路一.【实验目的】1.通过对三相桥式半控整流电路的仿真,掌握由电路原理图转换成仿真电路的基本知识;2.研究三相桥式半控整流电路整流的工作原理与全过程。
二.【实验步骤与内容】1.仿真模型的建立:打开模型编辑窗口,复制相关模块,修改模块参数,模块连接。
2.仿真模型的运行;仿真过程的启动,仿真参数的设置。
相应的参数设置:(1)交流电压源参数U=100 V,f=25 Hz,三相电源相位依次延迟120°。
(2)晶闸管参数Rn=0、001 Ω,Lon=0、000 1 H,Vf=0 V,Rs=50 Ω,Cs=250e-6 F。
(3)负载参数R=10 Ω,L=0 H,C=inf。
(4)脉冲发生器的振幅为5 V, 周期为0、04 s ( 即频率为25 Hz), 脉冲宽度为2。
图2-1 三相桥式半控整流电路仿真模型图当α=0°时, 设为0、003 3s,0、016 6s,0、029 9 s。
图2-2 α=0°整流输出电压等波形图当α=60°时,触发信号初相位依次设为0、01s,0、0233s,0、0366s。
《MATLAB仿真技术》实验指导书2016附问题详解

实验项目及学时安排实验一 MATLAB环境的熟悉与基本运算 2学时实验二 MATLAB数值计算实验 2学时实验三 MATLAB数组应用实验 2学时实验四 MATLAB符号计算实验 2学时实验五 MATLAB的图形绘制实验 2学时实验六 MATLAB的程序设计实验 2学时实验七 MATLAB工具箱Simulink的应用实验 2学时实验八 MATLAB图形用户接口GUI的应用实验 2学时实验一 MATLAB环境的熟悉与基本运算一、实验目的1.熟悉MATLAB开发环境2.掌握矩阵、变量、表达式的各种基本运算二、实验基本知识1.熟悉MATLAB环境:MATLAB桌面和命令窗口、命令历史窗口、帮助信息浏览器、工作空间浏览器、文件和搜索路径浏览器。
2.掌握MATLAB常用命令3.MATLAB变量与运算符变量命名规则如下:(1)变量名可以由英语字母、数字和下划线组成(2)变量名应以英文字母开头(3)长度不大于31个(4)区分大小写MATLAB中设置了一些特殊的变量与常量,列于下表。
MATLAB运算符,通过下面几个表来说明MATLAB的各种常用运算符4.MATLAB的一维、二维数组的寻访表6 子数组访问与赋值常用的相关指令格式5.MATLAB的基本运算表7 两种运算指令形式和实质涵的异同表6.MATLAB的常用函数表8 标准数组生成函数表9 数组操作函数三、实验容1、学习使用help命令,例如在命令窗口输入help eye,然后根据帮助说明,学习使用指令eye(其它不会用的指令,依照此方法类推)2、学习使用clc、clear,观察command window、command history和workspace等窗口的变化结果。
3、初步程序的编写练习,新建M-file,保存(自己设定文件名,例如exerc1、exerc2、 exerc3……),学习使用MATLAB的基本运算符、数组寻访指令、标准数组生成函数和数组操作函数。
MATLAB实验报告(word文档良心出品)

《MATLAB/Simulink与控制系统仿真》实验报告专业:班级:学号:姓名:指导教师:实验1、MATLAB/Simulink 仿真基础及控制系统模型的建立一、实验目的1、掌握MATLAB/Simulink 仿真的基本知识;2、熟练应用MATLAB 软件建立控制系统模型。
二、实验设备电脑一台;MATLAB 仿真软件一个 三、实验内容1、熟悉MATLAB/Smulink 仿真软件。
2、一个单位负反馈二阶系统,其开环传递函数为210()3G s s s=+。
用Simulink 建立该控制系统模型,用示波器观察模型的阶跃响应曲线,并将阶跃响应曲线导入到MATLAB 的工作空间中,在命令窗口绘制该模型的阶跃响应曲线。
图 1系统结构图图 2示波器输出结果图3、某控制系统的传递函数为()()()1()Y s G s X s G s =+,其中250()23s G s s s+=+。
用Simulink 建立该控制系统模型,用示波器观察模型的阶跃响应曲线,并将阶跃响应曲线导入到MA TLAB 的工作空间中,在命令窗口绘制该模型的阶跃响应曲线。
图 3系统结构图 图 4 示波器输出结果图图 5 工作空间中仿真结果图形化输出4、一闭环系统结构如图所示,其中系统前向通道的传递函数为320.520()0.11220s G s s s s s+=+++g ,而且前向通道有一个[-0.2,0.5]的限幅环节,图中用N 表示,反馈通道的增益为1.5,系统为负反馈,阶跃输入经1.5倍的增益作用到系统。
用Simulink 建立该控制系统模型,用示波器观察模型的阶跃响应曲线,并将阶跃响应曲线导入到MATLAB 的工作空间中,在命令窗口绘制该模型的阶跃响应曲线。
图 6 系统结构图图 7 示波器输出结果实验2 MATLAB/Simulink 在控制系统建模中的应用一、实验目的1、掌握MATLAB/Simulink 在控制系统建模中的应用; 二、实验设备电脑一台;MA TLAB 仿真软件一个 三、实验内容1、给定RLC 网络如图所示。
自控实验-自动控制系统的MATLAB仿真分析

实验名称:自动控制系统的MATLAB仿真分析一、实验目的1.熟悉MATLAB在自动控制系统仿真中的应用;2.对自动控制系统进行仿真研究;3.掌握用MATLAB绘制自动控制系统根轨迹及对数频率特性的方法,掌握根据系统根轨迹及对数频率特性分析自动控制系统性能的方法。
二、实验设备1.计算机2.MATLAB软件三、实验内容1.用MATLAB提供的Simulink仿真软件工具对实验一中的各个典型环节及二阶系统进行阶跃响应仿真研究,将仿真获得的阶跃响应结果与模拟电路获得的阶跃响应结果进行比较。
(1)比例环节传递函数为200 ()51 G s=建立仿真模型,得到的输出结果如图所示:(2)积分环节传递函数为9.8 ()G ss=建立仿真模型,得到的输出结果如图所示:(3)一阶惯性环节传递函数为3.9 ()0.21G ss=+建立仿真模型,得到的输出结果如图所示:(4)比例积分环节传递函数为0.39781 ()0.102sG ss+=建立仿真模型,得到的输出结果如图所示:(5)比例微分环节传递函数为10 ()220s G ss=++建立仿真模型,得到的输出结果如图所示:(6)比例微分积分环节传递函数为51050 ()220sG ss s+=+++建立仿真模型,得到的输出结果如图所示:(7) 二阶系统的阶跃响应 ①0.325K ξ==传递函数为2()250()10250C s R s s s =++ 建立的仿真模型与阶跃响应仿真波形如下图所示:②0.510K ξ==传递函数为2()100()10100C s R s s s =++ 建立的仿真模型与阶跃响应仿真波形如下图所示:③0.75K ξ==传递函数为2()50()1050C s R s s s =++ 建立的仿真模型与阶跃响应仿真波形如下图所示:2. 单位负反馈系统的开环传递函数为:(1)()()(21)k s G s H s s s +=+仿真绘制K 从0~∞变化时的根轨迹,分析系统的稳定性。
MATLAB与控制系统仿真实验指导书

《MATLAB与控制系统仿真》实验指导书(2011年第一版)西安邮电学院自动化学院2011年6月目录前言 (1)MATLAB语言实验项目 (3)实验一熟悉MATLAB集成环境与基础运算 (3)实验二 MATLAB的基本计算 (7)实验三 MATLAB图形系统 (9)实验四 MATLAB程序设计 (13)实验五 MATLAB函数文件 (15)实验六MATLAB数据处理与多项式计算 (17)实验七 SIMULINK仿真实验 (21)前言MATLAB 产品家族是美国 MathWorks公司开发的用于概念设计、算法开发、建模仿真、实时实现的理想的集成环境。
是矩阵实验室(Matrix Laboratory)的简称,是美国MathWorks公司出品的商业数学软件,用于算法开发、数据可视化、数据分析以及数值计算的高级技术计算语言和交互式环境,主要包括MATLAB和SIMULINK两大部分。
MATLAB由于其完整的专业体系和先进的设计开发思路,使得 MATLAB 在多种领域都有广阔的应用空间,特别是在科学计算、建模仿真以及系统工程的设计开发上已经成为行业内的首选设计工具,它将数值分析、矩阵计算、科学数据可视化以及非线性动态系统的建模和仿真等诸多强大功能集成在一个易于使用的视窗环境中,为科学研究、工程设计以及必须进行有效数值计算的众多科学领域提供了一种全面的解决方案,并在很大程度上摆脱了传统非交互式程序设计语言(如C、Fortran)的编辑模式,代表了当今国际科学计算软件的先进水平。
MATLAB软件工具在自动化专业、测控技术与仪器和电气工程及其自动化等专业的本科生学习中,经常用来计算、仿真和设计,尤其是MATLAB软件的仿真功能,能使学生对所学知识有更加深入的理解和分析。
《MATLAB与控制系统仿真》课程,和《自动控制原理》、《现代控制理论》、《数字信号处理》、《电力电子技术》等重要的专业课程相互支撑、相辅相成,同时也有利于学生完成课程设计和毕业设计等实践教学环节。
matlab实验报告
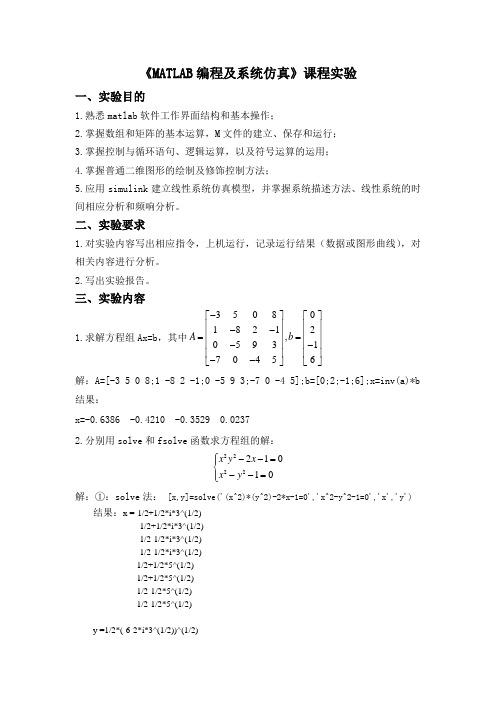
《MATLAB 编程及系统仿真》课程实验一、实验目的1.熟悉matlab 软件工作界面结构和基本操作;2.掌握数组和矩阵的基本运算,M 文件的建立、保存和运行;3.掌握控制与循环语句、逻辑运算,以及符号运算的运用;4.掌握普通二维图形的绘制及修饰控制方法;5.应用simulink 建立线性系统仿真模型,并掌握系统描述方法、线性系统的时间相应分析和频响分析。
二、实验要求1.对实验内容写出相应指令,上机运行,记录运行结果(数据或图形曲线),对相关内容进行分析。
2.写出实验报告。
三、实验内容1.求解方程组Ax=b ,其中3508018212,0593170456A b -⎡⎤⎡⎤⎢⎥⎢⎥--⎢⎥⎢⎥==⎢⎥⎢⎥--⎢⎥⎢⎥--⎣⎦⎣⎦解:A=[-3 5 0 8;1 -8 2 -1;0 -5 9 3;-7 0 -4 5];b=[0;2;-1;6];x=inv(a)*b 结果:x=-0.6386 -0.4210 -0.3529 0.0237 2.分别用solve 和fsolve 函数求方程组的解:222221010x y x x y ⎧--=⎪⎨--=⎪⎩ 解:①:solve 法: [x,y]=solve('(x^2)*(y^2)-2*x-1=0','x^2-y^2-1=0','x','y')结果:x =-1/2+1/2*i*3^(1/2)-1/2+1/2*i*3^(1/2)-1/2-1/2*i*3^(1/2) -1/2-1/2*i*3^(1/2) 1/2+1/2*5^(1/2) 1/2+1/2*5^(1/2) 1/2-1/2*5^(1/2) 1/2-1/2*5^(1/2)y =1/2*(-6-2*i*3^(1/2))^(1/2)-1/2*(-6-2*i*3^(1/2))^(1/2)1/2*(-6+2*i*3^(1/2))^(1/2)-1/2*(-6+2*i*3^(1/2))^(1/2)1/2*(2+2*5^(1/2))^(1/2)-1/2*(2+2*5^(1/2))^(1/2)1/2*(2-2*5^(1/2))^(1/2)-1/2*(2-2*5^(1/2))^(1/2○2:fsolve法:%建立函数ex1_2(x)function y=ex1_2(x)y(1)=(x(1)^2)*(x(2)^2)-2*x(1)-1; y(2)=x(1)^2-x(2)^2-1;%matlab中输入[x,y]=fsolve('ex1_2',[0 0])运行结果:x =-0.6823 -0.0000y = 0.3647 -0.53443. 用MATLAB计算20sin xdxπ⎰。
- 1、下载文档前请自行甄别文档内容的完整性,平台不提供额外的编辑、内容补充、找答案等附加服务。
- 2、"仅部分预览"的文档,不可在线预览部分如存在完整性等问题,可反馈申请退款(可完整预览的文档不适用该条件!)。
- 3、如文档侵犯您的权益,请联系客服反馈,我们会尽快为您处理(人工客服工作时间:9:00-18:30)。
实验二
一、实验目的:
1. Learn to design branch and loop statements program
2. Be familiar with relational and logical operators
3. Practice creating two-dimension plot
二、实验内容:
I. Assume that a,b,c, and d are defined, and evaluate the following expression.
A=20; b=-2; c=0; d=1;
1. a>b; ans =1
2. b>d; ans =0
3. a>b&c>d; ans =0
4. a==b; ans =0
5. a&b>c; ans =0
6. ~~b; ans =1
a=2; b=[1 –2;-0 10]; c=[0 1;2 0]; d=[-2 1 2;0 1 0];
7. ~(a>b) ans = 0 0
0 1
8. a>c&b>c ans =1 0
0 1
9. c<=d ??? Error using ==> <=
Matrix dimensions must agree
a=2; b=3; c=10; d=0;
10. a*b^2>a*c ans =0 11. d|b>a ans =1 12. (d|b)>a ans =0 a=20; b=-2; c=0; d=’Test’;
13. isinf(a/b) ans =0 14. isinf(a/c) ans =1 15. a>b&ischar(d) ans =1 16. isempty(c) ans =0
II. Write a Matlab program to solve the function
1()ln
1y x x
=- where x is a number <1. Use an if structure to verify that the value passed to the program is legal. If the value of x is legal, caculate y(x). If not ,write a suitable error message and quit. Solution: disp('This program solves for the value of a quadratic');
x=input('Enter the coefficient x='); if x>=1
disp('The value of x is legal!');
else
a=1/(1-x); y=log(a);
fprintf('y=%f\n',y);
end
III. Write out m. file and plot the figures with grids
Assume that the complex function f(t) is defined by the equation
f(t)=(0.5-0.25i)t-1.0
Plot the amplitude and phase of function for 0 4.t ≤≤ t=0:1:10; a=0.5-0.25*i; f=a*t-1.0;
subplot(211);plot(t,abs(f));title('amp');xlabel('t');ylabel('amp(f)');grid on;
subplot(212);plot(t,angle(f));title('phase');xlabel('t');ylabel('phas
e(f)');grid on;
IV. Write the Matlab statements required to calculate y(t) from the equation
22350
()350t t y t t t -+≥⎧=⎨
+<⎩
for value of t between –9 and 9 in steps of 0.5. Use loops and
branches to perform this calculation. a=input('Please enter t='); if a>=0
t=0:0.5:9; y=-3*t.^2+5; plot(t,y);
title('Plot of y(t)'); xlabel('t'); ylabel('y(t)'); grid on; else
t=0:-0.5:-9;
y=3*t.^2+5; plot(t,y);
title('Plot of y(t)'); xlabel('t'); ylabel('y(t)'); grid on; end t>=0
t<0
V. Write an m.file to evalue the equation
2()32y x x x =-+for all values of x between 0.1 and 3, in
steps of 0.1. Do this twice, once with a for loop and once with vectors. Plot the resulting function using a 3.0 thick dashed red line. First method: x=0.1:0.1:3; y=x.^2-3*x+2;
plot(x,y ,'b--','LineWidth',4.0); title('Plot of y(x)=x^2-3*x+2'); xlabel('x'); ylabel('y(x)');
grid on
Second method: n=1;
for x=0.1:0.1:3
y(n)=x.^2-3*x+2; n=n+1; end
x=0.1:0.1:3;
plot(x,y ,'b--','LineWidth',4.0);。