英语图表类作文写作技巧指导
英语图画图表作文写作技巧和方法

英语图画图表作文写作技巧和方法英文回答:Effective Techniques for Writing Image-Based Argumentative Essays.Writing image-based argumentative essays requires a unique set of skills and techniques to effectively convey your argument. Here are some strategies to enhance your writing:1. Understand the Visual Language:Grasp the visual elements of the image, such as composition, lighting, color, and perspective. These elements convey messages that support your argument. Analyze how the image evokes emotions, influences interpretations, and prompts critical thinking.2. Conduct Thorough Research:Gather information beyond the image to support your claims. Consult credible sources, including articles, books, documentaries, and interviews. This research provides evidence to bolster your argument and establishes your credibility.3. Develop a Clear Thesis Statement:Your thesis statement should present a concise,arguable claim that you will support throughout the essay.It should respond to the prompt and establish the focus of your argument.4. Analyze the Image in Detail:Use specific, descriptive language to analyze the image. Highlight relevant visual elements and explain how they support your argument. Avoid using vague or general terms.5. Provide Context:Provide background information to help readers understand the image's significance. Explain the historical, social, or cultural context that influences its meaning.6. Use Transitions Effectively:Smoothly transition between the analysis of the image and the supporting evidence you provide. Use transitional words and phrases to guide the reader through your argument.7. Consider Counterarguments:Acknowledge potential counterarguments and provide evidence to refute them. This demonstrates your understanding of different perspectives and strengthensyour argument.8. Use Visual Aids:If appropriate, incorporate additional images orvisuals to support your argument. These aids can provide further evidence and illustrate your points moreeffectively.9. Conclusion:Summarize your main argument and restate your thesis statement. Highlight the significance of your analysis and the overall impact of the image.10. Proofread Carefully:Before submitting your essay, proofread carefully for grammatical errors, typos, and clarity. Ensure that your writing is polished and persuasive.中文回答:图片图表作文写作技巧和方法。
英语图表描述的技巧
英语图表描述的技巧1. 确定图表类型:动态图表:有变化趋势2010 手机,2011 汽车品牌,2013 兼职,2014.1 城市乡村静态图表:只有比例2012 员工满意度2014.12 春节花销2.动态图表 (柱状图,线性图):①确定描述对象;②多个描述对象则分别描述;③找到变化趋势(上升,下降,不变);④具体数字可写可不写;假设写,只写首尾数字。
⑤动态图表一般用过去时态描述。
2图表英语作文怎么写认真读图,不要缺失任何一个部分。
图表作文总的来说是结合说明和表达观点的文章,所以首先就要审好题,无论是以什么形式展现出来的图表作文,我们首先都要看清楚说的内容以及它的数据,分析它要我们写什么。
三段论第一段(描述段):考试的作文三段论通常是跑不掉的,见到英语考试有图表作文不要慌。
我们还是把作文分为三部分,第一段对图表来一个总体的描述,简单概括一下列图表的内容,基本就不会有什么岔子了。
三段论第二段(分析段):分析图表内容,这一段就不是概括那么简单了,我们要横向地、纵向地对图表进行分析,特别是数据的最大值、最小值等等,通常图表作文都会有一个主题,我们分析之余要往这个方向靠。
不要排列数字,要分析出规律。
三段论第三段(表达段):这一段通常就文章的大意,或者顺着出题者的意思去进行一个"自己的看法'补充,也就是对这个现象或者是状况作出一种总结和评论。
这一点大家写作文通常都会有,就不用太担心了。
检查与修改:写完一篇作文后,如果有时间,尽量去检查一下单词有没有错误,因为图表作文通常都要用到一些平常不常用的短语,注意看看有没有对图的描述还有没有其他的遗漏,如果有尽量作出一点补充。
3英语考试的小技巧听力问答英语考试的第一大项就是英文听力,假设是做的不好会影响到后面题目的作答。
听听力前要先浏览每个听力题目,熟悉每一个听力选项,推测这一道听力小题目对话可能会说些什么,答案又有可能是哪一个。
这样带着问题听力更能加大对关键词汇的敏感度,提升听力的准确性,获得更高的分数。
英语图表作文写作技巧

英语图表作文写作技巧Writing an English essay about chart analysis requires a structured approach and attention to detail. Here are some key techniques to consider:1. Understanding the Chart: Before writing, thoroughly analyze the chart or graph provided. Identify the type of chart (bar graph, line graph, pie chart, etc.) and understand the data it presents. Pay attention to labels, axes, units, and any trends or patterns.2. Introduction: Begin your essay with an introduction that provides context for the chart. State what the chart illustrates and its significance. Briefly outline the main points you will discuss in the essay.3. Describe the Data: In the body paragraphs, describe the data shown in the chart. Provide specific details such as numbers, percentages, or trends. Use appropriate vocabulary to describe the data accurately and clearly.4. Compare and Contrast: If the chart includes multiple sets of data, compare and contrast them. Identifysimilarities and differences between the data sets and explain their implications. Use comparative language suchas "more than," "less than," "similar to," etc.5. Interpret the Data: Analyze the meaning behind the data presented in the chart. Discuss any significant trends, outliers, or patterns. Offer explanations for why certain trends may be occurring, drawing on your knowledge of the subject matter.6. Provide Examples: Support your analysis with examples or real-world scenarios that relate to the data in the chart. This helps to make your points more concrete and provides additional context for the reader.7. Use Linking Words: Use linking words and phrases to connect your ideas and make your essay flow smoothly. Examples include "however," "therefore," "in addition," "on the other hand," etc.8. Conclusion: End your essay with a conclusion that summarizes the key points you've made and reiterates the significance of the data presented in the chart. You may also offer suggestions for further analysis or implications for the future.9. Proofread: Finally, proofread your essay carefully to ensure clarity, coherence, and correctness of language. Check for grammar and spelling errors, and make any necessary revisions.By following these techniques, you can effectivelywrite an essay analyzing an English chart or graph. Remember to approach the task systematically, and take the time to understand and interpret the data before crafting your response.。
雅思英语图表作文范文(必备3篇)

雅思英语图表作文范文第1篇A类雅思各类图表作文要点及范文一.曲线图解题关键1曲线图和柱状图都是动态图,解题的切入点在于描述趋势。
2在第二段的开头部分对整个曲线进行一个阶段式的总分类,使写作层次清晰,同时也方便考官阅卷。
接下来再分类描述每个阶段的specifictrend,同时导入数据作为分类的依据。
3趋势说明。
即,对曲线的连续变化进行说明,如上升、下降、波动、持平。
以时间为比较基础的应抓住“变化”:上升、下降、或是波动。
题中对两个或两个以上的变量进行描述时应在此基础上进行比较,如变量多于两个应进行分类或有侧重的比较。
4极点说明。
即对图表中最高的、最低的点单独进行说明。
不以时间为比较基础的应注意对极点的描述。
5交点说明。
即对图表当中多根曲线的交点进行对比说明。
6不要不做任何说明就机械地导入数据,这不符合雅思的考试目的。
曲线图常用词汇动词—九大运动趋势一:表示向上:increase,rise,improve,grow,ascend,mount,aggrandize,goup,climb, take off, jump,shoot up暴涨,soar,rocket, skyrocket雅思英语图表作文范文第2篇It is said that countries are becoming similar to each other because of the global spread of the same products, which are now available for purchase almost anywhere. I strongly believe that this modern development is largely detrimental to culture and traditions worldwide.A country’s history, language and ethos are all inextricably bound up in its manufactured artefacts. If the relentless advance of international brands into every corner of the world continues, these bland packages might one day completely oust the traditional objects of a nation, which would be a loss of richness and diversity in the world, as well as the sad disappearance of t he manifestations of a place’s character. What would a Japanese tea ceremony be without its specially crafted teapot, or a Fijian kava ritual without its bowl made from a certain type of tree bark?Let us not forget either that traditional products, whether these be medicines, cosmetics, toy, clothes, utensils or food, provide employment for local people. The spread of multinational products can often bring in its wake a loss of jobs, as people urn to buying the new brand,perhaps thinking it more glamorous than the one they are used to. This eventually puts old-school craftspeople out of work.Finally, tourism numbers may also be affected, as travelers become disillusioned with finding every place just the same as the one they visited previously. To see the same products in shops the world over is boring, and does not impel visitors to open their wallets in the same way that trinkets or souvenirs unique to the particular area too.Some may argue that all people are entitled to have access to the same products, but I say that local objects suit local conditions best, and that faceless uniformity worldwide is an unwelcome and dreary prospect.Heres my full answer:The line graphs show the average monthly amount that parents in Britain spent on their children’s s porting activities and the number of British children who took part in three different sports from 2008 to is clear that parents spent more money each year on their children’s participation in sports over the six-year period. In terms of the number of children taking part, football was significantly more popular than athletics and 2008, British parents spent an average of around £20 per month on their children’s sporting activities. Parents’ spending on children’s sports increased gradually over the followi ng six years, and by 2014 the average monthly amount had risen to just over £ at participation numbers, in 2008 approximately 8 million British children played football, while only 2 million children were enrolled in swimming clubs and less than 1 million practised athletics. The figures for football participation remained relatively stable over the following 6 years. By contrast, participation in swimming almost doubled, to nearly 4 million children, and there was a near fivefold increase in the number of children doing athletics.剑桥雅思6test1大作文范文,剑桥雅思6test1大作文task2高分范文+真题答案实感。
英语图表类作文写作方法
英语图表类作文写作方法英文回答:When it comes to writing an essay on a chart or graph, there are several key points to consider. First and foremost, it is important to analyze the data presented in the chart and understand its main trends or patterns. This will help you form a clear and concise thesis statement for your essay.For example, if the chart shows the population growthin a certain country over the past decade, you can identify the main trends, such as a steady increase or a sudden decline. This will serve as the basis for your thesis statement, which can be something like "The population of XYZ country has experienced a significant growth over the past decade."Once you have established your thesis statement, it is important to provide supporting evidence for your argument.This can be done by referring to specific data points or trends shown in the chart. For instance, you can mentionthat the population increased by a certain percentage each year or that there was a spike in population growth duringa specific period.Furthermore, it is crucial to provide analysis and interpretation of the data. This can involve explaining the reasons behind the trends shown in the chart or making predictions about future developments. For instance, youcan discuss the factors that contributed to the population growth, such as improved healthcare or immigration, and speculate on whether this trend will continue in the future.In addition to analyzing the data, it is important to structure your essay in a logical and coherent manner. This can be achieved by organizing your ideas into paragraphsand using appropriate transition words and phrases. For example, you can start a new paragraph by saying "Another important aspect to consider is..." or "On the other hand,it is worth noting that..."Lastly, it is important to conclude your essay by summarizing your main points and restating your thesis statement. This will provide a sense of closure and ensure that your essay is well-rounded. For example, you can conclude by saying "In conclusion, the chart clearly illustrates the significant population growth in XYZ country over the past decade, and it is likely that this trend will continue in the future."中文回答:写一篇关于图表或图形的文章时,有几个关键点需要考虑。
四级考试图表作文写作技巧

饼状图
特点
用于展示整体中各部分的占比关系。
重点
关注各部分占比大小和变化,以及占比与整体的关系。
分析
比较不同时间段或不同群体之间的占比差异,探究占 比变化的原因和影响。
表格
特点
用于展示多维度数据,包括数值和文字信息。
重点
关注数据的全面性和细节,注意数据的准确 性和可信度。
分析
对表格中的数据进行分类、筛选、计算和对 比,挖掘数据背后的信息和意义。
03
特点
用于比较不同类别之间的 数找 出最大值、最小值和变化 趋势。
分析
比较不同时间段或不同群 体之间的数据,探究数据 背后的原因和影响。
折线图
特点
01
用于展示数据随时间变化的趋势。
重点
02
关注数据变化的规律和趋势,以及峰值和谷值出现的时间点。
分析
03
探究数据变化的内在原因,预测未来趋势,并给出相应建议。
05 实例分析
优秀范文展示
文章结构清晰
优秀范文通常具有明确的文章结 构,包括开头、主体和结尾,层 次分明,逻辑性强。
语言准确流畅
范文的语言表达准确,语法和拼 写错误较少,同时流畅自然,易 于阅读。
图表描述细致
范文能够准确描述图表中的信息, 对数据和趋势进行恰当的分析和 解释。
学生常见错误分析
文章结构混乱
描述图表内容
01
按照题目要求,准确描述图表中的数据和信息,注意使用合 适的单位和表述方式。
02
突出图表中的关键信息和趋势,并解释其含义和影响。
03
可以适当进行图表数据的分析和比较,以支持文章观点。
总结与启示
总结图表所反映的问题或趋势,以及 可能的原因和影响。
中考英语书面表达图表类作文写作指导
图表类型 -图表(graph/diagram)包括柱状图(bar/column chart)、表格(table)、饼状图(pie chart)、折线图(line chart)、曲线图(curve chart)、流程图(flow chart)、组图(a set of charts)等。
如果考试的时候不会写某个具体图表的英译,可以用graph/diagram泛指所有图表。
graph n.图表;代表声音单位(或其他言语特征)的书写符号;坐标图v.用图标示;绘图diagramn.图解;简图;示意图;几何图形;火车运行时间图v.以图表示;根据火车运行时间图来安排(火车的)运行时间- 写作思路 -第一段:描述图表第二段:说明图表数据增长or下降的原因。
第三段:表达自己对此现象的看法以及面对此现象我们该怎么去做。
(具体写不写第二段和第三段要看作文要求,如果作文direction里写明了你要“interpret the chart and give your comments”,那就一定别忘了写第二段和第三段,如果只是让“interpret the chart”,那在作文结尾写一两句第二段和第三段的内容或者不写即可)嵌套饼状图的写作思路第一部分思路:从饼状图中我们可以了解到xx是怎样的,其中百分之几是A,百分之几是B,B中a占多少,b占多少,c占多少。
第二部分思路:图表数据说明了什么,我的看法是什么。
(一般图表给的数据多比较复杂,作文就描述图表数据的篇幅多一些。
如果图表给的数据很简单,比如21年12月的六级作文真题,就给了个单条折线图,那描述图表数据的篇幅可以小一些,重点放在分析图表数据变化的原因上,当然最重要的还是依照作文的direction来,即看作文题目到底让写什么,到底让怎么写,审题是最重要的)- 第一段常用表达 -1. 描述图表变化趋势的表达上升(v):increase; go up; rise; improve; grow; jump; rocket; soar; surge; shoot up(猛增); climb; ascend; leap; skyroket; proliferate上升(n):increase; rise; growth; jump; surge; upturn; leap下降(v):fall; drop; decrease; decline; go down; sink; dip;plummet; descend; diminish; dwindle; shrink; slupm; plunge; dive; nosedive下降(n):decrease, decline, fall, reduction, drop, slowdown, slump, plunge, dive, nosedive波动(v):fluctuate, vary, wave波动(n):fluctuation, variation波动(词组):range / vary from xx to xx,go up and down, ups and downs稳定在一个水平上(v):remain, keep, stay, maintain, stabilize, stagnate稳定在一个水平上(adj):stable, steady, constant, unchanged稳定在一个水平上(n):stagnation; stability; steadiness; plateau稳定在一个水平上 (词组):hove at; remain the same trend; remain stable; remain constant; reach a plateau at; stabilize at多条曲线趋势一致:A and B share the same trend; the trend of A happens to coincide with B2. 描述图表变化程度的表达变化程度很大:副词:significantly;considerably;rapidly;sharply;dramatically;drastically;enormously;substantially;markedly;steeply; greatly; massively; hugely; precipitously形容词:striking/ skyrocketing/ twofold(两倍的)/ threefold(三倍的)/ considerable/ steep词组:at an alarming rate, by/in leaps and bounds, by a wide/significant margin变化程度较轻:副词:slightly;gradually;slowly;steadily;moderately; marginally; modestly 形容词:steady/moderate/slow/slight/gradual词组:in a moderate way, by a narrow margin3. 极值类和组成构成的表达(hit/register/arrive at/stand at/increase to都可以替换掉reach)(top/summit/zenith/highest point都可以替换掉peak)eg:reach the peak of xx最低点:reach the bottom(drop/hit/register/arrive at/stand at/decrease to都可以替换掉reach)(trough/lowest point都可以替换掉bottom)eg:reach the bottom of xx占比最多:occupy the largest proportion of xxoccupy=make up=take up=account forproportion=number=percentage占比最少:occupy the smallest proportion of xxoccupy=make up=take up=account forproportion=number=percentage由…组成:comprise, consist of, be made up of,be composed of组成,构成:constitute, make up,form, occupy, account for, represent4. "大约"/"超过"/"不足"和预测类的表达方式大约:about/around/approximately/roughly/nearly/almost/just + 数字over/just under/close to/in the region of + 数字数字+ or so/or thereabouts数字+or thereabouts超过:more than + 数字over + 数字不足:no more than + 数字less than + 数字within + 数字under + 数字预测(v):expect, predict, project, forecast预测(句式):xx is expected/predicted/projected/forecasted to reach …5. "表达/阐述/说明/展示/体现"的表达方式display/represent/demonstrate/show/convey/illustrate/indicate/describe/embody/ reflect/reveal/outline/delineate/depict/expound/elaborate6. 常用句型①描述上升到多少:The mobile-phone subscriptions soared to 4 billion in 2008.②描述从多少上升到多少:Conversely, the urban population saw a risingtrend, growing from only 300 million to 680 million by 2010.③描述A的上升和B的下降:Domestic cars had a dramatic increase in the market share, as high as 9.8%, while/whereas(然而)Japanese cars declined by nearly 10%.(by+数据,就是上升/下降了多少,例如declined by nearly 10%就是下降了将近10%,to+数据,是指上升/下降到多少)④描述xx数据排第几:The amount of underground water ranks the second ,the percentage being 30.2%.⑤描述最大占比:We cannot fail to see that the biggest share is acquiring knowledge, with a proportion as high as 59.5%.We cannot fail to see that the biggest share is acquiring knowledge, accounting for 59.5%.⑥分别描述比例:Meanwhile, it is also not difficult to find that service, environment, price and other factors occupy 26.8%, 23.8%, 8.4% and 4.7% respectively(分别地).⑦描述两者之间的比较:The data show a comparison between the amountof Red wine that is consumed and the rates of US birth.In comparison with A, Bis …⑧描述倍数:A is three times as much as B …The graph shows a threefold increase in number of…The total number in 2012, which is 8,318, is about two times as much as the total number in 2008.A is twice as much as B.- 第二段常用表达 -1. 表述原因总起句There are many reasons explaining this phenomenon.Three major reasons give rise to the phenomenon mentioned above.2. 分条描述原因(主要原因)The main reason is that due to (the progress in economy / the improvement of living standards), a growing number of people ……(第二个原因)What is more, there is no doubt in saying that , with (the pace of modern society speeding up / the advance of technology) , a majority of people (try their best to catch up with the times and improve themselves)by (pursuing further education).(第三个原因)Thirdly , (under the background of modernization / with the rapid development of economy and society) , xx may have gradually become an unstoppable trend(趋势)in recent years.3. 形容大环境常用的表达方式with the progress in economywith the improvement of living standardswith the pace of modern society speeding upwith the advance of technology with the rapid development of economy and societyunder the background of modernization / urbanization / industrialization- 第三段常用表达 -积极的:Considering all these, I believe that we should take a reasonable attitude toward xx. In conclusion, from my point of view, such a phenomenon is (positive)and (acceptable).积极的:Taking into account what has been argued so far, it is not surprising to see the results in the above diagram. Thus, such phenomenon proves to be quite normal and acceptable. And I believe the trend will not change in the near future.积极的:Definitely, the boom of (the mobile industry) tends to exert a beneficial influence on people’s lives, and hence, it should be, from every aspect,encouraged and further advocated.消极的:In view of the description and analysis above, I’m convinced that actions have to be taken to cope with the problems arising from ……趋势预测:From what has been discussed above, a trend can be predicted from the chart that ……趋势预测:XX will be a growing trend in today's (busy)society.真题巩固2024年浦东新区初三一模英语作文84. Write at least 60 words according to the given situation(根据以下情境写一篇不少于60 个词的短文,标点符号不占格)学校报社做了一次有关学生如何使用零花钱的调查。
15画图图表类作文2023年中考英语书面表达(写作步骤满分范文词句积累)
备战2023年中考英语书面表达(写作步骤+满分范文+词句积累)图画+图表作文第七章图画作文图画作文是根据一幅或多幅图画以及汉语提示展开合理想象,写出几句话或一篇短文.看图作文多以记叙文或说明文为主,一般要求考生根据所给的图示介绍一个地方或一件物品,或者叙述过去或将来发生的故事.图画类作文的书面表达具有生动、直观、具体的特点.与其他类型作文的不同之处在于,它除了考查学生将图画内容转化为文字信息的能力以外,还考查学生的观察能力、分析能力和想象能力.写法点拨1.认真读图,把握要点.一般说来,所给的几幅图通常是一个小故事或小事件,这个小故事或小事件就是这组图画所要表达的主要内容.除此之外,还要考虑各图之间的关系,以及图画表达的人物、事件、地点、时间等.2.初步构思,拟定提纲.把握了文章的要点后,应在内心构思一个基本的框架,并考虑使用哪种体裁来进行写作,并确定人称、时态等细节.3.连词成句,连句成文.根据内容要点用恰当的词汇表达各图的意思,然后扩展成句子,再将这些句子串联成文.串连时,要注意使用过渡词或过渡句,使上下文更为紧凑、自然.参考模板The cartoon/picture is sending a message about__________ (图画内容)It reveals. __________ (稍作评价)Apparently,(将个人观点和图片内容相结合,得出观点)For one thing, __________.(原因一)For another thing, .(原因二)For example, __________ Last but not least, __________.(原因三)Therefore, it is necessary for us to__________.(建议或措施)Only in this way can we__________.(展望结果)In conclusion, __________.(再次表明观点或态度)We should__________.(进一步说明个人的观点)必备词汇cartoon卡通;漫画vivid生动的remind提醒indicate表明reflect反映illustrate阐明;举例说明depict描述describe描述imply意味着serious严重的cause导致;引起avoid避免Be supposed to应该;被期望Make sb. In deep thought让人深思必备句型1描述图画内容(1) As we can see in the picture,...正如我们可以从图片中看到的那样·.....(2) As is shown in the picture,... 如图所示··...(3) We can see/find that...in the picture.我们可以从图中发现··...·(4) What we can learn from the picture is that...我们可以从图中知道·.....(5) It can be seen/found/noticed in the picture that...由图画可以看到/发现/注意到···...(6) As can be seen from the picture, it is clear that...如图片所示,很明显·...·2论述图画反映的现象以及对这一现象的看法(1) After seeing the picture, I was greatly shocked by the phenomenon. In today's society,...看到这幅图以后,我对这种现象非常震惊.在今天的社会里,(2) What the picture reflects makes me think a lot.图片所反映的东西让我思考了很多.(3) Apparently, the cartoon reflects a major social problem.很明显,这幅漫画反映了一个主要的社会问题.(4) The picture reminds me of something in my daily life.这张图片让我想起了我生活中的一些事情.(5)All of these cause some serious problems.所有这些造成了一些严重的问题.(6) So I hope something must be done to avoid...所以我希望我们必须做一些事情,以避免···.··3 对事件、观点的总结(1) We can e to the conclusion that...我们可以得出这样一个结论···...(2) As far as I am concerned, what we have to do is... 就我看来,我们必须做的是·....·(3) Consequently, it is high time...所以,是时候··...(4) In my opinion, we should...就我看来,我们应该...(5) Only in this way can we... 只有这样我们才能··..·(6) Spare more time to...and you will...花多点时间···,你将会··.··(7)Therefore, we should realize the importance of...因此我们应该意识到······的重要性.(8) Such behavior left me in deep thought.这样的行为使我陷入了沉思.(9) In a word, if every one of us can do our part, we can make a difference to the world.总之,如果我们每个人都能从自身做起的话,我们就可以对世界产生影响.范例1题目:初中生活即将结束,6月6日下午,你班的班长方华组织了一次毕业聚会,内容是话友谊,忆过去,签名留言,拍照纪念,请根据图片的先后顺序描述此次聚会的过程.注意:1.文中不能出现真实姓名和学校的名称.2.至少用两句话描写每幅图画的内容,可以适当发挥.3.首句已给出,不计入总词数.词数80以上.4.参考词汇:签名sign one's name,班长monitor,心形的heartshapedAs the junior life is to end, our class decided to have a party to celebrate it._____________________________ ____________________________________________________________________________________________ ____________________________________________________________________________________________ ____________________________________________________________________________________________ ____________________________________________________________________________________________ 范文As the junior life is to end, our class decided to have a party to celebrate it. The party was organized by Fang Hua who is the monitor of our class and it consisted of three parts. ①Firstly, each person shared one story happened in the past three years. Some of the stories even made us cry. Then our photos were pasted on a heartshaped board. ②The shape of heart, of course, stood for our lifelong friendship. After that, we signed our names and left some messages on Tshirts. At the end of the party, we took a photo together.Every one of us left with a happy smile on our faces and we would remember the day forever.③译文因为初中生活即将结束,我们班决定办一场毕业聚会来庆祝.聚会由我们班的班长方华组织,本次聚会共分为三部分.首先,每个人都分享一件发生在过去三年中的事.有些故事甚至催人泪下.接着,我们把我们的照片粘贴到一块心形的木板上.当然,心形代表着我们终生不渝的友谊.然后我们在T恤衫上签下我们的名字,并写下一些留言.聚会结束之际,我们一起拍了张合照.我们每个人都面带微笑地离开了,我们将会永远记住这一天.满分点评本文结构清晰严谨,行文流畅自然.采用“总一分一总”结构,符合英语行文的习惯;过渡词的使用也为文章增色不少.其中:①使用who引导的定语从句用来说明方华的身份.②此句采用被动语态句式,使句子富于变化而非平铺直叙.③采用with复合结构作伴随状语,使人眼前一亮.范例2题目:文明社会,从我做起.请就下图的不文明行为和所产生的后果用英语写一篇短文,向校刊English Garden 投稿,倡导做文明人.注意:(1)短文必须包括所给图片的信息,合理想象并补全第3幅图片的内容.(2)必须谈谈你对此事的看法.(3)文中不得出现与你身份相关的信息.(4)词数:80100.短文首句仅供选择使用,不计入总词数.参考词汇:果皮skin,踩在·····上摔倒slip on(slipped, slipped),救护车ambulanceLast Sunday afternoon, I went to the park with my cousin._________________________________________ ____________________________________________________________________________________________ ____________________________________________________________________________________________ ____________________________________________________________________________________________ ____________________________________________________________________________________________ ____________________________________________________________________________________________ 范文Last Sunday afternoon, I went to the park with my cousin. A man who was eating a banana walked in front of us. "①What annoyed us was that he threw the banana skin on the ground instead of putting it into the dustbin.②Suddenly an old woman slipped on the banana skin and got hurt. We called 120 immediately, and then the ambulance came and took the woman to the hospital.It's terrible to drop litter around. ③ As a member of the society, we should keep a good habit and think about others no matter what we are doing, instead of bringing troubles to others.译文上个星期天下午,我和表哥一起去公园.走在我们前面的那个人在吃香蕉.令我们恼怒的是他竟然将香蕉皮扔到地上,而不是扔到垃圾桶里.突然,一个老奶奶踩到香蕉皮滑倒了,并且受了伤.我们立即拨打了120,之后救护车来了,把老奶奶送去医院.到处乱扔垃圾的行为非常糟糕.作为社会中的一员,我们应该养成良好的习惯,不管我们在做什么,都要为他人着想,而不是给他人带来麻烦.满分点评本文成功运用了一般过去时、一般现在时,并使用了过渡词,使短文过渡自然,逻辑清晰.其中:①who引导定语从句,修饰先行词a man.②此句使用了what引导主语从句和that引导表语从句,使人眼前一亮.③采用it作形式主语,不定式to drop litter around 是真正的主语.范例3题目:假如你是刘洪.周末就要到了,你已经安排好了周六一天的活动,请你结合图片内容,发挥合理想象,写一篇不少于80词的文章.____________________________________________________________________________________________ ____________________________________________________________________________________________ ____________________________________________________________________________________________ ____________________________________________________________________________________________ ____________________________________________________________________________________________ ____________________________________________________________________________________________ 范文The weekend es. After a week's hard work, I really want to have a good relaxation.①On Saturday, I am going to run in the park after breakfast. After that, I will do my homework at home because I have got a lot of homework to do.② Then after lunch, I will go out to fly a kite. ③It will be wonderful. Then in the evening, l will go swimming. Finally at night, I am sure to have a good sleep.That is all about my Saturday.译文周末就要来了,在一周的努力学习之后,我真的想要好好放松一下.星期六,吃完早餐后我要去公园跑步.之后,我将在家里做作业,因为我有很多作业要做.午饭后,我将去外面放风筝.这是很美好的.傍晚的时候,我会去游泳.最后,晚上我一定可以睡个好觉.这就是我星期六的全部安排了.满分点评文章围绕图片内容有条理、有层次地展开,语句通顺、准确,衔接连贯.①这一句暗示了作者打算在周末好好放松,为下文的活动做铺垫.②本句是because引导的原因状语从句,使用恰当.③作者适度运用“then,after”等词语连接上下文.第八章图表作文图表作文通常要求同学们根据题目所提供的图表、数据等进行分析、研究,通过一定的文字说明,弄清信息之间的关系,提炼要点,然后组织语言进行写作,有时候还要加入作者自己的观点.这是考试中较为常见的题型之一,也是难度较大的一种写作题型.这类作文形式多样,可综合提供题目、数据、图像、提纲等,但同学们在写作时一般是从五个方面入手,即描述图表、说明寓意、分析原因、联系实际、提出建议等,考试会从这五个方面中选出两到三个方面.主要考查学生把图表信息转换成文字的能力,数据分析和材料归纳的能力以及写作能力,想象能力等.写法点拨1.认真读取信息,弄清信息间的关系.一般情况下,题目会提供多个信息或者多组数据等,我们要认真分析每一个信息和每一组数据,找准信息间的逻辑关系,把握信息的要点,点明主题.有时候,我们可以借助题目的文字说明来帮助我们理清信息.2.初步构思,拟定提纲.把握了信息间的关系和要点之后,我们要在脑海中形成一个基本的框架,确定文章的体裁,是说明文还是议论文,或者是记叙文等.3.连词成句,连句成文.根据内容要点使用恰当的单词表达文章信息,同时要突出信息之间的关系,然后拓展成句子.通过适当的过渡词或过渡句,把这些句子串联成文,使文章连贯、自然.参考模板According to the chart, we clearly learn that.__________ (图表要点)The number of those who__________ (信息一) has increased, and furthermore,. __________ (信息二)Thereare two factors responsible for the changes. In the first place, __________.(原因一)Moreover, __________.(原因二)From the analysis, we can safely draw the conclusion that__________ (发表个人观点或看法或总结)必备词汇1 泛指图表table表格图diagram/chart图表graph曲线图;图表Bar chart条形图Line chart曲线图Flow chart流程图Data chart数据图illustration插图2表示数据变化的词rapidly迅速地dramatically戏剧性地sharply急剧地slowly/gradually缓慢地increase增加Go down减少fluctuate波动drop下降Go up上升Remain the same不变3 其他会用到的词describe描述illustrate阐明reveal揭露apparent/clear显然的represent代表figure数字statistics数据data数据;资料必备句型1 导入图表内容(1)The chart shows that...图表显示··....(2) It can be seen from the chart that...从图表中可以看出··....(3) It is obvious from the table that...图表中很明显发现··...·(4) We can see from the data that...从数据中我们可以看到···...(5) We can learn from the diagram that...我们可以从图中知道......(6) The chart illustrates that...图表阐述了····.·2表达数据变化的句子(1) The number of... has increased sharply from...to...·...··的数量已经从······急剧增长到···..·(2) The number of... remains the same in recent years.·····的数量近年来保持不变.(3) There is a sharp rise in the number of...·...··的数量增长很快.(4) There is a sudden decrease in the number of... from... to...······的数量急速下降,从······降到······(5) In contrast, there is a dramatic increase in the number of...相反,·····的数量的增长速度很快.3 对事件、观点的总结(1) It can be concluded that...可以总结出······(2) We can reach a conclusion that...我们可以得出结论······(3) In conclusion, it can be said that...总之,我们可以说······(4) To conclude, more attention should be paid to...总之,要更关注·····.范例1题目:现在的中学生每月都有一定数量的零花钱.某校对九年级(1)班的30名学生进行了零花钱用途的调查.结果如图.任选两项调查结果,谈谈你是怎么用零花钱的,并说明理由.注意:1.文中不能出现真实姓名和学校的名称.2.语句通顺,词数80以上.范文As the chart shows, most students spend their pocket money on snacks and just a few save their money.①However, things are quite different when. es to me.②Usually, I spend most of my money buying books because l like reading very much. I seldom spend my money on snacks because I think they are bad for my health. In addition, I will save some of my money in case of accidents.③It is true that we should make good use of our pocket money and spend it on something useful.译文正如表格所示,大多数学生会把钱花在零食上,只有少数同学会存钱.然而,当谈到我时,事情就不一样了.通常,我会把大多数的零花钱花在买书上,因为我非常喜欢看书.我很少会把钱花在零食上,因为我觉得这对健康不好.另外,我会把我的一部分钱存起来,以防意外.我们的确要充分利用零花钱,并把它花在有用的地方上.满分点评本文的逻辑清晰,段落层次分明.作者使用适当逻辑词使文章更加连贯、紧凑.①用however表示转折,承上启下,突出“我”是怎么使用的零花钱.②把状语usually置于句首,起到了强调的作用.③使用it作形式主语,从句作真正的主语.范例2注意:1.文章必须包括表格里的所有内容,且要补充自己的看法.2.词数80左右,开头已给出,不计入总词数.参考词汇:cheat 作弊school rules 校规please 取悦In recent years, more and more attention is paid to students' cheating in the exam._______________________ ____________________________________________________________________________________________ ____________________________________________________________________________________________ ____________________________________________________________________________________________ ____________________________________________________________________________________________ ____________________________________________________________________________________________ 范文In recent years, more and more attention is paid to students' cheating in the exam.The reasons why students cheat in the exam are various. ①Firstly, many students think that they have too many exams which are too hard. Moreover, some students are too lazy to work hard at their lessons. ②Furthermore, they sometimes cheat in order to please their teachers and parents.In my opinion, it is wrong to cheat, ③ which is against the school rules. As a student, we should be honest and study hard. What's more, we should improve our study methods so as to get good grades. ④译文近年来,学生在考试中作弊的问题越来越受到关注.学生考试作弊的理由是各种各样的.首先,很多学生认为考试太多,而且这些考试也很难.其次,有些学生太懒而不努力学习.还有,学生有时候是为了取悦父母和老师而作弊.在我看来,作弊是错误的,这也是违反校规的.作为学生,我们要诚实,努力学习.还有,我们要改善我们的学习方法来提高成绩.满分点评本文要点齐全,表达很顺畅,作者也融入了自己的看法,大量使用过渡词,使文章紧凑,自然.①用why引导定语从句,修饰先行词the reasons.②这个句子使用了too...to...句型,表示“太······而不能··..·”.③用it作形式主语,不定式to do作真正的主语.④使用短语so as to作目的状语,表明改善学习方法的目的.范例3题目:最近你们学校做了一个调查,有关现在中学生都爱读哪一类型的外国书籍.现要求你写一篇文章,汇报调查结果,并提出自己的建议.注意:1.要包含所有表格的信息,并提出自己的建议.2.语句通顺,词数不少于80词.参考词汇:foreign books 外国书籍范文To find out what kind of foreign books the middle school students like, our school did a survey.①As the survey's result shows, more than half of the students like to read newspapers.② 26% of the students say that they like to read foreign stories most, while 7% of the students express that they like to read books about learning methods. ③In addition, the percentage of students who like to read science books is 14%.In a word, I agree that students should learn more knowledge about the foreign countries.译文为了了解中学生都爱阅读哪一类的外国书籍,我们学校做了一项调查.调查结果显示,超过一半的学生喜欢阅读报纸.26%的学生说他们最喜欢阅读外国故事,然而只有7%的学生表示说喜欢阅读关于学习方法的书籍.另外,喜欢阅读科普书的学生比例是14%.总的来说,我同意学生应该多学习有关外国的知识.满分点评本文围绕调查的主题有条理地展开调查的结果,运用多种句式表达类似的信息.全文连接顺畅、自然.①用不定式to do作目的状语,解释了调查的目的.②使用“more than half of the students”而不是直接使用数据53%,表达灵活.③while表示前后形成对比,使上下文关系更连贯、紧凑.。
2023年英语四级图表作文的类型及参考范文

您目前旳位置: 首页 > 英语四级 > 英语四级作文 > 英语四级作文综合辅导 > 正文英语四级图表作文旳类型及参照范文图表作文也是四(六)级考试中常见, 并且被认为是一种较难旳作文形式。
图表作文就是把非文字信息(一般为多种图表表达旳数字信息等)转换成文字信息旳一种作文。
它规定我们用文字来描述非文字性旳图表或对图表显示旳关系作解释阐明。
下面我们先来看一看图表作文旳类型。
第一节图表作文旳类型图表作文可分为两大类: 表作文和图作文。
表作文表格(Table)可以使大量数据系统化, 便于阅读、比较。
表格常由标题(Title)、表头(Boxhead)(表格旳第一行)、侧目(Stub)(表格左边旳第一列)和主体(Body)部分(表格旳其他部分)等部分构成。
如下表:用表格体现旳信息详细精确, 并且表格中旳各项均按一定规律排列。
阅读表格时要注意找出表格中各个项目旳互相关系, 表格中各个项目旳变化规律。
例如, 上面旳表格中旳数字阐明, 和1978年相比, 1983年大学入学旳人数在增长, 而小学旳入学人数在减少。
弄清晰这些变化规律也就读懂了表格旳内容。
图作文图作文又可分为三种: 圆形图作文、曲线图作文和条状图作文。
(1) 圆形图作文圆形图(Pie chart)也称为饼状图或圆面分割图。
圆形图由于比较形象和直观, 各部分空间大小差异轻易辨别, 因此常用来表达总量和各分量之间旳比例关系。
整个圆表达总量, 楔形块表达分量。
有时圆形图尚有数值表, 两者结合可把各分量表达得更精确、清晰。
例如:Thi.i..pi.char.o.th.averag.weekl.expenditur.o..famil.i.Grea.Britain.A.ca.b.se.fr o.th.chart.th.mai.expenditur.o.a.averag.Britis.famil.i.spen.o.food.whic.account. fo.25.o.it.tota.expenditure.Th.nex.tw.significan.expendin.item.ar.transpor.an.ho using.whic.ar.15.an.12.respectively.I.w.tak.int.accoun.clothin.an.footwear.whic. make.u.10%.th.fou.essential.o.life.tha.is.food.transport.housing.an.clothin.an.f ootwear.amoun.t.62.o.th.tota.expenditure.(2) 曲线图作文曲线图(Line graph)也称为线性图或坐标图。
英语图表类作文点题技巧

英语图表类作文点题技巧英文回答:I've often found it difficult to stay on topic when writing essays, especially when the prompt asks for a specific point to be made. It can be easy to get sidetracked by interesting tidbits of information or to ramble on about things that are only tangentially related to the main argument. However, I've learned a few tricks that have helped me to stay focused and to write more concise and effective essays.One of the most important things is to start with a strong thesis statement. This statement should clearly and concisely state the main argument of your essay. Once you have a strong thesis statement, you can use it as a guide to help you stay on track throughout the rest of your essay.Another helpful technique is to outline your essay before you start writing. This will help you to organizeyour thoughts and to make sure that your essay flows logically. When you're outlining, be sure to include topic sentences for each paragraph. These topic sentences should support your thesis statement and help to guide the reader through your essay.As you're writing, be sure to use transitions to connect your paragraphs and to help the reader follow your train of thought. Transitions can be as simple as a few words or phrases, such as "however," "therefore," or "in addition."Finally, be sure to proofread your essay carefully before submitting it. This will help you to catch any errors in grammar or spelling, and it will also give you a chance to make sure that your essay is well-organized and easy to read.By following these tips, you can improve your ability to stay on topic and to write more concise and effective essays.中文回答:在写作图表类作文时,我经常发现自己难以保持主题,尤其是在提示要求做出特定观点的时候。
图标类英语作文写作思路

在英语作文写作中,图标类作文是一种常见的题型,它要求考生根据图表所提供的数据或信息,进行分析、比较、归纳和总结,进而撰写出一篇有逻辑、有深度的英语文章。
以下是一些写作图标类英语作文时可以采用的思路和技巧:1. 仔细阅读图表:首先,考生需要认真阅读图表,理解图表所展示的数据类型,是柱状图、饼图、折线图还是表格等。
同时,注意图表的标题、图例、坐标轴等信息,这些都是理解图表的关键。
2. 概述图表内容:在文章的开头部分,简要介绍图表的类型和主题,以及图表所展示的总体趋势或特点。
例如,可以说:The bar chart illustrates the changesin the number of people who use different modes of transportation in acity from 1990 to 2010.3. 详细描述数据:在文章的主体部分,详细描述图表中的数据。
可以按照时间顺序、类别或者重要性来组织信息。
使用比较级和最高级来描述数据的变化和差异,例如:The number of people who cycled to work increased significantly, from 5% to 15%.4. 分析原因和结果:在描述数据之后,分析造成这些数据变化的可能原因,以及这些变化可能带来的结果或影响。
例如:The significant increase in cycling could be attributed to the governments promotion of ecofriendly transportation methods.5. 提出个人观点:在分析的基础上,提出自己对于图表所展示现象的看法或建议。
这部分应该简洁明了,避免长篇大论。
例如:In my opinion, the trend towards cycling is beneficial for both the environment and public health.6. 使用多样的句式和词汇:在写作过程中,注意使用多样的句式和词汇,避免重复和单调。
大学英语四级图表写作

大学英语四级图表写作大学英语四级图表写作:如何准确传达数据信息在大学英语四级考试中,图表写作是必考题型之一。
考生需要具备良好的图表解读能力和语言表达能力,才能准确传达数据信息。
本文将为大家分享大学英语四级图表写作的技巧和注意事项,帮助大家提高图表写作水平。
一、理解图表类型在开始写作之前,考生需要了解不同的图表类型。
大学英语四级考试中常见的图表类型包括柱状图、饼图、曲线图和表格等。
每一种图表类型都有其特点和适用范围,考生需要根据题目要求选择合适的图表类型进行写作。
二、明确图表主题在开始写作之前,考生需要先明确图表的主题是关于什么的。
只有准确理解图表的主题,才能确定文章的中心思想。
在写作过程中,考生需要紧紧围绕主题展开论述,确保文章内容与主题密切相关。
三、关注数据变化图表中的数据变化是文章的重点。
考生需要认真观察数据变化,找出趋势和规律,然后对这些趋势和规律进行分析和解释。
在描述数据时,考生需要注意数据的准确性和语言的简洁性,避免夸大或歪曲事实。
四、注意语言表达在大学英语四级图表写作中,语言表达是非常重要的。
考生需要使用准确、简洁的语言描述图表中的数据信息。
在写作过程中,考生可以适当地使用一些连接词和过渡句,使文章更加流畅。
此外,考生还需要注意语法、拼写和标点等方面的错误,确保文章质量。
五、练习与总结最后,考生需要进行大量的练习,熟悉各种图表类型和写作技巧。
在练习过程中,考生可以发现自己存在的问题和不足,然后及时进行总结和改进。
只有通过不断的实践和反思,才能提高自己的图表写作能力。
总之,大学英语四级图表写作需要考生具备良好的图表解读能力和语言表达能力。
在写作过程中,考生需要准确理解图表类型、明确主题、关注数据变化、注意语言表达等方面的技巧和注意事项。
通过大量的练习和总结,相信大家一定可以写出优秀的图表作文。
大学英语四级图表作文写作大学英语四级图表作文写作在大学英语四级考试中,图表作文是一个重要的考点。
英文写作中的图表作文的写作技巧
英文写作中的图表作文的写作技巧英文写作中的图表作文的写作技巧英文写作中的图表作文的写作技巧1一、定义图表作文就是将图表所包含的数据信息转化为表意的说明文字,它是说明文的一种,而英文图标作文更英语写作中较为常见的作文题型之一,也是难度较大的一种写作题型。
本文旨在对英文图表作文的写作要领进行简明分析总结,方便读者扩充英文图表作文的写作思路。
图表作文可分为两大类即表作文和图作文,具体分为表格、圆形图作文、曲线图作文和条状图作文,这类作文可综合提供题目、数据、图像、提纲,形式多样,但实际上涉及5个方面:描述图表、指明寓意、分析原因、联系实际、给出建议。
二、图表作文写作要领(一)结构要求在结构方面,英文图表作文也要求结构清晰、层次分明,并且在结构上一定要注意衔接手段的使用,使独立的句子和段落变成文章。
1、引言部份这一段是作文的第一部分,简要介绍图表内容,用自己的语言交待三个要素:图表研究的时间段、研究的对象和研究所采用的数据形式。
该部分不宜过长,一般用一两句话说明,长度约为20-30字左右。
2、主体段落整理主体部分是对图表的详细描写,是全文的核心部分,要详尽描写图表所显示的内容,尤其是数据。
主体描写单方面的趋势,根据趋势的分类决定主体段落划分为几个自然段,描写要有一定的条理,按照一定的顺序组织材料,例如按照时间顺序、空间顺序或者分类顺序来安排。
图表作文的主体段落必须具备两个要素:单方面的趋势和数据的支持。
3、结论部分图表通过对具体数据的对照和对比来说明问题,因此在结尾部分要写出对照对比的趋势,以及从这个趋势中得出一个怎样的结论。
(二)写作步骤1、观察图表观察图表是为了准确理解图表所所传递的信息,认清图表的`形式,抓住其特点。
观察图表一要看清楚图表的文字说明,确定主题;二是仔细研究图表发现数据的主要特征或变化趋势;三要认真研究进一步发现图表中包含的一些意想不到的趋势和特征;四是仔细审查图表中的一切有用信息,诸如数据单位、备注、图理解释等。
写好英语图表作文三步走
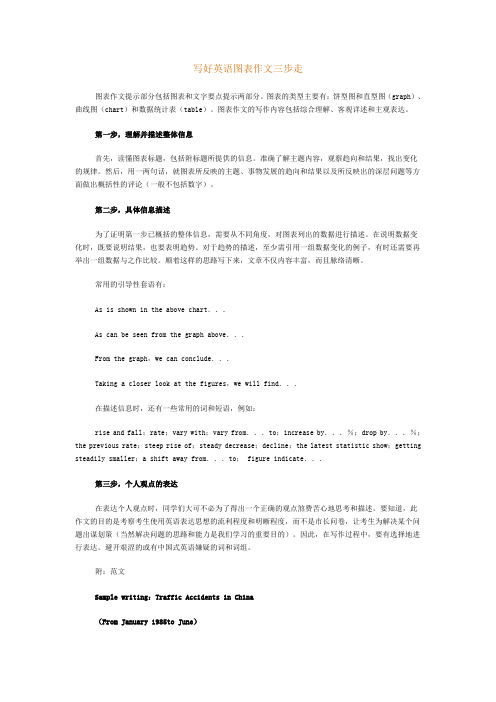
写好英语图表作文三步走图表作文提示部分包括图表和文字要点提示两部分。
图表的类型主要有:饼型图和直型图(graph)、曲线图(chart)和数据统计表(table)。
图表作文的写作内容包括综合理解、客观详述和主观表达。
第一步,理解并描述整体信息首先,读懂图表标题,包括附标题所提供的信息。
准确了解主题内容,观察趋向和结果,找出变化的规律。
然后,用一两句话,就图表所反映的主题、事物发展的趋向和结果以及所反映出的深层问题等方面做出概括性的评论(一般不包括数字)。
第二步,具体信息描述为了证明第一步已概括的整体信息,需要从不同角度,对图表列出的数据进行描述。
在说明数据变化时,既要说明结果,也要表明趋势。
对于趋势的描述,至少需引用一组数据变化的例子,有时还需要再举出一组数据与之作比较。
顺着这样的思路写下来,文章不仅内容丰富,而且脉络清晰。
常用的引导性套语有:As is shown in the above chart...As can be seen from the graph above...From the graph,we can conclude...Taking a closer look at the figures,we will find...在描述信息时,还有一些常用的词和短语,例如:rise and fall;rate;vary with;vary from...to;increase by...%;drop by...%;the previous rate;steep rise of;steady decrease;decline;the latest statistic show;getting steadily smaller;a shift away from...to; figure indicate...第三步,个人观点的表达在表达个人观点时,同学们大可不必为了得出一个正确的观点煞费苦心地思考和描述。
初高中英语图表类作文指导

初中高中英语图表类作文指导详解In the realm of English composition, chart and graph essays are a crucial skill to master, especially in junior and senior high school. These types of essays require students to analyze data visually presented in charts or graphs and then communicate their findings in a clear and coherent manner. While this task may seem daunting at first, with the right approach and practice, it can become a manageable and even enjoyable challenge.**Understanding the Chart or Graph**The first step in writing a chart or graph essay is understanding the information presented. Examine the chartor graph carefully, noting any trends, patterns, or outliers. Identify the key elements, such as the title, axes, labels, and legend. Understand the relationship between the data points and how they are represented visually.**Identifying Key Points**Once you have a solid understanding of the chart or graph, identify the key points that you want to focus on inyour essay. These points should be significant and relevant to the overall message or theme of the chart. For example,if the chart shows a steady increase in a particular metric over time, your key points might include the rate of increase, any notable spikes or dips, and any potential reasons for the trend.**Structuring the Essay**When structuring your essay, begin with a clear introduction that briefly summarizes the chart or graph and sets up your analysis. Then, move on to the body paragraphs, where you will expand on your key points. Each paragraph should focus on a specific aspect of the chart or graph, using evidence from the data to support your analysis. Be sure to maintain a logical flow and transition between paragraphs.**Using Language Effectively**In writing a chart or graph essay, it's important touse language effectively to convey your ideas. Use descriptive vocabulary to bring the chart or graph to life for the reader. Avoid technical jargon or complex language that may confuse the reader. Instead, strive for clarityand conciseness, using examples and illustrations toexplain complex concepts.**Concluding the Essay**In the conclusion, summarize your main points andrestate the overall message or theme of the chart. Linkyour analysis back to the chart or graph, emphasizing how your insights contribute to a deeper understanding of the presented data. Finally, consider any limitations orcaveats that may apply to your analysis and mention them briefly in your conclusion.**Practicing and Revising**Like any skill, writing chart or graph essays requires practice and revision. Start by practicing with simplecharts or graphs and gradually move on to more complex ones. As you write, pay attention to areas where you struggle and work on improving those skills. Revise your essays multiple times, focusing on clarity, coherence, and language use. Seek feedback from teachers, peers, or online resources to help identify areas for improvement.In conclusion, writing chart or graph essays is a valuable skill that can be honed with practice andattention to detail. By understanding the chart or graph, identifying key points, structuring the essay effectively, using language to convey ideas clearly, and revising your work, you can master this challenging but rewarding task.**初高中英语图表类作文指导详解**在英语作文中,图表类作文是一项重要的技能,特别是在初中和高中阶段。
英语图表类作文点题技巧

英语图表类作文点题技巧When it comes to writing English essays on chart analysis, there are several key techniques to ensure your essay is well-structured and effectively addresses the data presented. Here are some tips to help you:1. Introduction:Begin by introducing the chart or graph briefly without giving away specific details. Describe the type of chart it is (bar chart, line graph, pie chart, etc.) and what data it represents.Provide some context for the data, including the time period covered and any significant trends or patterns that may be apparent.2. Overview:Start your essay with a general overview of the maintrends or patterns depicted in the chart. This should be a broad summary that gives the reader an understanding ofwhat the data shows at a glance.Avoid getting into too much detail in the overview. Save the specifics for later in the essay.3. Key Features:Identify and analyze the key features of the chart. These may include peaks, troughs, significant changes over time, or any other notable points.Use descriptive language to explain what these features represent in terms of the data being presented.For example, if there is a sudden increase in sales,explain what might have caused it.4. Comparison and Contrast:If the chart includes multiple datasets or variables, compare and contrast them to highlight similarities anddifferences.Look for any relationships between the variables and discuss their significance. For instance, if there is a correlation between advertising spending and sales revenue, discuss how this relationship impacts the business.5. Interpretation:Offer your interpretation of the data based on your analysis. What do the trends and patterns suggest about the subject matter? Are there any implications or conclusions that can be drawn?Be careful not to make assumptions or draw conclusions that are not supported by the data. Stick to the facts and provide logical explanations for your interpretations.6. Conclusion:Summarize the main points of your analysis andreiterate the key findings from the chart.You may also want to offer some final thoughts or recommendations based on your interpretation of the data.7. Language and Style:Use formal language appropriate for an academic essay. Avoid slang, contractions, and overly casual expressions.Vary your sentence structure and vocabulary to keep the reader engaged.Use transition words and phrases to connect ideas and guide the reader through your analysis.By following these tips, you can effectively analyze and write about English essays on chart analysis while maintaining a clear and structured approach. Remember to focus on the key features of the chart, provide insightfulanalysis, and draw logical conclusions based on the data presented.。
英语图表类作文写作方法
英语图表类作文写作方法英文回答:How to Write an Effective English Chart Essay.Introduction.Chart essays are a common type of essay in academic writing. In this type of essay, you will be given a chartor graph and asked to analyze and discuss the datapresented in it. To write an effective chart essay, it is important to understand the data and to be able to communicate your interpretation of it clearly and concisely.Step 1: Understand the Data.The first step in writing a chart essay is tounderstand the data that you are given. This means takingthe time to look at the chart or graph and identify the following:The variables being measured.The units of measurement.The trends or patterns in the data.Once you have a good understanding of the data, you can begin to think about how you will interpret it.Step 2: Develop a Thesis Statement.Your thesis statement is the main argument that youwill be making in your essay. It should be a clear and concise statement that explains how you will interpret the data.Step 3: Organize Your Essay.The body of your essay should be organized into paragraphs that support your thesis statement. Each paragraph should focus on a different aspect of the dataand provide evidence to support your claims.Step 4: Write a Conclusion.The conclusion of your essay should restate your thesis statement and summarize the main points of your essay. It should also provide a brief overview of the implications of your findings.Tips for Writing an Effective Chart Essay.Use clear and concise language. Your essay should be easy to read and understand.Be objective. Your essay should focus on the data and avoid personal opinions.Use evidence to support your claims. Your essay should be based on the data that you are given.Be organized. Your essay should be organized into paragraphs that support your thesis statement.Proofread your essay carefully. Make sure that your essay is free of errors.中文回答:如何写一篇优秀的英语图表类作文。
2024届全国新高考英语精准复习图表类作文

纵向对比: 从1990到2020年,经过有效的措施,世界总贫困人口 和中国贫困人口一直在下降。 From 1990 to 2020, through effective
measures, the total number of poor people
both in the world and in China has been
Excitedly, China sucessfully got rid of absolute poverty in 2020.
As far as I am concerned, China has set a good example for the world.The Chinese people are living a better and better life. I am proud of China. Hopefully, the total number of poor people in the world will come to an end in the future.
countries pay high attention to the issue of
poverty,
especially
China.
China has been taking effective measures
to solve the problem of poverty. According to
declining.
范文一:Chinas Achievement in Ending Absolute Poverty
As we all know, poverty is one of the
biggest i s s u e s a r o u n d t h e w o r l d fective measures adopted by the government, all of the poor people across China have been lifted out of absolute poverty by the end of 2020. China has made such amazing achievements that gives the world a hope that ending poverty is possible.
如何写好英语图表作文
如何写好英语图表作文英语图表作文是考试中常见的题型,它要求我们根据给定的图表信息,进行数据分析和解读,并用英语进行写作。
下面我将为您介绍如何写好英语图表作文。
一、分析图表写作开始之前,我们应该仔细观察图表,分析其中的关键信息。
首先,看清楚图表的标题和横纵坐标的单位。
其次,我们需要注意图表中的数据变化趋势、差异、相似之处和特点。
最后,可以思考一下图表背后的原因、影响和可能的结果。
二、引入段写作的第一段是引入段,可以简要描述图表的基本信息,例如图表的来源、所示的内容以及时间范围。
同时,在引入段中可以使用一两句话概括图表总体的数据变化趋势和主要特点。
三、主体段落主要的分析内容应该放在主体段落中,根据图表的类型和信息特点,可以灵活地选择适合的表达方式。
下面将结合一些常见的图表类型,给出相应的写作指导。
1. 柱状图(Bar Chart)柱状图常用于描述不同类别或时间段的数据对比。
在写作时,我们可以根据柱状图的数据差异、增长或下降趋势进行详细的描述和解释。
例如,对于上升的数据可以使用表示增长的动词,如increase, rise, grow;对于下降的数据可以使用表示下降的动词,如decrease, drop, decline。
2. 折线图(Line Chart)折线图常用于描述随时间变化的数据趋势。
在写作时,我们可以描述和比较不同线条的趋势,以及线条之间的相似和差异。
同时,我们也可以引用具体的数据数值进行更准确的说明。
3. 饼图(Pie Chart)饼图常用于表示不同部分占整体的比例关系。
在写作时,我们可以描述各部分的比例大小,并解释其中的关系和原因。
例如,表达最大部分可以使用表示比例最高的形容词,如the largest, the highest percentage;表达最小部分可以使用表示比例最低的形容词,如the smallest, the lowest percentage。
同时,我们也可以指出各部分之间的差距和相似之处。
- 1、下载文档前请自行甄别文档内容的完整性,平台不提供额外的编辑、内容补充、找答案等附加服务。
- 2、"仅部分预览"的文档,不可在线预览部分如存在完整性等问题,可反馈申请退款(可完整预览的文档不适用该条件!)。
- 3、如文档侵犯您的权益,请联系客服反馈,我们会尽快为您处理(人工客服工作时间:9:00-18:30)。
e.g: the number of population reached the peak at 8 million
最低点:reach the bottom
e.g: After decreasing, the number of population bottomed out at 4 million.
b. There was a steady increase in the birth rate in China from about 10 percent in 1920 to just over 15 percent in 1935,followed by a sharp decline to nearly 5 percent in 1940.
平稳:remain stable ,steady,gradual,stay/remain/maintain/keep/be the same
e.g: the number of population mounted and leveled off at 7 million
the number of population stayed stable at 5 million
图表时间的表达: 1.in + 月/年 2.between… and… 3. from… to… 4. over the period from…to… 5. in the year between … and… 6.in the 3 years spanning from 2001 through 2004 7.for the first 3 months 8.for/during/over the next/ following 6 months 9.for/during/over/in the of 4 months 10.for/during/over/in a 4-month period 11.over/for/during the same period 12.from then on/ from this time/ point onwards/since then 13.by the year of… 14. after/before+年/月
句子演练:
1.根据图表中的数据,教师的人数从1960年的500万急剧下滑到1962 年300万。
a. According to the figure, there was a sharp decrease in the number of teachers from five million in 1960 to three million in 1962.
一、如何描述数据的上升或下降
一般来说,有两种句式表达数据的上升或下降。
a. 描述对象+表示增长或减少的动词+程度副词+数据+时间 点
b. There was a + 表示程度的形容词+表示增长或减少的名 词+数据+时间点
Example:
a. The birth rate in China increased steadily from about 10 percent in 1920 to just over 15 percent in 1935, followed by a sharp decline to nearly 5 percent in 1940.
占据:occupy, take up cover, bounce back
e.g:the number of population recovered from 2 million
常用形容词和副词--变化程度 abrupt(ly),sudden(ly),dramatic(ally),drastic(ally),sharp(ly) quick(ly),,rapid(ly),marked(ly),significant(ly) considerable(considerably),substantial(ly),moderate(ly) gradual(ly),slight(ly),enormous(ly), vast(ly)
e.g: the number of population increased/ ascended/ mounted to(by)…
下降: decrease ,fall ,drop ,descend ,decline ,reduce , plunge
e.g: the number of population decreased /declined to(by)…
b. According to the figure, the number of teachers decreased dramatically from five million in 1960 to (no more than) three million in 1962.
2. 1979年之后,牛肉和羊肉的消费状况分别急剧下降到大约100和55 斤。
图表类作文
图表题的五种类型
table line graph bar chart pie chart process diagram
表格题 线图 柱状图 饼状图 流程图
Note:图表题和议论文最根本的差异就是图表题 是客观性写作而议论文是主观性写作。
常用动词词汇:
上升:increase, rise ,grow, soar,shoot up
波动:fluctuate ,rise and falls up and down
e.g:the number of population fluctuated between 2 and 10 million
最高点:reach the peak, reach the highest point, reach the zenith
a. After 1979,the consumption of beef and lamb fell dramatically to approximately 100 and 55 grams respectively.