1999-2017美国对其他国家服务贸易进口额(分别国,仅服务贸易)
中美服务贸易发展状况分行业的实证分析
DOI:10.13546/ki.tjyjc.2021.02.029财经纵横0引言2019年,世界服务贸易额高达59851.85亿美元,占世界贸易总额的23.86%,成为世界经济增长重要引擎。
中国服务贸易总额居世界第二位。
美国是世界第一大服务出口国和进口国,是中国的第一大服务贸易逆差来源国。
从行业层面分析中美服务贸易状况,可为双边贸易政策制定提供决策依据,为识别各分行业比较优势变化、促进服务业产业升级提供数据支撑。
1中国和美国服务贸易发展概况1.1中国服务贸易发展概况1.1.1总体规模1999—2019年,我国服务贸易规模迅速扩大,出口额、进口额和服务贸易总额年均增长11.17%、14.86%和13.36%。
2019年,我国服务进出口总额为7498.67亿美元,同比下降1.24%。
其中,出口2443.59亿美元,同比增长4.62个百分点,进口5055.08亿美元,同比下降3.84%。
研究期内,服务贸易逆差逐年扩大,2019年有所收窄,逆差为2611.49亿美元,同比下降10.61%。
服务贸易总额占对外贸易总额(货物贸易和服务贸易总额)14.64%。
WTO 以总服务贸易衡量,中国出口额和进口额分列世界第五和第二位,占全球4.61%和8.59%。
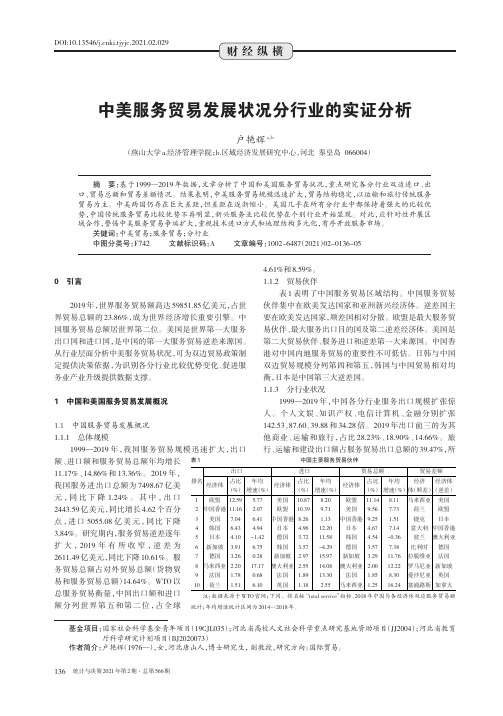
1.1.2贸易伙伴表1表明了中国服务贸易区域结构。
中国服务贸易伙伴集中在欧美发达国家和亚洲新兴经济体。
逆差国主要在欧美发达国家,顺差国相对分散。
欧盟是最大服务贸易伙伴、最大服务出口目的国及第二逆差经济体。
美国是第二大贸易伙伴、服务进口和逆差第一大来源国。
中国香港对中国内地服务贸易的重要性不可低估。
日韩与中国双边贸易规模分列第四和第五,韩国与中国贸易相对均衡,日本是中国第三大逆差国。
1.1.3分行业状况1999—2019年,中国各分行业服务出口规模扩张惊人。
个人文娱、知识产权、电信计算机、金融分别扩张142.53、87.60、39.88和34.28倍。
2019年出口前三的为其他商业、运输和旅行,占比28.23%、18.90%、14.66%。
中国与主要贸易伙伴国商品结构的比较(修改版)
中国与主要贸易伙伴国商品结构的比较一、引言公元前14——15世纪,我国就开始了对外贸易,始于秦代兴于汉代。
汉代两条丝绸之路更是促进了中国与西方政治文化的交流。
而中国封建时期仍是自给自足的小农经济,对外贸易规模小,多为朝贡贸易,其目的旨在宣扬国威。
新中国成立后,我国对外贸易体制逐渐健全,尤其是在加入了WTO之后,对外贸易更是高速发展,贸易顺差连连攀升,中国成为世界主要的贸易大国,更有了“世界工厂”之称。
然而,我国是否已是贸易强国?随着我国对外贸易比重的升高,对外依存度的增加,我国同时也面临着许多问题,如:汇率升值压力增大,贸易摩擦纷争增多等。
我们要如何应对这些发达国家巧立的名目?仅仅关注我国的出口额是否科学?我国与其他国家相比有存在着哪些不足?2008年的金融危机席卷全球,而我国主要的贸易伙伴国都受到了很大影响,外需大量下降,对外贸易发展缓慢,这使许多专家学者都意识到我国最关键的就是产业结构升级与贸易结构的优化,我们不能单纯只强调保增长,同时也要调整结构。
从贸易商品结构来看,中国货物贸易发展迅速,服务贸易发展滞后;从出口商品结构来看,劳动密集型的低附加值产品所占比重仍然较高,科技含量和附加值较高的产品所占的比重仍然较低。
长期以来,我国从事的都是效益低,贸易利益少,附加值低的资源密集型和劳动密集型产业,违背可持续发展的原则。
因此,我国应加快转变商品结构,实现贸易结构优化。
二、中国商品结构变化一国的出口总是偏重于其具有比较优势的产品,出口产品结构的变化依赖于其资源禀赋。
生产力水平较低的国家,资本和技术并不具有优势,只能依赖于对初级产品的出口推动其生产的发展。
因此,出口产品结构代表着一个国家的生产力发展水平,而工业制成品在出楼商品中所占的比重,是衡量一个国家工业化发展程度和出口商品结构优化程度的重要指标之一。
自改革开放以来,我国商品出口总值在1995年仅1488亿美元,而2011年增加到18986亿美元,增长了近13倍。
国际贸易原理复习题(1-5章)

第一章导论练习题一、单选题1、一定时期内,若一国一定量商品出口所能换得的进口商品量增加,该国贸易条件便()。
A. 恶化B. 不变C. 改善D. 不确定2、净进口是一国(地区)()。
A. 商品的进口量大于出口量B. 某一商品的进口量大于出口量C. 某一商品在一定时期内出口量小于进口量D. 某一商品在一年内进口量小于出口量3、贸易条件是指()。
A. 投资环境B. 初级产品与制成品的比价C. 进出口商品比价D. 市场价格水平4、上海经香港从美国进口电脑()。
A. 因货物从美国直运上海,不属转口贸易B. 因属转口贸易,货物必须经香港转运C. 货物虽不转运,仍属转口贸易D. 因属转口贸易,必须在香港过境5、世界贸易统计中()。
A. 世界出口总额等于世界进口总额B. 世界出口总额大于世界进口总额C. 世界进口总额大于世界贸易额D. 世界出口总额小于世界贸易额6、从自由贸易区进口的货物应计入()。
A. 总贸易进口额B. 总贸易出口额C. 专门进口额D. 专门出口额7、二战后,______________取代______________成为主要的贸易模式。
()南北贸易,北北贸易 B.南北贸易,东西贸易C.北北贸易,南北贸易D.北北贸易,东西贸易8、日本某公司向西欧出口货物,在运输过程中由香港转船,这种贸易可称之为()。
A. 直接贸易B. 间接贸易C. 转口贸易D.第三国贸易9、一定时期内,一国进口同类商品多于出口同类商品称为()。
A. 净出口B. 复出口C. 净进口D. 复进口10、19世纪,国际贸易中最重要的工业制成品是()A.电子产品B.棉纺织品C.机器设备D.金属制成品11、SITC把国际贸易的货物分为10大类,其中0-4类为--------,5-8类为-------()初级产品;高级产品 B.初级产品;制成品C.半成品;制成品D.半成品;高级产品12、“十一”长假,韩国首尔迎来了16万中国游客。
其中有一些来此进行美容手术。
特朗普为何一意孤行

特朗普为何一意孤行文/上海财经大学国际工商管理学院世界经济研究中心主任 林 珏特朗普为什么不顾国内外舆论,公然违反世界贸易组织(WTO)原则,一意孤行地对中国挥舞贸易保护主义大棒?调整贸易赤字特朗普上台后,美国对华贸易差额不减反增。
就任总统时,他曾经信誓旦旦地表示将降低财政赤字和贸易逆差。
然而,执政一年以来,不仅财政赤字没有下降,美国对外贸易逆差还进一步扩大。
美国商务部经济分析局的统计数据显示,2017年,美国对外货物与服务出口总额为2.3万亿美元,进口2.9万亿美元,贸易逆差达到5684亿美元,比上一年扩大了636亿美元。
其中,对中国的贸易逆差,从前一年的3093亿美元扩大到3372亿美元,该数字在美国对外贸易逆差总额中占到59%的比重。
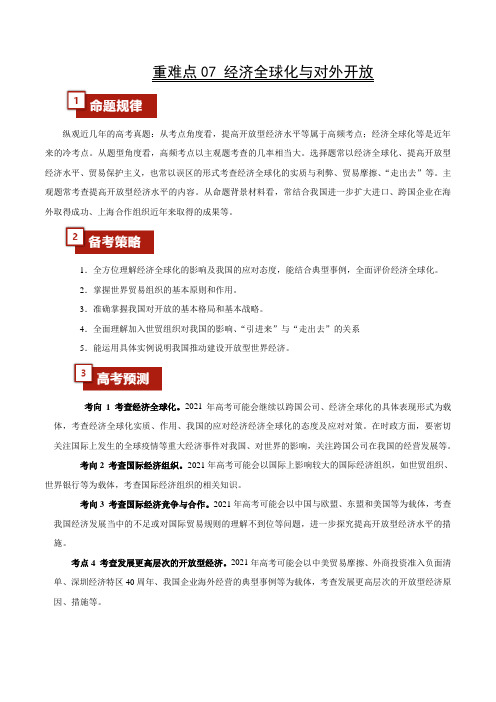
中美贸易战清单比较 《经济》制图专题2008-2017年按美方统计的美国对中国的出口额与进口额(单位:亿美元)注释:包括货物贸易和服务贸易。
2008-2017年按美方统计的美国对中国的贸易逆差在对外贸易逆差总额中的比重(单位:亿美元、%)注释:包括货物贸易和服务贸易。
依照美国的统计口径,2008-2009年危机后(2016年除外),美国对中国的贸易逆差在逐年扩大,中国占比也在扩大。
换言之,特朗普政府将奥巴马政府时期的对华贸易逆差推向新高,这让特朗普很是恼火。
他指责中国涉嫌剽窃美国知识产权,要求中国从美国进口更多的汽车、飞机、大豆和天然气,要将美国对中国的贸易逆差削减1000亿美元。
特朗普政府认为,中国市场不够开放、中国操纵汇率、中国侵犯知识产权是美国对华贸易逆差的主要原因。
实际上,中美投资和贸易的结构不同、中美储蓄率和消费率不同、各国在经济全球化形成的产业链分工不同、国际货币体系的不合理等,都可能是比汇率更重要的全球贸易失衡、中美贸易失衡的主要因素。
另外,美国对高科技产品的出口限制进一步阻碍了贸易逆差的减少,而只要美国放松管制,中美贸易逆差是可以减少的。
美国诺贝尔经济学奖获得者斯蒂格利茨认为,美国的贸易赤字主要是由宏观经济政策决定的,受国内储蓄和国内投资的影响;特朗普的减税法案会减少财政收入,增加财政赤字,从而减少国内储蓄,由此使美国在多个层次、对多个国家的贸易赤字扩大。
2017-2019服务贸易进出口对比

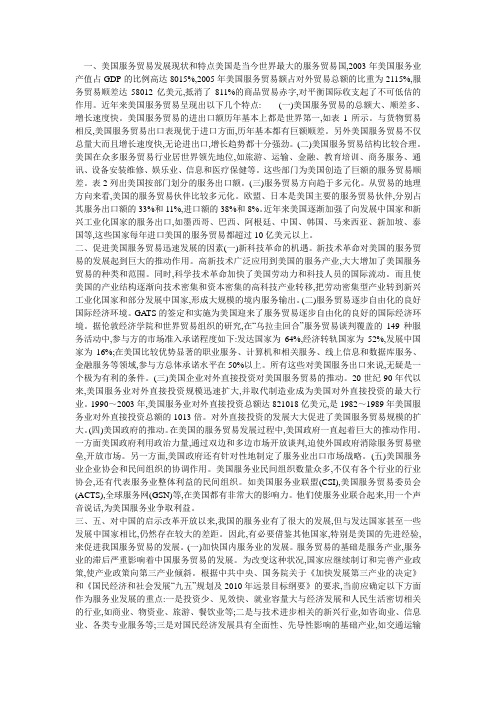
2017-201x服务贸易进出口对比
201x年,我国服务进出口总额4.7万亿元人民币,增长6.8%,高于全球主要经济体,有望保持全球第二的规模;逆差1.6万亿元,与上年基本持平。
商务部服务贸易司有关负责人指出,总体来看,服务贸易平稳发展,贸易结构持续优化,高质量发展特征逐步显现。
发展呈现出以下几个特点:一是7年来出口增速首次超过进口。
全年服务出口1.54万亿元,增长10.6%,是2011年以来的最高增速;进口3.16万亿元,增长5.1%,出口增速超过进口5.5个百分点。
二是结构进一步优化。
新兴服务进出口1.46万亿元,增长11.1%,高于整体增速4.3个百分点。
其中,进口7271.7亿元,增长10.6%,出口7328.4亿元,增长11.5%。
三是中西部地区服务进出口快速增长。
中西部地区服务进出口合计6575.7亿元,增长8%,高于全国增速1.2个百分点,其中出口增速达23.5%。
创新发展试点地区服务进出口合计24405.5亿元,进出口、出口和进口分别同比增长8%、11.1%和7.4%,均高于全国水平。
美国服务贸易分析

[摘要] 国际贸易领域中发展最为迅速的就是服务贸易,西方发达国家服务贸易额的增长速度大大的超过其货物贸易的增长速度。
世界经济的中心也在逐步的向服务贸易倾斜。
由于服务贸易能够带来丰厚的回报,各个国家也在积极的研究发展服务贸易的途径。
美国是当今世界服务贸易最为发达的国家,其货物贸易的逆差也可以由服务贸易顺差来弥补一部分。
把美国作为西方发达国家服务贸易高速发展的典范进行分析,可以充分的认知美国服务贸易高速发展的原因和推动力。
[关键词]服务贸易现状政策美国是现代服务贸易最为发达的国家,无论其服务贸易的进出口额、服务贸易额的增长率还是服务贸易对GDP的贡献率都远远高于其他发达国家。
2009 年美国服务贸易总额达到507486亿美元, 2008年服务贸易出口额达到5220亿美元,占世界服务贸易出口总额的14%,服务贸易进口额达到3640亿美元,占世界服务贸易进口额的10.5%。
在资本、技术密集型和高附加值的服务业部门中, 美国更是重要的参与者。
2007 年在美国服务出口中, 版权和许可证、保险、金融、通讯、计算机和信息等部门出口额为1725.01 亿美元, 占美国服务出口总额的34.17%。
美国在这些领域一直处于世界领先地位。
美国CSI在2007年1月31号的新闻发布中称美国的服务贸易至少从美国政府有详细统计数据以来都是处于贸易顺差,美国毫无疑问是世界上最大的和最具竞争力的服务出口国。
一、美国服务贸易的现状及特点主要有以下几个方面:(1)美国服务贸易总额大、增长快、顺差多。
美国服务贸易的进出口额基本上在世界的排名都是第一位的,出口额最高已达到4791.5亿美元。
(2)美国服务贸易结构合理。
美国的众多服务贸易行业均居于世界领先地位:保险、计算机和信息、金融、其他商业服务、个人文化和休闲、通讯、建筑、交通运输、旅游和版税和许可证等。
(3)政府高度重视服务贸易的发展。
美国的服务贸易对于美国的经济有着举足轻重的作用,美国政府也高度重视服务贸易的发展。
2017年美国货物进出口贸易分析报告
2017年美国货物进出⼝贸易分析报告2017年美国货物贸易及中美双边贸易概况⼀、2017年美国货物贸易概况据美国商务部统计,2017年全年,美国货物进出⼝额为38896.4亿美元,⽐上年(下同)增长6.9%。
其中,出⼝15467.3亿美元,增长6.6%;进⼝23429.1亿美元,增长7.1%。
贸易逆差7961.7亿美元,增长8.1%。
分国别(地区)看,2017年美国对加拿⼤、墨西哥、中国和⽇本的出⼝额分别为2824.7亿美元、2429.9亿美元、1303.7亿美元和677.0亿美元,占美国出⼝总额的18.3%、15.7%、8.4%和4.4%,增长5.9%、5.8%、12.8%和7.1%;⾃中国、墨西哥、加拿⼤和⽇本的进⼝额分别为5056.0亿美元、3140.5亿美元、2999.8亿美元和1365.4亿美元,占美国进⼝总额的21.6%、13.4%、12.8%和5.8%,增长9.3%、6.8%、8.0%和3.4%。
美国的前四⼤贸易逆差来源地依次是中国、墨西哥、⽇本和德国,2017年逆差额3752.3亿美元、710.6亿美元、688.5亿美元和642.5亿美元,变动幅度分别为8.1%、10.4%、0.1%和-0.8%。
美国的贸易顺差主要来⾃中国⾹港和荷兰,2017年顺差额为324.7亿美元和244.9亿美元,增长18.1%和3.9%。
分商品看,机电产品、运输设备、化⼯产品和矿产品是美国的主要出⼝商品,2017年出⼝额分别为3759.0亿美元、2666.4亿美元、1597.8亿美元和1468.4亿美元,占美国出⼝总额的24.3%、17.2%、10.3%和9.5%,增长5.1%、0.6%、3.9%和44.2%。
在机电产品中,机械设备出⼝2016.5亿美元,增长5.8%;电机和电⽓产品出⼝1742.5亿美元,增长4.3%。
机电产品、运输设备和矿产品是美国的前三⼤类进⼝商品,2017年进⼝6931.7亿美元、3248.1亿美元和2009.2亿美元,占美国进⼝总额的29.6%、13.9%和8.6%,增长8.4%、3.1%和26.4%。
主要经济体服务贸易

03
02
2
1
美国服务贸易发展的特点
信息技术的高速发展及电子商务的出现推动了服务贸易的发展
服务贸易的出口方向主要是发达国家
服务贸易发展平稳,经济贡献率高
服务贸易顺差有效弥补了货物贸易逆差
服务业的各个部门发展态势良好
4
3
6
5
美国服务贸易政策分析
1
运输业
2
旅游业
3
电信业
4
金融业
5
专业服务
6
欧盟的服务贸易
香港服务贸易发展的特点
01
服务贸易进出口均实现显著增长
02
服务贸易实现大量顺差,对国际收支平衡起着决定性作用
03
运输及“商贸服务及与贸易相关的服务”是服务贸易盈余中最主要的贡献力量
04
中国内地及美国是香港服务贸易的最主要对象
05
离岸贸易迅猛发展,成为香港服务贸易的生力军
06
第三节 主要发展中国家的服务贸易
01
03
02
服务贸易进出口居于世界前列
美国是欧盟最大的服务贸易伙伴
欧盟服务贸易发展的特点
欧盟服务贸易增长迅速
英国为欧盟15国中最大的服务贸易交易国
欧盟服务贸易政策分析 由于欧盟成员之间的服务贸易大于它与集团外国家的服务贸易,欧盟致力于内部服务贸易的自由化和统一化。经过几十年的努力,欧盟成员国之间基本上实现了服务贸易自由化。同时为了确保在国际服务贸易中的地位,获得更多的经济利益,欧盟积极推行全球服务贸易自由化,愿与世界贸易组织成员一起,就环境、服务、建筑、分销、金融及运输等服务领域的市场开放和合作开展积极探讨。
欧盟服务贸易发展概况
欧盟是全球最大的商品贸易集团和服务贸易集团,2003年, 欧盟诸国的服务业产值已经占国内生产总值的2/3,就业人数达1.1亿人。以发达的服务业为基础,欧盟成为世界上最主要的服务贸易进口地区,占世界份额的24%。法国、英国、德国、意大利等都有不小的服务贸易出口额,而且近年来一直呈增长趋势,他们大多是服务贸易的顺差国。
1982-2019中国历年进出口(服务贸易)数据统计

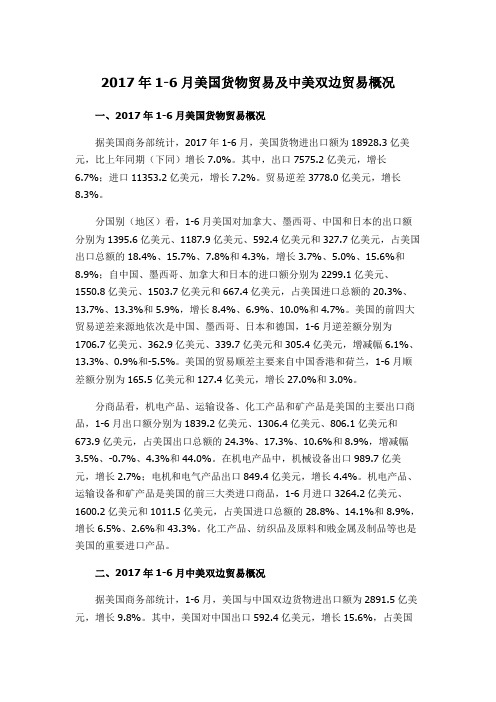
1982-2019中国历年进出⼝(服务贸易)数据统计根据国家统计局公布数据,2019年中国服务贸易进出⼝总额为7434亿美元,出⼝总额为2420亿美元,进⼝总额5014亿美元。
分别较上年下降1.78%,增长4%,下降4.35%。
中国服务贸易进出⼝总额(亿元⼈民币)服务贸易进出⼝总额,在2016年连续3年增长后,2019年稍有回落。
中国服务贸易出⼝总额(亿美⾦)中国服务贸易进⼝总额(亿美⾦)跟货物贸易相反,中国服务贸易⼀直存在逆差。
2015年-2019年出⼝与进⼝的差额分别为:-2065亿美⾦,-2455亿美⾦,-2555亿美⾦,-2915亿美⾦,-2594亿美⾦。
详细数据由“原点参数”整理,可参考:中国历年服务贸易进出⼝数据统计(1982-2019)。
1982年-2019年历年服务贸易进出⼝额数据如下:时间单位: 美元(亿)进出⼝总额出⼝总额进⼝总额进出⼝差额1982年44251961983年43251871984年54282621985年52292361986年563620161987年654223191988年804733141989年81453691990年985741161991年1086939301992年1839192-11993年226110116-61994年32216415861995年430184246-621996年430206224-181997年522245277-321998年504239265-261999年572262310-482000年660301359-582001年719329390-612002年855394461-672003年1013464549-852004年1337621716-952005年1571739832-932006年19179141003-892007年250912161293-772008年304514651580-1152009年286712861581-2952010年362417021922-2192011年419118212370-5492012年470619052801-8972013年539621063291-11852014年568618533833-19802015年666322994364-20652016年661520804535-24552017年679921224677-25552018年756923275242-29152018年756923275242-2915 2019年743424205014-2594。
美国服务贸易的竞争优势及其来源
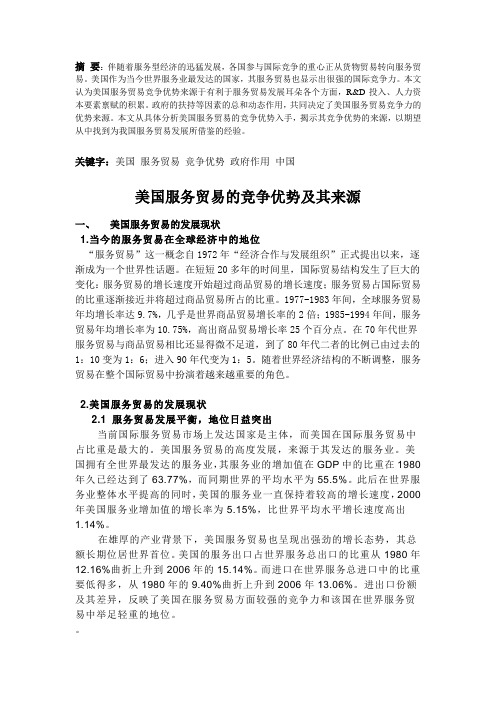
摘要:伴随着服务型经济的迅猛发展,各国参与国际竞争的重心正从货物贸易转向服务贸易。
美国作为当今世界服务业最发达的国家,其服务贸易也显示出很强的国际竞争力。
本文认为美国服务贸易竞争优势来源于有利于服务贸易发展耳朵各个方面,R&D投入、人力资本要素禀赋的积累。
政府的扶持等因素的总和动态作用,共同决定了美国服务贸易竞争力的优势来源。
本文从具体分析美国服务贸易的竞争优势入手,揭示其竞争优势的来源,以期望从中找到为我国服务贸易发展所借鉴的经验。
关键字:美国服务贸易竞争优势政府作用中国美国服务贸易的竞争优势及其来源一、美国服务贸易的发展现状1.当今的服务贸易在全球经济中的地位“服务贸易”这一概念自1972年“经济合作与发展组织”正式提出以来,逐渐成为一个世界性话题。
在短短20多年的时间里,国际贸易结构发生了巨大的变化:服务贸易的增长速度开始超过商品贸易的增长速度;服务贸易占国际贸易的比重逐渐接近并将超过商品贸易所占的比重。
1977-1983年间,全球服务贸易年均增长率达9.7%,几乎是世界商品贸易增长率的2倍;1985-1994年间,服务贸易年均增长率为10.75%,高出商品贸易增长率25个百分点。
在70年代世界服务贸易与商品贸易相比还显得微不足道,到了80年代二者的比例已由过去的1:10变为1:6;进入90年代变为1:5。
随着世界经济结构的不断调整,服务贸易在整个国际贸易中扮演着越来越重要的角色。
2.美国服务贸易的发展现状2.1 服务贸易发展平衡,地位日益突出当前国际服务贸易市场上发达国家是主体,而美国在国际服务贸易中占比重是最大的。
美国服务贸易的高度发展,来源于其发达的服务业。
美国拥有全世界最发达的服务业,其服务业的增加值在GDP中的比重在1980年久已经达到了63.77%,而同期世界的平均水平为55.5%。
此后在世界服务业整体水平提高的同时,美国的服务业一直保持着较高的增长速度,2000年美国服务业增加值的增长率为5.15%,比世界平均水平增长速度高出1.14%。
高考政治_重难点07__经济全球化与对外开放(原卷版)-2020年政治高考【热点 重点 难点】专练
重难点07 经济全球化与对外开放纵观近几年的高考真题:从考点角度看,提高开放型经济水平等属于高频考点;经济全球化等是近年来的冷考点。
从题型角度看,高频考点以主观题考查的几率相当大。
选择题常以经济全球化、提高开放型经济水平、贸易保护主义,也常以误区的形式考查经济全球化的实质与利弊、贸易摩擦、“走出去”等。
主观题常考查提高开放型经济水平的内容。
从命题背景材料看,常结合我国进一步扩大进口、跨国企业在海外取得成功、上海合作组织近年来取得的成果等。
1.全方位理解经济全球化的影响及我国的应对态度,能结合典型事例,全面评价经济全球化。
2.掌握世界贸易组织的基本原则和作用。
3.准确掌握我国对开放的基本格局和基本战略。
4.全面理解加入世贸组织对我国的影响、“引进来”与“走出去”的关系5.能运用具体实例说明我国推动建设开放型世界经济。
考向1 考查经济全球化。
2021年高考可能会继续以跨国公司、经济全球化的具体表现形式为载体,考查经济全球化实质、作用、我国的应对经济经济全球化的态度及应对对策。
在时政方面,要密切关注国际上发生的全球疫情等重大经济事件对我国、对世界的影响,关注跨国公司在我国的经营发展等。
考向2 考查国际经济组织。
2021年高考可能会以国际上影响较大的国际经济组织,如世贸组织、世界银行等为载体,考查国际经济组织的相关知识。
考向3 考查国际经济竞争与合作。
2021年高考可能会以中国与欧盟、东盟和美国等为载体,考查我国经济发展当中的不足或对国际贸易规则的理解不到位等问题,进一步探究提高开放型经济水平的措施。
考点4 考查发展更高层次的开放型经济。
2021年高考可能会以中美贸易摩擦、外商投资准入负面清单、深圳经济特区40周年、我国企业海外经营的典型事例等为载体,考查发展更高层次的开放型经济原因、措施等。
(建议用时:30分钟)1.(2020·新课标全国卷Ⅱ)自2013年以来,我国已累计设立18个自由贸易试验区(简称自贸区),区内试行贸易和投资便利化制度,进一步放宽金融和制造业领域的市场准入,完善知识产权保护制度,自贸区成为制度创新的“高地”。
美国的对外贸易

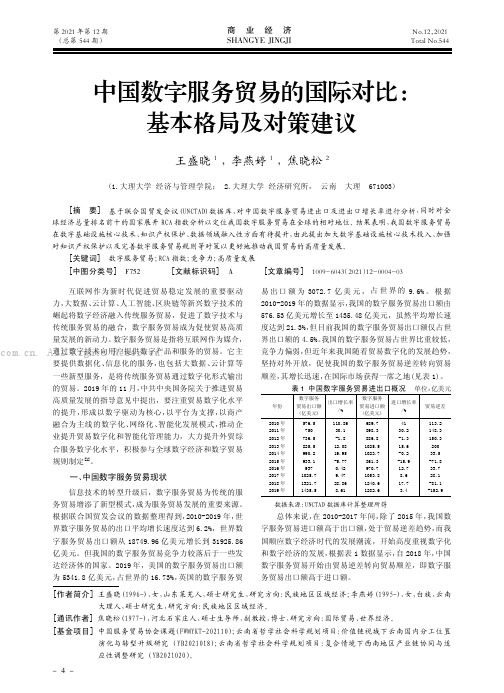
美国对外贸易总额(单位:十亿美元)
年份 口 2001 358.3 2000 375.7
进口 贸易逆差 1,356.3
出
998.0
1,441.4
1,065.7
在世界十大贸易国家或地区中美国的进出口贸易总 额都雄居榜首,尤其是进口贸易额几乎是排名第二 位的德国的2倍。 美国在世界贸易中的地位,是与美国的经济实力分 不开的。 美国的GNP一直占世界总值的25%以上, 居世界首位。美国工业发达,制成品占世界的1/ 5,是世界最大的市场。美国农业也很发达,主要 农产品如小麦、玉米、 大豆、棉花、肉类均居西方 世界的首位,粮食产量占世界的1/5, 农产品出 口占世界的一半以上。 值得指出的是,尽管美国在 世界贸易中居于首位, 但美国的出口额和进口额占 国民生产总值的比重都很小,比不上日本,更不及 德。 美国的出口额和进口额占国民生产总值都不超 过10%。
美国和中国近年来对外贸易依存度对比分析
• • • • • • • • • • • • • • • 中国近十年数据: 年份 国内生产总值 进口总值 出口总值 进出口总值 亿元人民币 上年=100 1978年=100 1978年 3645.2 111.7 100 206.4 167.6 355.0 2001年 109655.2 108.3 823.0 20159.2 22024.4 42183.6 2002年 120332.7 109.1 897.8 24430.3 26947.9 51378.2 2003年 135822.8 110.0 987.8 34195.6 36287.9 70483.5 2004年 159878.3 110.1 1087.4 46435.8 49103.3 95539.1 2005年 184937.4 111.3 1210.4 54273.7 62648.1 116921.8 2006年 216314.4 112.7 1363.8 63376.9 77594.6 140971.4 2007年 265810.3 114.2 1557.0 73284.6 93455.6 166740.2 2008年 314045.4 109.6 1707.0 79526.5 100394.9 179921.5 2009年 340506.9 109.1 1862.5 68618.4 82029.7 150648.1 2010年 397983 116.9 94430 106825.9 201255.9 (数据来源中国统计年鉴
第七章主要经济体服务贸易

(二)日本服务贸易发展的特点 • 1、服务贸易发展迅速,总量居世界前列 • 2、服务贸易常年处于逆差状态 • 3、进出口集中于运输、专有权利使用费和特许费、其他 商业服务、旅游等行业 • (三)日本的服务贸易政策 • 在服务市场开放的过程中,日本政府的态度是:一方面, 承诺开放市场;另一方面,坚持逐步开放的原则。这是由 日本的服务贸易长期处于逆差地位所决定的。
Nanjing University of Finance and Economics (NUFE) School of International Economics and Business
南京财经大学国际经贸学院
Copyright © 2008 Nanjing University of Finances & Economics, All Rights Reserved Designed By caoyuming
Nanjing University of Finance and Economics (NUFE) School of International Economics and Business
南京财经大学国际经贸学院
Copyright © 2008 Nanjing University of Finances & Economics, All Rights Reserved Designed By caoyuming
二、欧盟的服务贸易 (一)欧盟服务贸易发展概况 据欧盟统计,服务业是欧盟经济 中最重要的部门,2007年服务业增 加值占欧盟 GDP比重达 70%,服务 业就业人口占总数的 69%,服务贸 易总额达8995亿欧元,成为第一大 服务贸易进口国和仅次于美国第二 大出口国。其中英国、德国占世界 的 8.06% 、 6.04% ,成为世界第二、 三服务贸易大国。
美国服务贸易
一、美国服务贸易发展现状和特点美国是当今世界最大的服务贸易国,2003年美国服务业产值占GDP的比例高达8015%,2005年美国服务贸易额占对外贸易总额的比重为2115%,服务贸易顺差达58012亿美元,抵消了811%的商品贸易赤字,对平衡国际收支起了不可低估的作用。
近年来美国服务贸易呈现出以下几个特点:(一)美国服务贸易的总额大、顺差多、增长速度快。
美国服务贸易的进出口额历年基本上都是世界第一,如表1所示。
与货物贸易相反,美国服务贸易出口表现优于进口方面,历年基本都有巨额顺差。
另外美国服务贸易不仅总量大而且增长速度快,无论进出口,增长趋势都十分强劲。
(二)美国服务贸易结构比较合理。
美国在众多服务贸易行业居世界领先地位,如旅游、运输、金融、教育培训、商务服务、通讯、设备安装维修、娱乐业、信息和医疗保健等。
这些部门为美国创造了巨额的服务贸易顺差。
表2列出美国按部门划分的服务出口额。
(三)服务贸易方向趋于多元化。
从贸易的地理方向来看,美国的服务贸易伙伴比较多元化。
欧盟、日本是美国主要的服务贸易伙伴,分别占其服务出口额的33%和11%,进口额的38%和8%。
近年来美国逐渐加强了向发展中国家和新兴工业化国家的服务出口,如墨西哥、巴西、阿根廷、中国、韩国、马来西亚、新加坡、泰国等,这些国家每年进口美国的服务贸易都超过10亿美元以上。
二、促进美国服务贸易迅速发展的因素(一)新科技革命的机遇。
新技术革命对美国的服务贸易的发展起到巨大的推动作用。
高新技术广泛应用到美国的服务产业,大大增加了美国服务贸易的种类和范围。
同时,科学技术革命加快了美国劳动力和科技人员的国际流动。
而且使美国的产业结构逐渐向技术密集和资本密集的高科技产业转移,把劳动密集型产业转到新兴工业化国家和部分发展中国家,形成大规模的境内服务输出。
(二)服务贸易逐步自由化的良好国际经济环境。
GA TS的签定和实施为美国迎来了服务贸易逐步自由化的良好的国际经济环境。
2017年6月美国货物贸易及中美双边贸易概况
2017年1-6月美国货物贸易及中美双边贸易概况一、2017年1-6月美国货物贸易概况据美国商务部统计,2017年1-6月,美国货物进出口额为18928.3亿美元,比上年同期(下同)增长7.0%。
其中,出口7575.2亿美元,增长6.7%;进口11353.2亿美元,增长7.2%。
贸易逆差3778.0亿美元,增长8.3%。
分国别(地区)看,1-6月美国对加拿大、墨西哥、中国和日本的出口额分别为1395.6亿美元、1187.9亿美元、592.4亿美元和327.7亿美元,占美国出口总额的18.4%、15.7%、7.8%和4.3%,增长3.7%、5.0%、15.6%和8.9%;自中国、墨西哥、加拿大和日本的进口额分别为2299.1亿美元、1550.8亿美元、1503.7亿美元和667.4亿美元,占美国进口总额的20.3%、13.7%、13.3%和5.9%,增长8.4%、6.9%、10.0%和4.7%。
美国的前四大贸易逆差来源地依次是中国、墨西哥、日本和德国,1-6月逆差额分别为1706.7亿美元、362.9亿美元、339.7亿美元和305.4亿美元,增减幅6.1%、13.3%、0.9%和-5.5%。
美国的贸易顺差主要来自中国香港和荷兰,1-6月顺差额分别为165.5亿美元和127.4亿美元,增长27.0%和3.0%。
分商品看,机电产品、运输设备、化工产品和矿产品是美国的主要出口商品,1-6月出口额分别为1839.2亿美元、1306.4亿美元、806.1亿美元和673.9亿美元,占美国出口总额的24.3%、17.3%、10.6%和8.9%,增减幅3.5%、-0.7%、4.3%和44.0%。
在机电产品中,机械设备出口989.7亿美元,增长2.7%;电机和电气产品出口849.4亿美元,增长4.4%。
机电产品、运输设备和矿产品是美国的前三大类进口商品,1-6月进口3264.2亿美元、1600.2亿美元和1011.5亿美元,占美国进口总额的28.8%、14.1%和8.9%,增长6.5%、2.6%和43.3%。
美国商品贸易和服务贸易:变化与挑战

美国商品贸易和服务贸易:变化与挑战作者:安德烈斯·施瓦曾伯格王宇来源:《金融发展研究》2020年第07期摘要:2019年,美國商品贸易逆差和服务贸易顺差均有所下降,贸易逆差总体呈下降趋势,2018年以来美中贸易额明显下降。
美国商品和服务贸易面临挑战,传统的统计和会计方法未能反映企业内部贸易和中间产品贸易情况,导致贸易数据和贸易情况的扭曲。
关键词:美国;商品贸易;服务贸易;逆差中图分类号:F830 文献标识码:B 文章编号:1674-2265(2020)07-0023-02DOI:10.19647/ki.37-1462/f.2020.07.003一、美国商品贸易及其变化2019 年,美国商品出口总额为1.7万亿美元,与2018年相比,下降了1.3%,约215亿美元;美国商品进口总值为2.5万亿美元,与2018年相比,下降了1.7%,约426亿美元。
由此,与2018年相比,2019年美国商品贸易逆差减少了211亿美元,占2.4%,逆差总额降至866亿美元(见表1)。
2019年,美国主要出口类别包括机械(3791亿美元)、运输(2749亿美元)、化学品、塑料和皮革(2563亿美元)、矿产(2097亿美元);美国主要进口类别包括机械(7175亿美元)、运输(3443亿美元)、化学品、塑料和皮革(3421亿美元)、矿产(2082亿美元)。
其中,矿产进口数量比2018年下降了13.2%。
2019年,欧盟27国(不包括英国)是美国双向商品贸易的最大贸易伙伴,其次是墨西哥、加拿大和中国。
从出口规模看,加拿大是美国主要出口市场,总额为2933亿美元,占美国出口总额的17.7%;欧盟27国是美国第二大出口市场,总额为2689亿美元,占美国出口总额的16.3%。
从进口方面看,欧盟27国是美国进口的主要来源地,总额为4536亿美元,占美国进口总额的18.01%;其次是中国,总额为4527亿美元,占美国进口总额的18.0%。
中国数字服务贸易的国际对比:基本格局及对策建议
中国数字服务贸易的国际对比:基本格局及对策建议王盛晓1,李燕婷1,焦晓松2(1.大理大学经济与管理学院; 2.大理大学经济研究所,云南大理671003)[摘要]基于联合国贸发会议(UNCTAD)数据库,对中国数字服务贸易进出口及进出口增长率进行分析,同时对全球经济总量排名前十的国家展开RCA 指数分析以定位我国数字服务贸易在全球的相对地位。
结果表明,我国数字服务贸易在数字基础设施核心技术、知识产权保护、数据领域融入性方面有待提升,由此提出加大数字基础设施核心技术投入、加强对知识产权保护以及完善数字服务贸易规则等对策以更好地推动我国贸易的高质量发展。
[关键词]数字服务贸易;RCA 指数;竞争力;高质量发展[中图分类号]F752[文献标识码]A[文章编号]1009-6043(2021)12-0004-03[作者简介]王盛晓(1996-),女,山东莱芜人,硕士研究生,研究方向:民族地区区域经济;李燕婷(1995-),女,白族,云南大理人,硕士研究生,研究方向:民族地区区域经济。
[通讯作者]焦晓松(1977-),河北石家庄人,硕士生导师,副教授,博士,研究方向:国际贸易、世界经济。
[基金项目]中国服务贸易协会课题(FWMYKT-202110);云南省哲学社会科学规划项目:价值链视域下云南国内分工位置演化与转型升级研究(YB2021018);云南省哲学社会科学规划项目:复合情境下西南地区产业链协同与适应性调整研究(YB2021020)。
互联网作为新时代促进贸易稳定发展的重要驱动力,大数据、云计算、人工智能、区块链等新兴数字技术的崛起将数字经济融入传统服务贸易,促进了数字技术与传统服务贸易的融合,数字服务贸易成为促使贸易高质量发展的新动力。
数字服务贸易是指将互联网作为媒介,通过数字技术向用户提供数字产品和服务的贸易。
它主要提供数据化、信息化的服务,也包括大数据、云计算等一些新型服务,是将传统服务贸易通过数字化形式输出的贸易。