单轴压缩实验5.0版
单轴压缩实验实验方案

实验一 单轴压缩实验
一、实验目的
岩石单轴压缩是指岩石在单轴压缩条件下的强度、变形和破坏特征,通过该实验测得岩石的单轴抗压强度。
二、实验原理
岩石单轴抗压强度为岩石试件在无侧限和单轴压力作用下抵抗破坏的极限能力,其值为:
A
P σc
式中:σc —单轴抗压强度,MPa ;
P —无侧限条件下岩石试件的轴向破坏荷载,N ; A —试件的截面面积,mm 2;
三、试样制备
1.试样可用钻孔岩芯或岩块,在取样和试样制备过程中,不允许人为裂隙出现。
2.试样规格:采用直径为50mm ,高为100mm (高径比为2)的标准圆柱体。
3.加工精度:试样两端面的平行度偏差不得大于0.1mm ;试样两端的直径偏差不得大于0.2mm ;试样的两端面应垂直于试样轴线。
4.试样数量:每种状态下试样的数量一般不少于3个。
5.含水状态:采用自然状态,试样制成后放在底部有水的干燥器内1~2d ,以保持一定的湿度,但试样不得接触水面。
四、实验设备
圆柱标准试样、游标卡尺、液压材料试验机、承压板或垫块(尽可能采用与岩石刚度相接近的材料)。
五、实验步骤
1.测定前核对岩石名称和试样编号,并对试样的颜色、颗粒、层理、裂隙、风化程度、含水状态等进行描述。
2.用游标卡尺测量试样尺寸,保留两位小数。
3.将试样放置在压力机承压板中心,调整承压板使试样均匀受力。
4.开动试验机,以0.5 ~0.8 MPa/s的加载速度对试样加载,直到破坏。
5.记录破坏载荷,破坏类型描述。
六、数据处理
岩石抗压强度测定结果填入下表。
表1 岩石抗压强度测定结果。
工程地质知识:单轴压缩变形试验进行步骤.doc
工程地质知识:单轴压缩变形试验进行步骤(1)选择电阻应变片时,电阻片阻栅长度应大于岩石颗粒的10倍,并应小于试件的半径。
同一试件所选定的工作片与补偿片的规格、灵敏系数等应相同,电阻值相差应不大于0.2。
(2)电阻应变片应牢固地粘贴在试件中部的表面,并应避开裂隙或斑晶。
纵向或横向电阻应变片的数量不得少于2片,其绝缘电阻值应大于200M。
(3)将试件置于试验机承压板中心,调整球形座,使试件受力均匀。
(4)以每秒0.5~1.0MPa的速度加荷,逐级测读荷载与应变值直至破坏,测值不应少于10组。
(5)记录加荷过程及破坏时出现的现象,并对破坏后的试件进行描述。
单轴压缩实验和划痕实验确定单轴抗压强度

Rock Mechanics for Natural Resources and InfrastructureSBMR 2014 – ISRM Specialized Conference 09-13 September, Goiania, Brazil© CBMR/ABMS and ISRM, 2014UCS Estimation through Uniaxial Compressive Test, Scratch Test and Based Log Empirical CorrelationAnselmo Machado BorbaPetrobras, Rio de Janeiro, Brazil, anselmoborba@.brFrancisco Henriques FerreiraPetrobras, Rio de Janeiro, Brazil, francisco@.brErick Slis Raggio SantosPetrobras, Rio de Janeiro, Brazil, erick_slis@.brVictor Manuel Domingues MenezesPetrobras, Rio de Janeiro, Brazil, victormdm@.brMichael StrugalePetrobras, Rio de Janeiro, Brazil, michael_strugale@.brSUMMARY: In Petroleum, Civil and Mining Engineering, designing structures dealing with rock mass is a day-to-day activity. In order to execute such projects, it is essential to know the strength and deformability of rocks, as well as their in situ stress state. In Petroleum Engineering, especially, obtaining rock samples from a well and carrying out lab mechanical tests is costly and time-consuming. Thus, Petroleum Engineers have been attempting to determine rock mechanical properties through index tests or log-based correlations as to expedite this process and reduce the global cost of the activity. I order to be confident about results obtained via index tests or correlations, though, it is necessary to carry out a calibration of such outcomes against results from standard mechanical tests. In this article, a procedure used to determine the unconfined compressive strength is proposed. The data from that process supports the planning of two pilot projects to be developed by Petrobras in an on-shore oil field. In order to estimate the UCS for this oil field, three methods were applied: the standard uniaxial test, the scratch test and a log-based correlation. Due to the excellent agreement among results of all three methods, it was possible to extrapolate the data regarding UCS for the entire interval to be analyzed. The set of logs available, mainly transit-time and density log, was used as a guide in the UCS extrapolation process.KEYWORDS: Strength and elastic property of rock, scratch test, uniaxial compressive test, empirical correlation for UCS, rock mechanics, mechanical lab test.1.INTRODUCTIONRock mechanical characterization plays an important role in designing projects involving rock mass. However, the mechanical characterization of a material with natural occurrence, frequently presenting an anisotropic behavior and non-homogeneous distribution, is a challenging activity.In that context, rock mechanical characterization in a lab is a keystone for engineering projects involving rock mass. The unconfined compressive strength (UCS) test is the oldest and simplest lab test for that end and it is still widely performed (Jaeger et al., 2007). In this article, the uniaxial compressive test is used to determine the unconfined compressive strength using samples from petroleum well. Moreover, UCS is estimated through an index test, the scratch test. The methodology for this test was introduced in the 90´s by Richard et al. (1998).Additionally, UCS is estimated using electrical logs and an empirical correlation. The used correlation is suitable for sandy and argillaceous formations. Afterwards, the UCS estimated by these three tests was compared, aiming at upscaling it for the entire logged interval.The main goal of this article is to obtain UCS in three distinct scales: small (through uniaxial compressive tests, using samples); intermediary (through scratch test performed on rock cores) and large (through empirical correlation and well logs).2. METHODOLOGYThe target petroleum field of this analysis is an on-shore oil producer field whose reservoir burial depth ranges from 900 to 1300 m. PETROBRAS intends to implement two pilot projects in this field. The first one will be an enhanced oil recovery (EOR) project through CO2 injection; the other one will be a CO2 geological disposal project. The rock mechanical characterization presented in this article is part of the effort of designing both pilot projects.For the first cored well, a 42 meter-long core was cut. From this core, the interval of rock ranging from 1049 to 1067 m was selected to be tested. The main lithology components of the selected interval are: sandstone, shale, argillite and siltstone. The interval also presents thin lens of bioclastic grainstone.For the selected interval, a campaign of mechanical tests - including conventional UCS tests and scratch tests – was designed. The main purpose of that campaign was to characterize the unconfined compressive strength of the analyzed interval. Furthermore, an empirical correlation to estimate UCS was used. Due to the predominant lithology of the analyzed interval, it was decided that a well-known correlation employed in the program MechPro TM(Fjær et al., 1992, p.232) would be used. This correlation was proposed by Coates and Denoo (1981) and Anderson et al. (1986). It relies on the comprehensive rock mechanical test campaign performed by Deere and Miller (1969) for the United State Air Force. 3. DETERMINING THE UCSRock unconfined compressive strength is one of the most frequently used parameters in engineering studies dealing with intervention in rock masses. In order to determine this parameter, the uniaxial compression test is usually employed. Alternatively, in the late 90’s, an indentation strength test able to assess the UCS of the scratched material was proposed and christened scratch test(Richard et al., 1998). For the analyzed well, there is yet a third way of assessing the UCS; through empirical correlations using information obtained by the lowering of electric logs into the well (mainly acoustic and porosity logs).3.1 Uniaxial Compression TestCurrently, the uniaxial compression test is still the most frequently employed procedure for the purposes of rock mechanical characterization. As an example, many classifications of rock materials are developed solely from rock uniaxial compression data (Azevedo and Marques, 2002). The test is used not only to assess a rock's strength (UCS), but also its deformability modulus (elastic or Young’s modulus and Poisson’s ratio).The test consists of compressing a cylindrical plug between two metallic caps, inducing the rock sample to a state of uniaxial stress. The sample is loaded until failure.3.2 Scratch TestThe scratch test is an alternative, simpler and less expensive way of assessing a rock’s unconfined mechanical strength (Richard et al., 1998, Schei et al., 2000 and Richard et al., 2012). The test comprises measuring the tangential and normal forces necessary to create a groove or scratch in the core outer surface or in its slabbed face.The equipment used in the scratch test is comprised of a v-shaped rack to support and fix the rock core and a mobile block. In the lower part of the moving block, there is a sharp diamond cutter.In order to perform the scratch test, the sample is placed and fixed on the rack. As thesharp cutter moves along the sample, a rectangular groove is created. Two load cells are assembled in the moving block aiming at measuring the normal and tangential forces applied to create the groove. Figure 1 depicts the scratch test equipment employed in Petrobras’ Rock Mechanics Laboratory to perform the tests described in this study..Figure1.ScratchTest equipment employed throughout the mechanical test campaign (Wombat TM , 2011).During the performance of the test, it must be ensured that the rock removed from the groove is reduced to powder, avoiding spalled fragments. The determinant factor in obtaining powder or spalled fragment is the fixed depth for the groove. An experienced operator should be able to choose the suitable depth in order to avoid the latter.Theoretically, the groove may present any shape. However, most commonly, it presents a transversal rectangular section, shaped by a cutter with a width of 10 mm. As mentioned before, the depth should be fixed by the operator. Depending on the rock strength level, it is possible to assess both the UCS and the internal friction angle by employing sharp and dull cutters, respectively.In this study, only the rock’s UCS is being measured, which requires a sharp cutter and the registering of the tangential force.The measurement of the tangential resistance force comprises two factors:1. energy spent on rock fragmentation;2. friction between the cutter’s lower face and the groove’s base .Only the first factor is related to rock strength, but both of them constitute the tangential force. In order to eliminate the effect of friction, the latter is regarded as independent from the groove’s depth, and cuts with varying depths are performed. Afterwards, a tangential force (F cs ) vs. grove’s depth (wd ) graphic is plotted, similar to the one in Figure 2. The slope of the fitted straight-line, ԑ, represents the intrinsic specific energy (ISE ), which is proportional to the rock's unconfined compressive strength.Figure 2. Standard curve of an ISE analysis (Wombat™, 2011).In the specific case of the employed cutter’s geometry, the coefficient of proportionality is equal to one; therefore, the ISE is equal to the UCS. The fitted straight-line y-intercept equals the friction force between the cutter and the groove. As mentioned before, this parameter has no significance in the UCS determination. Differently from UCS tests, the scratch test can be considered quasi-nondestructive. In the worst-case scenario, the groove depth reachesapproximately 5 mm. This scenario happens when there is a highly fragmented rock or an unleveled core. In such cases, it is necessary to level the core and, consequently, it is necessary to scratch the rock more times, reaching a deeper groove. As it should be noted, the rock consumption in such kind of test is irrelevant.The compressive strength determined by a scratch test should be interpreted as an estimative; thus, some conventional uniaxial compressive strength tests must be performed in order to calibrate the UCS curve previously obtained. However, the scratch test offers the following advantages:•it provides a UCS log throughout the extension of the core, generating more data than the uniaxial compressive test;•it allows for UCS estimative in millimetric or centimetric scale, so the test is capable of capturing the rock heterogeneity in a higher resolution;•it can be considered a quasi-nondestructive test, bearing in mind its low consumption of material.The scratch test capacity of providing small-scale quantitative description of heterogeneities along the cores, combined with petrophysical properties - obtained from lab tests or well logs - can improve the selection of plug samples for further lab tests. In this study, the plugs that underwent uniaxial compressive tests were selected based on scratch test results.3.3 Correlation with electric logsIn the past, the petroleum industry attempted to directly measure elastic properties in bottomhole conditions, e.g.: THE TM(Kuhlman et al., 1993), a wellbore extensometer. Field tests conducted by Petrobras experts using such tool were not successful, though.The lack of reliable tools to directly measure compressive/tensile strength and elastic properties of rocks in oil wells has encouraged the development of a considerable number of empirical correlations for estimating such properties. Many of those correlations rely on the registering of well logging, such as acoustic transit-time logs, or on other properties stemming from logs, such as porosity (Fjær et al., 2008, p.294).Rivera et al. (2002) remark that log measurements are frequently employed for: i) identifying problematic intervals; ii) selecting intervals for lab characterization; and iii) upscalling lab results to the field scale, in order to outline the physical properties of reservoir and surrounding rocks.Each log presents their own vertical resolution and radius of investigation; thus, depending on the rock’s degree of heterogeneity, log measurements may not be able to accurately detect the variation of rock properties. According to Santos and Ferreira (2010), a typical log vertical resolution is around 1 ft. or higher, which might be insufficient in detecting the rock’s heterogeneity. Under such conditions, two scenarios might unfold: i) the underestimation of strength in strong intervals; or ii) the overestimation in weak ones. In both scenarios, the rock’s physical properties are poorly represented.In the literature, it is possible to find several technical articles dealing with the determination of compressive strength and elastic properties of rocks using empirical correlations and log-based data. Chang et al. (2006) and Odulami et al. (2011) present a comprehensive review of correlations proposed by a number of authors. Such correlations are function of logs such as acoustic transit-time or wave velocity, density, Young’s modulus, shale content, porosity, etc. The authors also group the empirical correlations according to lithology, degree of consolidation, among others.If there is no available empirical correlation for an analyzed oil or gas field, it is necessary to take an existing one from the literature concerning mainly the lithology, but also the burial depth, consolidation degree and, of course, the set of available logs.It is also advisable to perform some mechanical lab tests to calibrate the chosen correlation for the analyzed field, as it should be discussed ahead in this article.It should be kept in mind that the empirical correlation was chosen considering mainly the lithology of the analyzed interval. Therefore, the MechPro TM UCS correlation was selected because it is suitable for shale and sandstone presenting a varying level of clay content. TheC&D UCS correlation is expressed for the following equation (Fjær et al., 1992, p. 232):1.9∙101 1∙ 1 2 ∙ 1 0.78 (1)In order to have UCS expressed in MPa , the following units in expression 1 should be used: ρ is the rock density (kg/m 3); V p is the shear wave velocity (m/s ); ν is the Poisson’s ratio (dimensionless); V sh is the shale content (dimensionless).The C&D correlation relies on a more general empirical correlation proposed by Deere and Miller (D&M) (1969). Using the D&M correlation it is possible to estimate UCS for limestone and dolomite besides shale and sandstone, as proposed by C&D. Figure 3 presents a graphical representation of the D&M UCS correlation. In this graphic, one can see some colored points representing results of UCS tests performed using limestone plugs from a Petrobras’ oil field.Santos and Ferreira (2010) have proposed a correlation to estimate UCS to limestone based on D&M correlation. This correlation might be taken as an extension of the C&D work.4.RESULTSThe first step of the mechanical test campaign was to perform the scratch test in an 18 meter-core interval, ranging from 1049 to 1067 m, as showed in Figures 4 and 5. The characterization of the entire 18-meter rock section was not possible due to the integrity of certain intervals of the material, especially those with a predominantly shale lithology. It would seem that such material presents a physico-chemical and mechanical instabilities. Trying to avoid the former instability the core was cut in an oil-based drilling fluid and transported in properly sealed containers filled with the oil used in the fluid formulation, in order to avoid contact with air moisture.Figure 4. Core sampled from a depth ranging from 1049 to 1058 m (driller´s measured depth - DMD).Figure 5. Core sampled from a depth ranging from 1058 to 1067 m (driller´s measured depth - DMD).The UCS estimated by the scratch test arepresented in Figure 6. This figure also presents UCS estimated by the uniaxial compressive tests and C&D empirical correlation. In order to simplify the analysis, additional information is plotted in Figure 6, such as lithology, compressional transit-time and gamma ray logs and shale content.Figure 6. UCS results from three analyses performed using core, plugs and logs from the selected well It is estimated that a significant part of the tested section presents unconfined compressive strength lower than 100MPa, displaying, nonetheless, peaks of almost 250MPa.In order to perform the uniaxial compression tests, 10 standard cylindrical plugs were selected and cut. The plug selection took into account the UCS from scratch tests previously performed. Seven of those plugs were subjected to a nondestructive analysis of acoustic velocity testing. In such test, the rock dynamic elastic properties (Young’s modulus and Poisson’s ratio) is determined. Table 1 presents the geometric characteristics of plugs (burial depth, diameter and height) and the estimated elastic dynamic properties. Additionally, it is presented the plug lithology and porosity (φ).As it can be seen in Table 1, 70% of the tested plugs were sandstone. This happened due to the difficulty of cutting plugs from other lithologies, especially shale that is frequently present in the interval chosen for this characterization.Table 1. Geometric characteristics, lithology, porosity and dynamic elastic properties of plugs selected to undergo uniaxial compression tests.[Plug]Dep.(m)LithoD(mm)H(mm)φ (%)E d(GPa) CP01 1052.8 SHL 38.1 79.7 10.0 35.5 0.15 CP02 1054.7 SND 38.2 80.4 15.1 30.3 0.13 CP03 1055.4 SND 38.4 80.6 20.2 21.0 0.13 CP04 1056.0 SND 38.0 80.1 21.8 21.0 0.11 CP05 1056.3 SND 38.1 80.1 - - -CP06 1056.8 SND 38.2 80.1 11.7 26.5 0.11 CP07 1057.5 SND 38.1 80.2 - - -CP08 1058.4 ARG 38.0 80.1 - - -CP09 1060.3 SND 38.2 80.1 5.1 39.8 0.12 CP10 1066.4 SHL 38.2 77.9 3.8 20.8 0.05 Selected plugs' lithology, namely shale (SHL), sandstone (SND) and argillite (ARG). Dep = driller´s measured depth (DMD).Results from the uniaxial compressive tests (UCS, static Young’s modulus and static Poisson’s ratio) are shown in Table 2.For purpose of comparison UCS is plotted in Figure 6 along with the other two estimated values for this parameter (scratch test and empirical correlation).Table 2. Results from the uniaxial compression test.[Plug] UCS (MPa) E (GPa) νCP01 70.8 24.2 0.26CP02 70.2 14.1 0.13CP03 37.6 8.7 0.15CP04 31.1 6.5 0.21CP05 44.7 6.3 0.15CP06 51.2 9.4 0.18CP07 39.4 7.5 0.05CP08 61.4 9.3 0.22CP09 158.9 32.6 0.11CP10 48.6 7.2 0.18All uniaxial compression tests were performed under assumed drained conditions (plug’s top and bottom were vented). However, in the case of both shale tests, it is impossible to assure that conditions were perfectly drained, given the low capacity of pore pressure diffusion typical to this kind of rock.Analyzing Figure 6, one can see that there is a very good agreement among the results from the three methods applied to estimate UCSforthe selected well.In that case, the gamma ray log and the core- gamma do not present remarkable enough peaks to render a satisfactory depth correlation; this is the conventional depth correction methodology.Due to the resolution of the scratch test, the depth correction was made using scratch test results. Comparing scratch test results and compressional transit-time log, the core-depth (DMD) was shifted - 2.4 m downward - in order to fit the log-depth (LMD). This might be seen as an additional feature of the scratch test.5. CONCLUSIONThis article presents the results of the unconfined compressive strength ascertained by means of three methods: standard uniaxial test, scratch test and log-based empirical correlation. The results from the three distinct methods are in agreement and, because of that, it was possible to extrapolate the values obtained from the core analyses to the entire rock interval being considered in the two aforementioned pilot projects.If one intends to indirectly estimate UCS values, it is strongly advisable to perform some standard mechanical test in order to calibrate the values obtained by indirect methods, as it was showed in this article. ACKNOWLEDGEMENTThe authors gratefully acknowledge Petrobras for supporting the study and permitting to publish the results.REFERENCESAnderson, R., Coates, G., Denoo, S., Edwards, D., and Risnes, R. (1986). Formation collapse in a Producing Well, The Technical Review 34, p.29-32. Azevedo, I.C.D., and Marques, E.A.G. (2002).Introdução à Mecânica das Rochas, 1ª edição, Viçosa, Editora UFV (in portuguese).Bieniawski, Z.T., and Bernede, M.J. (1979). Suggested Methods for Determining the Uniaxial Compressive Strength and Deformability of Rock Materials, International Journal of Rock Mechanics and Mining Sciences & Geomechanics Abstracts, Vol. 16, n. 2, p.135-140.Chang, C., Zoback, M.D., and Khaksar, A. (2006).Empirical relations between rock strength and physical properties in sedimentary rocks, Journal of Petroleum Science and Engineering 51, p. 223-237. Coates, G.R., and Denoo, S.A. (1981). Mechanical properties program using borehole analysis and Mohr´s circle, SPWLA 22nd Annual Logging Symposium.Deere, D.U., and Miller, R.P. (1969). Engineering classification and index properties for intact rock, Tech. Rep. AFWL-TR-65-1l6.Fjær, E., Holt, R.M., Horsrud, P., Raaen, A.M., and Risnes, R. (1992). Petroleum Related Rock Mechanics, 1st ed., Elsevier, Amsterdam, 346p.Fjær, E., Holt, R.M., Horsrud, P., Raaen, A.M., and Risnes, R. (2008). Petroleum Related Rock Mechanics, 2nd ed., Elsevier, Amsterdam, 491p. Jaeger, J.C., Cook, N.G.W., and Zimmerman, R.W.(2007), Fundamentals of Rock Mechanics. 4ª edição, Malden, Blackwell Publishing.Kuhlman, R.D., Heemstra, T.R., Ray, T.G., Lin, P., and Charlez, P.A. (1993). Field Test of Downhole Extensometer Used to Obtain Formation In-Situ Stress Data., SPE Rocky Mountain Regional / Low Permeability Reservoir Symposium, Denver, April 12-14, 1993, SPE-25905.Odunlami, T., Soroush, H., Kalathingal, P., and Somerville, J. (2011). Log-Based Rock Property Evaluation - A New Capability in a Specialized Log Data Management Platform, SPE/DGS Saudi Arabia Section Technical Symposium and Exhibition, 15-18 May, Al-Khobar, Saudi Arabia, SPE-149050. Richard, T., Dagrain, F., Poyol, E., and Detournay, E.(2012). Rock Strength Determination from Scratch Tests, Engineering Geology, vol. 147-148, p. 91-100. Richard, T., Detournay, E., Drescher, A., Nicodème, P., and Fourmaintraux, D. (1998). The Scratch Test as a Means to Measure Strength of Sedimentary Rocks, SPE/ISRM Eurock´98, Trondheim, 8-10 July, SPE- 47196.Rivera, R.S., Stenebråten, J., and Dagrain, F., (2002).Continuous scratch testing on core allows effective calibration of log-derived mechanical properties for use in sanding prediction evaluation, SPE/ISRM Rock Mechanics Conference, Irving, TX, USA.Santos, E.S.R., and Ferreira, F.H. (2010). Mechanical Behavior of a Brazilian Off-Shore Carbonate Reservoir, 44th U.S. Rock Mechanics Symposium and 5th U.S.-Canada Rock Mechanics Symposium, Salt Lake City, UT, USA.Schei, G., Fjær, E., Detournay, E., Kenter, C.J., Fuh,G.F., and Zausa, F. (2000). The Scratch Test: AnAttractive Technique for Determining Strength and Elastic Properties of Sedimentary Rocks, Society of Petroleum Engineers.Wombat Machine (2011) – User Manual – Software Ver.1. Technical manual, EPSLOG, October 2011.。
混凝土单轴压缩试验
混凝土单轴压缩试验混凝土单轴压缩试验是一种测试混凝土材料抗压强度的实验方法。
在实验过程中,试件受到等应力的压缩力,并按照一定的试验规程进行,其压缩破坏压力、变形能力以及抗压强度等性能指标的测定,反映了材料的压缩强度、变形能力及耐久性等。
具体的实验步骤如下:1.准备试件:制作一批规格相同的混凝土试件,通常是圆柱形或长方体形。
确保试件在龄期、养护条件等方面与实际工程中的混凝土相同。
2.安装试件:将试件放置在试验机的压缩夹具中,确保试件端面平整、垂直,并与轴线对齐。
3.加载:启动试验机,对试件施加均匀的压缩力。
在压缩过程中,记录试件的变形量、压力等数据。
4.观察和记录:观察试件在压缩过程中的表现,记录其开裂、破坏等情况。
注意观察试件在不同受力阶段的变形情况,如弹性变形、塑性变形等。
5.数据处理:根据实验数据,计算试件的抗压强度、弹性模量等性能指标。
抗压强度可以通过最大压力除以受压面积得到,弹性模量可以根据压力与变形的曲线斜率计算。
6.结论分析:根据实验结果,分析混凝土的抗压强度、变形能力及耐久性等性能指标,评估其在实际工程中的适用性和可靠性。
在进行混凝土单轴压缩试验时,需要注意以下几点:1.确保试验机的精度和稳定性符合要求,以获得准确的实验结果。
2.严格按照试验规程进行操作,避免人为误差和操作失误。
3.在实验过程中,注意观察试件的表现和变化,及时发现异常情况并处理。
4.在数据处理和结论分析时,要综合考虑实验数据和工程实际应用情况,避免过度解读或误导。
总之,混凝土单轴压缩试验是一种重要的混凝土性能测试方法,通过对实验数据的处理和分析,可以深入了解混凝土材料的抗压强度、变形能力和耐久性等方面的性能指标,为实际工程提供可靠的材料选择和应用方案。
实验五岩石单轴压缩实验
实验五岩石单轴压缩实验一.实验目的岩石单轴压缩是指岩石在单轴压缩条件下的强度、变形和破坏特征。
通过该实验掌握岩石单轴压缩实验方法,学会岩石单轴抗压强度、弹性模量、泊松比的计算方法;了解岩石单轴压缩过程的变形特征和破坏类型。
二.实验设备、仪器和材料1.钻石机、锯石机、磨石机;2.游标卡尺,精度0.02mm;3.直角尺、水平检测台、百分表及百分表架;型液压材料试验机;型静态电阻应变仪;6.电阻应变片(BX-120型);7.胶结剂,清洁剂,脱脂棉,测试导线等。
三.试样的规格、加工精度、数量及含水状态1. 试样规格:采用直径为50 mm,高为100 mm的标准圆柱体,对于一些裂隙比较发育的试样,可采用50 mm×50 mm×100 mm的立方体,由于岩石松软不能制取标准试样时,可采用非标准试样,需在实验结果加以说明。
2. 加工精度:a 平行度:试样两端面的平行度偏差不得大于0.1mm 。
检测方法如图5-1所示,将试样放在水平检测台上,调整百分表的位置,使百分表触头紧贴试样表面,然后水平移动试样百分表指针的摆动幅度小于10格。
b 直径偏差:试样两端的直径偏差不得大于0.2 mm ,用游标卡尺检查。
c 轴向偏差:试样的两端面应垂直于试样轴线。
检测方法如图5-2所示,将试样放在水平检测台上,用直角尺紧贴试样垂直边,转动试样两者之间无明显缝隙。
3.试样数量: 每种状态下试样的数量一般不少于3个。
4.含水状态:采用自然状态,即试样制成后放在底部有水的干燥器内1~2 d ,以保持一定的湿度,但试样不得接触水面。
四.电阻应变片的粘贴1.阻值检查:要求电阻丝平直,间距均匀,无黄斑,电阻值一般选用120欧姆,测量片和补偿片的电阻差值不超过Ω。
1—百分表 2-百分表架 3-试样4水平检测台1—直角尺 2-试样 3- 水平检测台图5-3 电阻应变片粘试2.位置确定:纵向、横向电阻应变片粘贴在试样中部,纵向、横向应变片排列采用“┫”形,尽可能避开裂隙,节理等弱面。
实验五岩石单轴压缩实验

实验五岩石单轴压缩实验一、实验目的1、掌握岩石单轴压缩实验的基本原理和方法。
2、了解岩石单轴压缩强度的测试方法。
3、通过实验了解岩石在不同压力下的力学性质。
4、了解矿山工程中用于确定岩石层强度、稳定性和采矿方法选择的基本实验方法。
二、实验原理在实验室条件下,对岩石进行单轴压缩实验,即将岩石样品置于压力机滑动块与固定块之间,施压加荷,岩石样品在压力的作用下发生变形,最终出现破裂破坏。
这种实验方法可以测定岩石样品在单轴压缩应力下断裂时的应力水平值和断裂模式,是评估岩石力学性质和确定其强度和稳定性的重要方法。
单轴压缩强度表示岩石样品在单轴压缩下破坏时的最大承受压力或应力水平。
在实验过程中,将岩石样品沿其轴向方向施以单向的压力,直到样品发生破坏,根据压力与样品断面积之比计算出样品的单轴压缩强度。
单轴压缩实验中常用的岩石模型为标准直径为50mm、高度为100mm、直径与高度比为1:2的圆柱形样品。
通过实验获取不同压力下岩石样品的应变和应力的数据,利用数据处理方法分析出样品的单轴压缩强度和岩石在不同压力下的变形和断裂模式。
三、实验步骤1、制备标准圆柱形样品在实验之前,制备标准的圆柱形样品是非常重要的,直径为50mm、高度为100mm,或者根据实际情况选择其他规格的样品。
2、测量标准圆柱形样品尺寸使用卷尺对样品的直径和高度进行测量,并记录下来,便于计算样品的断裂强度。
3、安装压力机将样品放置在压力机的压缩板上,并确保样品在滑动块与固定块之间完全垂直。
调整滑动块的位置,使其与样品顶部接触。
将固定块和滑动块夹紧,用气动或手动方式施压。
4、开始施压施加压力,开始进行单轴压缩实验,随着施压的增加,记录下实验的每一阶段应变和应力数据。
5、记录数据根据实验数据绘制出应力-应变曲线、应力-时间曲线,计算出单轴压缩强度。
模拟分析样品破裂模式。
6、进行岩石单轴压缩实验的注意事项a、施压过程应逐步增加,避免突然增压,以免样品产生损伤。
单轴压缩实验实验方案
实验一 单轴压缩实验
一、实验目的
岩石单轴压缩是指岩石在单轴压缩条件下的强度、变形和破坏特征,通过该实验测得岩石的单轴抗压强度。
二、实验原理
岩石单轴抗压强度为岩石试件在无侧限和单轴压力作用下抵抗破坏的极限能力,其值为:
A
P σc
式中:σc —单轴抗压强度,MPa ;
P —无侧限条件下岩石试件的轴向破坏荷载,N ; A —试件的截面面积,mm 2;
三、试样制备
1.试样可用钻孔岩芯或岩块,在取样和试样制备过程中,不允许人为裂隙出现。
2.试样规格:采用直径为50mm ,高为100mm (高径比为2)的标准圆柱体。
3.加工精度:试样两端面的平行度偏差不得大于0.1mm ;试样两端的直径偏差不得大于0.2mm ;试样的两端面应垂直于试样轴线。
4.试样数量:每种状态下试样的数量一般不少于3个。
5.含水状态:采用自然状态,试样制成后放在底部有水的干燥器内1~2d ,以保持一定的湿度,但试样不得接触水面。
四、实验设备
圆柱标准试样、游标卡尺、液压材料试验机、承压板或垫块(尽可能采用与岩石刚度相接近的材料)。
五、实验步骤
1.测定前核对岩石名称和试样编号,并对试样的颜色、颗粒、层理、裂隙、风化程度、含水状态等进行描述。
2.用游标卡尺测量试样尺寸,保留两位小数。
3.将试样放置在压力机承压板中心,调整承压板使试样均匀受力。
4.开动试验机,以0.5 ~0.8 MPa/s的加载速度对试样加载,直到破坏。
5.记录破坏载荷,破坏类型描述。
六、数据处理
岩石抗压强度测定结果填入下表。
表1 岩石抗压强度测定结果。
单轴压缩试验用荷载控制设置参数
【单轴压缩试验用荷载控制设置参数】一、介绍在材料力学领域,单轴压缩试验是一项非常重要的实验,用于研究材料在不同压缩条件下的性能和行为。
而荷载控制设置参数,作为整个试验过程的基础和关键,对于试验结果的准确性和可靠性起着至关重要的作用。
本文将就单轴压缩试验用荷载控制设置参数进行探讨,并共享个人对此的理解。
二、荷载控制设置参数的重要性1. 在单轴压缩试验中,荷载控制设置参数包括加载速率、加载方式、加载范围等。
这些参数直接影响试验中施加在试样上的力的大小和变化规律,从而影响试验结果。
合理的荷载控制设置参数可以确保试验数据的准确性和可比性,为后续的分析和应用提供可靠的依据。
2. 合理的荷载控制设置参数还可以使试验结果更加客观和全面。
通过合理设置加载速率和加载方式,可以使试验过程中材料的应力应变关系得到更加详尽的表征,从而为材料性能的评价和预测提供更多的信息和依据。
三、合理选择荷载控制设置参数的原则在单轴压缩试验中,选择合适的荷载控制设置参数是非常重要的。
以下是一些原则,供大家参考:1. 加载速率:加载速率是指单位时间内施加在试样上的力的变化量。
在选择加载速率时,应考虑材料的特性,比如脆性材料和塑性材料对加载速率的敏感程度不同,需要根据具体情况合理选择。
2. 加载方式:加载方式可以分为恒速加载和变速加载。
恒速加载适用于需要得到材料在不同应力下的应变率的试验,而变速加载则适用于需要研究材料不同压缩速率下的变形行为和变化规律的试验。
3. 加载范围:加载范围是指试验中所选取的荷载的范围和变化规律。
合理选择加载范围,有助于研究材料在不同荷载条件下的性能和行为,为材料的应用提供更多的参考和依据。
四、个人观点和理解在实际的工程应用中,合理选择单轴压缩试验用荷载控制设置参数需要结合具体的材料特性和试验目的来进行。
在选择荷载控制设置参数的过程中,应充分考虑材料的强度、变形特性、加载速率敏感性等因素,确保试验结果的准确性和客观性。
煤岩单轴压缩试验研究

煤岩单轴压缩试验研究煤岩是地质学中最重要的成分之一,它不仅只是地质调查中的重要物质,而且在岩体物理性质、岩石力学性能、岩石工程设计、岩石矿物分析、油气资源开发等多个领域都占据了重要的地位。
在传统的工程实践中,例如岩石压力实验、地质参数调查、地质模型研究等,煤岩的压缩性能测定一直是重要的内容。
煤岩单轴压缩试验是一种用于研究煤岩单轴压缩性能的试验方法,主要是通过将单轴力应用于某一节点,测定沿着压缩方向的总应力及其改变率,从而对煤岩的压缩性能进行准确的测量。
压缩试验是煤岩力学性质研究的基础,也是煤岩工程设计和应用中的重要手段。
由于煤岩的不同性质、不同型号的单轴压缩机的使用和煤岩试件的制备,煤岩单轴压缩试验可以分为许多不同的类型。
按照试验条件,分为室温单轴压缩试验和高温单轴压缩试验;按照试验类型,分为时间变化试验和力变化试验;按照单轴压缩机的不同,可以分为动力单轴压缩试验和静力单轴压缩试验。
煤岩单轴压缩试验的实施过程中应考虑各种因素,例如试件的制备、单轴压缩机的精度、实验参数的设定等。
首先,为了使实验结果更准确,应以精度为首要考虑因素,选择正确的力学仪器和仪器参数;其次,要考虑煤岩的制备,以便确保煤岩试件的成型性和实验状态的稳定性;最后,要考虑实验参数的设定,以便确保试验中充分代表岩石压缩特性的参数和合理的试验数据采集。
煤岩单轴压缩试验同样也有可能会存在一定的误差,主要是由于实验条件的复杂性、试件的制备和测量的不准确性等原因所造成的。
因此,应采用不同的实验方法和不同的评价标准来确保煤岩单轴压缩试验结果的正确和准确。
此外,针对煤岩单轴压缩试验方法也有一些改进办法。
如改变单轴压缩机的设计结构,使单轴力及其改变率更加准确和精确;研究不同型号煤岩试件在不同温度下的压缩变形特性,以及利用数字化技术处理煤岩单轴压缩试验数据。
通过对煤岩单轴压缩试验的研究,可以为煤岩的力学性质研究、岩石工程设计、岩石力学分析等奠定基础,为岩石矿物分析、地质参数调查和油气资源开发提供重要的参考。
不同分层数量的煤系地层岩石单轴压缩试验分析
收稿日期:2023-02-10作者简介: (1986-),,,,。
doi:10.3969/j.issn.1005-2798.2023.11.020不同分层数量的煤系地层岩石单轴压缩试验分析李 凯,乔卫民,贺丽峰(山西蒲县煤业集团富家凹煤业有限公司,山西临汾 041000)摘 要:,-10153,。
,,,6.30%~88.58%.、、、。
,,,,,。
关键词:层状岩体;分层厚度;单轴压缩中图分类号:TD315 文献标识码:B 文章编号:1005-2798(2023)11-0076-05 、,[1]。
[2],、[3]。
,[4-7]。
、,[8-10],、,。
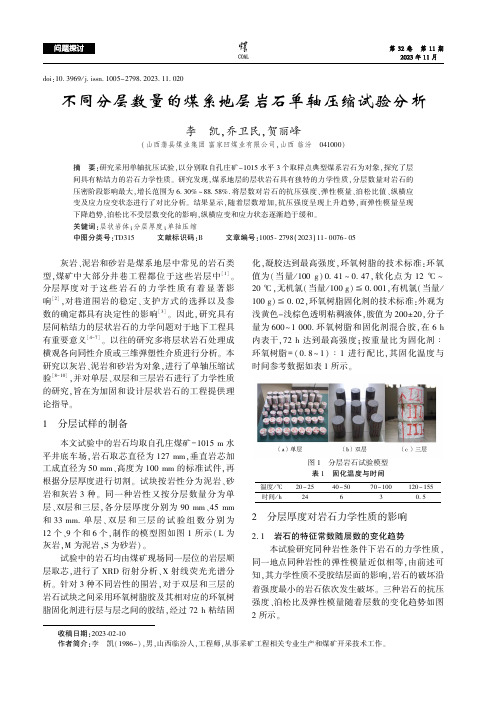
1 -1015m ,127mm,50mm、100mm ,。
、3。
、,90mm、45mm 33mm.、12、96,1(L ,M ,S )。
,XRD 、X 。
3,,72h ,,:(/100g)0.41~0.47,12℃~20℃,(/100g)0.001,(/100g)0.02,:-,200±20,600~1000.,6h ,72h ;∶=(0.8~1)∶1,1。
1 表1 固化温度与时间/℃20~2540~5070~100120~155/h24630.52 2.1 岩石的特征常数随层数的变化趋势,,,,。
、2。
2 3 2(a),,,3,3.57%,9.77%,23.63%,39.82%,15.61%,17.17%.2(b),,。
2(c),,、、16.68%、26.18%、18.26%,,5.35%、1.61%、-3.71%,。
2.2 岩石的横向应变与纵向应变的关系,,,,,33。
表2 3种岩石的力学参数L-123M-123S-123σc/MPa73.3275.9480.4852.6765.1273.6551.6959.7660.57μ0.240.280.270.270.210.230.170.180.15 E/Gpa35.8429.8627.9534.7125.6225.0631.3625.6326.63 3,,,,,,,。
单轴压缩实验
实验2 单轴压缩实验
李享荣 编写
一、实验目的
1.观察并比较低碳钢和铸铁在压缩时的变形和破坏现象。
2.测定低碳钢的屈服极限和铸铁的强度极限。
二、实验原理
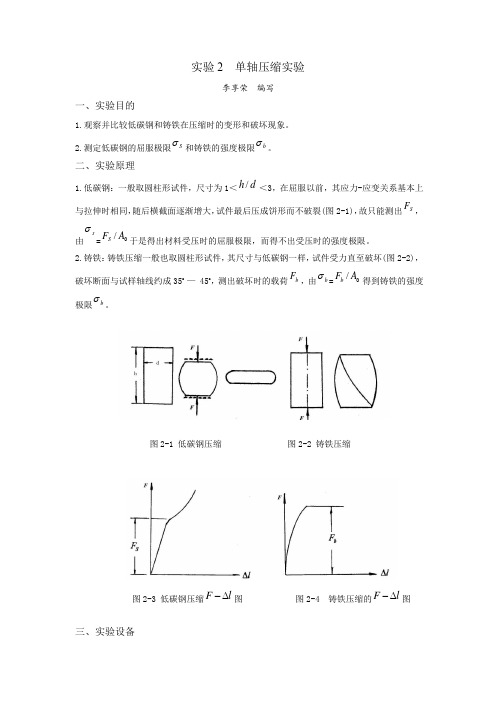
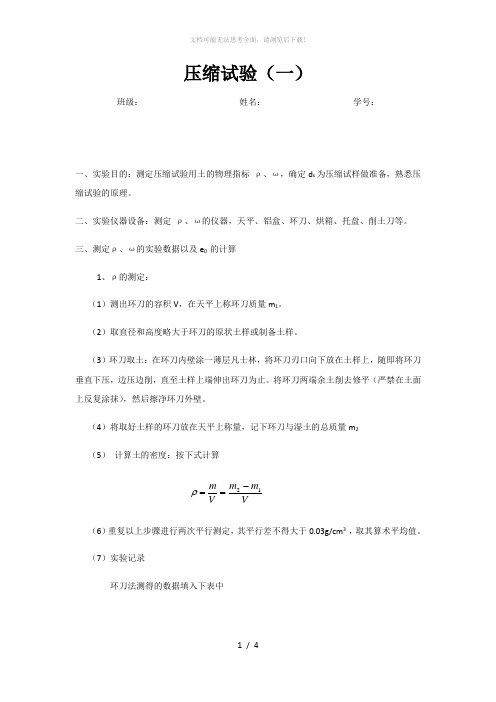
1.低碳钢:一般取圆柱形试件,尺寸为1<<3,在屈服以前,其应力-应变关系基本上与拉伸时相同,随后横截面逐渐增大,试件最后压成饼形而不破裂(图2-1),故只能测出,由=于是得出材料受压时的屈服极限,而得不出受压时的强度极限。
2.铸铁:铸铁压缩一般也取圆柱形试件,其尺寸与低碳钢一样,试件受力直至破坏(图2-2),破坏断面与试样轴线约成35o — 45o ,测出破坏时的载荷
,由=得到铸铁的强度极限。
图2-1 低碳钢压缩 图2-2 铸铁压缩
图2-3 低碳钢压缩图 图2-4 铸铁压缩的图
三、实验设备
S σb σd h /S F s
σ0/A F S b F b σ0/A F b b σl F ∆-l F ∆-
1.WE300型万能试验机(见附录二)。
2.游标卡尺。
四、实验方法及步骤
1.校正测力盘零点(详见附录二油压式万能试验机说明),调整好记录仪。
2.用游标卡尺量取试件的横截面直径。
3.将试件放在压板的中心。
4.缓慢均匀地加载荷,注意低碳钢压缩时的屈服载荷,并记下这一载荷,过屈服后一直压到试样成扁平状.铸铁一直压到破坏为止,记下破坏时的载荷。
五、预习题和思考题
1.本试验的目的是什么?
2.压缩试件为什么做成短柱形?
3.低碳钢和铸铁压缩试验时应记录哪些试验数据?
s F b F。
单轴压缩

单轴压缩单轴压缩软件包提供圆柱形岩石和混凝土试件的压缩和变形试验运行用的所有硬件和软件附件。
该压缩软件包包括:力传感器对低载荷试验--一个661型力传感器。
一个把该力传感器附着到载荷框架上的附着件。
对高载荷试验-一个660.23P型元件。
直接安装到作动缸口。
一个信号调节器-供每个力传感器用。
2档标定。
一个从力传感器到调节器的电缆0到10个间隔片-取决于载荷序列的构形和附带的硬件。
一个643型压盘夹具应变传感器∙一个轴向应变测量元件一个周向应变测量元件一个信号调节器和各传感器的电缆790.61型岩石力学软件∙按照ASTM D2938-86, D-3148-86, 4341-84 和4405-84的岩石单轴压缩试验ISRM建议的确定岩石单轴压缩强度和单轴压缩中岩石材料的变形能力的方法。
子。
设计高刚度载荷力链,以使脆性材料试验时贮存在框架和载荷力链部分的变形能量减到最小。
在进行关于试件破坏后性状的试验时,这特别关键。
对于要求大于1000 kN (220kip)的压缩试验,可以卸除载荷传感器,并可用适合框架载荷的差压(P)传感器测量力。
由于作动器摩擦力,要求的力小于1000 kN (220 kip)的试验,应当使用一个力传感器。
请注意,315型载荷框架试用的载荷,超过了该力传感器的范围。
该试验区域前、后的Lexan板(未示出),在进行单轴压缩强度试验时,确保防护试件碎片伤人。
除了单轴压缩试验的机械夹具外,提供了790.61型单轴岩石力学软件,以便执行某些最普通的压缩试验,并分析得到的数据。
这软件包通过一系列预定步骤,指导你进行标准的ASTM试验和TSRM建议的试验方法。
该软件在鼠标驱动和点击环境中运行,并使用下拉菜单和图标,提供方便和直观的操作界面。
该软件也包括:运行时间率控制(它使你在试验期间增加或减少加载率或应变率,以更好地控制破坏后试验,并充分改进)和实时显示所选择的反馈的运行时间图(使你在运行时监控试验进程)。
(完整)常温单轴拉伸实验、压缩实验

实验1 常温单轴拉伸实验马 杭 编写单轴拉伸实验是研究材料机械性能的最基本、应用最广泛的实验.由于试验方法简单而且易于得到较为可靠的试验数据,在工程上和实验室中都广泛利用单轴拉伸实验来测取材料的机械性能。
多数工程材料拉伸曲线的特性介于低碳钢和铸铁之间,但其强度和塑性指标的定义与测试方法基本相同,因此通过单轴拉伸实验分析比较两种材料的拉伸过程,测定其机械性能,在机械性能的试验研究中具有典型的意义,掌握其拉伸和破坏过程的特点有助于正确合理地认识和选用材料,了解静载条件下结构材料的许用应力的内涵。
一、实验目的1.通过单轴拉伸实验,观察分析典型的塑性材料(低碳钢)和脆性材料(铸铁)的拉伸过程,观察断口,比较其机械性能。
2.测定材料的强度指标(屈服极限S σ、强度极限b σ)和塑性指标(延伸率δ和面缩率ψ)。
二、实验设备1。
电子万能材料试验机WDW-100A(见附录一)。
2。
计算机、打印机。
3。
游标卡尺.图1—1 圆棒拉伸试样简图三、试样材料性能的测试是通过试样进行的,试样制备是试验的重要环节,国家标准GB6397-86对此有详细的规定。
本试验采用圆棒试样,如图1—1所示。
试样的工作部分(即均匀部分,其长度为C l )应保持均匀光滑以确保材料的单向应力状态。
均匀部分的有效工作长度0l 称为标距,0d 和0A 分别为工作部分的直径和面积。
试样的过渡部分应有适当的圆角以降低应力集中,两端的夹持部分用以传递载荷,其形状与尺寸应与试验机的钳口相匹配。
材料性能的测试结果与试样的形状、尺寸有关,为了比较不同材料的性能,特别是为了使得采用不同的实验设备、在不同的实验场所测试的试验数据具有可比性,试样的形状与尺寸应符合国家标准(GB6397—86).例如,由于颈缩局部及其影响区的塑性变形在断后延伸率中占很大比重,同种材料的延伸率不仅取决于材质,而且还取决于试样标距。
按国家标准规定,材料延伸率的测试应优先采用两类比例试样:(1)长试样:0010d l =(圆形截面试样),或003.11A l =(矩形截面试样)(2)短试样:005d l =(圆形截面试样),或0065.5A l =(矩形截面试样)用长试样和短试样测得的断后延伸率分别记做10δ和5δ,国家标准推荐使用短比例试样。
压缩试验实验报告
压缩试验(一)班级: 姓名: 学号:一、实验目的:测定压缩试验用土的物理指标 ρ、ω,确定d s 为压缩试样做准备,熟悉压 缩试验的原理。
二、实验仪器设备:测定 ρ、ω的仪器,天平、铝盒、环刀、烘箱、托盘、削土刀等。
三、测定ρ、ω的实验数据以及e 0 的计算 1、ρ的测定:(1)测出环刀的容积V ,在天平上称环刀质量m 1。
(2)取直径和高度略大于环刀的原状土样或制备土样。
(3)环刀取土:在环刀内壁涂一薄层凡士林,将环刀刃口向下放在土样上,随即将环刀垂直下压,边压边削,直至土样上端伸出环刀为止。
将环刀两端余土削去修平(严禁在土面上反复涂抹),然后擦净环刀外壁。
(4)将取好土样的环刀放在天平上称量,记下环刀与湿土的总质量m 2 (5) 计算土的密度:按下式计算V m m V m 12-==ρ(6)重复以上步骤进行两次平行测定,其平行差不得大于0.03g/cm 3 ,取其算术平均值。
(7)实验记录环刀法测得的数据填入下表中2、ω的测定:(1)取代表性试样,粘性土为15—30g,砂性土、有机质土为 50g,放入质量为m 0的称量盒内,立即盖上盒盖,称湿土加盒总质量m 1,精确至0.01g.(2)打开盒盖,将试样和盒放入烘箱,在温度105——1100C 的恒温下烘干。
烘干时间与土的类别及取土数量有关。
粘性土不得少于8小时;砂类土不得少于6小时;对含有机质超过10%的土,应将温度控制在65——700C 的恒温下烘至恒量。
(3)将烘干后的试样和盒取出,盖好盒盖放入干燥器内冷却至室温,称干土加盒质量m 2为,精确至0.01g 。
(4)计算含水率:按下式计算%1000221⨯--==m m m m m m w s w(5)重复以上步骤进行两次平行测定,其平行差不得大于0.03g/cm 3 ,取其算术平均值。
允许平行差值应符合下表规定。
(6)实验记录将实验得到的数据填入下表3、e 0 的计算首先,d s 已经被测出为2.72,则e 0 的计算公式为1)1(0-+=ρρωωs d e将前面的数据代入公式得到e 0=1.034、压缩试验原理(1)首先,按以上步骤求出e 0(2)按下式计算各级压力下固结稳定后的孔隙比e i式中:Δh i —某级压力下试样高度变化,即总变形量减去仪器变形量,cm ; h 0——试样初始高度,cm 。
岩石力学实验方案设计

岩石力学实验方案设计实用标准文案实验方案实验一单轴压缩试验一.实验的目的以白垩系软岩为研究对象,设置不同的冻结温度,分别对岩样进行一次冻融循环,并测定其冻融前后的单轴抗压强度和杨氏弹性模量,且绘出应力―应变曲线。
当无侧限试样在纵向压力作用下出现压缩破坏时,单位面积上所承受的载荷称为岩石的单轴抗压强度,即式样破坏时的最大载荷与垂直与加载方向的截面积之比。
本次试验主要测定饱和状态下试样的单轴抗压强度。
二.试样制备(1)样品可用钻孔岩芯或在坑槽中采取的岩块,在取样和试样制备过程中,不允许发生人为裂隙。
(2)试样规格:经过钻取岩芯、岩样尺寸切割、岩样打磨几道工序制备成直径5cm、高10cm的圆柱体。
(3)试样制备的精度应�鹤闳缦乱�求: a沿试样高度,直径的误差不超过0.03cm; b试样两端面不平行度误差,最大不超过0.005cm; c端面应垂直于轴线,最大偏差不超过0.25°;d 方柱体试样的相邻两面应互相垂直,最大偏差不超过0.25°。
三.主要仪器设备精彩文档实用标准文案1、制样设备:钻石机、切石机及磨石机。
2、测量平台、角尺、游标卡尺、放大镜、低温箱等。
3、压力试验机。
四、实验步骤1.取加工好的岩石试样15块,放入抽真空设备中进行饱水处理,浸泡24h;2.a.(1)从饱水后的试样中取3 块,进行冻结前常温(+20℃)条件下岩石的单轴压缩试验,并记录应力-应变曲线等信息;(2)从剩下的饱水岩样中取出6块放入低温箱中,在恒温-10℃条件下冻结48h;(3)取出冻结后的3块岩样,进行冻结-10℃条件下岩石的单轴压缩试验,并记录应力-应变曲线等信息;(4)取出冻结后另外3块岩样,在室内常温环境下自然解冻后,进行岩石冻结解冻后恢复到常温条件下岩石的单轴压缩试验,并记录应力-应变曲线等信息;b.以剩余的6块试样为对象,把冻结温度设置为-30℃,重复a中步骤(2)~(4);3.通过试验数据分析在两种冻结温度下,岩样冻结前、冻结中和冻结解冻后三种状态下三种岩石单轴压缩下强度、应力-应变曲线及弹性模量等参数的变化情况。
中国石油大学(华东)单轴压缩实验
实验岩石单轴压缩实验一.实验目的岩石单轴压缩是指岩石在单轴压缩条件下的强度、变形和破坏特征。
通过该实验掌握岩石单轴压缩实验方法,学会岩石单轴抗压强度、弹性模量、泊松比的计算方法;了解岩石单轴压缩过程的变形特征和破坏类型。
二.实验设备、仪器和材料1.钻石机、锯石机、磨石机;2.游标卡尺,精度0.02mm;3.直角尺、水平检测台、百分表及百分表架;4.YE-600型液压材料试验机;5.JN-16型静态电阻应变仪;6.电阻应变片(BX-120型);7.胶结剂,清洁剂,脱脂棉,测试导线等。
三.试样的规格、加工精度、数量及含水状态1. 试样规格:采用直径为50 mm,高为100 mm的标准圆柱体,对于一些裂隙比较发育的试样,可采用50 mm×50 mm×100 mm的立方体,由于岩石松软不能制取标准试样时,可采用非标准试样,需在实验结果加以说明。
2. 加工精度:a 平行度:试样两端面的平行度偏差不得大于0.1mm。
检测方法如图5-1所示,将试样放在水平检测台上,调整百分表的位置,使百分表触头紧贴试样表面,然后水平移动试样百分表指针的摆动幅度小于10格。
b 直径偏差:试样两端的直径偏差不得大于0.2 mm,用游标卡尺检查。
c 轴向偏差:试样的两端面应垂直于试样轴线。
检测方法如图5-2所示,将试样放在水平检测台上,用直角尺紧贴试样垂直边,转动试样两者之间无明显缝隙。
3.试样数量: 每种状态下试样的数量一般不少于3个。
4.含水状态:采用自然状态,即试样制成后放在底部有水的干燥器内1~2 d ,以保持一定的湿度,但试样不得接触水面。
四.电阻应变片的粘贴1.阻值检查:要求电阻丝平直,间距均匀,无黄斑,电阻值一般选用120欧姆,测量片和补偿片的电阻差值不超过0.5Ω。
2.位置确定:纵向、横向电阻应变片粘贴在试样中部,纵向、横向应变片排列采用“┫”形,尽可能避开裂隙,节理等弱面。
3.粘贴工艺:试样表面清洗处理→涂胶→贴电阻应变片→固化处理→焊接导线→防潮处理。
- 1、下载文档前请自行甄别文档内容的完整性,平台不提供额外的编辑、内容补充、找答案等附加服务。
- 2、"仅部分预览"的文档,不可在线预览部分如存在完整性等问题,可反馈申请退款(可完整预览的文档不适用该条件!)。
- 3、如文档侵犯您的权益,请联系客服反馈,我们会尽快为您处理(人工客服工作时间:9:00-18:30)。
history id 2 wall contactforce id 1
history id 3 wall contactforce id 2
save initial
;------------------------------------------------------------------------------
;------------------------------------------------------------------------------
; --------------- INITIAL PHASE: CREATION OF A BONDED SPECIMEN ----------------
-4.0 4.0 -5.0 ...
4.0 4.0 -5.0 ...
4.0 -4.0 -5.0
ball attribute density 1.0e3 damp 0.7
cycle 2000 calm 10
solve aratio 5e-3 calm 1000
contact hod bond gap 0.1
contact property pb_kn 1e7 pb_ks 1e7 pb_ten 4e5 pb_coh 4e5 pb_fa 20.0
;------------------------------------------------------------------------------
domain extent -5 5 -5 5 -7.5 7.5 condition destroy
cmat default model linear property kn 1e7
wall attribute centrotation 0.0 0.0 5.0 range z 5.0
wall attribute centrotation 0.0 0.0 -5.0 range z -5.0
clean
cycle 10
solve arat 5e-3 elastic
wall attribute zvel 0.0 gradient 0.0 0.0 -0.001
solve time 50.0
save final-case0
;------------------------------------------------------------------------------
; ------------ CASE 1: CONTINUOUS UPDATE OF FRAGMENTS WITH BALL RESULTS --------
; ------------ CASE 0: NO TRACKING OF FRAGMENTS - NO BALL RESULTS -------------
;------------------------------------------------------------------------------
;
;==============================================================================
new
set precision 15
title 'Fragmentation of a Bonded Particle Model'
;@make_movie_case1
;------------------------------------------------------------------------------
; ------------ CASE 2: CUSTOM UPDATE OF FRAGMENTS AND BALL RESULTS ------------
ball result addattribute fragment time 0.1 activate
wall result addattribute velocity time 0.1 activate
solve time 50.0
save final-case1
;call post_treat.p3fis
;------------------------------------------------------------------------------
restore initial
fragment register ball-ball
fragment activate time 0.1
;------------------------------------------------------------------------------
restore initial
call fracture.p3fis
@track_init
solve time 50.0
@track_end
; fname: fragment.p3dat
;
; Illustrate how the Fragment, DFN and Model Result logic can be used
; to study the fragmentation of a Bonded Particle Model.
wall delete
cmat default type ball-facet model linear property kn 1e7 ks 1e7 fric 0.5
wall generate id 1 name top polygon -4.0 -4.0 5.0 ...
-4.0 4.0 5.0 ...
cmat default type ball-ball model linearpbond property kn 5e6 proximity 0.1
wall generate box -2.5 2.5 -2.5 2.5 -5 5
set random 10001
ball distribute porosity 0.3 radius 0.25 0.3 box -2.5 2.5 -2.5 2.5 -5 5
4.0 4.0 5.0 ...
4.0 -4.0 5.0
wall generate id 2 name bottom polygon -4.0 -4.0 -5.0 ...
save final-case2
;call post_treat.p3fis
;@make_movie_case2
return
;==============================================================================
自己看看 我的是PFC5.0