Cincinnati VMC Setup and Operating Procedure
戴尔服务器PRO管理包3.0适用于Microsoft System Center虚拟机管理器安装指南
Dell Server PRO Management Pack 3.0 for Microsoft System Center Virtual Machine Manager Installation GuideNotes, Cautions, and WarningsNOTE: A NOTE indicates important information that helps you make better use of your computer.CAUTION: A CAUTION indicates either potential damage to hardware or loss of data and tells you how to avoid the problem.WARNING: A WARNING indicates a potential for property damage, personal injury, or death.© 2013 Dell Inc.Trademarks used in this text: Dell™, the Dell logo, Dell Boomi™, Dell Precision™ , OptiPlex™, Latitude™, PowerEdge™, PowerVault™, PowerConnect™, OpenManage™, EqualLogic™, Compellent™, KACE™, FlexAddress™, Force10™ and Vostro™ are trademarks of Dell Inc. Intel®, Pentium®, Xeon®, Core® and Celeron® are registered trademarks of Intel Corporation in the U.S. and other countries. AMD®is a registered trademark and AMD Opteron™, AMD Phenom™ and AMD Sempron™ are trademarks of Advanced Micro Devices, Inc. Microsoft®, Windows®, Windows Server®, Internet Explorer®, MS-DOS®, Windows Vista® and Active Directory® are either trademarks or registered trademarks of Microsoft Corporation in the United States and/or other countries. Red Hat® and Red Hat®Enterprise Linux® are registered trademarks of Red Hat, Inc. in the United States and/or other countries. Novell® and SUSE® are registered trademarks of Novell Inc. in the United States and other countries. Oracle® is a registered trademark of Oracle Corporation and/or its affiliates. Citrix®, Xen®, XenServer® and XenMotion® are either registered trademarks or trademarks of Citrix Systems, Inc. in the United States and/or other countries. VMware®, Virtual SMP®, vMotion®, vCenter® and vSphere® are registered trademarks or trademarks of VMware, Inc. in the United States or other countries. IBM® is a registered trademark of International Business Machines Corporation.2013 -04Rev. A01ContentsNotes, Cautions, and Warnings (2)1 Overview (5)Minimum Requirements (5)Supported Operating Systems (6)Installing Operations Manager and VMM Agents (6)Integrating Operations Manager With VMM (6)Importing Dell PRO Pack (6)Planning The Environment For PRO Tips (7)Configuring PRO Tips (7)Enabling PRO Tips (7)Testing the Setup Using Scenarios (8)Upgrading to Dell PRO Pack 3.0 (9)Uninstalling Dell PRO Pack (9)Security Considerations (9)4OverviewThis guide provides information on software prerequisites and requirements to install and uninstall Dell Server Performance and Resource Optimization Management Pack (PRO Pack) 3.0. Dell PRO Pack is a tool to monitor Dell systems and take remedial action when an inefficient system is identified.The Dell PRO Pack 3.0 integrates with the following:•Microsoft System Center 2012 Operations Manger•Microsoft System Center 2012 SP1 Operations Manger•Microsoft System Center Operations Manager 2007 R2•Microsoft System Center 2012 Virtual Machine ManagerNOTE: PRO Pack 3.0 does not integrate with older versions of Microsoft System Center Virtual MachineManager.•Microsoft System Center 2012 SP1 Virtual Machine ManagerThis integration enables you to proactively manage virtual environments and ensure high availability of your Dell systems.To implement PRO Pack, see the User’s Guide at /manuals.NOTE: All references to Operations Manager in this document is applicable to Microsoft System Center Operations Manager 2007 R2, Microsoft System Center 2012 Operations Manager, and Microsoft System Center 2012 SP1 Operations Manger unless otherwise specified.CAUTION: Due to the possibility of data corruption and/or data loss, it is recommended that the procedures in this document should be performed only by personnel with knowledge and experience of using the Microsoft Windows operating system and all supported versions of Operations Manager and Virtual Machine Manager.NOTE: The readme contains information on the software and management station requirements, and known issues of Dell Pro Pack 3.0. The readme, DellMPv30_PROPack_Readme.txt, is packaged in the self-extracting executable file Dell_PROPack_v3.0.0_A00.exe. However, for the latest readme, see /OMConnectionsEnterpriseSystemsManagement and then search for Dell Server Pro Management Pack 3.0 for Microsoft System Center Virtual Machine Manager, else see /support/Manuals/us/en/04/Product/dell-srvr-pro-mgmt-pck-3.0-for-ms-center-virt-machine-mangr.Minimum RequirementsTo install and implement the Dell PRO Pack 3.0, you must make sure that the minimum execution environment exists on the following components:•Management station:–Installation of Microsoft System Center Operations Manager (OpsMgr) 2007 R2, System Center 2012 Operations Manager (OpsMgr 2012), or System Center 2012 SP1 Operations Manager (OpsMgr 2012 SP1)on supported hardware and operating system–Installation of Microsoft System Center 2012 Virtual Machine Manager (VMM) or Microsoft System Center 2012 SP1 Virtual Machine Manager (VMM) on supported hardware and operating system –Integration of Operations Manager and VMM–Install VMM Admin Console on management systems in which OpsMgr is integrated with VMM for Performance and Resource Optimization (PRO).•Managed system:–Microsoft Hyper-V hosts on any Dell PowerEdge systems ranging from x9xx to yx2x (both inclusive)5–Dell OpenManage Server Administrator (including the Dell OpenManage Server Administrator Storage Management Service.)*Install OpenManage Server Administrator 7.0, or later versions*Minimum supported version of OpenManage Server Administrator is 6.1•Live Migration:–VMM 2012 with Windows Server 2008 R2, Hyper-V Server 2008 R2, or Hyper-V Windows Server 2012 You can download the latest version of OpenManage Server Administrator from .NOTE: For the list of supported operating systems for Operations Manager and VMM, see the Microsoft TechNet Library at /hi-in/library/default(en-us).aspx.Supported Operating SystemsFor information on the supported operating systems for Dell Pro Pack v3.0 see the Dell PRO Pack readme file, the readme, DellMPv30_PROPack_Readme.txt, is packaged in the self-extracting executable fileDell_PROPack_v3.0.0_A00.exe. However, for the latest readme, see / OMConnectionsEnterpriseSystemsManagement and then search for Dell Server Pro Management Pack 3.0 for Microsoft System Center Virtual Machine Manager, else see /support/Manuals/us/en/04/Product/dell-srvr-pro-mgmt-pck-3.0-for-ms-center-virt-machine-mangr.Installing Operations Manager and VMM AgentsWhen you use the setup to monitor the infrastructure, Operations Manager agents installed on the managed hosts enable data transfer between the managed system and management stations. Agents of both VMM and Operations Manager are manually or automatically installed during the discovery process on all Hyper-V hosts.Integrating Operations Manager With VMMFor the setup to support Dell PRO Pack, Operations Manager must be integrated with VMM. For more information, see the Microsoft TechNet Library at .Importing Dell PRO PackNOTE: For alerts and PRO Tips, make sure that VMM discovers the managed objects and displays them in the State View.Dell PRO Pack 3.0 is provided as a .mp file. To import Dell PRO Pack:1.Download the Dell_PROPack_v3.0.0_A00.exe file from to a removable media or a local repository.2.Extract the contents of the file to a folder on the system.unch the Operations Manager console.4.On the Administration tab, right-click Management Packs and click Import Management Packs.The Select Management Pack to import window is displayed.5.Click Add → Add from disk.6.Browse the location where you extracted the Dell_PROPack_v3.0.0_A00.exe file and select theDell.Connections.hyperv.PROPack.mp file.7.Click Open .The Import Management Packs window is displayed.6NOTE: When you manually install a management pack, Operations Manager displays a generic warning as a part of the security process. For more information, see the Microsoft TechNet Library. Click Close to close the security warning message.8.Click Install.A confirmation dialog box is displayed.9.Click Yes.Once the import of Dell PRO pack is completed, you must proceed to the planning step to enable PRO Monitors relevant for your environment. For more information, see Planning The Environment For PRO Tips.Planning The Environment For PRO TipsYou can plan for enabling the PRO Monitors that are relevant for the environment. By default, all the PRO Monitors are disabled in the Dell PRO Pack. For the list of alerts and the recovery actions, see the Alerts and Recovery Actions section in the Dell Server PRO Management Pack 3.0 for Microsoft System Center Virtual Machine Manager User's Guide. Select the alerts that you want to enable. Using OpsMgr Authoring Console (or) Authoring Pane in OpsMgr Console, create an override for the management packs that enables the relevant PRO Monitors.Steps for enabling the PRO Monitors are as follows:unch OpsMgr console.2.From the navigation pane, click Authoring.3.In the Authoring tab, select Management Pack Objects → Monitors .4.Click Change Scope at the top of the screen.The Scope Management Pack Objects screen is displayed.5.Select View all targets and in Look for enter Dell PRO.6.Select Dell PROPack Class for Discovery and click OK.7.Expand Entity Health → Availability.8.From the listed monitors, right-click the monitors you want to enable, and select enable → Overrides → Overridethe Monitors → For all objects of class: Dell PROPack Class for Discovery .The Override Properties page is displayed.9.Select Enabled and set Override Value to True and click OK.To view the Dell PRO Monitored Servers Health updates, the next cycle of Dell PRO Monitored Servers discovery and monitoring must complete.Configuring PRO TipsThe Dell systems and virtual infrastructure are monitored for both Critical and Warning alerts.• A Warning alert is generated when the reading of a component is above or below the acceptable level. For example, the component may be functioning, but it may be functioning in an impaired state.• A Critical alert is generated when a component has either failed or failure is imminent.Enabling PRO TipsTo enable PRO Tips for both Warning and Critical alerts and automatically implement PRO Tips:unch the VMM console.2.Click Settings → System Center Settings.73.Right-click Operations Manager Settings and click Settings .The Operations Manager Settingswindow is displayed, as shown in the following figure.Figure 1. Configuring PRO Tips Properties4.Make sure that the Enable Performance and Resource Optimization (PRO) check box is selected.5.Click OK to save your settings.Testing the Setup Using ScenariosTo confirm that the imported Dell PRO Pack is fully functional, create the scenarios listed in the following table and check if the activities listed under Expected System Response column are carried out.Scenario - The Ambient System Temperature exceeds its warning threshold value on a managed system.CAUTION: Run this test on a server which does not run any Workloads.8Upgrading to Dell PRO Pack 3.0Upgrading to Dell PRO Pack 3.0 from older version of Dell PRO Pack is not supported.NOTE: To install Dell PRO Pack 3.0 on systems running older versions of Dell PRO Pack, uninstall the older version of Dell PRO Pack and then install Dell PRO Pack 3.0. For more information on uninstalling Dell PRO Pack, seeUninstalling Dell PRO Pack.Uninstalling Dell PRO PackYou can uninstall Dell PRO Pack by deleting it in the Operations Manager console. When you delete Dell PRO Pack, all the settings and overrides associated with it are removed from Operations Manager.To uninstall Dell PRO Pack:unch the Operations Manager console.2.Click Administration→ Management Packs.3.In the Management Packs pane, right-click Dell PRO-enabled Management Pack and click Delete. Security ConsiderationsOperations Console access privileges are handled internally by Operations Manager. This can be setup using the User Roles option under Administration → Security feature on the Operations Manager console. The profile of the role assigned to you determines what actions you can perform and which objects you can manage. For more information on security considerations, see the documentation for Microsoft System Center 2012 SP1 Operations Manager, Microsoft System Center 2012 Operations Manager, Microsoft System Center Operations Manager 2007 R2 or the Microsoft Systems Center Essentials 2010 Online Help at .9。
康宝莱计算机控台Vector Red简介
注:SMPTE= Society of Motion Picture and Television Engineers(SMPTE),摄影 与 电视工 程 师协会 。SMPTE标 准化活动服务于移动图象的所有分支,包括电影、录象和多媒体。 MIDI=Musical Instrument Digital Interface,电子乐器数字接口。
触发点而自动运行。 • 内置全球知名灯光品牌的灯库。 • 图形化窗口式灯库编写器,提供编写灯光设备文件的固定
格式。 • 离线Vector Pc软件,运行于个人电脑上。通过E-Port(网络
扩 展 器)的 传 输 , 可 直 接 控 制 灯 具 。 • 支持与WYSIWYG等3D软件的连接,实现离线编辑功能。 • 在线帮助。 • 软件免费升级。可到官方网站下载。
接 选 取 , 包 括 图 案( i m a g e ), 颜 色 固 定 颜 色 和C M Y色 板 等 。 • 灯具参数可随意复制和粘贴。 • 素材库(library)对全部的灯具开放,不同类型的灯具也可
以共享。 • 预置效果(effect)的编辑软件模块,与灯具参数关联,让用
户自由组合各种效果。 • cue储存在QList里,与重放设备(playback)分离。重放设
Editor Wing(编辑器扩展板) 和Channel Wing(通道扩展板)
• E-SMS。SMPTE、MIDI、Sound(音频)和以太 网的转换器。用来接收远程同步控制信号。
iControl
尺 寸 : 长x宽x高= 1 2 5 x 6 0 x 3 2 c m 重 量 :3 0 K g
Micrium OS 开发者指南说明书
Micrium Tools Training: µC/Probe and SystemViewLabsMicrium’s µC/Probe and SEGGER’s SystemView can be invaluable for developers whose projects are based on the Micrium OS. The lab exercises described in this document will familiarize you with these two tools. The instructions for the lab assume that you have a Mighty Gecko Wireless Starter Kit (SLWSTK6000B), and that you’ve already insta lled µC/Probe and SystemView, as well as the Simplicity Studio IDE, on your PC. Download links for all of these tools are provided below.Download LinksSimplicity Studio: /products/development-tools/software/simplicity-studioThe Micrium OS example project prepared for these labs was developed using SimplicityStudio. You’ll need the IDE in ord er to build and run the project.µC/ProbeA visit to Micrium’s Web site to download µC/Probe is not necessary, since the tool was recently integrated into Simplicity Studio. However, you may need to use the IDE’s Package Manager to update your install and gain access to µC/Probe. Within the Package Manager, which you can find by clicking the button with the green, downward-facing arrow appearing near the upper-left corner of Simplicity Studio in the Launcher perspective, the link for installing µC/Probe is located on the Tools page, as indicated in the below screenshot. The Educational Edition of µC/Probe referenced by the link can be used without a license. If you’d like access to the full-featured Professional Edition of the tool, you can contact Micrium to get a one-year FAE license at no cost.SystemView: https:///downloads/free_tools/Setup_SystemView_V242.exe SystemView is a free tool from SEGGER. In order for the tool t o work properly, you’ll need the latest J-Link software, which is also available from SEGGER: https:///downloads/jlink/JLink_Windows_V614c.exe.Lab 1: Building and Running the Example ProjectIn this lab, you’ll build and run a Simplicity Studio example proj ect incorporating the Micrium OS. You’ll use this project in Lab 2 and Lab 3 to explore the features of µC/Probe and SystemView.Procedure:1.Your hardware platform for the labs is the Mighty Gecko Wireless Starter Kit. Youshould now connect one of your k it’s main boards (BRD4001A) to a radio board(BRD4161A). You should then establish a USB connection between your PC and thecombined boards. Your main board features a built-in J-Link debugger, and the USB connection will allow you to leverage this debugger within Simplicity Studio.2.If you’re not al ready running Simplicity Studio, you should start it now. You shouldmake sure that you’re in the Simplicity IDE perspective, which you can open by selecting Window>Perspective>Simplicity IDE.3.The example project for the labs is delivered in a zip file named Micrium-Tools-Lab.zip.You should now extract the contents of this zip file to a folder of your choice. To avoid any possible issues with long path names, it is recommended to keep the zip file contents relatively close to your root folder.4.You’ll now need to import the example project that was delivered in Micrium-Tools-Lab.zip. You should start the import process in Simplicity Studio by selecting File>Import…. On the dialog that subsequently appears, you should expand General and select Existing Projects into Workspace, as indicated in the below screenshot. You should then click the Next button.5.Within the second Import dialog, you should ensure that Select root directory is chosenand you should then click the corresponding Browse button. You must then navigate to the location of the project folder (named Tools-Lab-1) that was provided in Micrium-Tools-Lab.zip. Before clicking the Finish button, you should ensure that the Tools-Lab-1 is checked in the Projects field and that Copy projects into workspace is likewise checked, as indicated in the below screenshot.6.The example project should now appear in your Project Explorer, as indicated below.To clean any build artifacts that might exist for the project, you should right-click its name, Tools-Lab-1, and select Clean Project from the menu that appears. If the clean operation was successful, you should then attempt to build the project by again right-clicking the project name and this time selecting Build Project.7.The build operation for your project should have completed without any errors. (Thereshould have been one warning associated with deprecated interrupt code in the BSP.) In the case of a successful build, you should now attempt to download your project’s code to your board by right-clicking Tools-Lab-1in the Project Explorer and then selecting Debug As>1 Silicon Labs ARM Program.8.Simplicity Studio should automatically switch to the Debug perspective as a result ofyour actions in the previous step. Within this pers pective’s editor area, the tool should indicate that execution of your project is halted on the first line of the main() function. You should now start execution of the project’s code by clicking the Resume button shown below. LED0and LED1should then begin alternately blinking on yourboard.9.After confirming that your code is running and your LEDs are blinking, you can terminateyour debug session by right-clicking the Silicon Labs ARM MCU item that, as indicated inthe below screenshot, should appear in the Debug window. You should selectTerminate from the subsequent pop-up menu. Your LEDs should continue to blink afterthe debug session has ended, since your project’s code now resides in Flash memory.Lab 2: µC/ProbeIn this lab, you’ll use µC/Probe to visualize the internals of the project that you built in Lab 1. You’ll first monitor one of the project’s C variables, and you’ll then use µC/Probe’s kernel-awareness capabilities to view statistics output by the µC/OS 5 kernel on which the project is based.Procedure:1.You should now run µC/Probe. You can actually start the tool within Simplicity Studio byclicking the button shown in the below screenshot.2.µC/Probe makes it possible to view the values of an application’s variables as codeactually runs. In order to offer this capability, it needs information on the variables’ locations. It typically gets this information from an ELF file. When you built the Micrium OS example project following the procedure given in the previous section of this document, an ELF file, Tools-Lab-1.axf, should have been generated by Simplicity Studio and placed at the path listed below. In this path, <project_location> is the folder where your project resides. If you’re uncertain of this location, you should right-click the project’s name in Project Explorer and select Properties. If you then select Resource from the categories listed on the left side of the Properties dialog, you’ll be able to read your project folder from the Location field in the upper half of the dialog.<project_location>\GNU ARM v4.9.3 - Debug3.You can pass an ELF file to µC/Probe using the Symbol Browser located at the bottom ofthe tool’s main window. You should now click the Symbol Broswer’s ELF button, which is shown in the below screen shot. In the ensuing dialog, you should simply browse to the ELF file described above and then click the Open button.4.µC/Probe will be able to use your board’s built-in J-Link debugger to access variables inyour running example code. In order to establish J-Link as your preferred communication interface, you’ll need to select it in the Settings dialog. You should now open this dialog by clicking the Settings button shown below.5.As indicated in the below screenshot, the lower left corner of the Settings dialogcontains a list of Debug Interfaces containing just one item: J-Link. You should confirm that J-Link is selected, and you should then ensure that Don’t Change has been specified for the Interface Mode. Before clicking OK, you should choose Silicon Labs as the Manufacturer, and, using the provided table, select EFR32MG12PxxxF1024as your Device.6.µC/Probe provides a variety of graphical components that can be used for displaying thevalues of variables. You can access these components via the Toolbox located on the left side of the main program window. You should now instantiate a new component—a gauge—by first clicking Angular Gauges in the lower half of the Toolbox and thendragging and dropping the Semicircle 3gauge onto the data screen in the middle of µC/Probe’s program window. The data screen should then appear as shown in thebelow screenshot.7. A graphical component is not of much use until it has been associated with a variable, orsymbol. The Symbol Browser will be your means of associating a variable with your new gauge. If the Symbol Browser is not already displaying a list of C files corresponding to the code that you built in the first part of the lab, you can make such a list appear by expanding the entry for Tools-Lab-1.axf that appeared when you specified the path of this file in Step 2. Once the list is visible, you should expand the entry for the C file ex_main.c in order to make the variables contained in that file appear. You should then drag and drop the variable Ex_MainSpeed from the Symbol Browser to your gauge. As indicated below, the variable name will appear below thegauge to indicate that the two are associated.8.You should now click µC/Probe's Run button, which, as indicated below, is located in theupper left-hand corner of the tool's main program window. If you’re using the Educational Edition of the tool, you’ll be presented with a dialog indicating that you won’t have access to µC/Probe’s full set of features unless you upg rade to the Professional Edition. You can simply click this dialog’s Close button. You will then enter µC/Probe’s Run-Time mode. The dial on your gauge should begin moving from 0 to 100 and then back to 0. It should repeat this pattern indefinitely. Keep in mind that, with the Educational Edition, you will only be able to remain in Run-Time mode for one minute before a time-out occurs and another dialog prompting you to upgrade appears.9.µC/Probe can be used with nearly any embedded system—including those not based ona real-time kernel. However, the tool is especially helpful when paired with projectsthat incorporate Micrium’s embedded software modules, in part because of its kernel-awareness capabilities. These capabilities are implemented via a number of pre-populated data screens that show the values of different kernel variables. You should now stop µC/Probe (by clicking the Stop button located in the upper left-hand corner of the main program window) and add the kernel-awareness screens for µC/OS 5, the kernel featured in the example project, to your workspace. You can add the screens by first clicking Project1in µC/Probe's Workspace Explorer window and then clicking Screens>Micriµm OS Kernel (µC/OS-5), as indicated in the below screenshot. After making this change, you can again click Run to prompt µC/Probe to begin updating the new screens with kernel statistics.10. Within the main µC/OS 5 kernel-awareness screen, there are a number of subordinatescreens, including one for Task(s). As shown below, this screen displays the status of each task running in your project. You should now take a moment to look over the screen and familiarize yourself with the various tasks that the example incorporates.The percentage of CPU cycles consumed by the tasks is provided in the CPU Usage column, and you should note that, after the kernel’s Idle Task—which runs when no application tasks are ready—it is the Tick Task—the kernel task responsible for processing periodic tick interrupts—that consumes the most CPU cycles, with a usage of approximately 5.5%.11.After you’ve looked over Task(s), you should stop µC/Probe (via the Stop buttonmentioned in Step 9). You should then return to Simplicity Studio to make a simple change to the example project’s code. Within the IDE, you should open the file ex_main.c. You’ll be able to find this file by expanding the Micrium folder within the Project Explorer, and then similarly expanding Micrium_OS_V5.00 and examples. You should add the below two lines to ex_main.c, placing the new code at line 156, just below the variable declaration in the main() function. The result of your addition will be to change the frequency of tick interrupts received by the kernel, from 1 kHz to 100 Hz.OS_TASK_CFG Ex_MainCfgTick = {DEF_NULL, 256u, 4u, 100u};OS_ConfigureTickTask(&Ex_MainCfgTick);12.You should now build and run your modified project, following the same procedure thatyou used in Lab 1. Afterward, you should return to µC/Probe and again run your workspace. With tick interrupts now occurring at 1/10 of their original frequency, you should confirm that the overhead of the kernel’s Tick Task has experienced a similar decrease, meaning that the task’s CPU usage should be around 0.6%.Lab 3: SystemViewThis lab w ill walk you through the steps needed to use SEGGER’s SystemView with the example project featured in the previous two labs. With SystemView, you’ll be able to see the cont ext switches, interrupts, and kernel function calls that occur as the project runs.Procedure:1.Because the latest Micrium OS is a relatively new software module, it is not yetsupported by the version of SystemView available from the SEGGER Web site.Fortunately, though, it is fairly easy to update SystemView so that it will recognize applications based on MicriumOS. To make the update, you should now copy SYSVIEW_Micrium OS Kernel.txt, which was provided in Micrium-Tools-Lab.zip, and paste this file into the Description folder in the SystemView install path—Program Files (x86)\SEGGER\SystemView_V242.2.You should now run SystemView by clicking the tool’s entry in the Windows Start menu.3.When you run SystemView for the first time, you’ll be presented with the below dialog,asking whether you’d like to load a sample recording. You can simply click this dialog’s No button.4.In order to begin analyzing the behavior of your example project’s code, you’ll need torecord the code’s activity. To initiate recording, you should select Target>Start Recording within SystemView. You will then be presented with a Configuration dialog.Once you’ve verified that the contents of this dialog match the screenshot shown below, you should click the OK button to initiate recording.5.Shortly after you’ve started to record, you may be presented with the dia log shown inthe below screenshot. This dialog indicates that some of the data that would otherwise be displayed by SystemView was lost, because the buffer used to temporarily store that data on your target experienced overflows. You can simply click OK to close the dialog.For information on how to limit the potential for overflows, you can consult the last section in this document.6.Once you’ve gathered a few second’s worth of data, you should click the Stop Recordingbutton shown in the first of the two screenshots shown below. As the second screenshot indicates, the Timeline located near the center of the SystemView main program window should subsequently display all of the task and ISR activity that occurred during the period the recording was active. You now can begin investigating the execution of the example project’s code in detail.7.If you adjust the zoom on the timeline, you should be able to see, every 40 ms, thepattern of events depicted in the below screenshot. The example project incorporates three application tasks, in addition to a number of kernel, or system, tasks. One of the application’s tasks, labeled Post Task, peridocially performs a post operation on a semaphore, and that is what is shown in the screenshot. In the next couple of steps, you’ll adjust the period of the Post Task and then make an additional SystemViewrecording to confirm the results.8.The period of the Post Task is established by a variable in the same file that youmanipulated in Step 11 of the previous lab, ex_main.c. The variable is named Ex_MainDelayPostms and you have two different options for changing its value.One is to simply replace the variable’s initialization on line 371 of ex_main.c with thebelow code. You’l l then need to rebuild the example project and again download its code to your board. The second option involves µC/Probe. In addition to allowing you to read variables, µC/Probe offers a number of Writable Controls for changing variable values. You can drag and drop one of these controls—a Horizontal Slider, for example—into your workspace from Lab 2, and use the new control to adjust the value of ExMainDelayPostms.Ex_MainDelayPostms = 20;9.With the value of the variable adjusted, you should return to SystemView and make anew recording. Now the post operation described in Step 6 should be visible every 20 ms, as opposed to 40 ms. If time permits, you can make further adjustments to the code, changing, for example, the priority of the Post Task (established by the #define EX_MAIN_POST_TASK_PRIO), and you can use SystemView to observe the results of the changes.Limiting OverflowsThere are a few steps that you can take to limit overflows and maximize the amount of data recorded by SystemView. One of these is to increase the size of the buffer used to temporarily store SystemView data on your target before it is passed to the PC application. The buffer size is established by the #define SEGGER_SYSVIEW_RTT_BUFFER_SIZE in the file SEGGER_SYSVIEW_Conf.h. This file is contained in Micrium/Tools/SystemView/Config within the example project. The provided copy of SEGGER_SYSVIEW_Conf.h uses a buffer size of 4096, but you’re free to increase to any size that the hardware can accomodate.An additional measure, recommended by SEGGER for reducing the number of overflows, is to ensure that SystemView is the only tool using your J-Link. In other words, if you were previously running µC/Probe or the Simplicity Studio debugger while recording data, you should stop the other tools and try a new recording. With exclusive access to the J-Link, SystemView should have fewer impediments to capturing all of the example project’s events.。
瑞恩计算机技术有限公司 Thinsys 云终端 C300

云终端采用集成化的系统结构设计,不配置软驱、光驱、硬盘等易坏易损部件,从而杜绝了病毒产生的来源,提高了系统的可靠性、稳定性. 云终端的本地系统软件采用嵌入式技术设计,因此云终端从硬件和软件两方面都保证了系统的稳定运行,其故障率较之PC大大降低。
4.价格低廉,轻松拥有:
普通电脑1/5的价格拥有云终端 ,轻松实现用户各种应用需求, 并运算可达到服务器的计算能力;由于云终端的运算主要是靠强大的服务器来支撑,所以不必为了运行新的软件而不断地去购买或升级用户的硬件设备。
5.数据安全,轻松实现 :
由于没有软驱、光驱、硬盘等设备,因此不能随意将软件复制、安装到系统中,也不能随意复制、带走企业内部的重要软件和保密数据 , 从而有效保护企业内部系统安全和信息安全。
一、传统PC环境下的IT系统成本构成
1、采购成本(硬件、软件和网络等、操作系统采购)
2、能源成本(产品PC平均200W左右、高功能耗PC运转需要散热)
/
/
/
http://www.ruien.hk/
2、储存设备丢失和维系
3、信息发布失控
4、外部竞争对手
5、黑客和间谍
三、桌面云通过“四集中”可有效应对企业安全风险问题。
1、管控集中
2、计算集中
3、储存集中
4、运维集中
四、调查数据看“安全”
据中国国家互联网应急中心抽样检测显示,2013年有近5万个境外IP地址作为木马或僵尸网络监控服务器,参与监控了我过境内近890万台主机,其中有超过99.4%的被控主机,源头在美国。而仿冒我过境内银行网站站点的IP也有将近四分之三来自美国。
中国的信息安全在以思科为代表的美国“八大金刚”(思科、IBM、Google、高通、英特尔、苹果、Oracle、微软)面前形同虚设。在绝大多数核心领域,这八家企业都中占据了庞大的市场份额。一位在信息安全领域沉侵了20多年的专家称:“作为全球第二大经济体,中国几乎是赤身裸体的站在已经武装到牙齿的美国‘八大金刚’面前。”
LabWindows CVI实时模块入门指南说明书

Getting Started with the LabWindows/CVI Real-Time™™ModuleThis document provides an introduction to the LabWindows™/CVI™ Real-Time Module. Refer to this document for installation and configuration instructions and information about creating a real-time (RT) project.Installing the Real-Time Module Software on a Host ComputerYou must first install the Real-Time Module software on a host computer. Then you can configure and install software on the RT target.To install and use the Real-Time Module software, you must have the following:•Free Disk Space—In addition to the minimum system requirements for LabWindows/CVI, you must have at least 250 MB of free disk space for the Real-Time Module software. Refer to the LabWindows/CVI Release Notes for minimum system requirements.•RT Target—The LabWindows/CVI Real-Time Module supports NI RT Series PXI controllers, NI Real-Time Industrial Controllers, stand-alone NI CompactDAQ systems, and desktop PCs converted to RT targets.•Refer to the Using Desktop PCs as RT Targets with the Real-Time Module document for more information about converting a desktop computer to an RT target.Refer to the LabWindows/CVI Real-Time Module Readme for a step-by-step guide to installing the LabWindows/CVI Real-Time Module. You can access the LabWindows/CVI Real-Time Module Readme by selecting Start»All Programs»National Instruments»LabWindows/CVI version»LabWindows/CVI Real-Time Module Readme.Configuring the RT T argetAfter you install LabWindows/CVI and the RT module, you must use Measurement & Automation Explorer (MAX) to configure the RT target and to install software and drivers on the RT target. MAX provides access to NI devices and systems and can communicate with networked RT targets, also known as remote systems.Complete the following steps to configure the RT target. The following sections describe these steps in more detail.1.Boot the RT target into LabVIEW RT.2.Configure network settings.2| |Getting Started with the LabWindows/CVI Real-Time Module3.Install software on the RT target.4.Configure I/O.5.Configure system settings.6.Configure time settings.Refer to the Measurement & Automation Explorer Help for a complete tutorial aboutconfiguring the RT target. Select Help»MAX Help to access this help file, and then refer to the MAX Remote Systems Help section.Tip The Measurement & Automation Explorer Help refers to the LabVIEWReal-Time Module. However, you can apply the same concepts when you use theLabWindows/CVI Real-Time Module.Booting the RT Target into LabVIEW RTBefore you begin configuration, make sure your remote system is booted into LabVIEWReal-Time. If your RT target came with only LabVIEW Real-Time preinstalled on its hard drive, the system is already set up to boot into LabVIEW Real-Time. Many NI RT targets have DIP switches or BIOS settings for booting into LabVIEW Real-Time. For more information, refer to the Booting Into the LabVIEW Real-Time Module topic in the Measurement & Automation Explorer Help .You can permanently format the hard drive and configure it to boot directly into RT using the Tools»Desktop PC Utility USB Drive command in MAX.Configuring Network SettingsNoteFor the initial configuration, you must connect networked RT targets to thesame network subnet as the host computer from which you launch MAX.1.Connect the RT target to the network and power on the target.2.Launch MAX and expand the Remote Systems item in the MAX configuration tree.3.Select the RT target from the Remote Systems list. Some RT targets will be listed with an automatically configured name or IP address while other targets will be listed as 0.0.0.0.4.Specify a name for the RT target in the System Settings tab.5.Configure the IP address settings in the Network Settings tab using one of the followingoptions:•Select the DHCP or Link Local item from the Configure IPv4 Address option to obtain an IP address automatically.•Select the Static item from the Configure IPv4 Address option and specify anIP address.6.Click Save to commit the changes.7.Click Yesto reboot the RT target when prompted.Getting Started with the LabWindows/CVI Real-Time Module |© National Instruments |3Installing Software on the RT TargetUse the LabVIEW Real-Time Software Wizard in MAX to install the software and drivers from the host computer on the RT target. With the LabVIEW Real-Time Software Wizard, you can view and change the software that is installed on the target. Click Help in the wizard for more information about installing and uninstalling software on the RT target.Complete the following steps to launch the LabVIEW Real-Time Software Wizard:1.Launch MAX.2.Find and expand your RT target under the Remote Systems item in the MAX configurationtree, right-click Software , and select Add/Remove Software .When you select Add/Remove Software , MAX launches the LabVIEW Real-TimeSoftware Wizard. This displays all the National Instruments software and drivers installed on the host computer that you can install on a selected RT target.3.Select the software you want to install on the RT target, click the icon next to the software,and select Install the feature .Some components are automatically included as dependencies of other components. For more information about the features listed in the wizard, select the feature to view a description.The following list describes components you might commonly install.NoteIf you have multiple versions of a component installed on the host computer,the most recent version is selected by default. You can choose to install anotherversion.•Ethernet Drivers —MAX automatically selects the appropriate Ethernet driver(s) forthe RT target when you install the LabWindows/CVI Run-Time Engine for RTcomponent.•LabVIEW Real Time —MAX selects this item automatically when you install the LabWindows/CVI Run-Time Engine for RT component.–NI RT Extensions for SMP (MultiCore Support)—Install this item to takeadvantage of parallel processing on a multiple-CPU system.NoteSingle-CPU systems perform best without the NI RT Extensions for SMP .Also, some applications, such as those that consist mainly of single-point I/O, canachieve lower latency on a multicore system by using a single CPU without the NI RT Extensions for SMP .–Microsoft Visual Studio 2008 Runtime Support —Install this item if your application requires additional DLLs built with Visual Studio 2008.•LabWindows/CVI Network Streams for RT —Install this item if your application uses functions from the Network Streams Library. •LabWindows/CVI Network Variable for RT —Install this item if your applicationuses functions from the Network Variable Library.•LabWindows/CVI Run-Time Engine for RT—Install this item to add support for LabWindows/CVI RT applications on the RT target. This component is required forall LabWindows/CVI RT applications.•Language Support for LabVIEW RT—Install this item if you are using strings in your RT application containing ASCII characters above 127 or multibyte characters.After installing this item on the RT target, you can configure the locale in MAX byselecting the target in the Remote Systems item in the MAX configuration tree,selecting the System Settings tab, and modifying the Locale option.•NI Hardware Drivers—Install the appropriate drivers for any other hardware libraries that you use in your application. For example, install the NI-DAQmxcomponent if your application uses functions from the NI-DAQmx Library.•Network Variable Engine—MAX automatically selects this item when you install the LabWindows/CVI Network Variable for RT component.•NI Web-Based Configuration and Monitoring—Install this item to use a Web browser to monitor and configure an RT target.•State System Publisher—Install this item to monitor CPU and memory usage for an RT target from the NI Distributed System Manager.•USB Support—Install this item to enable support for accessing USB thumbdrives.•Variable Client Support for LabVIEW RT—MAX automatically selects this item when you install the LabWindows/CVI Network Variable for RT component. 4.When you finish selecting the software you want to install, click Next and continuefollowing the instructions on the screen.Configuring I/OYou must configure any National Instruments I/O devices before you can use them from a LabWindows/CVI RT application. For information about how to correctly configure I/O devices, refer to the documentation for that hardware.Configuring System Settings1.Select the System Settings tab to configure system-level settings for the RT target.2.Configure the Locale option to match the language you use for strings in your RTapplication. This option is available only when you install the Language Support for LabVIEW RT component on the RT target. This option determines the code page that LabWindows/CVI uses when processing strings containing ASCII characters above 127 or multibyte characters.Configuring Time Settings1.Select the Time Settings tab to configure date and time settings for the RT target.e the Time Zone option to configure the time zone for the RT target. You can use thissetting with time and date functions to provide accurate time information relative to the time zone setting.4||Getting Started with the LabWindows/CVI Real-Time ModuleUsing NI Web-Based Monitoring and ConfigurationIf you install NI Web-Based Monitoring and Configuration, you can use a Web browser to monitor and configure the RT target.Configuration. If you have not installed Microsoft Silverlight, NI Web-BasedMonitoring and Configuration prompts you to do so.1.In a Web browser, enter the URL http://[IP address of the RT target] toaccess Web-based monitoring and configuration for the remote system.2.Click the Login button in the top-right corner of the page.3.Enter Admin in the User name field.4.Leave the Password field blank.5.Click the OK button.6.When you log in, you can view and change system, network, security, and time settings;view console output remotely; access the file system remotely; and so on.For more information about NI Web-Based Monitoring and Configuration, refer to the LabWindows/CVI Real-Time Module Help.Configuring an RT ProjectAfter you configure the RT target, you can create an RT application on the host computer and then run the application on an RT target. The applications that you create with the LabWindows/CVI Real-Time Module are DLLs.Complete the following steps to create a DLL and specify an RT target directly from LabWindows/CVI.1.Create a project in LabWindows/CVI using RTmain instead of main as the entry pointfunction for the program. Select Edit»Insert Construct»RTmain to insert the RTmain code into the program source.2.Select Build»Configuration»Debug or Build»Configuration»Release to specify theactive configuration for the project.3.Select Build»Target Type»Dynamic Link Library to configure the project to generate aDLL.4.Select Build»Target Settings to open the Target Settings dialog box. Select Real-timeonly in the Run-time support option. If you specify this option, LabWindows/CVI does not link to the entire set of LabWindows/CVI libraries but instead links to only thoselibraries supported on an RT system.5.Click OK to exit the dialog box.6.Select Build»Build to create the DLL.You also can use a project template to create an RT DLL. The project template includes basicsettings for RT projects described in the preceding section. To select a project template,Getting Started with the LabWindows/CVI Real-Time Module|© National Instruments|5select File»New»Project from Template. In the New Project from Template dialog box, select Real-Time Target Application.Specifying an RT TargetComplete the following steps to select the RT target on which to run your RT application.1.Select Run»Select Execution Target for Debugging to view a list of previouslyconfigured RT targets. Select the RT target you want to use from the list, if it is available.2.To configure a new RT target, select Run»Select Execution Target for Debugging»NewExecution Target.3.In the New Real-Time Execution Target dialog box, enter the computer name or IP addressof the RT target in the Hostname/IP Address option and click OK to exit the dialog box. Running an RT ApplicationSelect Run»Debug Project to run your RT application.warning message. Click Continue to download and run the release DLL on the RTtarget.LabWindows/CVI automatically builds the DLL and downloads the DLL and any DLLs that are statically linked to it onto the specified RT target. LabWindows/CVI places the files that it automatically downloads in the NI-RT\CVI\temp folder. LabWindows/CVI empties the folder when you reset the RT device.While you run your RT application, LabWindows/CVI displays a <<Running on target>> menu in the upper left corner of the LabWindows/CVI environment. The menu contains the following options, which you can use for debugging and for shutting down the RT application:•Toggle Breakpoint—Turn on or turn off a breakpoint on the selected line when a Source window is active.•Break Execution—Suspend execution of the program.•Simulate RT Shutting Down—End program execution. This option causes the RTIsShuttingDown function to return 1, giving the RT application an opportunity to run any necessary cleanup code and exit. The RT target does not reboot.•Abort Execution and Reboot Target—End program execution and reboot the RT target.The application cleanup code is not guaranteed to finish running before the RT target reboots.•Disconnect from RT target—Disconnect LabWindows/CVI from the RT target while theRT application continues running on the target. Once you disconnect from the RT target,you cannot reconnect LabWindows/CVI to the RT application that is running.6||Getting Started with the LabWindows/CVI Real-Time ModuleDebugging an RT ApplicationIf you select Build»Configuration»Debug, you can debug the DLL from the LabWindows/CVI environment as you would debug any other application. For example, you can set breakpoints and watch expressions, step through code, view and edit variable values, and so on. For more information about debugging in LabWindows/CVI, refer to the Using LabWindows/CVI»Debugging Tools section of the LabWindows/CVI Help.Using the Real-Time Execution T race ToolkitThe LabWindows/CVI Real-Time Module includes a limited time full-featured evaluation of the Real-Time Execution Trace Toolkit.Use the Real-Time Execution Trace Toolkit to analyze the timing and execution of an RT application. Use the Execution Trace functions in the Real-Time Utility Library to capture the timing and execution data of functions and threads in an application running on an RT target. The Real-Time Execution Trace Tool displays the timing and event data, or trace session, on the host computer.In LabWindows/CVI, select Tools»Real-Time Execution Trace Tool to launch the Real-Time Execution Trace Tool. Refer to the LabWindows/CVI Help for more information about using the Real-Time Execution Trace Toolkit to analyze RT applications.Deploying an RT ApplicationWhen you finish developing your RT application, you can deploy it to an RT target. After you deploy the RT application, the RT application runs automatically every time the RT target reboots.Select Run»Install Program to Real-Time Execution Target to deploy your RT application. This option performs the following actions:•Checks that the release configuration of the DLL has been built; if not, LabWindows/CVI prompts you to build the DLL or cancel.•Deploys the release DLL and any statically linked DLLs to the NI-RT\CVI folder on the RT target.•Sets the release DLL as a startup DLL.•Displays a dialog box indicating that the DLL was copied and prompting you to reboot the RT target.If you have additional support files that you need to deploy, complete the following steps:1.Select Run»Manage Files on Real-Time Execution Target to launch theLabWindows/CVI Real-Time File Copy Utility.2.Click Add Files and browse to any support files that your application requires. The utilityimmediately copies the files to the NI-RT\CVI folder on the RT target.3.Click Done when you finish adding support files.Getting Started with the LabWindows/CVI Real-Time Module|© National Instruments|7Where to Go from HereRefer to the following resources for more information about the LabWindows/CVI Real-Time Module:•The LabWindows/CVI Real-Time Module Help section of the LabWindows/CVI Help includes conceptual information about real-time programming techniques, application architectures, and Real-Time Module software features you can use to create real-time applications. Select Help»Contents in LabWindows/CVI to access the LabWindows/CVI Help.•Use the NI Example Finder, available by selecting Help»Find Examples in LabWindows/CVI, to browse or search for example programs. You also can access the example programs from the samples\CVI samples\realtime directory.Refer to the NI Trademarks and Logo Guidelines at /trademarks for more information on National Instruments trademarks. Other product and company names mentioned herein are trademarks or trade names of their respective companies. For patents covering National Instruments products/technology, refer to the appropriate location: Help»Patents in your software, the patents.txt file on your media, or the National Instruments Patents Notice at /patents. You can find information about end-user license agreements (EULAs) and third-party legal notices in the readme file for your NI product. Refer to the Export Compliance Information at /legal/export-compliance for the National Instruments global trade compliance policy and how to obtain relevant HTS codes, ECCNs, and other import/export data.© 2007–2013 National Instruments. All rights reserved.374686E-01Aug13。
Tintri VMstore T7000系列商品介绍说明书
Revolutionizing and Downsizing StorageManagement with Intelligent InfrastructureNVMe is currently the fastest storage media available. But today’s IT departments realize that hardware performance is just one of many important factors that drive successful data center operations.The Tintri VMstore T7000 Series is the latest addition to the storage industry’s only true Intelligent Infrastructure portfolio. Yes, the T7000 delivers NVMe-driven performance and efficiencies, supporting up to 7,500 virtualized applications in just two rack units. And yes, it offers the kind of scalability, availability and security that you’d expect from an enterprise-grade system that powers Fortune 100 firms. But it’s the outstanding AI-driven efficiency and optimizations that our customers love most and what sets VMstore apart from the rest of the pack. VMstore systems deploy in minutes, self-optimize to accommodate the most dynamic workloads in the data center and maintain quality of service (Auto-QoS) for each VM or application. Businesses can actually enjoy using storage for the first time – with autonomous operations and advanced real-time and predictive analytics that consistently drive down storage management activities and costs – by as much as 95%.The T7000 is the first NVMe-based VMstore system, leveraging DDN’s battle-tested NVMe technology and providing 30% faster performance than previous-generation VMstore systems. VMstore T7000 customers also benefit from using the same storage hardware controller as DDN At-Scale solutions, deployed in the most demanding AI, analytics, deep learning and high IOPS workloads on the planet.Scale up to 645TB with a single VMstore system and grow beyond 40PB in a scale-out configuration. All your VMstore systems – supporting up to hundreds of thousands of applications – can be managed from a single console. Enterprises that have chosen NVMe as their preferred platform can now gain the advantages of Intelligent Infrastructure to consolidate their enterprise applications, manage storage with generalist IT skills and re-focus on their business.Tintri VMstore T7000™NVMe PlatformFeatures• Consistent Performance – Isolation for every app, VM, and database all the time • Data Services – Real-time deduplication and compression, public cloud connector, copy data management, and more • Real-Time Analytics – Visibility across storage, network, and hosts on a per-application, VM, or database basis • Actionable Analytics – Get to root cause in one click; fix and see results instantly • Predictive Analytics – Profile application types, then model and forecast capacity and performance needs over the next 18 months • Developer Choice – Select Tintri’s native REST APIs, PowerShell toolkit, Python SDK, or plugins such as our vRealize Orchestrator that meet your needs • Per-Application Data Management – Manage snapshots, clones, replication, and QoS policies on a per-app, VM, or database basis • High Availability – Dual-controller, hot spares, and inline checksum and referential integrity with real-time error detection • Choice of Application Environments – Supports containers as well as VMsBenefits• Guaranteed high performance for every workload without manual intervention • Concurrent multi-hypervisor support enables you to operate vSphere, Hyper-V, RHEV, XenServer and OpenStack simultaneously on a single system without partitioning • Remote management of both initial system configuration and power simplifies administration of your distributed environment • Share analytics data with vRealize Operations, Microsoft System Center Operations Manager, and other platforms to gain valuable holistic insight • Easy configuration enables you to go from box to production workloads in under an hour in most cases • Our autonomous operation eliminates the vast majority of manual tasks, saving time and reducing errors • Our support for open APIs delivers choice while making scripting simple, standardized, and powerful •Supports vSphere 7 with Kubernetes for containerized applicationsTintri VMstore T7000 NVMe PlatformVM-DS009-0221-01© 2021 Tintri by DDN, Inc., All Rights Reserved@tintri ***************a. VMstore Scale-out enables you to manage storage as a federated pool, heterogeneously accommodating hybrid/all-flash nodes for both existing and future systems. You can start with one 19TB all-flash system and grow up to 40PB capacity supporting up to 480,000 virtual machines.b. Effective capacity refers to usable space. It is calculated by removing data protection overhead from RAW capacity, and then a space savings multiplier is applied. Data protection overhead includes double parity, hot spare and internal reserves for metadata. Space savings is derived from inline deduplication, compression and clone savings, but does not include thin provisioning. Data reduction typically provides 2.5-5x capacity savings; 5x was used for the value shown.c. Assumes minimum policy of 8 hourly snapshots, 7 daily snapshots, and 4 weekly snapshots. All snapshots are logically represented as full recoveries.d. One MB is equal to one million bytes, one GB is equal to one billion bytes and one TB equals 1,000GB (one trillion bytes) when referring to storage capacity. Accessible capacity will vary from the stated capacity due to formatting and partitioning of SSDs, the operating system, and other factors.e. Stated capacity assumes a homogeneous pool of 64 nodes equipped at maximum capacity. Scale-out storage pools can be heterogeneous with a mixture of up to 64 all-flash and hybrid system nodes.。
NVIDIA HPC Compilers Support Services Quick Start
DQ-10081-001-V001 | January 2022HPC Compiler Support Services Quick Start Guide provides minimal instructionsfor accessing NVIDIA® portals as well as downloading and installing the supported software. If you need complete instructions for installation and use of the software, please refer to the HPC SDK Installation Guide and HPC Compilers Documentation for your version of the HPC SDK software, or PGI Documentation for legacy PGI software. After your order for NVIDIA HPC Compiler Support Service is processed, youwill receive an order confirmation message from NVIDIA. This message contains information that you need for accessing NVIDIA Enterprise and Licensing Portalsand getting your NVIDIA software from the NVIDIA Licensing Portal. To log in to the NVIDIA Licensing Portal, you must have an NVIDIA Enterprise Account.1.1. Your Order Confirmation MessageAfter your order for NVIDIA HPC Compiler Support Services is processed, you will receive an order confirmation message to which your NVIDIA Entitlement Certificate is attached.Your NVIDIA Entitlement Certificate contains your order information.Your NVIDIA Entitlement Certificate also provides instructions for using the certificate.To get the support for your NVIDIA HPC Compiler Support Services , you must have an NVIDIA Enterprise Account.For a HPC Compiler Support Services renewal, you should already have an NVIDIAEnterprise AccountIf you do not have an account, follow the Register link in the instructions for using the certificate to create your account. For details, see the next section, Creating your NVIDIA Enterprise Account.If you already have an account, follow the Login link in the instructions for using the certificate to log in to the NVIDIA Enterprise Application Hub.1.2. Creating your NVIDIA Enterprise AccountIf you do not have an NVIDIA Enterprise Account, you must create an account to be able to log in to the NVIDIA Licensing Portal.If you already have an account, skip this task and go to Downloading Your NVIDIA HPCSDK or PGI Software.Before you begin, ensure that you have your order confirmation message.1.In the instructions for using your NVIDIA Entitlement Certificate, follow the Register link.2.Fill out the form on the NVIDIA Enterprise Account Registration page and click Register.A message confirming that an account has been created appears and an e-mail instructing you to set your NVIDIA password is sent to the e-mail address you provided.3.Open the e-mail instructing you to set your password and click SET PASSWORDAfter you have set your password during the initial registration process, you willbe able to log in to your account within 15 minutes. However, it may take up to 24business hours for your entitlement to appear in your account.For your account security, the SET PASSWORD link in this e-mail is set to expire in 24 hours.4.Enter and re-enter your new password, and click SUBMIT.A message confirming that your password has been set successfully appears.You will land on the Application Hub with access to both NVIDIA Licensing Portal and NVIDIA Enterprise Support Portal.2.1. Downloading Your NVIDIA HPC SDK or PGI SoftwareBefore you begin, ensure that you have your order confirmation message and have created an NVIDIA Enterprise Account.1.Visit the NVIDIA Enterprise Application Hub by following the Login link in the instructions for using your NVIDIA Entitlement Certificate or when prompted after setting the password for your NVIDIA Enterprise Account.2.When prompted, provide your e-mail address and password, and click LOGIN.3.On the NVIDIA APPLICATION HUB page that opens, click NVIDIA LICENSING PORTAL.The NVIDIA Licensing Portal dashboard page opens.Your entitlement might not appear on the NVIDIA Licensing Portal dashboard pageuntil 24 business hours after you set your password during the initial registrationprocess.4.In the left navigation pane of the NVIDIA Licensing Portal dashboard, click SOFTWARE DOWNLOADS.5.On the Product Download page that opens, follow the Download link for the release, platform, version and package type of NVIDIA software that you wish to use, for example, NVIDIA HPC SDK for Linux/x86-64 RPM version 22.1.If you don't see the release of NVIDIA HPC SDK or PGI software that you wish to use, click ALL A V AILABLE to see a list of all NVIDIA HPC SDK and PGI softwareavailable for download. The “Product” box can be used to select only HPC SDK (“HPC”) or PGI. Use the drop-down lists or the search box to further filter the software listed.For PGI software, the following archive versions are available:Linux x86-64: 10.2 to 20.4Linux OpenPOWER: 16.1 to 20.4Windows: 18.10 to 20.4 (command line only)The last PGI release was version 20.4. Product descriptions may not match those onthe legacy PGI website, but provided packages contain the most features available.Some older versions of PGI are no longer available to new customers and are notprovided here.6.When prompted to accept the license for the software that you are downloading, click AGREE & DOWNLOAD.7.When the browser asks what it should do with the file, select the option to save the file.8.For PGI software only, you will also need to download a License Key. This is not required for HPC SDK software.1.Navigate to the SOFTWARE DOWNLOADS page as described in step 4 above2.Search for “PGI License Key” and download the License File for your platform.This is a text file that contains instructions for use. Open with any text editor.3.Save this file for use after installing the PGI software as described in the nextsection.2.2. Installing Your NVIDIA HPC SDK or PGI Software1.HPC SDK Software1.Install per the instructions in the Installation Guide for your version available athttps:///hpc-sdk/.2.There are no License Files or License Servers to setup for the HPC SDK2.PGI Software1.Install per the instructions in the Installation Guide for your version available athttps:///hpc-sdk/pgi-compilers/, skipping any steps regardinginstallation of License Files or License Servers.2.After installation is complete, follow the instructions included within the LicenseFile from step 8 in section 2.1 above. This typically involves renaming the License File to “license.dat” for x86 platforms or “license.pgi” for OpenPOWER, andplacing it in the top level PGI installation directory, e.g., /opt/pgi, replacing any existing License File that may already exist.NoticeALL NVIDIA DESIGN SPECIFICATIONS, REFERENCE BOARDS, FILES, DRAWINGS, DIAGNOSTICS, LISTS, AND OTHER DOCUMENTS (TOGETHER AND SEPARATELY, "MATERIALS") ARE BEING PROVIDED "AS IS." NVIDIA MAKES NO WARRANTIES, EXPRESSED, IMPLIED, STATUTORY, OR OTHERWISE WITH RESPECT TO THE MATERIALS, AND EXPRESSLY DISCLAIMS ALL IMPLIED WARRANTIES OF NONINFRINGEMENT, MERCHANTABILITY, AND FITNESS FOR A PARTICULAR PURPOSE.Information furnished is believed to be accurate and reliable. However, NVIDIA Corporation assumes no responsibility for the consequences of use of such information or for any infringement of patents or other rights of third parties that may result from its use. No license is granted by implication of otherwise under any patent rights of NVIDIA Corporation. Specifications mentioned in this publication are subject to change without notice. This publication supersedes and replaces all other information previously supplied. NVIDIA Corporation products are not authorized as critical components in life support devices or systems without express written approval of NVIDIA Corporation.TrademarksNVIDIA, the NVIDIA logo, CUDA, CUDA-X, GPUDirect, HPC SDK, NGC, NVIDIA Volta, NVIDIA DGX, NVIDIA Nsight, NVLink, NVSwitch, and Tesla are trademarks and/or registered trademarks of NVIDIA Corporation in the U.S. and other countries. Other company and product names may be trademarks of the respective companies with which they are associated.Copyright© 2022 NVIDIA Corporation. All rights reserved.。
Windows Server 2012 R2 快速入门指南说明书
For more information about the installation options, what is included with each option, how to switch between them, and related features such as the Minimal Server Interface and Features on Demand, see Windows Server Installation Options at /fwlink/p/?LinkId=242140.
Automated Installation You can automate Windows Server installation by using the tools and documentation in the Windows Assessment and Deployment mating deployment eliminates the need for any user interaction during installation. In addition, you can configure different options within the operating system, such as Internet Explorer settings and network settings.
The two installation options are available for most Windows Server editions. Not all server roles and features are available in all editions. For details about the roles and features available in each Windows Server edition, see /fwlink/p/?LinkId=251499
SINUMERIK Operate 4.7 SP3升级指南说明书
SINUMERIK 840D sl2016-12-07Upgrade instructionsSINUMERIK Operate 4.7 SP3 for PCU 50.5 / IPC_________________________________________________________________________________________SINUMERIK Operate 04.07.04.00 (internal version 04.07.04.00.016) for PCU 50.5 / IPC_________________________________________________________________________________________To install this software,a PCU 50.5 with previously installed PCU Base Software Win7 V10.0 (or later)a PCU 50.5 with previously installed PCU Base Software WinXP V1.4 HF9 (or later)is required.Important note for operation on PCU 50.5 Windows 7:Before switching off the power supply of the PCU 50.5 / IPC, the system should be shut down using the Operate softkey EXIT or using the Windows shutdown function, in the same way as with a PC with Windows 7. A UPS should be used to provide protection against unexpected power failures.The commissioning instructions for SINUMERIK Operate 4.7 SP2 and the PCU base software Win7 / WinXP, the Equipment Manual Operator Components and the SINUMERIK operating instructions Operate 4.7 SP2 apply accordingly. In addition, the general conditions published for the CNC software 4.7 SP4 must be observed.SINUMERIK Operate 4.7 SP4 is only released for operating SINUMERIK 840D sl NCU7x0.3 withCNC software 4.7 SP4 or with HMI Pro sl V04.05.03.04 or higher for operating a SIMATIC CPU 317 / 319.SINUMERIK Operate for PCU 50 does not include any technology cycles or measurement and ISO cycles. These are available on the CF card of the NCU, and are automatically installed when the NCU powers up - also see the notes provided in the upgrade instructions for the CNC software 4.7 SP4.InstallationImportant: A previously installed version V4.7 SP4 or higher of the SINUMERIK Operate for PCU 50 must first be uninstalled under Control Panel / Programs and Features.To install SINUMERIK Operate for PCU 50, the user must call the Setup_HMIsl_......exe file from the Windows desktop of the PCU 50. To do this, either create a network connection to a PC using the DVD supplied or copy the software from the DVD supplied to a USB flash drive and then connect it directly to the PCU 50.The installation directory is permanently defined as C:\Program Files (x86) for PCU 50 Windows 7 or F:\hmisl for PCU 50 WinXP.During the installation, you will be asked about the installation type:Operation on a SINUMERIK NCU (default setting)Operation on a SIMATIC CPU 317 / 319Integration of .NET-Framework for OEM applicationsLicensingFor operation on an NCU, SINUMERIK Operate on PCU 50 requires licensing via the SINUMERIK option6FC5800-0AP88-0YB0.====================================================================Compatibility==================================================================== SINUMERIK Operate 4.7 SP4 can be combined with 840D sl NCU 7x0.3 (B) with CNC-SW 4.7 SP4.The help system is based on the documentation for CNC SW 4.7 SP2.NC alarm texts are based on CNC SW 4.7 SP2.The additional languages V4.5.2 , V4.7.2.1 and V4.7.3 can be used. New texts in SW 4.7 SP4 are displayed in English if necessary.All drive texts (alarm and parameter texts as well as the corresponding online helps) are also displayed in English when using the additional languages V4.5.2 and V4.7.2.1.STEP7 for SINUMERIK PCU 50 from V5.5 SP3 and higher can be linked into SINUMERIK Operate 4.7 SP4 and can then be run.SINUMERIK Operate 4.7 SP3 for PCU 50.5 / IPC====================================================================Notes regarding SINUMERIK Operate on PCU 50:The "Local drive" in SINUMERIK Operate for PCU 50 Win7 is stored on the hard disk under C:\Program Files(x86)\Siemens\MotionControl\user\sinumerik\data and is always provided without option.When using SIMATIC ITC panels, no touch softkey is available for the help function.The mold and die view cannot be used with POLY and G91 blocks.The mold and die view cannot be used with BSPLINE blocks.Only the elements 0 to max. 65534 can be displayed or changed in GUD arrays, even if the array isgreater in the NC.File/folder names that contain a minus character are rejected both in the NC memory and on the local drive.Restrictions with EES:When using a USB stick on the TCU in combination with a PCU, you can currently not edit any files on the USB with active EES mode. You can only execute these files.If a USB stick on a TCU is accessed by several HMIs / NCUs in parallel, the components are notcoordinated. This entails the danger that a program being executed is modified / destroyed by another component.For the front USB of the TCU in combination withIf a specific user should be automatically logged on during installation of Operate on PCU 50 Win7, the user must have a Windows password.Othwerwise the installation is aborted and fault Fehler 1722output.When installing Operate on PCU 50, the entered password is not checked with autologon set for a user.When executing part programs from network drives or editing files on network drives, the user mustprovide for a stable, interference-free network connection to the network drives.When executing from USB stick it may occur that no program blocks are displayed if a USB stick was inserted before into another USB interface.When terminating Operate with the Exit softkey, an internal crash may occur which is not visible on the operator interface. However, a Crashlog and a dump file are created in each case.For touch panels without keyboard, the alarm screens of the Diagnostics area now include a verticalsoftkey " Cancel Alarm".Rsoftkey is displayed, the machine data MD 11280 $MN_WPD_INI_MODE must have the value 1.OPC-UA:There are two possibilities to set up a connection:Connection without securitymode "SignAndEncry"Siemens recommends that you always establish a connection with security, as only in this way theconfidentiality of the data transferred can be ensured.When restarting Operate, it may occur that the reconnection with the OPC server fails. In this case, you must restart NCU respectively PCU 50 / IPC.Settings:To operate a PCU 50 with an external monitor, the screen size of Operate can be set in the fileC:\Program Files(x86)\Siemens\MotionControl\user\sinumerik\hmi\cfg\slrs.ini with the entry[Global]SINUMERIK Operate 4.7 SP3 for PCU 50.5 / IPCResolution =; permissible values: 640x480, 800x600, 1024x768, 1280x1024Subsequently enter Autostart of Operate for a (different) user on PCU 50.5-Win7:On the desktop, start menu "All Programs", select Startup. Right-click and choose "Open". This opens an Explorer. In the right-hand Explorer window, right-click and create "New" "Shortcut".Then with "Browse ...", enter file "C:\Program Files(x86)\Siemens\MotionControl \siemens\sinumerik\hmi\ autostart\slstartup.exe".Operate includes the "AppSight-Blackbox" (tool for analyzing causes of application crashes), and is active as default. It can be deactivated by making an appropriate entry in file run_hmi.ini:[BlackBox]; enabled could be set to true or false. Default: trueenabled=trueThe log file created by the AppSight Blackbox on error is called:It is written when Operate is exited. Processes that are still running may need to be explicitly terminated. This log file must be forwarded to the SINUMERIK Hotline together with the HMI crash log.With Operate on PCU 50-WinXP the setting of the date / time only affects the clock of the NC/PLC, not the clock of the PCU 50New designsoftkeys incl. the icons on the softkeys, the appearance of the window title bars, various colors (window background colors) and the appearance / behavior of the header the displays for the operating area and operating mode can be found on the right side of the header line and, with no alarm pending, the header only shows the Siemens logo.The new skin can be activated with the display MD 9112 HMI_SKIN = 1. After a restart, Operate uses the new skin. For the new design, we recommend that you use a color depth of 32 bit.With multi-touch operation (e.g. OP015Black) the functions of the user interface have also been expanded. There are six function keys above the vertical softkeys which are always visible for the functions Undo, Redo, Open/close online help, Open/close virtual keyboard, Open/close calculator, Create screenshot.。
20VC操作说明
20VC—2000A操作说明前言20VC—2000A数控加工中心,原控制系统为CINCINNA TIA—900 CNC系统;经使用Siemens—840D对其改造后,机床基本功能保持不变,操作方式采用了Siemens操作面板,操作方法与原机床有很大区别。
由于改造使用的是Siemens标准操作面板,因而其操作方式,方法可参照Siemens操作手册(6FC5298—3AA60—OBPI),本说明书就一些该机床特定的操作方式、方法做说明。
一、安全规程〈一〉。
机床在运行过程中存在危险电压、不注意安全规程将导致严重的人身危害及机床事故。
〈二〉。
操作人员只有在完全了解了各项警告和安全注意事项后方能操作和维护设备。
〈三〉。
操作人员应接受过培训并按安全规程启停、使用和维护设备。
〈四〉。
操作人员必须阅读所有资料中的注意事项以防止不安全状况的出现。
〈五〉。
在机床设备表明“危险”“有电符号”的地方应特别引起注意。
〈六〉。
机床有些设备表面温度可能很高,在有“”标签处请不要触摸。
〈七〉。
维护设备应在机床处于断电状态下进行。
二、机床的启停〈一〉。
机床启动:1.合上电器柜上机床总电源闸刀开关,此时机床系统得电。
操作站MMC得电,若此时紧急停止开关未按下,机床液压系统将运行,因而合闸时应注意观察液压单元运行是否正常(有无漏油、异常声响等)2、在MMC操作站工作正常后,打开紧急停止开关并按下面板左侧“RESET”键,若无故障显示即可打开坐标及主轴(按压面板右侧二个绿色“START”键)则开机完成。
〈二〉。
机床关机:1.坐标及主轴关机(按压面板右侧二个红色“STOP”键)。
2.压下紧急停止开关,关闭液压系统。
3.按下MMC显示器下方上“EXIT”软键,退出840系统(参照操作手册退出840系统相关章节。
)4.在MMC显示器上显示“可安全关闭电源”后,可拉下电器柜上总开关闸刀。
三、机床操作面板说明〈一〉。
机床操作面板采用Siemens标准机床操作面板。
戴尔易安信部署和配置指南 戴尔易安信 AMD EPYC (Naples) 处理器的 NUMA 配置说
Dell EMC NUMA Configuration for AMD EPYC (Naples) ProcessorsDell EngineeringFebruary 2018RevisionsThe information in this publication is provided “as is.” Dell Inc. makes no representations or warranties of any kind with respect to the inform ation in this publication, and specifically disclaims implied warranties of merchantability or fitness for a particular purpose.Use, copying, and distribution of any software described in this publication requires an applicable software license.Copyright © 2018 Dell Inc. or its subsidiaries. All Rights Reserved. Dell, EMC, and other trademarks are trademarks of Dell Inc. or its subsidiaries. Other trademarks may be the property of their respective owners. Published in the USA [4/16/2018] [Deployment and Configuration Guide]Dell believes the information in this document is accurate as of its publication date. The information is subject to change without notice.2 Dell EMC NUMA Configuration for AMD EPYC (Naples) Processors | version 1.0Table of contents Revisions (2)Executive summary (4)1AMD EPYC Architecture (5)1.1Zeppelin Die Layout (5)1.2Memory Interleaving (6)1.2.1Memory Interleaving Rules (6)1.2.2NUMA Domains per Memory Interleave Option (6)2Performance Tuning (8)2.1Memory DIMM Population Guidelines (8)2.2PCIe Configuration Guidelines (9)3BIOS Setup (10)4Platform Specific NUMA/Die Domain Details (11)5Technical support and resources (13)5.1Dell (13)5.2AMD (13)Executive summaryWith the introduction of AMD’s EPYC (Naples) x86 Server CPUs featuring four Zeppelin dies per packagethere is a need to clarify how AMD’s new silicon design establishes Non-Uniform Memory Access (NUMA)domains across dies and sockets.The goal of this Dell EMC Deployment and Configuration Guide is demonstrate how Dell EMC Serversleverages AMD’s EPYC CPUs to configured NUMA domains for optimal performance by using Dell EMCBIOS Settings.4 Dell EMC NUMA Configuration for AMD EPYC (Naples) Processors | version 1.01AMD EPYC Architecture1.1Zeppelin Die LayoutAMD EPYC is a Multi-Chip Module (MCM) processor and per silicon package there are four ZeppelinSOCs/dies leveraged from AMD Ryzen. Each of the four dies have direct Infinity Fabric connections to each of the other dies as well as a possible socket-to-socket interconnect. This design allows, at most, four NUMA nodes per socket or eight NUMA nodes in a dual sockets systemAMD EPYC processor’s four dies each have two Unified Memory Controllers (UMC), that each control one DDR channel with two DIMMs per channel, along with one controller for IO, as shown in Figure 1 below:Channel 0Channel 1Channel 4Channel 5Channel 2Channel 3Channel 6Channel 7IOIOIO IOFigure 1 Zeppelin Die Layout1.2 Memory InterleavingThe Memory Interleave feature for AMD EPYC processors is what controls how may NUMA domains aregenerated. AMD EPYC processors support 4 memory interleaving options. Each option becomes availablebased on system configuration.∙Socket Interleaving (2 processor configurations)∙Die Interleaving∙Channel Interleaving∙Memory Interleaving disabled1.2.1 Memory Interleaving RulesThe following are the rules for each memory interleave option:∙The system can socket interleave, but only if all channels in the entire system have the same amount of memory. Die interleaving must be enabled as well.∙The system can die interleave, but only if all channels on the socket have the same amount of memory. Channel interleaving must be enabled as well.∙The system can channel interleave as long as both channels have at least one DIMM. The channels do not have to be symmetrical. This is the default configuration.∙No interleave at all, where each channel is stacked on top of the previous channel. However, it should be noted that probe filter performance may be affected if there is one UMC with less memory than theother UMC on the same die.1.2.2 NUMA Domains per Memory Interleave OptionAMD’s new silicon architecture adds nuances on how to configure platforms for NUMA. The focus of AMDsscheme to NUMA lies within its quad-die layout and its potential to have four NUMA domains.Socket Interleaving is the only memory interleave option meant for inter-socket memory interleaving, and isonly available with 2-processor configurations. In this configuration memory across both sockets will be seenas a single memory domain producing a non-NUMA configuration.Die Interleaving is the intra-socket memory interleave option that creates one NUMA domain for all the fourdies on a socket. In a 2-processor configuration this will produce two NUMA domains, one domain pertainingto each socket providing customers with the first option for NUMA configuration. In a 1-processorconfiguration die interleaving will be the maximum option for memory interleaving, and will produce onememory domain thus producing a non-NUMA configuration.Channel Interleaving is the intra-die memory interleave option and is the default setting for Dell EMCplatforms. With channel interleaving the memory behind each UMC will be interleaved and seen as 1 NUMAdomain per die. This will generate four NUMA domains per socket.Memory Interleave disabled - When memory interleave is disable 4 NUMA nodes will be seen as in the case for channel interleaving but the memory will not be interleaved yet stacked next to one another.6 Dell EMC NUMA Configuration for AMD EPYC (Naples) Processors | version 1.0NUMA Domain Count per Memory Interleave Option2 Performance TuningFor best performance from AMD EPYC processors, it is recommended that each die have one DIMMpopulated on each channel. This allows all IO behind each die to access memory, with optimal latency.2.1 Memory DIMM Population Guidelines∙Populate empty channels, with the same type/capacity of DIMMs, before populating 2 DIMMs on a given channel∙Recommendations for best performance:o 1 DIMM per channel dedicates full memory bandwidtho Populating 2 DIMMs per channel will increase capacity but will lower the clock speed,resulting in lower memory bandwidth. There is a dependency between memory speed andthe bandwidth of the Infinity FabricMemory Bus Speed to Infinity Fabric Bud Speed∙Minimum recommended:o At least 1 DIMM is per die in the system for a total of 4 DIMM per CPU∙On Dell EMC platforms populate DIMM 1 first. (white slots in Figure 4, below)∙ A 2 socket system (2 CPUs are populated) will need equivalent memory configurations on both CPUs for optimal performance.8 Dell EMC NUMA Configuration for AMD EPYC (Naples) Processors | version 1.0DIMM Layout2.2 PCIe Configuration Guidelines∙When PCIe cards are populated into particular slots with NUMA-unaware application/software, make sure to have memory DIMMs populated in the corresponding NUMA-node mapping as local memory.Mappings can be found in Section 4 Platform Specific NUMA/Die Domain Details∙Considering also pinning the interrupts to local CPUs to get maximum performance. For instructions on how to tune network cards for better performance on AMD EPYC processors, go to the followinglinks and download provided documentation:o https:///TechDocs/56224.pdfo https:///resources/epyc-resources/epyc-white-papers/3 BIOS SetupThe “Memory Interleaving” setting controls whether the system is configured for Socket, Die, Channelinterleaving. In System Setup (F2 prompt during system boot), enter System BIOS > Memory Settings andnavigate to “Memory Interleaving” to choo se the memory interleave for desired configuration. This option isalso available in system management consoles such as RACADM.10 Dell EMC NUMA Configuration for AMD EPYC (Naples) Processors | version 1.04 Platform Specific NUMA/Die Domain DetailsThe following matrices shows how CPU die, memory and PCIe slots are physically grouped to each NUMAdomain for Dell EMC EPYC based platforms, PowerEdge R6415, R7415, and R7425.12 Dell EMC NUMA Configuration for AMD EPYC (Naples) Processors | version 1.05 Technical support and resources5.1 Dell/support is focused on meeting customer needs with proven services and support.Dell TechCenter is an online technical community where IT professionals have access to numerous resources for Dell EMC software, hardware and services.Storage Solutions Technical Documents on Dell TechCenter provide expertise that helps to ensure customersuccess on Dell EMC Storage platforms.5.2 AMDhttps:///community/server-gurus EPYC Server Community Forumhttps:///resources/epyc-resources/epyc-tuning-guides/ Linux Network Tuning Guide forAMD EPYC Processor Based Servers。
NVIDIA Mellanox ConnectX-6 Dx SmartNIC产品简介说明书
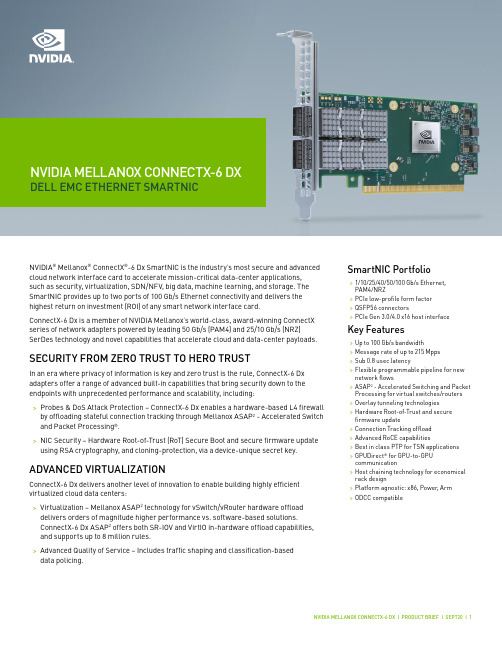
NVIDIA® Mellanox® ConnectX®-6 Dx SmartNIC is the industry’s most secure and advanced cloud network interface card to accelerate mission-critical data-center applications, such as security, virtualization, SDN/NFV, big data, machine learning, and storage. The SmartNIC provides up to two ports of 100 Gb/s Ethernet connectivity and delivers the highest return on investment (ROI) of any smart network interface card.ConnectX-6 Dx is a member of NVIDIA Mellanox’s world-class, award-winning ConnectX series of network adapters powered by leading 50 Gb/s (PAM4) and 25/10 Gb/s (NRZ) SerDes technology and novel capabilities that accelerate cloud and data-center payloads. SECURITY FROM ZERO TRUST TO HERO TRUSTIn an era where privacy of information is key and zero trust is the rule, ConnectX-6 Dx adapters offer a range of advanced built-in capabilities that bring security down to the endpoints with unprecedented performance and scalability, including:>Probes & DoS Attack Protection – ConnectX-6 Dx enables a hardware-based L4 firewall by offloading stateful connection tracking through Mellanox ASAP2 - Accelerated Switch and Packet Processing®.>NIC Security – Hardware Root-of-Trust (RoT) Secure Boot and secure firmware update using RSA cryptography, and cloning-protection, via a device-unique secret key. ADVANCED VIRTUALIZATIONConnectX-6 Dx delivers another level of innovation to enable building highly efficient virtualized cloud data centers:>Virtualization – Mellanox ASAP2 technology for vSwitch/vRouter hardware offloaddelivers orders of magnitude higher performance vs. software-based solutions.ConnectX-6 Dx ASAP2 offers both SR-IOV and VirtIO in-hardware offload capabilities, and supports up to 8 million rules.>Advanced Quality of Service – Includes traffic shaping and classification-baseddata policing. SmartNIC Portfolio>1/10/25/40/50/100 Gb/s Ethernet,PAM4/NRZ>PCIe low-profile form factor>QSFP56 connectors>PCIe Gen 3.0/4.0 x16 host interface Key Features>Up to 100 Gb/s bandwidth>Message rate of up to 215 Mpps>Sub 0.8 usec latency>Flexible programmable pipeline for new network flows>ASAP2 - Accelerated Switching and Packet Processing for virtual switches/routers >Overlay tunneling technologies>Hardware Root-of-Trust and secure firmware update>Connection Tracking offload>Advanced RoCE capabilities>Best in class PTP for TSN applications>GPUDirect® for GPU-to-GPU communication>Host chaining technology for economical rack design>Platform agnostic: x86, Power, Arm>ODCC compatibleNVIDIA MELLANOX CONNECTX-6 DX DELL EMC ETHERNET SMARTNICINDUSTRY-LEADING ROCEFollowing the Mellanox ConnectX tradition of industry-leading RoCE capabilities, ConnectX-6 Dx adds another layer of innovation to enable more scalable, resilient and easy-to-deploy RoCE solutions.>Zero Touch RoCE – Simplifying RoCE deployments, ConnectX-6 Dx allows RoCEpayloads to run seamlessly on existing networks without requiring special configuration on the network (no PFC, no ECN). New features in ConnectX-6 Dx ensure resiliency and efficiency at scale of such deployments.>Configurable Congestion Control – API to build user-defined congestion controlalgorithms, best serving various environments and RoCE and TCP/IP traffic patterns. BEST IN CLASS PTP FOR TIME SENSITIVE APPLICATIONS Mellanox offers a full IEEE 1588v2 PTP software solution as well as time sensitive related features called 5T45G. Mellanox PTP and 5T45G software solutions are designed to meet the most demanding PTP profiles. ConnectX-6 Dx incorporates an integrated Hardware Clock (PHC) that allows the device to achieve sub-20 usec accuracy while offering various timing related functions, including time-triggered scheduling or time-based SND accelerations (time based ASAP²). Furthermore, 5T45G technology enables software applications to transmit front-haul (ORAN) compatible in high bandwidth. The PTP solution supports slave clock, master clock, and boundary clock.EFFICIENT STORAGE SOLUTIONSWith its NVMe-oF target and initiator offloads, ConnectX-6 Dx brings further optimization to NVMe-oF, enhancing CPU utilization and scalability. Additionally, ConnectX-6 Dx supports hardware offload for ingress/egress of T10-DIF/PI/CRC32/CRC64 signatures. Solutions>Cloud-native, Web 2.0, hyperscale >Enterprise data-centers>Cyber security>Big data analytics>Scale-out compute and storage infrastructure>Telco and Network Function Virtualization (NFV)>Cloud storage>Machine Learning (ML) and Artificial Intelligence (AI)>Media and EntertainmentORDERING INFORMATION1 50G can be supported as either 2x25G NRZ or 1x50G PAM4 when using QSFP56.2 100G can be supported as either 4x25G NRZ or 2x50G PAM4 when using QSFP56. By default, the above products are shipped with a tall bracket mounted;a short bracket is included as an accessory.Learn more at /products/ethernet/connectx-smartnic© 2020 Mellanox Technologies. All rights reserved. NVIDIA, the NVIDIA logo, Mellanox, ConnectX, GPUDirect, Mellanox PeerDirect, and ASAP 2 - Accelerated Switch and Packet Processing are trademarks and/or registered trademarks of Mellanox Technologies Ltd. FEATURES *>IEEE 802.3cd, 50, 100 and 200 Gigabit Ethernet>IEEE 802.3bj, 802.3bm 100 Gigabit Ethernet>IEEE 802.3by, 25, 50 Gigabit Ethernet supporting all FEC modes>IEEE 802.3ba 40 Gigabit Ethernet >IEEE 802.3ae 10 Gigabit Ethernet >IEEE 802.3az Energy Efficient Ethernet (supports only “Fast-Wake” mode)>IEEE 802.3ap based auto-negotiation and KR startup >IEEE 802.3ad, 802.1AX Link Aggregation>IEEE 802.1Q, 802.1P VLAN tags and priority>IEEE 802.1Qaz (ETS) >IEEE 802.1Qbb (PFC) >IEEE 802.1Qbg>25/50 Ethernet Consortium “Low Latency FEC” for50GE/100GE/200GE PAM4 links >PCI Express Gen 3.0 and 4.0STANDARDS *Network Interface>2 x 25/50/100 GbEHost Interface>PCIe Gen 4.0, 3.0, 2.0, 1.1>16.0, 8.0, 5.0, 2.5 GT/s link rate >16 lanes of PCIe> MSI/MSI-X mechanisms >Advanced PCIe capabilitiesVirtualization/Cloud Native>Single Root IOV (SR-IOV) and VirtIO acceleration>Up to 1 K VFs per port >8 PFs>Support for tunneling>Encap/decap of VXLAN, NVGRE, Geneve, and more>Stateless offloads for Overlay tunnelsMellanox ASAP 2> SDN acceleration for:>Bare metal >Virtualization >Containers>Full hardware offload for OVS data plane>Flow update through RTE_Flow or TC_Flower >OpenStack support >Kubernetes support>Rich classification engine (L2 to L4) >Flex-Parser: user defined classification >Hardware offload for:>Connection tracking (L4 firewall) >NAT>Header rewrite >Mirroring >Sampling >Flow aging >Hierarchial QoS>Flow-based statisticsPlatform Security>Hardware root-of-trust >Secure firmware updateStateless Offloads>TCP/UDP/IP stateless offload >LSO, LRO, checksum offload>Receive Side Scaling (RSS) also on encapsulated packet>Transmit Side Scaling (TSS)>VLAN and MPLS tag insertion/stripping >Receive flow steeringAdvanced Timing & Synchronization>Advanced PTP>IEEE 1588v2 (any profile)>PTP Hardware Clock (PHC) (UTC format) >16 nsec accuracy>Line rate hardware timestamp (UTC format) >Time triggered scheduling >PTP based packet pacing>Time based SDN acceleration (ASAP 2) >Time Sensitive Networking (TSN)Storage Accelerations>NVMe over Fabric offloads for target>Storage protocols: iSER, NFSoRDMA, SMB Direct, NVMe-oF, and more >T-10 Dif/Signature HandoverRDMA over Converged Ethernet (RoCE)>RoCE v1/v2>Zero Touch RoCE: no ECN, no PFC >RoCE over overlay networks >Selective repeat>Programmable congestion control interface >GPUDirect ®>Burst buffer offloadManagement and Control>PLDM for Monitor and Control DSP0248 >PLDM for Firmware Update DSP026 >I 2C interface for device control and configurationRemote Boot>Remote boot over Ethernet >Remote boot over iSCSI>UEFI support for x86 and Arm servers >PXE boot* This section describes hardware features and capabilities. Please refer to the driver and firmware release notes for feature availability.。
Siemens.Tecnomatix.Plant.Simulation.v11.1.TR2.Win32_64-ISO 1DVD(工厂设计模拟仿真)

Siemens SIMATIC Protool v6.0 + SP2-ISO 1CD
SIMATIC WinCC v6 用户手册 (中文) 1CD
STEP 7 基础教程
S7-200中文系统手册
西门子仿真软件 PLCSIM v5.3+使用手册 1CD
WinNC Sinumerik 840D & 3D VIEW 2004 1CD
集成了先进的工业产品互连工具,包括DCOM 和 CAN、图形、管理
功能和工业网络访问功能)
CD1= Tornado 2.2.1/VxWorks 5.5.1 for Pentium
Siemens.Digsi.v4.83-ISO 1DVD(保护装置调试)
SIEMENS Drive ES Basic v5.4 SP2 and Drive ES Simatic v5.4 SP1-ISO 1DVD
fort.v5.0.19 1CD(德国西门子公司为其可编程测试单元 Logo! 开发的程序编写软件,
WindRiver.Tornado.v2.2.for.PowerPC-ISO 2CD
WindRiver.Tornado.v2.2.and.VXWorks.v5.5.for.Pentium-ISO 1CD
WindRiver.Tornado.v2.2.for.SuperH-ISO 2CD
· S7-GRAPH v5.3 incl. SP2
· S7-SCL v5.3 incl. SP1
· S7-PLCSIM v5.3 incl. SP1
· Automation License Manager V2.2
Simatic HMI WinCC v7.3 Build 0 Multilanguage 3DVD
动作编辑器操作说明Version2
選擇操作套件
設定小型六足機械獸套件
1 點選左方的小型六足機械獸選框。
2 點選右下方的”OK”按鈕。
小型六足機械獸套件設定啟動伺服機:
2 按下“設定微調值”按鈕。
設定微調值
點選要設定的伺服機位置,再輸入要設定的微調值,按下Enter,就會設定該伺服機的微調值為輸 入值,輸入值必須是在-128到127之間的整數。 點選左箭頭與右箭頭,可以一次減少或增加1的微調值,按住不放 則會自動減少或增加微調值直到放開。
設定完成 後點選“關 閉”按鈕, 就可以離 開設定微 調值視窗。
Innovati, Inc. 2010
注意事項
請先確定電腦已經安裝innoBASIC Workshop 2,且版本為v2.0.0.49或以上,若尚未安裝, 可以連結到/website/down/html/?113.html下載。 電腦需與BC1,BC2,SC16或SC32等,具有BASIC Commander功能之模組,透過 USB線連接,且須確認可以由電腦下載程式至模組,先開啟innoBASIC Workshop才能 啟動動作編輯器。 如果是使用BC1,或BC2等不具備伺服機模組的單板電腦,需要另行透過cmdBUS將伺 服機模組與單板電腦連結,並且要提供伺服機模組運作所需的電源。 伺服機操作所需要的電流量較大,須先確認電源供應器是否能提供足夠的電流給伺服機, 也必須確認伺服機所能承受的電壓,是否與電源提供的電壓值相同。 操作中請勿移除USB連接線,以免造成誤動作,如果伺服機動作不正常,請先關閉伺服 機電源,確認問題排除後再重新操作。 伺服機可能有約一百八十度的轉動(不同伺服機可能會有不同的轉動角度),請不要讓伺 服機轉動時碰到障礙物影響轉動,也不要把手或物品置於轉動範圍內,以免受傷或造成 物品毀損 不同伺服機有不同扭力限制,請不要讓伺服機承受過大的抗力,也不要讓伺服機維持相 同動作太久,以免伺服機受損
Quinte系列控制器商品说明书
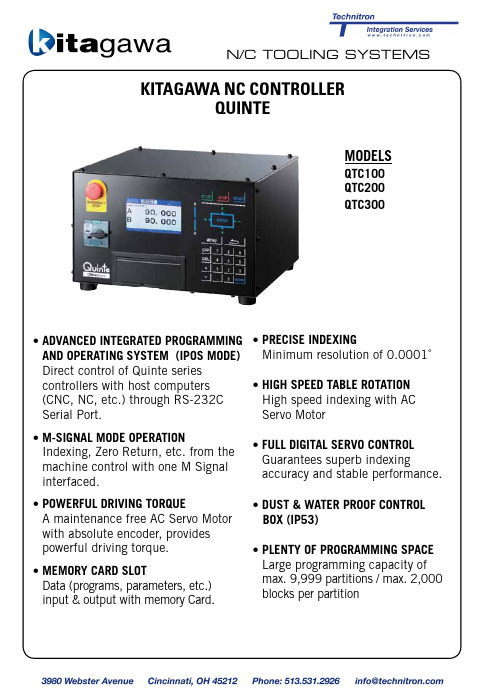
MODELSQTC100QTC200QTC300KITAGAWA NC CONTROLLERQUINTE•ADVANCED INTEGRATED PROGRAMMING AND OPERATING SYSTEM (IPOS MODE)Direct control of Quinte seriescontrollers with host computers(CNC, NC, etc.) through RS-232CSerial Port.•M-SIGNAL MODE OPERATIONIndexing, Zero Return, etc. from the machine control with one M Signal interfaced.•POWERFUL DRIVING TORQUEA maintenance free AC Servo Motor with absolute encoder, provides powerful driving torque.•MEMORY CARD SLOTData (programs, parameters, etc.)input & output with memory Card.•PRECISE INDEXINGMinimum resolution of 0.0001˚•HIGH SPEED TABLE ROTATION High speed indexing with AC Servo Motor •FULL DIGITAL SERVO CONTROL Guarantees superb indexingaccuracy and stable performance.•DUST & WATER PROOF CONTROL BOX (IP53)•PLENTY OF PROGRAMMING SPACE Large programming capacity of max. 9,999 partitions / max. 2,000blocks per partitionITEMName of FunctionDescription of Function1Servo MotorsAC Servo Motor with Absolute Encoder2M - Signal Mode Operation Easy Interface with the Machine Control for M - SignalOperation with One M Code3Minimum Resolution 0.0001 Degrees4Max. Programmable Angle 9,999 Rotations + 360 Degree or ±359.9999 Degrees 5Number of Divisions 0 - 9,9996Program Capacity Max 9,999 Partitions / Max 2,000 Blocks per Partition 7Input Method MDI Keyboard 8Command Method Incremental (G91) / Absolute (G90)9Zero Return *Establishes both Machine and Work Origin 10Manual Feed Rapid, Fine and Step Feed 11Emergency Stop *Stops All Functions 12Feed Hold *Stops Table Rotation Temporarily 13Sub Program Command M98 / M9914Repeat Function Repeats between Programs specified 15Buffer Function Reads One Block Ahead and Operates Continuously 16G Function Dwell, Brake On/Off, etc. (G04 - G92)17Uni-directional Function Positioning from One Direction (CW or CCW) only 18Software Limit Function Setting Value of Software Limit from Machine Origin 19Stop Over-shooting Prevents Over-shooting from the Preset Position20MMC SlotData (Programs, Parameters, Etc.) Input & Output withMemory Card21Alarm No. Display Function Display Alarm Code No. & Description 22Self Diagnosis Function Displaying Current Condition of Controller 23Feed Override 1 - 200%24External Input Signal Start, Emergency Stop, Feed Hold, etc.25External Output Signal One Block Finish, Finish, Alarm Output, etc.26Display TFT Color LCD 480 x 272 Resolution27Power Input AC200-230V , 50/60HzSingle Phase or 3-Phase for Models QTC100 & QTC2003-Phase for Model QTC300KITAGAWA NC CONTROLLERQUINTEFUNCTIONS。
云计算HCIP考试模拟题+参考答案
云计算HCIP考试模拟题+参考答案一、单选题(共52题,每题1分,共52分)1.在 FusionCompute 集群配置中,虚拟机启动策略只有负载均衡启动策略。
A、TRUEB、FALSE正确答案:B2.FusionCompute 添加 FC-SAN 存储资源步骤正确的是?A、配置 FC 网络>在 FusionCompute 上扫描存储设备>配置存储LUN 映射>添加数据存储B、配置 FC 网络>配置存储 LUN 映射>在 FusionCompute 上扫描存储设备>添加数据存储C、配置 FC 网络>在 FusionCompute 上添加 FC-SAN>配C、置存储 LUN 映射>在 FusionCompute 上扫描存储设备>添加数据存储D、配置 FC 网络>配置存储 LUN 映射>在 FusionCompute上添加 FC-SAN>在 FusionCompute 上扫描存储设备>添加数据存储正确答案:D3.全内存虚拟桌面采用内存去重压缩和复用技术,将桌面虚拟机的系统盘全部放到内存中,使得桌面虚拟机的磁盘读写操作,转化为内存操作,大幅提升用户的使用体验。
A、TRUEB、FALSE正确答案:A4.在华为桌面云系统软件部署方案中,多套 FusionAcc ess 使用同一个License 组件时 License 组件如何进行部署?A、和 HDC 合一部署B、和 WI 合一部署C、单独部署D、和 ITA 合一部署正确答案:C5.FusionCompute 分布式虚拟交换机一方面可以对多台服务器的虚拟交换机统配置、管理和监控。
另一方面也可以保证虚拟机在服务器之间迁移时网络配置的一致性。
A、TRUEB、FALSE正确答案:A6.FusionAccess 组件故障进行数据恢复时,需要到备份服务器上选取对应组件的备份文件,备份文件选取的原则是?A、查看相应组件故障告警时间,选择故障时间之后最接近的备份文件进行恢复。
用于桌面和应用虚拟化的SteelCentralAternity

解决方案简介用于桌面和应用虚拟化的SteelCentral Aternity全面可见性确保成功虚拟化业务挑战如果企业无法保持卓越的应用性能,那么桌面和应用虚拟化的优势(例如提高灵活性、运营效率和控制力)也会大打折扣。
企业面临的挑战在于,虚拟化打破了应用、物理硬件、操作系统和表示层之间的原有关系。
如果无法针对最终用户所遇到的应用性能问题获得全面的可见性,VDI 管理员、IT 运营和应用所有者就会缺乏关键的洞察力来有效规划、管理和诊断 Citrix、VMware 或Microsoft 虚拟环境。
Riverbed 解决方案Riverbed®SteelCentral™监控所有封装或自定义应用中所有业务事务的性能,并将其与底层桌面虚拟化的关键性能指标相关联。
使用 SteelCentral Aternity、VDI 架构师、应用所有者和 IT Ops 可以有效地规划桌面和应用虚拟化迁移,并解决跨基础设施各个层面的问题。
WindowsOffice 365胖客户端SaaSOfficeWeb 应用工作效率Java 桌面虚拟化应用虚拟化移动应用消除四个虚拟桌面盲点SteelCentral Aternity 通过消除以下四个主要虚拟桌面盲点来弥合 VDI 可见性差距:客户端延迟、主机资源可用性、应用执行时间和基础架构延迟。
保证通过 VDI 交付的应用的最佳服务质量SteelCentral Aternity 为 IT 运营提供了一种一致的方法,以确保在 VDI 环境中运行的所有应用的服务质量。
• 将应用性能与底层 VDI 基础设施(包括远程显示器、虚拟化层和网络/基础设施)相关联,以隔离问题区域 • 比较各个地域、数据中心和设备的应用的性能,以进行优化• 主动检测事件并按严重程度、受影响的用户和业务地点进行分析,以确定响应优先级通过监控所有应用的最新性能,了解各个位置、部门或地区的应用问题的严重程度和影响,并深入调查以解决最紧迫的问题,从而优先为受影响最大的领域提供问题解决方案。
Linux虚拟机中WMwareTools(按此流程,绝对错不了)
在Linux中安装虚拟机的WMware Tools执行安装WMware Tools,如图:在Linux中新建终端,输入如下命令:[root@localhost vmware-tools-distrib]# ./vmware-install.plCreating a new VMware Tools installer database using the tar4 format. Installing VMware Tools.In which directory do you want to install the binary files?[/usr/bin]What is the directory that contains the init directories (rc0.d/ to rc6.d/)?[/etc/rc.d]What is the directory that contains the init scripts?[/etc/rc.d/init.d]In which directory do you want to install the daemon files?[/usr/sbin]In which directory do you want to install the library files?[/usr/lib/vmware-tools]The path "/usr/lib/vmware-tools" does not exist currently. This program isgoing to create it, including needed parent directories. Is this what you want?[yes]In which directory do you want to install the documentation files? [/usr/share/doc/vmware-tools]The path "/usr/share/doc/vmware-tools" does not exist currently. This programis going to create it, including needed parent directories. Is this what youwant? [yes]The installation of VMware Tools 8.6.0 build-446312 for Linux completed successfully. You can decide to remove this software from your system at anytime by invoking the following command:"/usr/bin/vmware-uninstall-tools.pl".Before running VMware Tools for the first time, you need to configure it byinvoking the following command: "/usr/bin/vmware-config-tools.pl". Do you wantthis program to invoke the command for you now? [yes]Initializing...Making sure services for VMware Tools are stopped.Stopping VMware Tools services in the virtual machine:Guest operating system daemon: [确定]Unmounting HGFS shares: [确定]Guest filesystem driver: [确定][EXPERIMENTAL] The VMware FileSystem Sync Driver (vmsync) is a new feature thatcreates backups of virtual machines. Please refer to the VMware Knowledge Basefor more details on this capability. Do you wish to enable this feature? [no]Found a compatible pre-built module for vmci. Installing it...Found a compatible pre-built module for vsock. Installing it... Found a compatible pre-built module for vmxnet3. Installing it... Found a compatible pre-built module for pvscsi. Installing it... Found a compatible pre-built module for vmmemctl. Installing it...The VMware Host-Guest Filesystem allows for shared folders between the host OSand the guest OS in a Fusion or Workstation virtual environment. Do you wishto enable this feature? [no] noFound a compatible pre-built module for vmxnet. Installing it... Found a compatible pre-built module for vmblock. Installing it... Detected X version 7.1Please choose one of the following display sizes that X will start with:[1] "320x200"[2] "320x240"[3] "400x300"[4] "512x384"[5] "640x400"[6] "640x480"[7] "720x480"[8] "800x480"[9] "854x480"[10] "720x576"[11] "800x600"[12] "1024x768"[13] "1280x720"[14] "1280x768"[15] "1152x864"[16] "1280x800"[17] "1366x768"[18] "1280x960"[19] "1440x900"[20] "1280x1024"[21] "1400x1050"[22] "1680x1050"[23] "1600x1200"[24] "1920x1080"[25] "1920x1200"[26] "1920x1440"[27] "2048x1536"[28] "2560x1600"[29] "2560x1920"Please enter a number between 1 and 29:[3] 12X Window System Version 7.1.1Release Date: 12 May 2006X Protocol Version 11, Revision 0, Release 7.1.1Build Operating System: Linux 2.6.9-34.ELsmp x86_64 Red Hat, Inc. Current Operating System: Linux localhost.localdomain 2.6.18-8.el5 #1 SMP Fri Jan 26 14:15:14 EST 2007 x86_64Build Date: 09 January 2007Build ID: xorg-x11-server 1.1.1-48.13.el5Before reporting problems, check to make sure that you have the latest version.Module Loader presentMarkers: (--) probed, (**) from config file, (==) default setting,(++) from command line, (!!) notice, (II) informational,(WW) warning, (EE) error, (NI) not implemented, (??) unknown. (++) Log file: "/tmp/vmware-config0/XF86ConfigLog.14063", Time: Thu Aug 23 22:32:56 2012(++) Using config file: "/tmp/vmware-config0/XF86Config.14063"(EE) Failed to load module "vmwgfx" (module does not exist, 0)(EE) vmware: Please ignore the above warnings about not being able to to load module/driver vmwgfx(EE) AIGLX: Screen 0 is not DRI capableX is running fine with the new config file.FreeFontPath: FPE "unix/:7100" refcount is 2, should be 1; fixing. Creating a new initrd boot image for the kernel.Checking acpi hot plug [确定] Starting VMware Tools services in the virtual machine:Switching to guest configuration: [确定]Paravirtual SCSI module: [确定]Guest memory manager: [确定]Guest vmxnet fast network device: [确定]VM communication interface: [确定]VM communication interface socket family: [确定]File system sync driver: [确定]Guest operating system daemon: [确定]The configuration of VMware Tools 8.6.0 build-446312 for Linux for this runningkernel completed successfully.You must restart your X session before any mouse or graphics changes take effect.You can now run VMware Tools by invoking "/usr/bin/vmware-toolbox-cmd" from thecommand line or by invoking "/usr/bin/vmware-toolbox" from the command lineduring an X server session.To enable advanced X features (e.g., guest resolution fit, drag and drop, andfile and text copy/paste), you will need to do one (or more) of the following:1. Manually start /usr/bin/vmware-user2. Log out and log back into your desktop session; and,3. Restart your X session.To use the vmxnet driver, restart networking using the following commands: /etc/init.d/network stoprmmod vmxnetmodprobe vmxnet/etc/init.d/network startEnjoy,--the VMware team说明:1、在输入命令的时候,文件名可以用TAB键盘补全,比如:要输入VWwareTools,只要输入VM然后按TAB键即可。
- 1、下载文档前请自行甄别文档内容的完整性,平台不提供额外的编辑、内容补充、找答案等附加服务。
- 2、"仅部分预览"的文档,不可在线预览部分如存在完整性等问题,可反馈申请退款(可完整预览的文档不适用该条件!)。
- 3、如文档侵犯您的权益,请联系客服反馈,我们会尽快为您处理(人工客服工作时间:9:00-18:30)。
STANDARD OPERATING PROCEDURES
CINCINNATI VMC
SET-UP AND OPERATING PROCEDURE
A. START-UP PROCEDURES AND ALIGNMEMT
1. Turn the machines main breaker on.
2. Turn on the main power located on the back of the VMC.
3. Turn on the main screen, green button .
4. Wait for program to load, hit power again, green button .
5. When program load is complete, alignment is required.
6.
machine axis are fully aligned. The red light will come on the F1
button.
7.
•
Push one time; look at the bottom of the monitor screen.
•
• 8. If the drum is at a different pocket, switch to mechanism jog on hand
held pendant.
• #1.
• Repeat mechanism alignment.
9. When you have completed the above steps, the monitor will read (ALIGNMENT COMPLETE). 10. W arm up machine axis and spindle. Run start up program. Ensure you
select a set-up number with X, Y, Z values all equal to zero.
B. PROGRAM SET UP
1. Prior to beginning production ensure you have work order & parts.
2. Go to PROGRAMS and download the required program.
3. Check the tool manager for the proper tool information. Ensure tool
length, spindle speed max, feed max and number of teeth is correct.
4. Obtain the correct fixture. Using the locator holes, fasten the fixture
down. Use the laminated drawing to ensure you have orientated the
“0” position of the fixture properly. Ensure you have read comments in
programs for job specific information.
5. Make sure you know what locator hole number on the sub plate is
being used for your program zero position. These are your X; Y offset
values for your VMC fixture.
PENDANT
Choosing Multi Set UP Off Sets:
SET UP
SET UP
SEL
MORE § Find set up number that corresponds to the
sub plate number which the fixture “O”
location
is installed in.
Note: X-Y-Z offset must be set when not using the locator holes or VMC fixture jigs.
6. Set “Z” zero.
•Load tool from drum. Ensure all tool info is correct. Manually bring tool down to touch part. In MDI screen type G92.1Z0.0…press cycle start.
7. Run program ensuring rapid override control is depressed. Single block and/ or single loop MUST be used. Feed pot must be set at 0% when cycle is started. Adjust feed pot to initiate axis movement. But remain in control of speed, with the feed pot. Watch Z values on CRT or pendant to ensure tool does not strike work piece. If correct, allow tool to position to R plane. If drilling holes, it is mandatory to run program on single loop to ensure sufficient tool clearance at all positions on the jig. Do not depress Z repeat until you have completed this. (Note the use of a single loop will only work in a canned cycle. Should the program you are running not contain such… then the use of single block is mandatory.)
8. Run program again, this time drilling part. Ensure rapid override is still maintained and that you have control of feed pot.
9. Repeat steps 7&8 until you are satisfied with program operation AND repeat steps7&8 should you modify the program in any way during the course of running it.
10. A t this point the program and your set up have been confirmed. Depress rapid override again to turn it off and proceed with production.
C. SHUTDOWN PROCEDURES
1. Clean the machine out and wipe the surfaces off. (Interior & exterior).
Ensure area around machine is clear and spilled coolant is absorbed.
2. Make sure the tool in the spindle is put back in the drum, and the drum
position is at pocket #1. M30 to put tool away. T1 to park tool @
spindle.
3. Move the table to home position & then off of limits x, y, z an “A” if 4th
axis is installed.
4. Make sure the conveyor is shut off and the door is closed.
5. Push the emergency stop button and shut the monitor off. Wait while
the machine saves the data until the screen goes dark, before shutting
off the main power.
6. On the back of the machine, shut off the main power.
7. Turn the main breaker off.。
