loadrunner问题集锦20140225
loadrunner常见问题及解决方法

loadrunner常见问题及解决⽅法loadrunner常见问题1..关于loadrunner11录制脚本时IE打不开问1、ie浏览器去掉启⽤第三⽅浏览器扩展2、loadrunner11 键盘F4,在browser Emulation点击change,在弹出的提⽰框中Browser version 选择8.0,platform. 选择windows73、loadrunner11 键盘ctrl+F7在弹出的提⽰框中选择最后⼀项Correlation,将Enable correlation during recording 下⾯的勾全去掉,有需要的再勾4、退出杀毒软件(⾦⼭啊360啊什么的都退了)5、退出迅雷软件6、计算机——属性——⾼级系统设置——性能⾥的设置——数据执⾏保护——选择“为除下列选定程序之外的所有程序和服务启⽤”——添加IE浏览器——应⽤——确定1.2.controlle打开失败:controller⼀添加完脚本就崩溃了,报错:试读执⾏系统不⽀持的操作;Runtime error!c:\ProgramFiles\hp\LoadRunner\bin\Wlrun.exe abnormal program termination。
解决⽅案:1.E:\Program Files (x86)\HP\LoadRunner\bin⽂件下将wlrun.exe⽂件删除,2.进⼊“我的电脑”下---控制⾯板\卸载或更改程序中---右击HP Loadrunner修复。
1.3.设置并发数:User generator tools—create controller scenario—number of vusers1.4.Loadrunner11安装:1. 安装完成后,退出loadrunner2. 把下载的lm70.dll,mlr5lprg.dll 拷贝到../HP/Loadrunner/bin覆盖掉原来的3. 使⽤注册表删除⼯具,点击deletelicense.exe 删除注册表信息4. 再次打开loadrunner, configuration->loadrunner license->new license,在弹出的输⼊框中输⼊license序列号100 vuser: AEAMAUIK-YAFEKEKJJKEEA-BCJGI10000 vuser: AEABEXFR-YTIEKEKJJMFKEKEKWBRAUNQJU-KBYGB超级license,⽀持6.5w个并发: AEACFSJI-YJKJKJJKEJIJD-BCLBR破解⽅⾯的东西⽹上多如⽜⽑,就不再说了。
Load Runner常见问题

Load Runner常见问题----翁春芳在刚开始学习使用loadrunner进行性能测试时,经常碰到一些问题,比如录制脚本经常遇到不能打开浏览器的情况,到了后期对测试结果又经常不明白是什么原因导致失误失败,于是就自己上网查寻找些解决方法并记录下来,留以后备用也供大家参考。
其中有些问题和是我现在还没碰到的,不过若将来更深一步学习和使用lr,应该也会有用。
就一并记录下来。
1、LoadRunner录制脚本时为什么不会弹出IE浏览器?当一台主机上安装多个浏览器时,LoadRunner录制脚本经常遇到不能打开浏览器的情况,可以启动浏览器,打开Internet选项对话框,切换到高级标签,去掉“启用第三方浏览器扩展(需要重启动)”的勾选,然后再次运行VuGen即可解决问题。
提示:通常安装Firefox等浏览器后,都会勾选上面得选项,导致不能正常录制。
因此建议运行LoadRunner得主机上保持一个干净的测试环境。
2、录制Web脚本时,生成的脚本中存在乱码该如何解决?录制脚本前,打开录制选项配置对话框Record-Options,进入到Advanced标签,先勾选“Support charset”,然后选择中支持UTF-8。
再次录制,就不会出现中文乱码问题了。
3、回放乱码,IE访问页面一切正常,但是LR回放时在run viewer中显示的页面为乱码?这一问题一般是由于页面保存时的编码格式和页面中的charset格式不一致引起的(html头中通常会有<meta http-equiv="Content-Type" c>)。
遇到这类问题,只需要将页面做另存为,将保存的编码格式和页面中的charset格式统一起来就可以了。
引起问题的原因是:IE浏览器解码时会优先考虑文件的保存编码格式,而后考虑页面中的charset格式,(正常情况下两者是一致的),而run viewer是直接使用页面中的charset 格式打开的。
LoadRunner常见问题分析及解决办法

LoadRunner常见问题分析及解决办法2010-09-23 08:02在运行脚本回放过程中,有时会出现错误,这在实际测试中是不可避免的,毕竟自动录制生成的脚本难免会有问题,需要运行脚本进行验证,把问题都解决后才加入到场景中进行负载测试。
下面结合常用的协议(如Web、Web Services协议)录制的脚本进行回放时出现的问题介绍一下解决的方法。
需要注意的是,回放脚本时出现的错误有时是程序自身的原因导致的,因此在解决脚本回放问题前必须保证程序录制出的脚本是正确的。
1.LoadRunner超时错误:在录制Web协议脚本回放时超时情况经常出现,产生错误的原因也有很多,解决的方法也不同。
错误现象1:Action.c(16): Error -27728: Step download timeout (120 seconds) has expired when downloading non-resource(s)。
错误分析:对于HTTP协议,默认的超时时间是120秒(可以在LoadRunner 中修改),客户端发送一个请求到服务器端,如果超过120秒服务器端还没有返回结果,则出现超时错误。
解决办法:首先在运行环境中对超时进行设置,默认的超时时间可以设置长一些,再设置多次迭代运行,如果还有超时现象,需要在“Runtime Setting”>“Internet Protocol:Preferences”>“Advanced”区域中设置一个“winlnet replay instead of sockets”选项,再回放是否成功。
错误现象 2:Action.c(81):Continuing after Error -27498: Timed out while processingURL=http://172.18.20.70:7001/workflow/bjtel/leasedline/ querystat/ subOrderQuery.do错误分析:这种错误常常是因为并发压力过大,服务器端太繁忙,无法及时响应客户端的请求而造成的,所以这个错误是正常现象,是压力过大造成的。
loadrunner常见问题及解决方法
loadrunner常见问题1..关于loadrunner11录制脚本时IE打不开问1、ie浏览器去掉启用第三方浏览器扩展2、loadrunner11 键盘F4,在browser Emulation点击change,在弹出的提示框中Browser version 选择8.0,platform. 选择windows73、loadrunner11 键盘ctrl+F7在弹出的提示框中选择最后一项Correlation,将Enable correlation during recording 下面的勾全去掉,有需要的再勾4、退出杀毒软件(金山啊360啊什么的都退了)5、退出迅雷软件6、计算机——属性——高级系统设置——性能里的设置——数据执行保护——选择“为除下列选定程序之外的所有程序和服务启用”——添加IE浏览器——应用——确定1.2.controlle打开失败:controller一添加完脚本就崩溃了,报错:试读执行系统不支持的操作;Runtime error!c:\Program Files\hp\LoadRunner\bin\Wlrun.exe abnormal program termination。
解决方案:1.E:\Program Files (x86)\HP\LoadRunner\bin文件下将wlrun.exe文件删除,2.进入“我的电脑”下---控制面板\卸载或更改程序中---右击HP Loadrunner修复。
1.3.设置并发数:User generator tools—create controller scenario—number of vusers1.4.Loadrunner11安装:1. 安装完成后,退出loadrunner2. 把下载的lm70.dll,mlr5lprg.dll 拷贝到../HP/Loadrunner/bin覆盖掉原来的3. 使用注册表删除工具,点击deletelicense.exe 删除注册表信息4. 再次打开loadrunner, configuration->loadrunner license->new license,在弹出的输入框中输入license序列号100 vuser: AEAMAUIK-YAFEKEKJJKEEA-BCJGI10000 vuser: AEABEXFR-YTIEKEKJJMFKEKEKWBRAUNQJU-KBYGB超级license,支持6.5w个并发: AEACFSJI-YJKJKJJKEJIJD-BCLBR破解方面的东西网上多如牛毛,就不再说了。
loadrunner问题
1、loadrunner controller 无法创建vuser确保您的load generator可用且脚本可用,但是单独跑脚本及迭代都没有问题~解决方法:在LoadRunner9中,Quantity这个Vusers参数必须在脚本录制的User Generator 中设置,在菜单Tools->Create Control Scenario中设置LoadRunner Controller ——>Tool——>User Generator——>Tools——>Create Control Scenario1.lr agent 不启动。
解决:开始-Lr-tools-lr-agent run-time setting进行设置。
2.提示:Loadrunner Controller cannot create Vusers.Ensure that your load generators are available and that your scrīpt are valid。
解决:打开:Virtual User Generator -tools - Create Controller Scenario 将Load Generator 设置为localhost 就可以了。
----其实本来Vuser G里就默认的是localhost了。
出现此情况的原因可能是因为脚本是从别的机器拷过来的,不是本地创建的。
如果直接在controller中加载,则会没法创建用户。
解决办法:如上。
然后由vuser 里直接create controller 就是在vuser脚本制作这边加载controller.而不是直接打开controller,再加载脚本。
loadrunner常见问题汇总
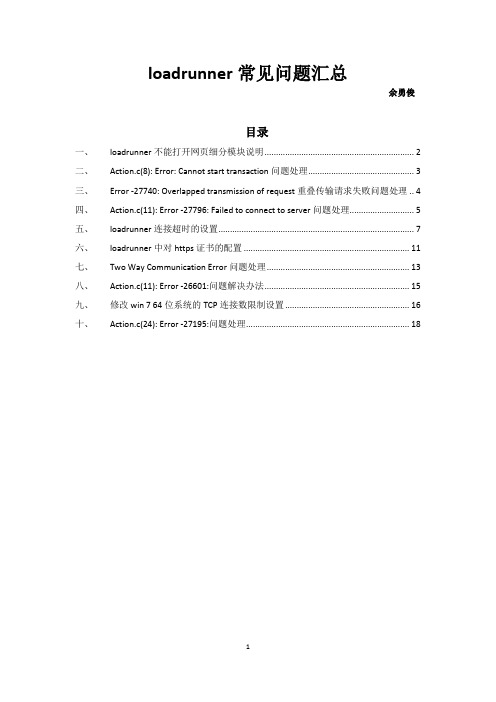
loadrunner常见问题汇总余勇俊目录一、loadrunner不能打开网页细分模块说明 (2)二、Action.c(8): Error: Cannot start transaction问题处理 (3)三、Error -27740: Overlapped transmission of request重叠传输请求失败问题处理 .. 4四、Action.c(11): Error -27796: Failed to connect to server问题处理 (5)五、loadrunner连接超时的设置 (7)六、loadrunner中对https证书的配置 (11)七、Two Way Communication Error问题处理 (13)八、Action.c(11): Error -26601:问题解决办法 (15)九、修改win 7 64位系统的TCP连接数限制设置 (16)十、Action.c(24): Error -27195:问题处理 (18)一、loadrunner不能打开网页细分模块说明loadrunner不能打开网页细分模块的原因是:loadrunner的汉化安装包问题导致。
解决办法:下载loadrunner11.0官方英文版安装包和破解包。
测试场景中配置如下:二、Action.c(8): Error: Cannot start transaction问题处理出现这个错误的原因,是脚本的开始和结束语句的字符没统一造成的。
Action.c(8): Error: Cannot start transaction "点击1K静态页". This Vuser already started a transaction with the same name, and has not yet processed the corresponding lr_end_transaction statement.Action.c(8): Error: Cannot start transaction "点击1K静态页". This Vuser already started a transaction with the same name, and has not yet processed the correspondinglr_end_transaction statement.开始和结束事务的脚本语句中的括号内的字符要统一,大小写要一致,否则会报错。
LoadRunner常见问题汇总

LoadRunner11压力测试时遇到问题及解决办法时间:2014-08-14 00:08来源:知行网 编辑:麦田守望者1、LoadRunner超时错误:在录制Web服务器端,如果超过120秒服务器协议脚本回放时超时情况经常出现,产生错误的原因也有很多,解决的方法也不同。
错误现象1:Action.c(16): Error -27728: Step download timeout (120 seconds) has expired when downloading non-resource(s)。
错误分析:对于HTTP协议,默认的超时时间是120秒(可以在LoadRunner中修改),客户端发送一个请求到端还没有返回结果,则出现超时错误。
解决办法:首先在运行环境中对超时进行设置,默认的超时时间可以设置长一些,再设置多次迭代运行,如果还有超时现象,需要在“RuntimeSetting”>“Internet Proto col:Preferences”>“Advanced”区域中设置一个“winlnet replay instead of sockets”选项,再回放是否成功。
2.LoadRunner脚本中出现乱码:在录制Web协议脚本时出现中文乱码,在回放脚本时会使回放停止在乱码位置,脚本无法运行。
错误现象:某个链接或者图片名称为中文乱码,脚本运行无法通过。
错误分析:脚本录制可能采用的是URL-based script方式,如果程序定义的字符集合采用的是国际标准,脚本就会出现乱码现象。
解决办法:重新录制脚本,在录制脚本前,打开录制选项配置对话框进行设置,在“Recording Options”的“Advanced”选项里先将“Surport Charset”选中,然后选中支持“UTF-8”的选项。
3.LoadRunner HTTP服务器状态代码:在录制Web协议脚本回放脚本的过程中,会出现HTTP服务器状态代码,例如常见的页面-404错误提示、-500错误提示。
loadrunner面试题
loadrunner面试题在软件测试行业中,LoadRunner是一个广泛使用的性能测试工具。
对于那些希望在这个领域找到工作的人来说,熟悉LoadRunner并且能够回答相关面试题是非常重要的。
本文将介绍一些常见的LoadRunner 面试题,帮助读者准备好应对这些考核。
一、什么是LoadRunner,以及它的组成部分是什么?LoadRunner是一款功能强大的性能测试工具,由Hewlett-Packard (惠普)公司开发。
它主要用于模拟真实用户的负载,并监测系统的性能表现。
LoadRunner由以下几个核心组件组成:1. Virtual User Generator(VUGen):用于录制和回放用户的脚本。
2. Controller:用于创建负载测试场景、控制并发用户数以及监测系统性能。
3. Load Generator:用于模拟并发用户的行为,产生负载。
4. Analysis:用于分析负载测试结果,并生成相应的图表和报告。
二、请描述VuGen的工作原理。
VuGen是LoadRunner用于录制和回放用户脚本的工具。
它可以记录用户与应用程序的交互,并将这些交互保存为脚本。
当脚本被回放时,VuGen将发送与原始交互相同的请求,以模拟真实用户的操作。
VuGen的工作原理如下:1. 创建新的脚本:在录制过程中,VuGen将会话记录保存到脚本中。
2. 自动记录:VuGen可以自动记录用户与应用程序的交互。
用户只需打开Web浏览器,然后使用VuGen开始录制。
3. 回放脚本:VuGen将以与录制过程相同的方式回放用户脚本,并发送相应的请求。
4. 参数化:对于需要在每次回放时使用不同值的参数,VuGen可以自动参数化。
例如,可以将用户名和密码参数化,以便每次回放时使用不同的值。
5. 调试和修复:VuGen提供了调试和修复脚本的功能,以确保脚本在回放过程中正常工作。
三、请解释什么是负载测试?负载测试是一种用于评估系统在不同负载下的性能和稳定性的测试方法。
LoadRunner性能测试问题集锦
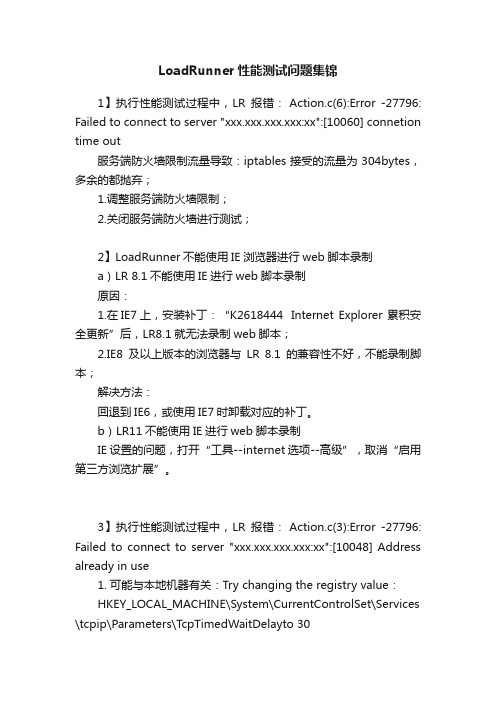
LoadRunner性能测试问题集锦1】执行性能测试过程中,LR报错: Action.c(6):Error -27796: Failed to connect to server "xxx.xxx.xxx.xxx:xx":[10060] connetion time out服务端防火墙限制流量导致:iptables接受的流量为304bytes,多余的都抛弃;1.调整服务端防火墙限制;2.关闭服务端防火墙进行测试;2】LoadRunner不能使用IE浏览器进行web脚本录制a)LR 8.1不能使用IE进行web脚本录制原因:1.在IE7上,安装补丁:“K2618444Internet Explorer 累积安全更新”后,LR8.1就无法录制web脚本;2.IE8及以上版本的浏览器与LR 8.1的兼容性不好,不能录制脚本;解决方法:回退到IE6,或使用IE7时卸载对应的补丁。
b)LR11不能使用IE进行web脚本录制IE设置的问题,打开“工具--internet选项--高级”,取消“启用第三方浏览扩展”。
3】执行性能测试过程中,LR报错: Action.c(3):Error -27796: Failed to connect to server "xxx.xxx.xxx.xxx:xx":[10048] Address already in use1. 可能与本地机器有关:Try changing the registry value:HKEY_LOCAL_MACHINE\System\CurrentControlSet\Services \tcpip\Parameters\TcpTimedWaitDelayto 30andHKEY_LOCAL_MACHINE\System\CurrentControlSet\Serv ices\tcpip\Parameters\MaxUserPortto 65534and rebooting the machine;2.可能与服务器链接数有关:a)查看服务器最大连接数(linux):ulimit -n;如果连接数不够(默认为1024),修改:vim /etc/security/limits.conf增加以下配置:* soft noproc 65536* hard noproc 65536* soft nofile 65536* hardnofile 65536保存退出后,退出客户端使之生效。
常见LoadRunner问题整理
LoadRunner常见问题整理1.LoadRunner录制脚本时为什么不弹出IE浏览器?当一台主机上安装多个浏览器时,LoadRunner录制脚本经常遇到不能打开浏览器的情况,可以用下面的方法来解决。
启动浏览器,打开Internet选项对话框,切换到高级标签,去掉“启用第三方浏览器扩展(需要重启动)”的勾选,然后再次运行VuGen即可解决问题提示:通常安装Firefox等浏览器后,都会勾选上面得选项,导致不能正常录制。
因此建议运行LoadRunner得主机上保持一个干净的测试环境。
2.录制Web脚本时,生成的脚本中存在乱码该如何解决?录制脚本前,打开录制选项配置对话框Record-Options,进入到Advanced标签,先勾选“Support charset”,然后选择中支持UTF-8。
再次录制,就不会出现中文乱码问题了。
3.HTML-based script与URL-based script的脚本有什么区别?使用“HTML-based script”的模式录制脚本,VuGen为用户的每个HTML操作生成单独的步骤,这种脚本看上去比较直观;使用“URL-based script”模式录制脚本时,VuGen可以捕获所有作为用户操作结果而发送到服务器的HTTP请求,然后为用户的每个请求分别生成对应方法。
通常,基于浏览器的Web应用会使用“HTML-based script”模式来录制脚本;而没有基于浏览器的Web应用、Web应用中包含了与服务器进行交互的Java Applet、基于浏览器的应用中包含了向服务器进行通信的JavaScript/VBScript代码、基于浏览器的应用中使用了HTTPS安全协议,这时使用“URL-based script”模式进行录制。
4.为什么脚本中添加了检查方法Web-find,但是脚本回放时却没有执行?由于检查点功能会耗费一定的资源,因此LoadRunner默认关闭了对文本及图像的检查。
loadrunner工具公司面试题
1.如何设置才能让集合点只对一半的用户生效?设置controller--scenario--rendezvous--policy中,设置数值即可。
(此处有3个策略,前2个用百分比,分别对应于全部用户和正运行用户;后一个是填写具体的用户数)2.LoadRunner的组件是什么?分别有什么作用?组件有4个:Vugen:录制、编写脚本Controller:导入待测试脚本,对脚本的压力等进行配置Aylsis:生成测试总结报告Load agent:压力生成器,为脚本生成虚拟用户产生压力3.如果你脚本运行过程中出现错误,你该怎么做?分析是脚本本身的错误还是controller的设置出错,如果是脚本本身错误,则需要到vugen 里面去重新调试脚本;如果是设置错误,则需要对不同的错误提示进行分别处理。
4.现有一个参数列数表,数据如下:A、B、C、D、E,现在这个脚本迭代3次(每次运行脚本都只会取一次值),有3用户在运行,他们的输出结果如下:Vuser1:ABCVuser2:DEDVuser3:无输出,脚本报错;如何实现?脚本迭代3次,5.HTML-Based scrīpt 和URL-Based scrīpt 录制的区别?HTML-Based scrīpt:是基于用户行为模拟的录制,录制是以HTML操作为录制级别,不是HTML操作部进行录制,录制出的内容会将用户的一次操作都包括在内。
HTML-Based scrīpt:是基于URL的录制模式,每个HTTP请求都会形成一个web_url函数。
6.某个脚本单次运行时间约为5分钟(包括think time),脚本设置循环10次,那么在场景中用该脚本创建一个场景,执行时间分别选择执行30分钟和选择run until complete,执行结果分别是怎么样的(分别说明两种情况脚本执行次数)执行30分钟:时间到30分钟后脚本就会停止,执行次数6次;执行选择run until complete:时间到30分钟后脚本就会停止,执行次数6次;7.场景有几种类型,一般在什么情况下用?2种场景:目标场景和一般手工场景目标场景:对系统的性能指标有具体的参数要求时,进行验证使用手工场景:进行一般脚本模拟分析使用,主要测试系统的性能并定位系统瓶颈时使用8.当你的电脑环境有多个IE版本时,如何实现使用你指定的IE版本?在此处指定要使用的IE版本9.Controller中的run time setting和Vugen中单个脚本的run time setting有什么区别Controller中的run time setting是默认使用vugen中的run time setting的设置的,但是在每次进行重新导入脚本后就需要进行重新设置Controller中的run time setting。
45 个 LoadRunner 面试问题(附答案)

45 个LoadRunner 面试问题(附答案)1.What is load testing? - Load testing is to test that if the application works fine withthe loads that result from large number of simultaneous users, transactions and todetermine weather it can handle peak usage periods.2.What is Performance testing? - Timing for both read and update transactionsshould be gathered to determine whether system functions are being performed in an acceptable timeframe. This should be done standalone and then in a multi userenvironment to determine the effect of multiple transactions on the timing of a single transaction.3.Did u use LoadRunner? What version? - Yes. Version 7.2.4.Explain the Load testing process? -Step 1: Planning the test. Here, we develop a clearly defined test plan to ensure the test scenarios we develop will accomplish load-testing objectives. Step 2: Creating Vusers. Here, we create Vuser scripts that contain tasks performed by each Vuser, tasks performed by Vusers as a whole, and tasks measured as transactions. Step 3: Creating the scenario. A scenario describes the events that occur during a testing session. It includes a list of machines, scripts, and Vusers that run during the scenario.We create scenarios using LoadRunner Controller. We can create manual scenarios as well as goal-oriented scenarios. In manual scenarios, we define the number of Vusers, the load generator machines, and percentage of Vusers to be assigned to each script.For web tests, we may create a goal-oriented scenario where we define the goal that our test has to achieve. LoadRunner automatically builds a scenario for us. Step 4: Running the scenario.We emulate load on the server by instructing multiple Vusers to perform taskssimultaneously. Before the testing, we set the scenario configuration and scheduling.We can run the entire scenario, Vuser groups, or individual Vusers. Step 5:Monitoring the scenario.We monitor scenario execution using the LoadRunner online runtime, transaction,system resource, Web resource, Web server resource, Web application server resource, database server resource, network delay, streaming media resource, firewall server resource, ERP server resource, and Java performance monitors. Step 6: Analyzing test results. During scenario execution, LoadRunner records the performance of the application under different loads. We use Loa dRunner‟s graphs and reports to analyze the application‟s performance.5.When do you do load and performance Testing? - We perform load testing oncewe are done with interface (GUI) testing. Modern system architectures are large and complex. Whereas single user testing primarily on functionality and user interface of a system component, application testing focuses on performance and reliability of an entire system. For example, a typical application-testing scenario might depict 1000 users logging in simultaneously to a system. This gives rise to issues such as what is the response time of the system, does it crash, will it go with different softwareapplications and platforms, can it hold so many hundreds and thousands of users, etc.This is when we set do load and performance testing.6.What are the components of LoadRunner? - The components of LoadRunner areThe Virtual User Generator, Controller, and the Agent process, LoadRunner Analysis and Monitoring, LoadRunner Books Online.7.What Component of LoadRunner would you use to record a Script? - The VirtualUser Generator (VuGen) component is used to record a script. It enables you todevelop Vuser scripts for a variety of application types and communication protocols.8.What Component of LoadRunner would you use to play Back the script inmulti user mode? - The Controller component is used to playback the script inmulti-user mode. This is done during a scenario run where a vuser script is executed bya number of vusers in a group.9.What is a rendezvous point? - You insert rendezvous pointsinto Vuser scripts toemulate heavy user load on the server. Rendezvous pointsinstruct Vusers to wait during test execution for multiple Vusers to arrive at a certain point, in order that they may simultaneously perform a task. For example, to emulate peak load on the bank server, you can insert a rendezvous point instructing 100 Vusers to deposit cash into their accounts at the same time.10.What is a scenario? - A scenario defines the events that occur during each testingsession. For example, a scenario defines and controls the number of users to emulate, the actions to be performed, and the machines on which the virtual users run their emulations.11.Explain the recording mode for web Vuser script? - We use VuGen to develop aVuser script by recording a user performing typical business processes on a client application. VuGen creates the script by recording the activity between the client and the server. For example, in web based applications, VuGen monitors the client end of the database and traces all the requests sent to, and received from, the database server. We use VuGen to: Monitor the communication between the application and the server; Generate the required function calls; and Insert the generated function calls into a Vuser script.12.Why do you create parameters? - Parameters are like script variables. They areused to vary input to the server and to emulate real users. Different sets of data are sent to the server each time the script is run. Better simulate the usage model for more accurate testing from the Controller; one script can emulate many different users on the system.13.What is correlation? Explain the difference between automatic correlationand manual correlation? - Correlation is used to obtain data which are unique for each run of the script and which are generated by nested queries. Correlation provides the value to avoid errors arising out of duplicate values and also optimizing the code (to avoid nested queries). Automatic correlation is where we set some rules for correlation.It can be application server specific. Here values are replaced by data which arecreated by these rules. In manual correlation, the value we want to correlate is scanned and create correlation is used to correlate.14.How do you find out where correlation is required? Give few examples fromyour projects? - Two ways:First we can scan for correlations, and see the list of values which can becorrelated. From this we can pick a value to be correlated. Secondly,we can record two scripts and compare them. We can look up the difference file to see for the values which needed to be correlated. In my project, there was a unique id developed for each customer, it was nothing but Insurance Number, it was generated automatically and it was sequential and this value was unique. I had to correlate this value, in order to avoid errors while running my script. I did using scan for correlation.15.Where do you set automatic correlation options? - Automatic correlation fromweb point of view can be set in recording options and correlation tab. Here we can enable correlation for the entire script and choose either issue online messages or offline actions, where we can define rules for that correlation. Automatic correlation for database can be done using show output window and scan for correlation and picking the correlate query tab and choose which query value we want to correlate. If we know the specific value to be correlated, we just do create correlation for the value and specify how the value to be created.16.What is a function to capture dynamic values in the web Vuser script? -Web_reg_save_param function saves dynamic data information to a parameter.17.When do you disable log in Virtual User Generator, When do you choosestandard and extended logs? - Once we debug our script and verify that it isfunctional, we can enable logging for errors only. When we add a script to a scenario, logging is automatically disabled.Standard Log Option:When you selectStandard log, it creates a standard log of functions and messages sent during script execution to use for debugging. Disable this option for large load testing scenarios.When you copy a script to a scenario, logging is automatically disabledExtended Log Option: Selectextended log to create an extended log, including warnings and other messages.Disable this option for large load testing scenarios. When you copy a script to a scenario, logging is automatically disabled. We can specify which additional information should be added to the extended log using the Extended log options.18.How do you debug a LoadRunner script? - VuGen contains two options to helpdebug Vuser scripts-the Run Step by Step command and breakpoints. The Debug settings in the Options dialog box allow us to determine the extent of the trace to be performed during scenario execution. The debug information is written to the Output window. We can manually set the message class within your script using thelr_set_debug_message function. This is useful if we want to receive debug information about a small section of the script only.19.How do you write user defined functions in LR? Give me few functions youwrote in your previous project? - Before we create the User Defined functions we need to create the externallibrary (DLL) with the function. We add this library to VuGen bin directory. Once the library is added then we assign user defined function as a parameter. The function should have the following format: __declspec (dllexport) char* <functionname>(char*, char*)Examples of user defined functions are as follows:GetVersion, GetCurrentTime, GetPltform are some of the user defined functions used in my earlier project.20.What are the changes you can make in run-time settings? - The Run TimeSettings that we make are: a) Pacing - It has iteration count. b) Log - Under this we have Disable Logging Standard Log and c) ExtendedThink Time - In think time we have two options like Ignore think time and Replay think time. d) General - Under general tab we can set the vusers as process or as multithreading and whether each step as a transaction.21.Where do you set Iteration for Vuser testing? - We set Iterations in the Run TimeSettings of the VuGen. The navigation for this is Run time settings, Pacing tab, set number of iterations.22.How do you perform functional testing under load? - Functionality under load canbe tested by running several Vusers concurrently. By increasing the amount of Vusers, we can determine how much load the server can sustain.23.What is Ramp up? How do you set this? - This option is used to gradually increasethe amount of Vusers/load on the server. An initial value is set and a value to wait between intervals can bespecified. To set Ramp Up, go to …Scenario Scheduling Options‟24.What is the advantage of running the Vuser as thread? - VuGen provides thefacility to use multithreading. This enables more Vusers to be run pergenerator. If the Vuser is run as a process, the same driver program is loaded into memory for each Vuser, thus taking up a large amount of memory. This limits the number of Vusers that can be run on a singlegenerator. If the Vuser is run as a thread, only one instance of the driver program is loaded into memory for the given number ofVusers (say 100). Each thread shares the memory of the parent driver program, thus enabling more Vusers to be run per generator.25.If you want to stop the execution of your script on error, how do you do that?- The lr_abort function aborts the execution of a Vuser script. It instructs the Vuser to stop executing the Actions section, execute the vuser_end section and end theexecution. This function is useful when you need to manually abort a script execution as a result of a specific error condition. When you end a script using this function, the Vuser is assigned the status "Stopped". For this to take effect, we have to first uncheck the “Continue on error” option in Run-Time Settings.26.What is the relation between Response Time and Throughput? - TheThroughput graph shows the amount of data in bytes that the Vusers received from the server in a second. When we compare this with the transaction response time, we will notice that as throughput decreased, the response time also decreased. Similarly, the peak throughput and highest response time would occur approximately at the same time.27.Explain the Configuration of your systems? - The configuration of our systemsrefers to that of the client machines on which we run the Vusers. The configuration of any client machine includes its hardware settings, memory, operating system,software applications, development tools, etc. This system component configuration should match with the overall system configuration that would include the networkinfrastructure, the web server, the database server, and any other components that go with this larger system so as to achieve the load testing objectives.28.How do you identify the performance bottlenecks? - Performance Bottleneckscan be detected by using monitors. These monitors might be application servermonitors, web server monitors, database server monitors and network monitors. They help in finding out the troubled area in our scenario which causes increased response time. The measurements made are usually performance response time, throughput, hits/sec, network delay graphs, etc.29.If web server, database and Network are all fine where could be the problem?- The problem could be in the system itself or in the application server or in the code written for the application.30.How did you find web server related issues? - Using Web resource monitors wecan find the performance of web servers. Using these monitors we can analyzethroughput on the web server, number of hits per second thatoccurred during scenario, the number of http responses per second, the number of downloaded pages per second.31.How did you find database related issues? - By running “Database” monitor andhelp of “Data Resource Graph” we can find database related issues. E.g. You can specify the resource you want to measure on before running the controller and than you can see database related issues32.Explain all the web recording options?33.What is the difference between Overlay graph and Correlate graph? - OverlayGraph: It overlay the content of two graphs that shares a common x-axis. Left Y-axis on the merged g raph show‟s the current graph‟s value & Right Y-axis show the value of Y-axis of the graph that was merged. Correlate Graph: Plot the Y-axis of two graphs against each other. The active graph‟s Y-axis becomes X-axis of merged graph. Y-axis of the graph tha t was merged becomes merged graph‟s Y-axis.34.How did you plan the Load? What are the Criteria? - Load test is planned to decidethe number of users, what kind of machines we are going to use and from where they are run. It is based on 2 important documents, Task Distribution Diagram andTransaction profile. Task Distribution Diagram gives us the information on number of users for a particular transaction and the time of the load. The peak usage andoff-usage are decided from this Diagram. Transaction profile gives us the information about the transactions name and their priority levels with regard to the scenario we are deciding.35.What does vuser_init action contain? - Vuser_init action contains procedures tologin to a server.36.What does vuser_end action contain? - Vuser_end section contains log offprocedures.37.What is think time? How do you change the threshold? - Think time is the timethat a real user waits between actions. Example: When a user receives data from a server, the user may wait several seconds to review the data before responding. This delay is known as thethink time. Changing the Threshold: Threshold level is the level below which the recorded think time will be ignored. The default value is five (5)seconds. We can change the think time threshold in the Recording options of the Vugen.38.What is the difference between standard log and extended log? - The standardlog sends a subset of functions and messages sent during script execution to a log. The subset depends on the Vuser type Extended log sends a detailed script execution messages to the output log. This is mainly used during debugging when we want information about: Parameter substitution. Data returned by the server. Advanced trace.39.Explain the following functions: - lr_debug_message - The lr_debug_messagefunction sends a debug message to the output log when the specified message class is set. lr_output_message - The lr_output_message function sends notifications to the Controller Output window and the Vuser log file. lr_error_message - Thelr_error_message function sends an error message to the LoadRunner Output window.lrd_stmt - The lrd_stmt function associates a character string (usually a SQLstatement) with a cursor. This function sets a SQL statement to be processed.lrd_fetch - The lrd_fetch function fetches the next row from the result set.40.Throughput- If the throughput scales upward as time progresses and thenumber of Vusers increase, this indicates that the bandwidth is sufficient. If the graphwere to remain relatively flat as the number of Vusers increased, it would be reasonable to conclude that the bandwidth is constraining the volume ofdata delivered.41.Types of Goals in Goal-Oriented Scenario - Load Runner provides you with fivedifferent types of goals in a goal oriented scenario:1.The number of concurrent Vusers2.The number of hits per second3.The number of transactions per second4.The number of pages per minute5.The transaction response time that you want your scenarioAnalysis Scenario (Bottlenecks): In Running Vuser graph correlated with the response time graph you can see that as the number of Vusers increases, the average response time of the check itinerary transaction very gradually increases. In other words, the average response time steadily increases as the loadincreases. At 56 Vusers, there is a sudden, sharp increase in the average response time. We say that the test broke the server. That is the mean time before failure (MTBF). The response time clearly began to degrade when there were more than 56 Vusers running simultaneously.What is correlation? Explain the difference between automatic correlation and manual correlation? - Correlation is used to obtain data which are unique for each run of the script and which are generated by nested queries. Correlation provides the value to avoid errors arising out of duplicate values and also optimizing the code (to avoid nested queries). Automatic correlation is where we set some rules for correlation.It can be application server specific.Here values are replaced by data which are created by these rules. In manual correlation, the value we want to correlate is scanned and create correlation is used to correlate.Where do you set automatic correlation options? - Automatic correlation from web point of view, can be set in recording options and correlation tab. Here we can enable correlation for the entire script and choose either issue online messages or offline actions, where we can define rules for that correlation. Automatic correlation for database, can be done using show output window and scan for correlation and picking the correlate query tab and choose which query value we want to correlate. If we know the specific value to be correlated, we just do create correlation for the value and specify how the value to be created.What is a function to capture dynamic values in the web vuser script? - Web_reg_save_param function saves dynamic data information to a parameter.。
loadrunner经典面试题
loadrunner经典面试题在LoadRunner中为什么要设置思考时间和pacing答:录制时记录的是客户端和服务端的交互,如果要精确模拟用户的行为,那么客户操作客户端时花费了很多时间要怎么模拟呢?录入填写提交的内容,从列表中下拉搜索选择特定的值等,这时LOADRUNNER 不会记录用户的客户端操作,而是记录了用户这段时间,成为思考时间(Think-time),因为用户的这些客户端操作不会影响服务端,只是让服务器端在这段时间内没有请求而已。
,所以加入思考时间就能模拟出熟练的或者生疏的用户操作,接近实际对于服务端的压力。
Vuser 思考时间模拟实际用户在不同操作之间等待的时间。
例如,当用户收到来自服务器的数据时,可能要等待几秒钟查看数据,然后再做出响应。
这种延迟就称为“思考时间”。
VuGen 使用 lr_think_time 函数将思考时间值录制到 Vuser 脚本中。
以下录制的函数指明用户等待了 8 秒钟才执行下一个操作:lr_think_time(8);当您运行了 Vuser 脚本并且 Vuser 遇到了上述 lr_think_time 语句时,默认情况下,Vuser 将等待 8 秒钟后再执行下一个操作。
可以使用思考时间运行时设置来影响运行脚本时 Vuser 使用录制思考时间的方式。
如何理解TPS?答:TPS主要还是体现服务器对当前录制的事务的处理速度快慢。
TPS高并不代表性能好。
TPS 是Transactions Per Second 的缩写,也就是事务数/ 秒。
它是软件测试结果的测量单位。
一个事务是指一个客户机向服务器发送请求然后服务器做出反应的过程。
客户机在发送请求时开始计时,收到服务器响应后结束计时,以此来计算使用的时间和完成的事务个数,最终利用这些信息来估计得分。
客户机使用加权协函数平均方法来计算客户机的得分,试软件就是利用客户机的这些信息使用加权协函数平均方法来计算服务器端的整体TPS得分。
loadrunner 面试题

loadrunner 面试题LoadRunner面试题一、LoadRunner简介LoadRunner是一款功能强大的性能测试工具,可用于模拟用户的行为,测试系统的并发用户数量、响应时间等关键指标。
它被广泛应用于各种软件和网络应用的性能测试。
二、常见的LoadRunner面试题及答案问题一:什么是LoadRunner,它的主要组件有哪些?答:LoadRunner是一款由Micro Focus公司开发的性能测试工具,其主要组件包括Virtual User Generator(VUGen)、Controller、Load Generator、Analysis等。
问题二:请简要介绍LoadRunner的工作流程。
答:LoadRunner的工作流程可以分为录制脚本、设计场景、运行测试和分析结果四个主要步骤。
首先,通过VUGen录制脚本,将用户的操作转化为脚本代码。
然后,在Controller中设计并配置测试场景,包括虚拟用户数量、负载模式等。
接下来,启动测试并监控测试过程,Load Generator会模拟用户行为并发送请求。
最后,通过Analysis对测试结果进行分析和报告生成。
问题三:LoadRunner的性能测试类型有哪些?答:LoadRunner支持多种性能测试类型,常见的包括负载测试、压力测试、容量规划测试和瓶颈测试等。
负载测试主要评估系统在不同负载下的性能表现;压力测试则是通过逐渐增加负载来测试系统的极限容量;容量规划测试用于预测系统的容量需求;瓶颈测试是为了确定系统的瓶颈点。
问题四:请简要介绍LoadRunner中的虚拟用户生成器(VUGen)。
答:VUGen是LoadRunner的一个主要组件,用于录制和生成虚拟用户脚本。
它可以录制用户的操作行为,并将其转化为脚本代码,用于模拟用户的行为。
在录制期间,VUGen会生成与被测应用程序进行通信的代码,并记录相关参数和事务信息。
问题五:LoadRunner中的控制器(Controller)是用来做什么的?答:Controller是LoadRunner的一个核心组件,用于设计和管理测试场景。
LR面试问题-题_eng
45 个LoadRunner面试问题1What is load testing?什么是负载测试?2What is Performance testing?什么是性能测试?3Did u use LoadRunner? What version?你使用过LoadRunner吗?什么版本?4Explain the Load testing process?解释负载测试过程?5When do you do load and performance Testing?你什么时候做负载和性能测试6What are the components of LoadRunner?LoadRunner的组件是什么?7What Component of LoadRunner would you use to record a scrīpt?你用LoadRunner的什么组件去记录一个脚本?8What Component of LoadRunner would you use to play Back the scrīpt in multi user mode?你用LoadRunner的什么组件去重播多用户模式的脚本?9What is a rendezvous point?什么是集合点?10What is a scenario?什么是场景?11Explain the recording mode for web Vuser scrīpt?解释web Vuser script录制模式12Why do you create parameters?为什么要创建参数?13What is correlation? Explain the difference between automatic correlation and manual correlation?什么是关联?解释自动关联和手动关联的区别?14How do you find out where correlation is required? Give few examples from your projects?你如何知道哪些地方需要关联?从你做过的项目中给出一些例子?15Where do you set automatic correlation options?你在哪里设置自动关联选项?16What is a function to capture dynamic values in the web Vuser scrīpt?-什么功能可以捕捉到web Vuser script里的动态值?17When do you disable log in Virtual User Generator, When do you choose standard and extended logs?18How do you debug a LoadRunner scrīpt?-你如何调试LoadRunner的脚本?19How do you write user defined functions in LR? Give me few functions you wrote in your previous project?20What are the changes you can make in run-time settings?21Where do you set Iteration for Vuser testing?22How do you perform functional testing under load?23What is Ramp up? How do you set this?24What is the advantage of running the Vuser as thread?25If you want to stop the execution of your scrīpt on error, how do you do that?如果你要停止错误的脚本执行,你该怎么做26What is the relation between Response Time and Throughput?响应时间和吞吐量之间的关系(正比)27Explain the Configuration of your systems?说说你系统的配置28How do you identify the performance bottlenecks?如何识别性能瓶颈29If web server, database and Network are all fine where could be theproblem?30How did you find web server related issues?怎么样发现关于web server的问题31How did you find database related issues?怎么样发现关于数据库的问题32Explain all the web recording options?解释所有的网页录制选项33What is the difference between Overlay graph and Correlate graph?-Overlay Graph覆盖图和关联图的区别是什么34How did you plan the Load? What are the Criteria?如何设计负载方案,设计标准是什么35What does vuser_init action contain?Vuser_init 事件包含什么36What does vuser_end action contain?Vuser_end时间包含什么37What is think time? How do you change the threshold?什么是反应时间,38What is the difference between standard log and extended log?标准日志和扩展日志的区别39Explain the following functions:-lr_debug_messagelr_output_messagelr_error_messagelrd_stmt.lrd_fetchThroughput-吞吐量40Analysis Scenario (Bottlenecks):41Types of Goals in Goal-Oriented Scenario42Where do you set automatic correlation options?你在哪里设置自动关联选项。
LoadRunner测试工具教学存在问题及解决方法
LoadRunner测试工具教学存在问题及解决方法【摘要】LoadRunner测试工具是一个广泛应用于性能测试领域的软件,但其教学存在一些问题。
技术门槛较高,学习起来颇具难度;缺乏实战案例指导,学生难以将理论知识应用到实际项目中;教学内容过于理论化,缺乏实践性;缺乏更新维护,学习资源难以跟上最新发展;学习资源分散不集中,给学生找到合适的学习材料带来困难。
为解决这些问题,建议提高教学资源的更新维护,加强实战案例指导,优化教学内容的理论与实践结合,建立统一的学习资源平台。
通过这些措施,可以提升学生对LoadRunner测试工具的学习效果,使他们更好地掌握相关知识和技能。
【关键词】LoadRunner、测试工具、教学、问题、解决方法、技术门槛、实战案例、教学内容、更新维护、学习资源、理论与实践、集中、结论、优化、平台1. 引言1.1 LoadRunner测试工具教学存在问题及解决方法LoadRunner测试工具是一款常用于性能测试的工具,然而在教学过程中存在一些问题,影响了学习效果和学习者的积极性。
针对这些问题,我们需要找到相应的解决方法,以提高教学质量和学习效果。
技术门槛较高是许多学习者在学习LoadRunner时面临的挑战。
由于LoadRunner涉及到多种技术和工具的使用,学习者需要具备一定的技术基础才能够顺利掌握。
解决这一问题的方法可以是提供更加细致的操作指导,引导学习者逐步掌握技术要点。
缺乏实战案例指导也是导致学习效果不佳的原因之一。
理论知识的学习是重要的,但缺乏实践经验的积累会导致学生难以应用所学到的知识。
为了解决这一问题,我们可以增加实战案例的训练环节,让学习者通过实际操作来加深对知识的理解。
教学内容过于理论化也会让学习者感到枯燥和乏味。
我们可以通过加入更多实例和实战操作来丰富教学内容,让学习者能够更好地理解和掌握所学知识。
缺乏更新维护也是影响教学效果的一个重要因素。
随着技术的更新和发展,教学内容也需要不断更新以保持与时俱进。
LoadRunner测试中会遇到的问题
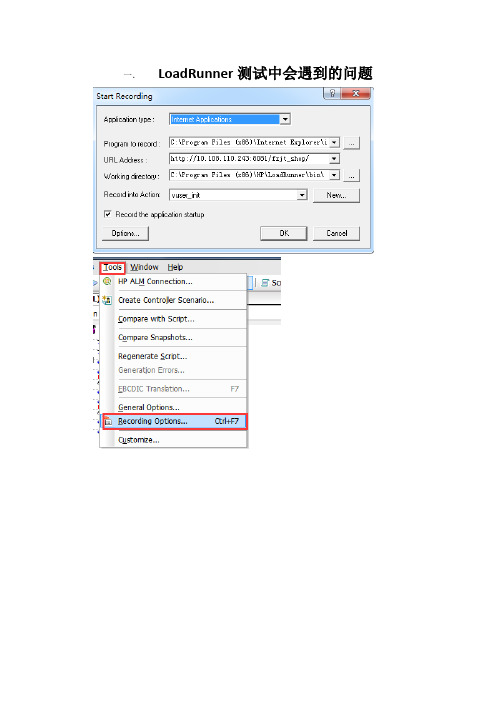
一.LoadRunner测试中会遇到的问题二.录制登录步骤,回放时报错。
提示登录时没有找到链接,使用recording option→recording→HTML Advanced→选择A script containing explicit)三.运行设置脚本开发常见错误的解决方案1,打开recording options,在internet protocol下的recording中选择recording level为HTML-based script,点击HTML Advanced,选择script type为A script containing explicit.即可。
2,选择使用URL_based script录制。
)1.脚本创建流程2.录制脚本的准备工作3.脚本的录制4.脚本解析5.脚本回放设置6.回放脚本(设置关联,日志分析)7.设置关联8.两种模式的使用(HTML与URL)9.添加事务(start Transaction)10.脚本参数化(选中参数右击,replace with a parameter,有很多用户时,能够更真实的设置更多的值)11.内容检查(content checks,在截图中选择要验证的文字,右击,选择add a text chack )12.日志解析13.负载(单用户使用Vuser,多用户使用controller)参数化设置1.能够在Vuesr中直接创建controller;2.打开LR controllerAPP创建controller,将之间的脚本进行导入14.手工场景设置15.目标场景(Goal-Oriented Scenario):设置一个运行目标,通过controller的自动加载功能进行自动化负载,假如测试的结果达到目标,说明系统的性能符合测试目标,否则就提示无法达到目标16.场景的数值设置17.负载生成器18.负载生成器的设置19.使用分布式来生成负载生成器负载生成器的工作多由其他装有LRAgent的PC机来担任)使用另外一台电脑装上LoadRunner后,在本机上开始→HP LR→Agent Configuration,勾选“Enable Terminal Services”20.负载运行时设置21.System:processor time ,process queue lengthProcess: proceed tiem , Privillsged time ,user time ,DPC timeMemory: page faults/sec ,page input/sec ,page reads/sec , pages/sec ,available Mbytes Physical : %Disk time ,Average Disk Queue LengthNeteork interface: byte total/sec22.集合点:(适用于定时秒杀等场景)23.自动关联自动关联loadrunner参数化自动关联包含两种机制:一种是loadrunner通过对比录制与回放时服务器响应的不一致,而提示用户是否进行关联,用户可自己创建关联规则,这个功能能够方便的使我们获得需要关联的部分,但同时也存在一定的问题,如:自动关联所检测到的关联点不一定确实需要进行关联,这要我们更具实际情况进行推断;有些需要关联的动态数据自动关联无法找到,这是就需要做手动关联另一种是loadrunner自带的自动关联规则,在录制脚本时,会根据这些规则自动创建关联自动关联的步骤如下:1.开启自动关联选项刚才提到的两种关联机制,假如用户想使用loadrunner自带的关联规则创建关联,那么需要在【Recording Options】>【Internet Protocol】>【Correlation】中启用关联规则,选中“Enable correlation during recording”,当录制这些应用系统的脚本时,VuGen会在脚本中自动建立关联。
LoadRunner错误集锦

LoadRunner出现error问题及解决方法总结 一、Step download timeout (120 seconds)这是一个经常会遇到的问题,解决得办法走以下步骤:1、修改run time setting中的请求超时时间,增加到600s,其中有三项的参数可以一次都修改了,HTTP‐request connect timeout,HTTP‐request receieve timeout,Step download timeout,分别建议修改为600、600、5000。
run time setting设置完了后记住还需要在control组件的option的run time setting中设置相应的参数。
2、办法一不能解决的情况下,解决办法如下:设置runt time setting中的internet protocol‐preferences中的advaced区域有一个winlnet replay instead of sockets选项,选项后再回放就成功了。
切记此法只对windows系统起作用,此法来自zee的资料。
二、Connection reset by peer.这个问题不多遇见,一般是由于下载的速度慢,导致超时,所以,需要调整一下超时时间。
解决办法:Run‐time setting窗口中的‘Internet Protocol’-‘Preferences’设置set advanced options(设置高级选项),重新设置一下“HTTP‐request connect timeout(sec),可以稍微设大一些”。
三、connection refused这个的错误的原因比较复杂,也可能很简单也可能需要查看好几个地方,解决起来不同的操作系统方式也不同。
1、首先检查是不是连接weblogic服务过大部分被拒绝,需要监控weblogic的连接等待情况,此时需要增加acceptBacklog,每次增加25%来提高看是否解决,同时还需要增加连接池和调整执行线程数,(连接池数*Statement Cache Size)的值应该小于等于oracle数据库连接数最大值。
loadrunner试题带答案和翻译

loadrunner试题带答案和翻译Q. 1: What is the LoadRunner term that describes the time a user pauses between steps?C什么是的术语来描述用户步骤之间暂停时间,LoadRunnerA. PacingB. User Delay用户延迟C. Think timeD. Navigation time航行时间<<<<<< =================== >>>>>> Q. 2: What is the first stage of load testing process? A什么是负载测试过程的第一阶段,A. Plan the load test 计划负载测试B. Create the scenario创建方案C. Execute the scenario执行情况D. Create VuGen scripts创建脚本VuGen<<<<<< =================== >>>>>> Q. 3: When analyzing a technical aspect of a system under test, which group is a helpful source of information? C当分析一个系统下的测试技术方面,哪一组是一个有用的信息来源, A. End users 最终用户B. Functional experts 职能专家C. Application experts 应用专家D. Corporate executives 企业高层<<<<<< =================== >>>>>>Q. 4: Which file type has an extension .lrr? B有一个扩展的文件类型。
loadRunner面试题
loadRunner面试题1.什么是负载测试?什么是性能测试?2.性能测试包含了哪些测试(至少举出3种)3.简述性能测试的步骤4.简述使用Loadrunner的步骤5.什么时候可以开始执行性能测试?6.LoadRunner由哪些部件组成?7.你使用LoadRunner的哪个部件来录制脚本?8.LoadRunner的哪个部件可以模拟多用户并发下回放脚本?9.什么是集合点?设置集合点有什么意义?Loadrunner中设置集合点的函数是哪个?10.什么是场景?场景的重要性有哪些?如何设置场景?11.请解释一下如何录制web脚本?12.为什么要创建参数?如何创建参数?13.什么是关联?请解释一下自动关联和手动关联的不同。
14.你如何找出哪里需要关联?请给一些你所在项目的实例。
15.你在哪里设置自动关联选项?16.哪个函数是用来截取虚拟用户脚本中的动态值?(手工管联)17.你在VUGen中何时选择关闭日志?何时选择标准和扩展日志?18.你如何调试LoadRunner脚本?19你在LR中如何编写自定义函数?请给出一些你在以前进行的项目中编写的函数。
20.在运行设置下你能更改那些设置?21.你在不同的环境下如何设置迭代?22.你如何在负载测试模式下执行功能测试?23.什么是逐步递增?你如何来设置?24.以线程方式运行的虚拟用户有哪些优点?25.当你需要在出错时停止执行脚本,你怎么做?26.响应时间和吞吐量之间的关系是什么?27.说明一下如何在LR中配置系统计数器?28.你如何识别性能瓶颈?29.如果web服务器、数据库以及网络都正常,问题会出在哪里?30.如何发现web服务器的相关问题?31.如何发现数据库的相关问题?32.解释所有web录制配置?33.解释一下覆盖图和关联图的区别?34.你如何设计负载?标准是什么?35.Vuser_init中包括什么内容?36. Vuser_end中包括什么内容?37.什么是think time?think_time有什么用?38.标准日志和扩展日志的区别是什么?39.解释以下函数及他们的不同之处。
- 1、下载文档前请自行甄别文档内容的完整性,平台不提供额外的编辑、内容补充、找答案等附加服务。
- 2、"仅部分预览"的文档,不可在线预览部分如存在完整性等问题,可反馈申请退款(可完整预览的文档不适用该条件!)。
- 3、如文档侵犯您的权益,请联系客服反馈,我们会尽快为您处理(人工客服工作时间:9:00-18:30)。
loadrunner小知识总结loadrunner一些小知识总结,以供大家参考1. 在启动录制脚本操作的Start Recording对话框,去掉Record the application startup前的选择,可以不录制应用程序启动时的操作,而仅录制所需的特定操作。
2. 添加windows性能计数器时,必须先用管理员身份登录该台服务器,然后添加才可生效(注意先后顺序)。
3. 设置DB2数据库监视:在Monitored Server Machines中配置Machine Information机器信息,Name中要填写“主机名@实例名”,如“168.31.6.47@DB2”,其中实例名要填完整,包括节点名称。
Platform选“N/A”。
4. 添加windows性能计数器时,必须先用管理员身份登录该台服务器,然后添加才可生效(注意先后顺序)。
5. web_reg_save_param是在web脚本中用于关联HTML语句的函数。
只有在录制中的关联有效时(在录制选项中设置),web_reg_save_param才会被自动录制。
6. 设置Internet首选项的其它选项几个比较常用的:由资源引起的步骤超时是警告(Step timeout caused by resources is a warning):如果由于资源未在超时间隔内加载而引起超时,将发出警告而不是错误。
对于非资源,VuGen 总是发出错误。
(默认情况下为 NO)HTTP 请求连接超时(秒)(HTTP-request connect timeout(sec)):Vuser 终止之前在步骤内等待特定 HTTP 请求连接的时间(秒)。
超时为服务器保持稳定并响应用户提供了机会。
默认值为 120 秒。
HTTP 请求接收超时(秒)(HTTP-request receive timeout(sec)):Vuser 终止之前在步骤内等待接收特定 HTTP 请求的响应时间(秒)。
超时为服务器保持稳定并响应用户提供了机会。
默认值为120 秒。
超时设置主要用于以下高级用户:这些用户已确定可接受的超时值应该随环境而异。
大多数情况下,默认设置应该足够长。
如果服务器在合理的时间内并未做出响应,请检查其他与连接相关的问题,不要设置太长的超时,否则可能会导致脚本不必要地等待。
网络缓冲区大小(Network buffer size):设置用于接收 HTTP 响应的缓冲区的最大大小。
如果该数据的大小超过了指定的大小,则服务器将按块发送数据,从而增加了系统开销。
从 Controller 中运行多个 Vuser 时,每个 Vuser 都使用自己的网络缓冲区。
该设置主要用于以下高级用户:这些用户已确定网路缓冲区的大小可能影响其脚本的性能。
默认值为 12K 字节。
7. 在Analysis中,可以很方便地将各个分析图表拷贝出来。
方法是:先切换到某个图表页(Graph),再使用Edit?Copy to Clipboard功能,便可将该图表的图、数据等复制到剪贴板,然后就可以粘贴到需要的地方(如软件测试报告)去。
8. 将参数设置为Unique时,要特别注意提供的参数列表是否足够,在Controller中分配值的选项(Allocate Vuser values in the Controller)默认设置为自动分配数据块(Automatically allocate block size),这样的设置在场景的执行过程中往往会出问题,报出“参数不够”的错误,可以修改为由人工分配(Allocate__values for each Vuser),为每个虚拟用户分配指定数目的参数,以便于控制。
9. LR在录制脚本时有时常会出现一些乱七八糟的字符,例如:"Name=save_path", "Value=D:""\\x5C""resin-2.1.12""\\x5C""doc"以上脚本片断中用红色标出的“x5C”部分就是录制下来的乱字符,该脚本原本是为了将附件上传到服务器端保存,可录制下来的保存路径却多了以上的乱字符,导致本应的保存路径D:\resin-2.1.12\doc\...,变为D:\x5Cresin-2.1.12\x5Cdoc\...。
要特别注意,以避免产生不必要的错误最全的软件测试工具LR中性能数据翻译Transactions(用户事务分析)用户事务分析是站在用户角度进行的基础性能分析。
1、Transation Sunmmary(事务综述)对事务进行综合分析是性能分析的第一步,通过分析测试时间内用户事务的成功与失败情况,可以直接判断出系统是否运行正常。
2、Average Transaciton Response Time(事务平均响应时间)“事务平均响应时间”显示的是测试场景运行期间的每一秒内事务执行所用的平均时间,通过它可以分析测试场景运行期间应用系统的性能走向。
例:随着测试时间的变化,系统处理事务的速度开始逐渐变慢,这说明应用系统随着投产时间的变化,整体性能将会有下降的趋势。
3、Transactions per Second(每秒通过事务数/TPS)“每秒通过事务数/TPS”显示在场景运行的每一秒钟,每个事务通过、失败以及停止的数量,使考查系统性能的一个重要参数。
通过它可以确定系统在任何给定时刻的时间事务负载。
分析TPS主要是看曲线的性能走向。
将它与平均事务响应时间进行对比,可以分析事务数目对执行时间的影响。
例:当压力加大时,点击率/TPS曲线如果变化缓慢或者有平坦的趋势,很有可能是服务器开始出现瓶颈。
4、Total Transactions per Second(每秒通过事务总数)“每秒通过事务总数”显示在场景运行时,在每一秒内通过的事务总数、失败的事务总署以及停止的事务总数。
5、Transaction Performance Sunmmary(事务性能摘要)“事务性能摘要”显示方案中所有事务的最小、最大和平均执行时间,可以直接判断响应时间是否符合用户的要求。
重点关注事务的平均和最大执行时间,如果其范围不在用户可以接受的时间范围内,需要进行原因分析。
6、Transaction Response Time Under Load(事务响应时间与负载)“事务响应时间与负载”是“正在运行的虚拟用户”图和“平均响应事务时间”图的组合,通过它可以看出在任一时间点事务响应时间与用户数目的关系,从而掌握系统在用户并发方面的性能数据,为扩展用户系统提供参考。
此图可以查看虚拟用户负载对执行时间的总体影响,对分析具有渐变负载的测试场景比较有用。
7、Transaction Response Time(Percentile)(事务响应时间(百分比))“事务响应时间(百分比)”是根据测试结果进行分析而得到的综合分析图,也就是工具通过一些统计分析方法间接得到的图表。
通过它可以分析在给定事务响应时间范围内能执行的事务百分比。
8、Transaction Response Time(Distribution)(事务响应时间(分布))“事务响应时间(分布)”显示在场景运行过程中,事务执行所用时间的分布,通过它可以了解测试过程中不同响应时间的事务数量。
如果系统预先定义了相关事务可以接受的最小和最大事务响应时间,则可以使用此图确定服务器性能是否在可以接受的范围内。
Web Resources(Web资源分析)Web资源分析是从服务器入手对Web服务器的性能分析。
1、Hits per Second(每秒点击次数)“每秒点击次数”,即使运行场景过程中虚拟用户每秒向Web服务器提交的HTTP请求数。
通过它可以评估虚拟用户产生的负载量,如将其和“平均事务响应时间”图比较,可以查看点击次数对事务性能产生的影响。
通过对查看“每秒点击次数”,可以判断系统是否稳定。
系统点击率下降通常表明服务器的响应速度在变慢,需进一步分析,发现系统瓶颈所在。
2、Throughput(吞吐率)“吞吐率”显示的是场景运行过程中服务器的每秒的吞吐量。
其度量单位是字节,表示虚拟用在任何给定的每一秒从服务器获得的数据量。
可以依据服务器的吞吐量来评估虚拟用户产生的负载量,以及看出服务器在流量方面的处理能力以及是否存在瓶颈。
“吞吐率”图和“点击率”图的区别:“吞吐率”图,是每秒服务器处理的HTTP申请数。
“点击率”图,是客户端每秒从服务器获得的总数据量。
3、HTTP Status Code Summary(HTTP状态代码概要)“HTTP状态代码概要”显示场景或会话步骤过程中从Web服务器返回的HTTP状态代码数,该图按照代码分组。
HTTP状态代码表示HTTP请求的状态。
4、HTTP Responses per Second(每秒HTTP响应数)“每秒HTTP响应数”是显示运行场景过程中每秒从Web服务器返回的不同HTTP状态代码的数量,还能返回其它各类状态码的信息,通过分析状态码,可以判断服务器在压力下的运行情况,也可以通过对图中显示的结果进行分组,进而定位生成错误的代码脚本。
5、Pages Downloader per Second(每秒下载页面数)“每秒下载页面数”显示场景或会话步骤运行的每一秒内从服务器下载的网页数。
使用此图可依据下载的页数来计算Vuser生成的负载量。
和吞吐量图一样,每秒下载页面数图标是Vuser在给定的任一秒内从服务器接收到的数据量。
但是吞吐量考虑的各个资源极其大小(例,每个GIF文件的大小、每个网页的大小)。
而每秒下载页面数只考虑页面数。
注:要查看每秒下载页数图,必须在R-T-S那里设置“每秒页面数(仅HTML模式)”。
6、Retries per Second(每秒重试次数)“每秒重试次数”显示场景或会话步骤运行的每一秒内服务器尝试的连接次数。
在下列情况将重试服务器连接:A、初始连接未经授权B、要求代理服务器身份验证C、服务器关闭了初始连接D、初始连接无法连接到服务器E、服务器最初无法解析负载生成器的IP地址7、Retries Summary(重试次数概要)“重试次数概要”显示场景或会话步骤运行过程中服务器尝试的连接次数,它按照重试原因分组。
将此图与每秒重试次数图一起使用可以确定场景或会话步骤运行过程中服务器在哪个时间点进行了重试。
8、Connections(连接数)“连接数”显示场景或会话步骤运行过程中每个时间点打开的TCP/IP连接数。
借助此图,可以知道何时需要添加其他连接。
例:当连接数到达稳定状态而事务响应时间迅速增大时,添加连接可以使性能得到极大提高(事务响应时间将降低)。