Epi info操作说明
Epi Info 软件在现场流行病学调查中的使用
Epi Info 软件在现场流行病学调查中的使用一、概述Epi Info 软件是世界卫生组织(WHO)和美国疾病预防控制中心(CDC)共同为公共卫生领域工作人员开发的,其主要用于流行病领域的统计分析,可以进行暴发调查、公共卫生监测数据库管理和统计分析等。
通过Epi Info,临床医生、流行病学家以及其他医疗工作者可以快速建立问卷和调查表,编制数据录入程序,录入并分析数据。
从1985年的第一版DOS软件到2002年9月Windows版的Epi Info2002,功能不断完善,新增加了Logistic回归、Kaplan-Meier生存分析、Cox比例风险模型分析等功能。
从上个世纪80年代开始,Epi Info 软件就在中国卫生防疫部门、公共卫生教学及科研工作中得到了广泛的应用。
例如,在消灭脊髓灰质炎工作中的AFP监测系统、1993和1998年的全国卫生服务调查以及各种现场流行病学、临床医学、实验室数据分析都应用了该软件。
Windows版的Epi Info2002采用Microsoft Access的文件格式(.mdb)存储数据,同时可以用来分析其它类型的数据(如Epi 6, MS Excel和dBase IV等),因其界面友好、简单、易学和使用方便,已成为广大流行病学工作者的好帮手。
Epi Info 2002的主界面,主要包括“创建视图”,“数据录入”,“数据分析”,“创建流行病学地图”,以及“营养状况分析”5个主要模块。
安装完Epi Info 2002后,软件在用户桌面上自动建立快捷方式,双击该图标即可启动Epi Info2002主菜单(程序界面):主菜单上的大按钮就是Epi Info 2002的5个主要功能模块:·建立数据库,创建问卷或调查表(称为视图),同时可以建立核对命令对下一步的数据录入进行质量控制、运算或对用户提供相关信息。
·数据录入与编辑,录入界面即为前一步创建的视图。
爱普灵操作指南

‹#› ApneaLink Plus © ResMed 2013
‹#› ApneaLink Plus © ResMed 2013
参数设置—低通气
气流强度下 降到%
AASM标准
最大持续时间
最小持续时间
两个事件暂停/ 低通气之间的 最小时间间隔
在Tool菜单下Seting--Analysis parameters
‹#› ApneaLink Plus © ResMed 2013
软件一
• 点开索引图示,如 右图共分三部分 1、病人信息和 ApneaLink准备或 下载时输入病人信 息一样 2、当大量数据 时,可以输入姓、 名或生日搜索你需 要的信息
病人信息 报告 趋势图
‹#› ApneaLink Plus © ResMed 2013
软件三---趋势图
1、上界面(窗口)
2、下界面时间段标记 3、时间标记线 4、信号 5、通道 6、下界面(窗口) 7、滚动条或方向指示
8、事件
9、事件类型选择
10、从一个事件到另一个事 件的转换
11、选择每屏时间段 12、信号基线调整 13、信us © ResMed 2013
软件四---手动分析
排除分析 中枢性暂停
结束分析
气流受限合并鼾声
气流受限
低通气
吸气受限
阻塞性暂停 开始分析
混合性暂停
气流强度阈值, 下降到%
最少持续时间 最大持续时间 暂停事件大 于60%的时间 符合中枢性 的,定义为 中枢性
气流降低了% 暂停事件小于 20%的时间符 合中枢性的, 定义为阻塞性 呼吸努力度 阈值气流强 度下降到%
在Tool 菜单下Setting— Analysis parameter
Epi Info系统概述使用指南
Epi Info系统概述EPI INFOA Database, and Statistics Program for PublicHealth Professionals公共卫生专业的数据库与高级统计分析软件。
特别适用于流行病学调查表资料、临床试验数据的处理与统计分析。
Epi Info Version 6简介Epi Info Version 6是由WHO与美国疾病控制中心(CDC)共同推出的Epi Info 第6版(The first version of Epi Info was released in 1985)。
适于用调查表形式处理流行病学的数据。
Epi Info Version 6既是一个字处理器又是一个数据库软件,更是一个好用的统计软件包。
Epi Info以问卷式录入数据,可对录入字段的性质、范围和逻辑关系作限定以减少录入差错,其二次录入功能也适用于临床观察数据的录入。
软件可直接地用dBASE数据库,统计功能包括:t检验、方差分析、线性相关与回归分析、秩和检验、CHI-SQUARE检验、Ridit 分析、多元回归分析等。
Epi Info Version 6采用菜单的形式,使用十分方便。
没有硬盘的用户可以在软盘上使用。
Epi Info Version 6的各个模块既可以组合成一个整体使用,又可单个模块使用。
Epi Info Version 6占用的磁盘空间较少但功能齐全。
由于其高度实用,Epi Info Version 6自发布以来,在世界各国得到广泛的使用。
令人欣喜的是这套免费软件鼓励用户自由复制,用户得此软件,参考软件包自带的完整的电子手册,根据程序中提示,最快几分钟就会使用此软件了。
Epi Info Version 5(1988年推出)在117 个国家得到广泛使用,并出版了11种非英文的Version 5 of Epi Info。
该软件的第六版源程序达8.9megabytes,其中包括全部的tutorials, examples及utilities, 但主程序仅约占3megabytes。
Epi Info软件

免费获取
英文安装程序: /epiinfo 最新版汉化文件: 从地病中心网址下载:
/crcfedc/zybzdf09.html
二、软件安装及汉化
汉化(2个文件,4个步骤)
拷 安 拷 选
1.CHINESE.EXE
拷贝
TRANSEXE
Epi Info 软件的 安装与应用
一、软件简介
开发背景: WHO, 美国CDC,免费 发展历史:1985,2000,2008 主要功能:数据库定制、数据录入转
化、数据清洁、数据分析、数据呈报
汉化情况:3.3.2 , 3.4.3, 3.5.1
软件优、缺点
容量大 体积小 硬件环境要求低:CPU,内存,硬 盘,显示器,操作系统,浏览器 友好的用户界面 良好的数据管理功能 偶而运行不稳定
频数较小的异常值
频数较小,为异常值
频数较大的异常值
注意最小值和最大值
五、数据分析
读入EPI 6的REC文件,需EPI 6或EPI 6直读方式
可通过读入和写出完成数据格式转换
用Write命令连接数据
读入——数据库文件1某表 写出——合并数据库
读入——数据库文件2 追加写出——合并数据库
1.读入数据库1
2.安装
language.mdb
3.拷贝
在Epi Info 主窗口中选 择setting→ choose language。
4.选择
在窗口中选择
“Chinese”后点
击OK按钮,就会
出现汉化界面。
三、数据录入
加删除标记后可恢复
回车
重复录入功能
必须输入功能
只读字段
有效值范围
四、数据清洁
2. INSTALL LANGUAGE→INSTALL
利用Epi Info进行条件logistic回归分析
Dm y u m 按钮 自动变为 Mae n r tn 点击该按钮后 k t ai , I e co
所有 可 能 的 交 互 作 用 组 合 将 自动 进 入 Itr t n ne c o ai T r 文本框 中 ; ems 如选 择 错 误 , 点 击 Cer 钮 进 行 可 l 按 a
令进 行分析 。
值可分 为二 分类 与多分 类 lgsc回归 ; oii t 按研 究 设计 类 型可 以分 为非条件 与条 件 lgsc回归 , 者用 于 成组 oi i t 前 或非 配对 的研究 , 后者 主要用 于 配对 ( 匹配 ) 的病 例对 照研究 ¨ 。虽 然 S S S S 】 A 、P S软件 等 均 有 l ii o sc回归 gt 分析 功能 , 但没有 直接进 行条件 lgsc回归分 析 的模 oi i t 块 , 要 进 行 相 应 的 变 换 后 采 用 其 它 模 型 进 行 分 需 析 j且 分 析 方 法相 对 难 于掌 握 。另外 , , 采用 S S或 A SS P S软件 进行 lgsc回归分 析后所 得 到 的结果 也 不 oi i t
以打开 的数据类型包括 : p I o A cs、B s、 x E i n 、 cesd a E — f e c 、o PoPr o 、 p a e F xr、a dx E i t l a d a等软件建 立 的文 件 以及
・
4 6・ 2
中 国卫 生 统 计 2 1 00年 8月 第 2 7卷第 4期
・
计算 机应用 ・
利 用 E ino进 行 条件 lgsc回归分 析 p f I o ii t
EPI INFO软件的应用-岗位培训
(一)打开现有数据库 在“文件(File)”菜单下选择“打开(Open)”按钮,在弹出窗口中选 择一个已经创建的需要进行数据录入的数据库,并点击“打开”
弹出选择调查表的对话框,选择已经在数据库中存在的调查 表后确认即进行数据录入界面。
(二)录入数据
在录入一条记录后,系统会自动进入下一 条记录的录入,用户也可以点击“新建 (new)”按钮来进入下一条记录的录入。 数据的保存是在每一条记录输入完成后自 动进行的。用户也可以点击左侧命令行的 “保存数据(Save data)”命令进行录入数 据的保存。
(四)查找数据
用户如要根据条件查找记录,则可以点击录入界 面左侧的“查找(Find)”按钮,出现查找数据 窗口。 在“供查找变量(Choose search field)”下面列出 了数据库中的所有变量,用户点击要设置条件的 变量,就会在右侧出现相应的空白字段,在字段 中输入查找条件,然后点击确认按钮,系统就会 把符合条件的记录显示在下面的表格中,在显示 的某条记录上双击,则可以进入到该条记录的数 据录入界面。Epi Info最多可用6个变量来设置条 件进行查找。
(五)选择数据
在数据分析过程中,常常需要选择一些特 定的数据信息进行分析,比如选择男性或 者某一年龄段的调查对象等等,这时就需 要用户在原始数据库中将符合条件的数据 选择出来。这些操作可以通过“选择数据 (Select)”命令完成。在点击左侧命令行 的Select命令后,出现如图所示的对话框。
(三)浏览数据
在数据录入界面的左下脚,有四种不同的箭头 “<<”为返回第一条记录 “<”为返回上一条记录 “>”为到下一条记录 “>>”为到最后一条记录
Epi Info软件

频数较小的异常值
频数较小,为异常值
频数较大的异常值
注意最小值和最大值
五、数据分析
读入EPI 6的REC文件,需EPI 6或EPI 6直读方式
可通过读入和写出完成数据格式转换
用Write命令连接数据
读入——数据库文件1某表 写出——合并数据库
读入——数据库文件2 追加写出——合并数据库
1.读入数据库1
Epi Info 软件的 安装与应用
一、软件简介
开发背景: WHO, 美国CDC,免费 发展历史:1985,2000,2008 主要功能:数据库定制、数据录入转
化、数据清洁、数据分析、数据呈报
汉化情况:3.3.2 , 3.4.3, 3.5.1
软件优、缺点
容量大 体积小 硬件环境要求低:CPU,内存,硬 盘,显示器,操作系统,浏览器 友好的用户界面 良好的数据管理功能 偶而运行不稳定
数据核对,一般用FREQ、SELECT命令对各个
变量的原始数据进行查错。 对怀疑有。
数据修改时,可以先用选择数据功能选定
待修改的数据,然后再对这些数据进行修改
操作。
命令树 结果输出窗口
程序窗口
检查空数据
二者不符,有空值
超出数据值域的异常值
2.写出数据库1,表名需更改
3.读入数据库2
4.写出数据库2 合并后的数据库不能再进行数据录入
LIST显示数据
SELECT选择数据
DELETE删除数据
数据分析
Epi Info提供了强大的数据统计分析功能,
包括计算平均水平和离散趋势、总体率或构
成比,t检验,方差分析,χ2检验,直线相
关、回归,逻辑回归,生存分析等。
FREQ计算构成比
Epi Info软件与Epidata软件的比较
件 又不 专 注 于数 据 的 管理 、操作 的简 化 以及 双 录人 数 据 的 核
查 。丹 麦 的 Jn L uie e sM.ar sn决 定 开 发 一 套 新 的 软 件 . 初 是 作 t 起 为 F n n县 “nt t efrA cd n rv nin 项 目 的 一 部 分 ue Iiai o cie tPe e t ” i v o 19 9 9年 末 。e sM.a rsn和 MakMy t Mih e B u s建 立 Jn L ui e t r a 、 ca l ru t
行病 学 、 卫生 统计 学 、 社会 医学 等 多 门公 共卫 生 学科 的发 展 。 这
些大 型研 究 对 实验 设计 、 据 质量 、 数 统计 学 方 法及 工 具 软件 提 出 了更高 的要求 。
E i no软 件 和 E iaa软 件 是 流 行 病 学 研 究 中 常 用 的 工 p If pdt
第9 第8 卷 期 2 1 年 8月 00
软 件 导 刊
So t r fwa eGu d ie
Vo . NO8 1 . 9
Au 20l . 0
E in o软件 与 E iaa软 件 的 比较 p f I pd t
郭 海 涛 吕长 超 杨 卓轶。 , ,
(. 1武警 医学 院 卫 勤教研 室, 津 3 0 6 ; . 警天 津 总队 医院政 治 处干 事 , 津 3 0 6 ; 天 0 12 2武 天 0 12
快 速创 建 问卷 、 多个 变量 间建 立核 查命 令 等 。使用 的速度 也 在 有所 降低 , 不 利于 疾病 暴 发 的现 场调 查 。其 次 , p If 3在 这 E in o 数 据分 析方 面 的能力 有 了极 大 的提高 , 引入 了 C x比例 风险 模 o 型、 多元 L gsc回归等 多种 计算 模块 , oii t 并增 加 了绘 图功 能 。由 于 E in p f 3没有 继 承 E i noD S的一 贯 的风 格 ,特别 是 简 Io p f O I
(新)Epi_Info软件在流行病学中的使用
Epi Info软件在流行病学中的应用1990年美国乔治亚州亚特兰大疾病控制中心(CDC)流行病学软件研究室和瑞士日内瓦世界卫生组织(WHO)艾滋病全球控制小组合作,共同研制成功5.00版本的Epi Info疾病数据管理软件;1992年卫生部卫生统计信息中心委托上海医科大学卫生统计学教研室并合作译制成功Epi Info5.01a汉化版;1996年美国CDC与WHO又成功推出6.04版;该版在功能上有了较大的增加和提高。
用户可从/免费下载。
Epi Info软件深受各国医学科研工作者的欢迎,该软件充分考虑了疾病调查数据的特点,能很方便地对数据进行存储、核对、连接、与其他16种数据文件相互转换以及进行流行病学研究中各种常用的统计分析。
问题1 目前流行病学研究中还有哪些较流行的统计软件?你使用过吗?问题2 你知道Epi Info软件有哪些常用的可执行程序吗?[课题一]Epi Info软件中常用的可执行程序有以下几种。
EPI.EXE (EPI6.EXE) 主菜单程序EPED.EXE 文本编辑ENTER.EXE 数据输入CHECK.EXE 数据核对ANALYSIS.EXE 数据分析STA TCALC.EXE 统计计算器EXPORT.EXE 数据文件输出IMPORT.EXE 数据文件输入MERGE.EXE 数据文件连接V ALIDA TE.EXE 文件比较与Epi Info 5.0版相比,Epi Info 6.04增加了CSAMPLE.EXE、EPITABLE.EXE、EPINUT.EXE三个应用程序。
问题3 你能说出以上可执行程序各自的主要用途吗?[课题二]在将流行病学调查数据录入微机之前,首先应编写调查表文件,Epi Info 软件将根据建立好的调查表文件格式自动生成数据文件结构。
一旦数据文件结构产生之后,便可开始输入数据。
有了数据,就可利用Epi Info进行常用的统计分析。
标准的数据文件由原始数据和文件结构两部分组成。
Epi info软件 学习-病例对照研究

是否发病 Case or control
1 0 0 1 0 0 1 0 1 0 0 1 0 0 0
Sex M F F M F M M F F M M F M F F
喝生水 Exposure
1 1 1 0 0 1 0 1 1 0 0 1 1 0 0
Group 1 1 1 2 2 2 3 3 4 4 4 5 5 5 5
剂量反应关系的判断:
线性趋势X2检验
判断剂量反应关系—线性趋势X2检验
• 某因素A是危险因素,是否存在剂量反应关系? – 在暴露于A因素的人群中
– 以最低暴露组为参照组,计算不同暴露剂量
的OR值
– 做线图,看是否有上升趋势,再用线性趋势
卡方检验
例:食用甲鱼与霍乱之间无剂量反应关系
食用甲鱼 OR=3.2(95%CI:1.9-8.0)
Epi info 应用二: 分析流行病学研究的分析
XXX 201X-1X-1X
病例对照研究中反映疾病和暴露之间关联强 度的指标: OR(odds ratio,比值比)
比值(Odds):某事物发生的可能性与不发生的可能性之比
病例
对照
合计
暴露
未暴露 合计
a
c a+c
b
d b+d
a+b
c+d
a/(a+c) 病例组的暴露比值= =a/c c/(a+c)
输入第一层的四格数字
按F4或者回车键计算第一层OR值
按F2键要求显示第二层
按F2后,显示出第二层的四格
输入第二层的四格数字
按回车键,显示第二层的OR值
如有第三层,继续按F2键 如无,则按回车键,显示两层MH-OR结果
Epi Info 软件在现场流行病学调查中的使用

Epi Info 软件在现场流行病学调查中的使用一、概述Epi Info 软件是世界卫生组织(WHO)和美国疾病预防控制中心(CDC)共同为公共卫生领域工作人员开发的,其主要用于流行病领域的统计分析,可以进行暴发调查、公共卫生监测数据库管理和统计分析等。
通过Epi Info,临床医生、流行病学家以及其他医疗工作者可以快速建立问卷和调查表,编制数据录入程序,录入并分析数据。
从1985年的第一版DOS软件到2002年9月Windows版的Epi Info2002,功能不断完善,新增加了Logistic回归、Kaplan-Meier生存分析、Cox比例风险模型分析等功能。
从上个世纪80年代开始,Epi Info 软件就在中国卫生防疫部门、公共卫生教学及科研工作中得到了广泛的应用。
例如,在消灭脊髓灰质炎工作中的AFP监测系统、1993和1998年的全国卫生服务调查以及各种现场流行病学、临床医学、实验室数据分析都应用了该软件。
Windows版的Epi Info2002采用Microsoft Access的文件格式(.mdb)存储数据,同时可以用来分析其它类型的数据(如Epi 6, MS Excel和dBase IV等),因其界面友好、简单、易学和使用方便,已成为广大流行病学工作者的好帮手。
Epi Info 2002的主界面,主要包括“创建视图”,“数据录入”,“数据分析”,“创建流行病学地图”,以及“营养状况分析”5个主要模块。
安装完Epi Info 2002后,软件在用户桌面上自动建立快捷方式,双击该图标即可启动Epi Info2002主菜单(程序界面):主菜单上的大按钮就是Epi Info 2002的5个主要功能模块:·建立数据库,创建问卷或调查表(称为视图),同时可以建立核对命令对下一步的数据录入进行质量控制、运算或对用户提供相关信息。
·数据录入与编辑,录入界面即为前一步创建的视图。
EPI 操作手册说明书

EPI Operation ManualAutomation controlsEPI automation is designed to maximize the production of ions throughout the production cycle, thereby providing the cleanest air possible at any given time.Optimization is achieved by lowering and raising the corona line away from the ground plane. In some cases, the ground plane is the ceiling in a room. The on-board computer continuously monitors output voltage and amperage being consumed by the ionized atmosphere. When significant change (hysteresis) is detected, the computer sends a signal, causing the corona line to move in the desired direction. The amount of hysteresis required can be set by the user, as can the set-point from which hysteresis is measured. This manual will instruct the user how to set a set-point and set the hysteresis. (The factory default setting is 1.95mA and 3% hysteresis. In most applications, a set point of 2.0mA and 3% hysteresis is recommended.)This operation manual will also provide a list of functions that the computer can display on the LED board, indicating various conditions happening to the EPI system. The FAQ table at the end of this manual is a useful guide for understanding the display and EPI operation.1)The LED light colorsThe LED bar graph is equipped with three colors of LED lights. Red, orange and green lights make up each of the two vertical bar graph columns. The left side is labeled as kV (kilovolts) and the right side is labeled as mA (milli-amps, one-thousandth of an amp). During optimal operation parameters, the kV bar graph and the mA bar graph will be in their respective green LED zones.1As resistance builds in the corona line, typically due to dust buildup on surfaces in the barn, the mA bar graph will begin to retreat to a lower value. The kV bar graph will stay about the same. If resistance reduces, the mA bar graph with rise. Once the red mA LEDs are on, the kV bar graph may retreat. When any of the orange or red LEDs are on, there is likely a situation that demands human intervention. One example of this could be excessive dust buildup.2)The LED lights serve fourteen different functionsred “↓” LEDred LEDany of mA output LEDs from 0mA to 2mA3)Turning automation on/offTo activate the computer’s automation capability, push and hold the “↑↓I / ↑↓O” switch to the left (“↑↓I” side). Hold it in that position for 5 seconds. The two red LEDs that indicate which direction the corona points are moving will turn off, and stay off, until the corona line needs adjustment.To deactivate the computer’s automation capability, push and hold the “↑↓I / ↑↓O” switch to right (“↑↓O” side). Hold it in that position for 5 seconds. Both red LEDs that indicate which direction the corona points are moving will be lit, and stay lit, until automation is activated.Automation is on Automation is off4)Adjusting the mA s et-pointThe computer must be told what the desired output current is, in mA. This is called the mA set-point. The factory default setting is 1.95mA. The right column of numbers shows mA values.To adjust the mA set-point, push and hold the switch to either the left (“mA ↑”) or the right (“mA ↓”) for 5 seconds. Upon pushing the switch, the LED display will change from showing the power supply output, to showing just the set-point. After 5 seconds of holding the switch in the “mA ↓” direction, the set-point will move downward, lighting the corresponding LED value. Pushing the switch in the “mA ↑”direction will adjust the set-point upward, lighting the corresponding LED value. After choosing a set-point, release the switch. In 5 seconds the display will return to normal. The mA set-point is programmable from zero to 2.0mA of HV current.1.95 mAQuick reference - mA set-point∙Push and hold the switch to either the “mA ↑” or the “mA ↓” direction for 5 seconds.∙Hold the switch in the preferred direction until the desired mA value LED is lit.∙Release the switch at that value and wait 5 seconds for the power supply display to return to normal.5)Adjusting the hysteresis set-pointThe hysteresis set-point is a pausing function (⑪), or delayed reaction. Hysteresis is used as a way to reduce hunting by the automation. In this application, the hysteresis allows the actual mA output to increase or decrease inside a range, prior to physically adjusting the corona up or down. The range is controlled by the percent hysteresis, or “%⑪.” Each 1% = 0.02mA of range above and below the mA set-point. For example, if the mA set-point is 1mA and the percent hysteresis is 1%, then the output current can range from 0.98mA to 1.02mA, before the computer will adjust the corona line. If the percent hysteresis is increased, the range widens. If the percent hysteresis is decreased, the range narrows.The computer must be told what the desired hysteresis is, as a percentage. This is called the hysteresis set-point. The factory default setting is 3%. The middle column of numbers shows % hysteresis.To adjust the hysteresis set-point, push and hold the switch to either the “%⑪↑” or the “%⑪↓”direction for 5 seconds. Upon pushing the switch, the LED display will change from showing the power supply output, to showing just the set-point. After 5 seconds of holding the switch in the “%⑪choosing a set-point, release the switch. In 5 seconds the display will return to normal. The mA set-point is programmable from zero to 19% hysteresis.% hysteresis3% hysteresisQuick reference - Hysteresis set-point∙Push and hold the switch to either the “%⑪↑” or the “%⑪↓” direction for 5 seconds.∙Hold the switch in the preferred direction until the desired % value LED is lit.∙Release the switch at that value and wait 5 seconds for the power supply display to return to normal.6)Flashing displayFlashing LEDs may be seen during normal operation of the PS. The LEDs flash 1 second on and 1 second off when either of the limit switches is reached. The flashing display means that human intervention with the EPI system is required.When the LED display is flashing the actual-output values and the motor tighten (“↑”) LED is on, it means the “tighten” limit switch has been reached. Reaching the tighten limit switch is expected periodically. As dust builds on surfaces, the corona line may be lifted closer to the ground plane until the limit switch is reached, stopping the motor. The computer recognizes that a limit switch has been reached and flashes the actual LED output values. Cleaning of the ground plane is likely needed.When the tighten limit switch is reached, the power supply continues to ionize the air in the room; however, the performance of the system begins to suffer as the mA value drops.When the LED display is flashing the actual-output values and the motor loosen (“↓”) LED is on, it means the loosen limit switch has been reached. Reaching the loosen limit switch is typically not expected. Reaching the loosen limit switch may indicate that an artificial ground is too close to the corona line or that excessive power-leaking is occurring, perhaps caused by a faulty insulator.When the loosen limit switch is reached, the power supply will continue to ionize the air in the room, if possible. The corona line insulators and high-voltage wire should be inspected for signs of leaking voltage. These signs are often found in the form of black tracks or dark trails leading to grounded objects, such as a ceiling or wall.Motor tighten LED remains lit, while the actual output displayflashes one second on, one second off.Motor loosen LED remains lit, while actual output display flashesone second on, one second off.After tending to the issue, cycle the AC power to clear a flashing display. The simplest way to cycle the AC power is to unplug the power supply from the wall socket. Wait 10 seconds for the circuitry to reset, and plug the power supply back into the wall socket.7)0 mA & 0 kV LEDsIf the display shows 0 mA and 0 kV, this is an indication that an over-current and/or arc has occurred. Upon sensing an over-current condition, the power supply enters safe mode, instantly reducing voltage and amperage to zero. In an attempt to self-correct this over-current condition, the computer will signal the motor to loosen (lower) the corona line and the motor loosen (“↓”) LED will be on.If the over-current condition is momentary, the power supply will recover and operate normally 30 seconds after the over-current event. If the cause of the over-current condition is not remedied, the power supply will remain in safe mode until the over-current condition is remedied.An over-current may occur after cleaning the dust from the ground plane, when a foreign object has lodged against the corona line causing a short circuit, or some other voltage leak has occurred.8)0 mA & 0 kV LEDs flashingA major fault condition may exist when the 0 mA & 0 kV LEDs are flashing. If the high voltage output drops below 10kV, for more than 70 minutes, such as in an over-current condition, the computer will drop output voltage and amperage to zero and latch the computer controls. The output will remain zero until the issue is resolved. The AC power must be cycled to unlatch computer controls.If this condition occurs, it is usually caused by an over-current condition, such as when a corona line is touching another object in a room. When the computer drops output voltage and amperage to zero, it simultaneously signals the motor to loosen (“↓” LED will be on), lowering the corona line from the ground plane.If the 0 mA & 0 kV LEDs are flashing, the cause of the failure must be identified and remedied before resuming normal operation of the EPI system.9)Over-temperature LEDIn the event that the internal temperature of the power supply climbs too high, the over-temperature LED will turn on, the computer will disable the motor controls, forcing a reduction of the high voltage and current output and allowing the power supply to cool down. When the internal temperature drops to an acceptable level, the computer will restore motor controls and the power supply will operate normally.It may be possible that an environmental influence has caused the power supply to go over-temperature. Look for obvious causes of excess heat that may influence the power supply. Some examples of what may cause excessive heat include: portable heaters, heaters directed toward the power supply, direct sunlight on the power supply, open flame near the power supply, and fabric or insulation material draped over the power supply reducing the ability to shed excess heat to the ambient air. Check to be sure that air can move around all sides of the power supply, including the side facing the wall.Motor loosen LED remains lit, 0 mA and 0 kV LED’s flashone second on, one second off.10)Hours of operationWith a 4 digit display, total hours of operation will be shown. Hours will accumulate whenever the output voltage is above 10kV.11)Changing a fuseIn rare occasions, such as power surges, the fuse(s) may burn-out. Each fuse is seated in a drip proof, spring-loaded, locking quick-connect mechanism. To change a burned-out fuse, gently depress the quick-connect spring and rotate counter clock wise to release. Remove the mechanism and the fuse. Replace the fuse with a 5x20mm, glass cartridge, 3A, fast-acting, GMA series fuse and reinsert the quick-connect mechanism, depressing the spring and rotating clockwise.12)Manually checking voltage and amperage outputA 3-pin tip jack is provided in the event a user wishes to manually check the voltage and amperage output from the power supply using a voltage meter. A schematic of the 3-pin tip jack is provided on the side of each power supply. Set the voltage meter to 20 DC volts. (DC voltage).This power supply has ionized for 33 hours.the 2 o’clock position, the voltage monitoring pin is located at the 6 o’clock position, and the current monitoring pin is located at the 10 o’clock position.To monitor output voltage, place the black probe in the ground hole (2 o’clock position) and the red probe in the voltage monitoring hole (6 o’clock position). The reading on the volt age meter will be between 0 volts and 3.01 volts. The number displayed on the voltage meter is 1/10,000 of the actual output voltage. A reading of 3.01 volts equals an output of -30,100 volts. -3.01(10,000) = -30,100 volt. To monitor output amperage, place the black probe in the ground hole (2 o’clock position) and the red probe in the amperage monitoring hole (10 o’clock position). The reading on the voltage meter will be between 0 volts and 2.10 volts. The number displayed on the voltage meter equals the output current in milliamps (mA). A reading of 1.90 volts equals an output of 1.90 mA. 1 Volt = 1mA. 1.90(1) =1.90mA.1.59 mA output 29.4 kV output。
epiinfo
3
1.3 常用模块及功能 表1 Epi Info的常用模块及功能
模 块 Make View Enter Data Analyze Data …… Check 其它模块 Statcalc Data compare …… 功 能 建立调查表 自动生成数据文件,进行数据输入或修改 统计分析及数据整理 …… 根据 enter 建立的数据文件,制定合法值和逻 辑检查,允许用户自己编写核对程序 从键盘输入数据至表格进行统计分析 数据核对 ……
Epi Info TM 软件的使用
流行病学教研室 尹智华
1
2
ห้องสมุดไป่ตู้
一、简 介
1.1 开发:
(1)WHO的AIDS病全球控制小组 (2)CDC流行病学室
1.2 免费获得 (1)/epiinfo
(2)http://www.epiinfo.it/epiinfo3.asp
最新版本: Epi InfoTM Version3.3.2
Checkbox:类似是/否字段定义。使用该 类型时,不允许有缺失值 Yes/No:是/否字段,分别用1/0表示 Option:用于创建单选按钮 CommandButton:命令按钮,用于执行 其他应用程序 Relate:在同一数据库中用于建立主、子 调查表之间的关系 Image:图象字段。 Mirror:镜像字段。
基本模块
4
1.4 基本流程
空白调查表 编码 建立调查表 Make View Enter
原始资料
双 重 输 入
Data1 比 修 较 改 Data2 统 计 分 析 Analyze
生成数据库
生成逻辑检查文件 Check
Data compare
5
6
二、 实 例
Epi Info 2000 使用方法

变量赋值(Assign) 变量赋值(Assign)
将表达式的结果赋值给变量
三、数据分析
Statistics窗口介绍 Statistics窗口介绍
统计分析命令
数据筛选命令
Select 和Cancel select SORT 和Cancel sort If
调查表(View)可分为若干页 EnterView界面 调查表(View)可分为若干页见EnterView界面 字段对话框的操作
定义名称、提示、数据类型等内容
(见字段对话框)
Enter Data的操作 Data的操作
直接从建立调查表的界面进入
文件菜单里选择Enter data即可 文件菜单里选择Enter data即可
SORT AGE SORT SEX DESCENDING 等同于 SORT AGE SEX DESCENDING
举例
SORT AGE SORT AGE DESCENDING ILL DESCENDING SEX DESCENDING
IF命令当设置的条件满足时,程序应 IF命令当设置的条件满足时,程序应 执行的一系列命令,(否则将执行另 外一系列命令)。
SEX = Male
分组变量
结果变量
ILL SEX Female Row % Col % Male Row % Col % TOTAL Row % Col % Yes 30 68.2 65.2 16 51.6 34.8 46 61.3 100.0 No 14 31.8 48.3 15 48.4 51.7 29 38.7 100.0 TOTAL 44 100.0 58.7 31 100.0 41.3 75 100.0 100.0 Chi-square 2.1053 2.0772 1.4646 0.0793665567 0.1132431926 1-tailed p 2-tailed p 0.1467933632 0.1495151757 0.2262033434
Epi Info 7.3a 产品说明书

by Epi Info7,3a P-value of less than0.05being considered as proof of significance.Results Antibiotic consumption:Antibiotic costs:Abstract4CPS-041Table120162017Total cost/1000EMERGC¼1422.23C¼1256.64Conclusion We found a significant antibiotic consumption decrease after the implementation of the EATG.This reduc-tion is associated with cost savings.We noticed important changes in the antibiotic prescription profile:quinolones,third-generation cephalosporins and carba-penems prescriptions decreased(by about30%–40%)and, simultaneously,amoxicillin clavulanic acid prescriptions increased(by less than10%).Levofloxacin is the main factor related to quinolones reduc-tion.This could indicate a proper use of antibiotics in respira-tory pathology.These changes suggest an optimisation of antibiotic pre-scription in the Emergency Department because we observed a reduction in the use of antibiotics associated with resistance development.REFERENCES AND/OR ACKNOWLEDGEMENTS1.https:///pubmed/238361882.https:///pubmed/151273673.https:///epiinfo/user-guide/statcalc/statcalcintro.htmlNo conflict of interest.4CPS-042SWITCH FROM CLARITHROMYCIN TO AZITHROMYCIN –ONE OPTION TO OPTIMISE MACROLIDE USETHROUGH CLINICAL PHARMACISTSC Querbach*.Klinikum Rechts der Isar der Tum München,Pharmacy,München,Germany10.1136/ejhpharm-2019-eahpconf.191Background Clarithromycin is a strong inhibitor especially of cytochrome-P4503A4in contrast to azithromycin.Clinicians may often not be aware of the importance of clarithromycin drug interactions.T o date,we could not find published data directly comparing potential interactions of clarithromycin and azithromycin.Purpose The aim of this study was to evaluate macrolide pre-scriptions with respect to the interaction potential of either clarithromycin or azithromycin,as well as the indication and duration of therapy by clinical pharmacists.Material and methods From May2018to July2018,a total of48patients for whom clarithromycin IV was ordered were identified at a German university hospital.T wo clinical phar-macists independently evaluated drug therapy and performed database-based interaction checks1–4of the complete medica-tion regimens with clarithromycin according to a German vali-dated classification system(ABDA5)and compared them to azithromycin.The most important antibiotic-related interven-tions were discussed with the physician in plete medication regimens,indications,duration of therapy,number and severity of interactions as well as the implementation of the interventions were documented.Results Interventions were necessary in37/48patients.Clari-thromycin was combined with166different medications,and, in total,548combinations were checked with the following results:.In16patients discontinuation of clarithromycin due to missing indication..In eight patients switch to azithromycin IV,in four patients switch to azithromycin PO..In seven patients continuation of clarithromycin under close monitoring..in two patients interventions regarding the comedication.A complete switch from clarithromycin IV to azithromycin would have resulted in a reduction of clinically relevant drug interactions from168/548to115/548,with a shift to lower severity of interaction according to the ABDA classification system:.Contraindicated combination:reduction from15to0..Dosage adjustment or close monitoring needed/not recommended combination:reduction from72to six..Consider some monitoring:increase from81to109..Generally no action needed:increase from380to433. Conclusion Involvement of clinical pharmacists helps to opti-mize macrolide prescription with respect to the interaction potential of either clarithromycin or azithromycin as well as the indication and duration of therapy.REFERENCES AND/OR ACKNOWLEDGEMENTS1.https://mediq.ch2.https://,Stockleys Drug Interactions3.https://www.fachinfo.de4.https://,Lexicomp®Drug Interactions5.https://www.pharmazeutische-zeitung.de/ausgabe-252013/zum-1-juli-neue-klassifikationsstufen/No conflict of interest.4CPS-043EXTENSIVELY PANDRUG-RESISTANT PSEUDOMONAS AERUGINOSA INFECTIONS:ANALYSIS ANDOUTCOMESM Achaques-Rodriguez*,F Fernandez-Fraga,ME Martinez-Nuñez,T Molina-Garcia. Hospital Universitario de Getafe,Pharmacy,Getafe,Spain10.1136/ejhpharm-2019-eahpconf.192Background The incidence of infections due to extensively drug-resistant(XDR)and pandrug-resistant(PDR)strains of Pseudomonas aeruginosa(PSA)is increasing,mainly due to the overuse of antibiotics.Purpose The aim of this study was to identify and describe the infections due to XDR and PDR PSA occurring in our hospital,as well as to compare the effectiveness of monother-apy versus combination therapy.Material and methods Observational,retrospective and longitu-dinal study was performed.Patients with positive cultures in diagnostic samples for XDR and PDR PSA from March2009 to August2018were included.Magiorakos criteria were used to define XDR and PDR PSA.Only infections with directed treatment with systemic,inhaled,intratracheal antibiotics or a combination were considered.Data were collected from hospi-tal electronic orbidity was measured by calculat-ing the Charlson Comorbidity Index(CCI)at the beginning of hospitalisation.Previous hospitalisation and previous antibi-otic treatment were considered if they occurred in the9026copyright. on December 24, 2023 by guest. Protected by / Eur J Hosp Pharm: first published as 10.1136/ejhpharm-2019-eahpconf.192 on 11 March 2019. Downloaded fromdays prior to hospitalisation.Crude in-hospital mortality and composite cure rate(significant resolution or complete resolu-tion of all signs and symptoms of the infection),defined as both clinical cure and microbiological eradication were eval-uated.Statistical analysis was performed using SPSS statistics v24.0.Results A total of155infections in87patients were included. Mean age was67(IQR50–75)years.Median CCI was3 (IQR1–5).43.9%of patients had previous hospitalisation and in42.4%of patients antibiotics were administered previously. Thirty-three per cent of patients were transferred from another hospital or a social-sanitary centre.Death occurred in 19.4%of infections.The main infections were urologic (42.6%).5.8%were PDR strains,17.4%were colistin-resistant and40.0%meropenem-resistant strains.The main systemic antibiotics used were:colistin22.7%and meropenem20.7%. Intratracheal and inhaled antibiotics were used in 4.0%and 1.0%of episodes respectively:27.1%were combined treat-ments.Microbiological resolution was achieved in54.2%of infections,while clinical resolution was observed in75.5%. Non-statistically significant results were obtained when com-paring the effectiveness of combination therapy versus mono-therapy in achieving clinical resolution(OR:0.539;95%CI: 0.246to1.181).Conclusion In our hospital these kinds of infections were pro-duced in the older population with a moderate CCI and pre-vious exposure to antibiotics.A high percentage of meropenem-resistant strains were bination therapy was not more effective than monotherapy in achieving clinical resolution.REFERENCES AND/OR ACKNOWLEDGEMENTSNo conflict of interest.4CPS-044IMPACT OF CLINICAL PHARMACIST-VANCOMYCINMONITORING ON PATIENT SAFETY OUTCOMER Al-ruwaisan*,R Bahmaid,N Albanyan.King Fahad Medical City,Pharmacy Services Administration,Riyadh.KSA,Saudi Arabia10.1136/ejhpharm-2019-eahpconf.193Background Vancomycin is frequently used to treat gram-posi-tive infections,especially methicillin-resistant staphylococcus aureus(MRSA).The level of vancomycin in blood should be kept in a specific range to give the optimal antimicrobial kill-ing and avoid the development of resistant and nephrotoxicity with low or high serum levels,respectively.This is known as therapeutic drug monitoring(TDM).Vancomycin TDM in our hospital is performed by either clinical pharmacists or physicians.Purpose In order to unify the practice and serve our patients with the best care,this study aimed to evaluate the safety consequences including nephrotoxicity of clinical pharmacist-based vancomycin TDM versus physician-based vancomycin TDM.Material and methods This was a retrospective cohort study conducted at a single tertiary hospital.It included two groups of vancomycin TDM,one for physicians and one for clinical pharmacists.The patients included were all adults more than 18years’old started on vancomycin intravenously for more than24hours for suspected or proven infection.The primary outcome was the development of nephrotoxicity.The secondary outcomes included appropriate vancomycin initial dosing,sampling time and interpretation of vancomycin level.Results A total of100patients were enrolled in the study,with53patients in the physician group.There were no signif-icant differences in the baseline characteristics between thetwo groups.Nephrotoxicity was reported as 3.8%(n=2)inthe physician group and12.8%(n=6)in the clinical pharma-cist group,with a P-value of0.143.Moreover,there were sig-nificant differences in the defined secondary endpoints that included appropriate vancomycin initial dosing,sampling timeand interpretation of vancomycin level.The results were reported as84.9%(n=45),37.7%(n=20)and11.3%(n=6)in the physician group and87.5%(n=28),62.5%(n=20)and48.9%(n=23)in the clinical pharmacist group,respectively,with the same P-value of less than0.001.Conclusion Although there was a non-statistically significanthigher rate of nephrotoxicity in patients who received vanco-mycin TDM by clinical pharmacists compared to those moni-tored by physicians,the difference in appropriate vancomycininitial dosing,sampling time and interpretation of vancomycinlevel was statistically significant.favouring the clinical pharma-cists group.REFERENCES AND/OR ACKNOWLEDGEMENTSWe thank our colleagues from the research centre in our hospital who provided insightand expertise that greatly assisted the research statistical analysis.No conflict of interest.4CPS-045VALUE OF THE CLINICAL PHARMACIST IN THEPHARMACOKINETIC MONITORING OFANTIMICROBIALS:HEALTH OUTCOMESMM Alañon Pardo*,MC Conde García,C Notario Dongil,A Marcos de la Torre,D Fraga Fuentes,N Andrés Navarro.Hospital General Mancha Centro,Pharmacy,Alcázar de SanJuan,Spain10.1136/ejhpharm-2019-eahpconf.194Background There has been a marked rise in the prescriptionof vancomycin and aminoglycosides over recent years due tothe increase in infections caused by multi-resistant microorgan-isms.The measurement of their plasma concentrations(Pcs)is necessary to correctly adjust the dosage and minimise the riskof nephrotoxicity.Purpose T o investigate pharmaceutical interventions(PIs)dur-ing the pharmacokinetic monitoring of hospitalised patients receiving vancomycin or gentamicin,and to analyse the health outcomes of monitored patients.Material and methods We conducted a prospective observatio-nal study(May–September2018)of PIs by the Clinical Phar-macokinetics Unit of the Pharmacy Department in a350-bed general hospital.Inclusion criteria were age!18years and treatment with vancomycin or gentamicin.Exclusion criteriawere hospitalisation in the ICU and pre-surgical antibiotic pro-phylaxis.We gathered data on:sex,age and clinical(serum creatinine(Cr),diagnosis),pharmacological(drug,dosage,sus-pension motive)and pharmacokinetic variables and on PIs (Bayesian estimation of individual pharmacokinetic parameters:PI-1,maintain schedule;PI-2,modify dose and/or interval;and PI-3,temporary suspension to favour renal drug elimina-tion).T reatment effectiveness was defined by the disappear-ance of initial symptoms/signs(‘clinical recovery’)or of theinitial microorganism in control culture(‘microbiological recovery’).‘Nephrotoxicity’was defined by Cr!1.4mg/mLor!50%above baseline value.26copyright.on December 24, 2023 by guest. Protected by / Eur J Hosp Pharm: first published as 10.1136/ejhpharm-2019-eahpconf.192 on 11 March 2019. Downloaded from。
EPIRB及SART使用方法
EPIRB使用方法
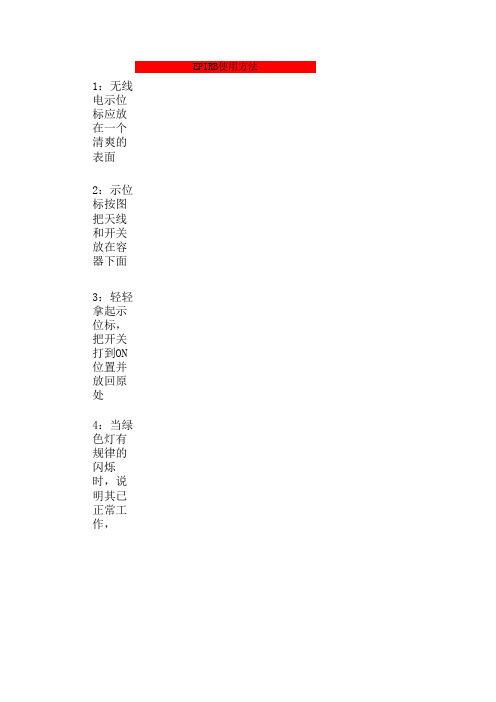
1:无线电示位标应放在一个清爽的表面 2:示位标按图把天线和开关放在容器下面 3:轻轻拿起示位标,把开关打到ON位置并放回原处 4:当绿色灯有规律的闪烁时,说明其已正常工作, (检验时不要超过30秒,以免造成遇险误发射)
SART使用方法
把开关打到ON的位置,如果附近船舶9GHZ雷达工作, 该装置收到雷达信号后,即可发出一行平均间隔的 ,在救援单位的雷达上显示出遇险艇及筏的位置, 从而使救援单位尽快驶向遇险艇,筏进行救助。
Epiinfo

数据录入时质量控制
由经过培训的专门负责数据录入的人员完
成数据录入工作 不要随意更换数据录入人员 严格按照原始调查表的内容进行录入,不 得任意更改结果 必要时(往往)先整理数据,或编码 双录入制
数据录入后质量控制
数据双录入比较也就是对于同一份调查数据资料 由甲、乙两位数据录入员分别录入,或同一人分
排序”
选择数据Select
在点击选择数据命令后,在弹出的对
话框中进行选择条件的设置后点击确认
结果窗口中会显示符合选择标准的记
录数,同时给出选择标准
如果想恢复到原始数据状态,则使用
左侧命令行的“取消选择”命令即可
写出文件Write
点击“写出文件”
命令,弹出对话框
在对话框选择要写出文件包含的变量,
(一)、创建数据库
点击程序\Epi Info\Make View(创建数据库) 进入创建数据库模块
点击桌面Epi Info快捷方式按钮打开Epi Info 主界面,在主界面点击Make View按钮进入 创建数据库模块
在“文件(File)”下拉菜单中点击“创建新视图”选 项可创建新的数据库 在“文件(File)”下拉菜单中点击“打开视图进行编 辑”选项则可对现有视图进行编辑
点 击 进 入 字 体 编 辑 窗 口
定义变量对话框
变量类型
Text:字符 Label/Title:标签或题目 Text[Uppercase]:大写字符 Multiline:多行型 Number:数值型 Date/Time:日期时间型 Checkbox:选框型 Yes/No:是/否型 Option:单选型 Command Button:命令按钮
用统计软件对变量作些简单的统计描述,如通
EPI流量计说明书
A节简介和安装介绍你的主触摸流量计包括流量传感元件,温度传感元件,桥式放大器/信号输出板,微处理器电路板,变送器外壳和探头支持或流量部分。
根据您的要求,可能是这些个别集成到一个流量变送器组件,或者你可能有一个额外的流量变送器信号处理器组装(远程电子)。
在这两种配置中,微处理器转换非线性输入信号从线性0-5 VDC4-20 mA输出流量变送器信号。
各种其他可选的通信协议,包括RS232/RS485,火线红外模块,数据记录与EPICommunicator 和Modbus或HART兼容模块。
仪器的开箱你的主触摸热式质量流量计是一种精密的电子流量仪表。
虽然这些流量计是坚固耐用的,他们应在交货时检查,以确保没有损害发生于运送途中。
如果经检查发现,损害已经发生,立即通知承运人,并把货物损坏索赔。
运输容器或箱子应谨慎处理,小心打开,以避免可能造成的损害的内容。
后容器被打开的内容,应仔细清除,并检查各个部分对照装箱单。
请注意,装箱清单会显示所有选项为您的仪器订购。
许多,如果不是全部,这些选项将被纳入流仪表本身并不会是单独的组件。
最后验证检查设备校准范围如流量计的文档上显示匹配你的采购订单规格。
如果您发现不符或有任何疑问,你是怎样领受,立即联系EPI。
电源要求电源要求主触摸流量计“DC24”选项,为用户提供18至24伏特DC@250毫安。
主触摸流量计“AC115”选项电源要求115 VAC,50/60赫兹标准,或220 VAC,50/60赫兹“AC230”选项。
如果管道是用来括电源输入线,它应该适合于该应用,导电性,和内连接外壳接地。
我们的建议电线尺寸为18佐治亚州的所有AC搁浅接线。
如果流量计包括一个远程电子组装,然后流量变送器电源提供连接到远程组件(见G部分对应的接线说明你的配置)。
十英尺的两导线连接电缆提供与远程组件。
如果更多的电缆是必需的,应替换为一个两线,双绞屏蔽电缆10'的长度。
在回路的导线的尺寸应不超过5欧姆电阻不小于22特设工作组。
20140902--Epiinfo软件创建统计地图

结果:显示不同α、β下的样本量
病例对照--样本量估计
依次输入1-α、1-β、病例与对照组的比例、对照组的期望发病率、OR、病例组发病率(后 两个个参数只要填写一个即可),按F4得到结果
卡方趋势
光标移至chi square for trend 回车、 依次输入等级和对应的病例和对照数,按F4得结果
扣完图后,保存文件,出现三种格式文件 dbf. shp. shx
创建数据库
1. 用Excel 打开地图文件中的dbf文件 2. 再另存为xls文件(注意为97-2003工作簿) 3. 打开这个xls文件,增加数据列,比如发病数、人口学资料、发病率 4. 利用Epi info Analysze data 模块把xls文件转换成access database文件,
分析数据 Analysis Data
分析数据的界面:命令在左侧,输出结果在右上方
分析模块的功能
读入数据:可读入多种形式的数据,如EXCEL 写出数据 修改数据 基本统计功能:频数、n X r表格、均数 高级统计功能:线形回归、Logistic回归、复杂抽样方法的计算 做图:直方图、地图、线图、条图
流行病学曲线
➢ 使用Statistics中的Graph命令 ➢ 在Graph Type中选择Histograph做直方图 ➢ 选则时间变量(如发病时间)作为X变量 ➢ Y轴选择计数(count) ➢ 选择一种日期表示类型(如mm/dd/yyyy) ➢ 选择适合本疾病的时间间隔(可以选择不同的时间长度作图后比较,比如以3
后缀mdb
增加分析的列表,发病数、发病率等
读取xls文件,注意选择Excel5.0
Write [Export] Output 为Access 97 保存mdb文件 Data table 可随意用个英文单词
- 1、下载文档前请自行甄别文档内容的完整性,平台不提供额外的编辑、内容补充、找答案等附加服务。
- 2、"仅部分预览"的文档,不可在线预览部分如存在完整性等问题,可反馈申请退款(可完整预览的文档不适用该条件!)。
- 3、如文档侵犯您的权益,请联系客服反馈,我们会尽快为您处理(人工客服工作时间:9:00-18:30)。
Epi info操作说明
1.创建流行病学地图
直接使用已有地图,选择后缀shp
从大地图中切出自己需要的小地图
点击GODE进行排序,全选广东(44000000——45000000)
“属性”,可以添加名称。
2.数据整理
重新新建一个excel文件,注意把名称前面的空格删掉,另存为低版本的excel格式(97-2003)。
3.数据分析,将excel的数据读入epiinfo软件。
后的excel文件,工作表选择excel里面数据所在的工作表“sheet1”。
不知道是不是已经写入了数据,可以通过“显示数据内容”来查看。
接下来是“写出文件(write)”
“文件名称”输入自己想要的名字(建议用英文),“数据表”也是填写自己想要的名字。
然后可以“退出”。
4.将数据与地图进行结合
找到之前的access文件。
这里注意:左侧选择法“name”进行匹配。
先进行刷新
点击“覆盖”之后“应用”。
接着在“standard labels”—“text field”选择“name”—“应用”。
这个图标可以移动图标。
“属性”——“合并图标”,可以添加指北针和比例尺。
保存地图,“文件”——“保存为bitmap文件”,建议直接用qq切图保存(做ppt用)。
5.如何用图片版本的地图抠图
,“文件”——“背景图像”,有时候不显示图片,得输入名字帮助找到。
进行抠图编辑,晚会双击则可以抠到图。
然后“保存”,为地图命名(比如珠海斗门)。
重新打开抠出的地图,选择shp格式。
属性改名。
