Fatigue Analysis
MSC.Fatigue_Training030806
• The fatigue life of a component is governed
by the loading environment to which it is subject, the distribution of stresses and strains arising from that environment, and the response of the material from which it is manufactured.
Advantages of Quasi Static Analysis
Advantages of Transient Analysis
S-N Analysis (contd..)
Rain flow counting
Mean stress Correction
Mean stress Correction…
sRange =100 s
sMean = 50
S
sRange =100
s
100
sMean = 0
5000
s
N
sRange =100
sMean = -50
Mean stress Correction (contd…)
Palmgreen-Miner’s Linear damage rule
This states that damage can be summed by determining the ratio of the number of cycles experienced to the number of cycles to failure for a given stress range or level and then summing all the ratios for every stress range.
5-安全因子分析
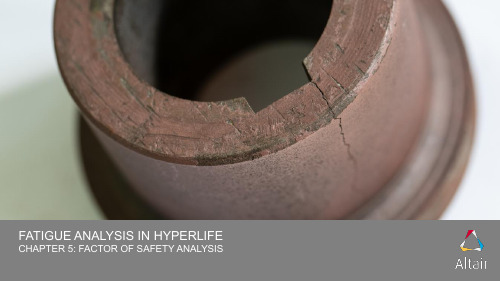
FATIGUE ANALYSIS IN HYPERLIFE CHAPTER 5: FACTOR OF SAFETY ANALYSISHYPERLIFE疲劳分析内容1.疲劳分析流程及HyperLife界面介绍2.疲劳分析基本概念3.高周疲劳(S-N)4.低周疲劳(E-N)5.安全因子分析6.焊缝疲劳安全因子分析•Dang Van安全因子评价准则•采用HyperLife进行安全因子计算DANG VAN方法介绍•Dang Van方法用来预测结构能否经历无限寿命•可以使用Dang Van方法进行分析的部件包括:➢承受多轴循环载荷的汽车零部件➢螺旋桨轴➢喷气式涡轮叶片DANG VAN CRITERION AND THE FACTOR OF SAFETY (FOS)•安全系数采用Dang Van准则进行分析•Dang Van分析中的安全系数(FOS)的计算为一系列微观偏剪应力(Microscopic Deviatoric Shear Stress )和宏观静应力(Macroscopic Hydrostatic Stress )计算的FOS 值的最小值•FOS计算涉及整个加载历程,将微观偏剪应力和宏观静应力作为时间的函数来计算。
is the Microscopic Shear Stressis the Macroscopic hydrostatic Stressare material constants•如果FOS 小于1,零部件将不能经历无限寿命•当前仅支持Dang Van 方法计算多轴疲劳安全系数•设置有限元模型单位:➢选择有限元模型单位,以便有限元应力到SN曲线应力的转换。
•可采用多种方法定义安全区域•失效线可以指定为一个单一的线段,也可以通过剪切应力与静压力的多个连续连接点(曲线)来指定•可以在“Assign Material ”模块中设置扭转疲劳极限值和静压力灵敏度值•在HyperLife中通过TFL值设置安全边界•TFL 为实数•TFL为曲线•TFL为实数TFL= HSS * HP + τ;When τ = 0, HP = Tfl/ HSSTFL: 扭转疲劳极限, HP:静水压力,T (tau):微观剪应力, HSS:静水压力敏感系数•TFL为曲线➢x值为静水压力,y值为剪切力➢STHETA:安全区角度。
ncode疲劳分析流程

ncode疲劳分析流程英文回答:nCode Fatigue Analysis Workflow.1. Data Acquisition.Collect experimental data, such as load histories, strain measurements, and material properties.Ensure data accuracy and completeness.2. Data Preprocessing.Filter and smooth data to remove noise and improve accuracy.Convert data into a suitable format for nCode analysis.3. Material Characterization.Determine the material's fatigue properties, including the S-N curve and fracture toughness.Use experimental tests or material databases to obtain these properties.4. Finite Element Analysis (FEA)。
Create a detailed FEA model of the component under investigation.Apply the load histories as boundary conditions.Solve the FEA equations to obtain stress and strain distributions.5. Fatigue Analysis.Import the FEA results into nCode.Select appropriate fatigue criteria, such as theSmith-Watson-Topper (SWT) or Goodman criterion.Analyze the results to identify critical areas and estimate fatigue life.6. Visualization and Reporting.Generate fatigue contour plots and othervisualizations to illustrate the results.Create reports summarizing the analysis findings and recommendations.7. Design Optimization.Use the fatigue analysis results to identify areas for design improvement.Modify the component geometry or materials to reduce fatigue stresses and extend fatigue life.8. Verification and Validation.Validate the FEA model and fatigue analysis results through experimental testing or alternative methods.Ensure the accuracy and reliability of the analysis.中文回答:nCode疲劳分析流程。
ABAQUS_疲劳分析简介

Low-cycle Fatigue in Bulk Materials
• Results
Damage initiation at joint toe Cycle number 199
Damage evolution Cycle number 749
Damage evolution Cycle number 801
Low-cycle Fatigue at Material Interfaces
• The onset and fatigue delamination growth at the interfaces are characterized by using the Paris Law, which relates crack growth rates da/dN to the relative fracture energy release rate G,
• The details of choosing characteristic length will be discussed later.
• Note: c3 depends on the system of units in which you are working; care is required to modify c3 when converting to a different system units.
CYCLEINI Number of cycles to initialized the damage
Low-cycle Fatigue in Bulk Materials
• Damage evolution for ductile damage in low-cycle fatigue • Once the damage initiation criterion is satisfied at a material point, the damage state is calculated and updated based on the inelastic hysteresis energy for the stabilized cycle. • The rate of the damage (dD/dN) at a material point per cycle is given by
4-低周疲劳

= e + p =
+ 2
E
2K
November 11,
© 2019 Altair Engineering, Inc. Proprietary and Confidential. All rights reserved.
低周疲劳
•
材料在循环载荷下力学行为
➢ 经过少量循环结构破坏
•
低周疲劳采用应变寿命法,塑性应变是损伤的重要影响因素
•
应变寿命分析是基于这样一个事实,在关键位置的缺口根部存在应力集中,这些地方在疲劳
破坏前存在明显的塑性应变,因此必须采用弹塑性结果进行应变疲劳分析
November 11,
© 2019 Altair Engineering, Inc. Proprietary and Confidential. All rights reserved.
HYPERLIFE疲劳分析内容
1. 疲劳分析流程及HyperLife界面介绍
2. 疲劳分析基本概念
3. 高周疲劳(S-N)
4. 低周疲劳 (E-N)
5. 安全因子分析
6. 焊缝疲劳
November 11,
© 2019 Altair Engineering, Inc. Proprietary and Confidential. All rights reserved.
Method: Uni Axial, FE Model Units: MPA, Stress
Combination: Signed von, Certainty of Survival: 0.5,
Mean Stress Correction: SWT, Plasticity Stress Correction:
A literature survey on fatigue analysis approaches for rubber

* Corresponding author. Tel.: +1-419-530-8213; fax: +1-419-5308206. E-mail address: afatemi@ (A. Fatemi).
period during which cracks nucleate in regions that were initially free of observable cracks. The second phase is a period during which nucleated cracks grow to the point of failure. It will be seen that nucleation, growth, and final failure may all be rationalized in terms of the fracture mechanical behavior of rubber. There are, however, issues unique to the crack nucleation phase, which deserve careful study. Models for predicting fatigue life in rubber follow two overall approaches. One approach focuses on predicting crack nucleation life, given the history of quantities that are defined at a material point, in the sense of continuum mechanics. Stress and strain are examples of such quantities. The other approach, based on ideas from fracture mechanics, focuses on predicting the growth of a particular crack, given the initial geometry and energy release rate history of the crack. For each approach, existing theories are presented. A discussion of each approach’s strengths and limitations, and examples of how these approaches have been applied in engineering analysis are also included. Some of the information presented in this paper has been reviewed previously [5–13]. This literature survey updates these existing reviews to reflect recent and previously unnoticed developments. This survey also offers new interpretations of existing studies and theories, and identifies areas where additional research is needed. Another paper reviews factors that affect the fatigue life of rubber [14]. These include the effects of mechanical
MSC fatigue 实例-组件的疲劳分析

Solution Parameters
Open the Solution Params... form. On this form leave all the defaults except:
Chapter 4: Component S-N Analysis 145
Set Up the Fatigue Analysis
142 158
138 MSC Fatigue QuickStart Guide
Problem Description
Problem Description
A simple bracket as shown has a design life of 7 years (61,320 hours). Loading occurs at the end of the short section which has been welded and the component is constrained at both ends of the main bar. Because failure is known to occur at the weld, the finite element modeling at the loading point and the stresses found there can be ignored for the purposes of this exercise. The load applied in the model was 900 lbs total. In service, the component experiences loading of 3000 lbs in the direction of the finite element load and 7000 lbs in the reverse direction. This occurs once every 30 minutes. Only a 4% failure rate is allowed.
随机振动疲劳分析流程

随机振动疲劳分析流程## Random Vibration Fatigue Analysis Procedure.1. Define the random vibration environment.The random vibration environment is typically defined by a power spectral density (PSD) function. The PSD function describes the distribution of vibration energy over a range of frequencies. It can be measured using a vibration shaker or accelerometer.2. Create a finite element model of the structure.The finite element model (FEM) should be created using a software program such as ANSYS or Abaqus. The FEM should include all of the relevant structural components, such as beams, plates, and shells.3. Apply the random vibration environment to the FEM.The random vibration environment can be applied to the FEM using a variety of methods, such as the directfrequency response method or the modal superposition method.4. Calculate the stress response of the structure.The stress response of the structure can be calculated using the FEM. The stress response is typically expressedin terms of the root mean square (RMS) stress.5. Estimate the fatigue life of the structure.The fatigue life of the structure can be estimatedusing a variety of methods, such as the S-N curve method or the Miner's rule. The fatigue life is typically expressedin terms of the number of cycles to failure.## 随机振动疲劳分析流程。
ncode疲劳仿真操作流程

ncode疲劳仿真操作流程ENGLISH ANSWER.Introduction.Fatigue analysis is a critical aspect of engineering design, as it helps ensure the safety and durability of structures and components. nCode Fatigue is a powerful software tool that enables engineers to perform comprehensive fatigue simulations, taking into account various loading conditions, material properties, and environmental factors. This article provides a step-by-step guide to the nCode Fatigue simulation workflow, outlining the key steps involved in setting up, running, and analyzing fatigue simulations.Step 1: Model Setup.1. Import Geometry: Import the CAD geometry of the component or structure to be analyzed. nCode Fatiguesupports various CAD formats, including STEP, IGES, and Parasolid.2. Define Material Properties: Specify the material properties relevant to fatigue analysis, such as Young's modulus, Poisson's ratio, and fatigue strength coefficients.3. Create Load Cases: Define the loading conditionsthat the component will experience during its service life. Load cases can include static, dynamic, and environmental loads.4. Mesh the Model: Generate a mesh of the model using finite element analysis (FEA) techniques. The mesh density and element type should be carefully chosen to ensure accurate results.Step 2: Simulation Setup.1. Select Fatigue Criteria: Choose the fatigue criteria to be used in the simulation, such as the Goodman, Soderberg, or SWT criteria.2. Define Stress Concentration Factors: Identify any stress concentration areas in the model and apply appropriate stress concentration factors to account for their effects on fatigue life.3. Set Simulation Parameters: Specify the simulation parameters, including the number of cycles, time step, and convergence criteria.Step 3: Simulation Execution.1. Run the Simulation: Start the fatigue simulation and monitor its progress. nCode Fatigue utilizes advanced numerical algorithms to solve the fatigue equations and calculate fatigue damage accumulation.2. Monitor Results: Observe the simulation results in real-time, including the distribution of fatigue damage, stress, and strain.Step 4: Post-Processing.1. Analyze Fatigue Damage: Review the fatigue damage results and identify critical areas of the model that are prone to failure.2. Plot Damage Contours: Generate contour plots to visualize the distribution of fatigue damage throughout the model.3. Create Fatigue Life Estimates: Use the simulation results to estimate the fatigue life of the component under different loading conditions.Conclusion.By following these steps, engineers can leverage nCode Fatigue to perform comprehensive fatigue simulations, providing valuable insights into the fatigue behavior of their designs. This enables them to optimize designs for improved durability and safety, ensuring the reliability of their products in real-world applications.CHINESE ANSWER.简介。
疲劳分析流程-fatigue

疲劳分析流程-fatigue摘要:疲劳破坏是结构的主要失效形式,疲劳失效研究在结构安全分析中扮演着举足轻重的角色。
因此结构的疲劳强度和疲劳寿命是其强度和可靠性研究的主要内容之一。
机车车辆结构的疲劳设计必须服从一定的疲劳机理,并在系统结构的可靠性安全设计中考虑复合的疲劳设计技术的应用。
国内的机车车辆主要结构部件的疲劳寿命评估和分析采用复合的疲劳设计技术,国外从疲劳寿命的理论计算和疲劳试验两个方面在疲劳研究和应用领域有很多新发展的理论方法和技术手段。
不论国内国外,一批人几十年如一日致力于疲劳的研究,对疲劳问题研究贡献颇多。
关键词:疲劳UIC标准疲劳载荷IIW 标准S-N曲线机车车辆一、国内外轨道车辆的疲劳研究现状6月30日15时,备受关注的京沪高铁正式开通运营。
作为新中国成立以来一次建设里程最长、投资最大、标准最高的高速铁路,京沪高铁贯通“三市四省”,串起京沪“经济走廊”。
京沪高铁的开通,不仅乘客可以享受到便捷与实惠,沿线城市也需面对高铁带来的机遇和挑战。
在享受这些待遇的同时,专家指出,各省市要想从中分得一杯羹,配套设施建设以及机车车辆的安全性绝对不容忽略。
根据机车车辆的现代设计方法,对结构在要求做到尽可能轻量化的同时,也要求具备高度可靠性和足够的安全性。
这两者之间常常出现矛盾,因此,如何准确研究其关键结构部件在运行中的使用寿命以及如何进行结构的抗疲劳设计是结构强度寿命预测领域研究中的前沿课题。
在随机动载作用下的结构疲劳设计更是成为当前机车车辆结构疲劳设计的研究重点,而如何预测关键结构和部件的疲劳寿命又是未来机车车辆结构疲劳设计的重要发展方向之一。
机车车辆承受的外部载荷大部分是随时间而变化的循环随机载荷。
在这种随机动载荷的作用下,机车车辆的许多构件都产生动态应力,引起疲劳损伤,而损伤累积后的结构破坏的形式经常是疲劳裂纹的萌生和最终结构的断裂破坏。
随着国内铁路运行速度的不断提高,一些关键结构部件,如转向架的构架、牵引拉杆等都出现了一些断裂事故。
Fatigue Analysis-8-1-11

21
Seat Back Fatigue
22
S-N Curve Construction
S UTS
UTS/2
N 100
23
101
102
103
104
105
106
Seat Back Fatigue
• Most risky sections can be the recliner attachment plate or the back frame side member • Calculate the bending moment at each section • Calculate the stress at each section • Apply the factors to get real fatigue limit • Compare the stress at each section to the fatigue limit
• Seat Back Fatigue • Seat Cushion Fatigue
16
Surrogate Data Comparison
Carry-over seat frame, tested successfully at 100 kg load, 10000 cycles Current program requirements: 50 kg load, 20000 cycles Is it safe?
1.What type of fatigue? 2.What is the S-N curve? 3.What is the UTS of HSLA350? 4.Where is the most risky section? 5.How to calculate the stress? 6.What are the factors to consider?
Fatigue教程

• 采用Spot Weld,可准确预测点焊的疲劳寿命,优化
点焊的数量和大小,从而降低制造成本,增加产品可 靠性。
焊脚
热影响区域
MSC.Fatigue 焊接疲劳
• 预测薄壁结构的疲劳寿命, 例如:包括很多点焊和缝 焊的车身 • 利用MD Nastran和 MSC.ADAMS静力和动力 结果 • 自动提取
• 系统级的部件疲劳寿命
– 疲劳寿命预测工具和有限元工具无缝集成
MSC.ADAMS
DAC
FES
计算 & 显示寿命 或者损 伤 MSC.Fatigue
4. MSC.Fatigue功能
全寿命分析 (S-N)
• 全寿命法,即通常所说的应力~寿命法或S-N方法,该方法并不严格区分裂 纹产生和裂纹扩展,而是给出结构发生突然失效前的全寿命估计。 • 特色 – 雨流循环计数 – 名义应力修正 – 焊接结构 – 统计置信参数 – Palmgren-Miner 线性损伤 – 用户自定义循环 – 材料和部件的 S-N – 表面条件 – 安全系数分析 – 多轴状态指示
Hub Strain
• 便于:
time
物理应变片
– 获取难以测量位置处的 信息 – 补充缺失数据和获得新 数据
Hub Strain
• 降低验证Leabharlann 本time虚拟应变片
• 测试数据用于疲劳分 析
多轴疲劳
• 预测结构在多轴应力状态下的疲劳寿命。与 常用的单轴或比例载荷情况不同,多轴疲劳 方法采用了非比例、多轴应力状态假设,并 通过裂纹扩展法预估结构寿命,分析结构的 安全系数。 • 多轴疲劳强调在非比例加载下的多轴应力应 变状态 – 多轴应力状态下的塑性建模 – 四种临界面模型(Fatemi-Socie 等) – 使用多轴雨流计数的Wang-Brown方法 – 多轴安全系数分析 - Dang Van & McDiarmid 方法 – 损伤、寿命云纹图. – 损伤极坐标图
随机振动疲劳分析流程
随机振动疲劳分析流程Random vibration fatigue analysis is a critical process in engineering design and analysis. It involves predicting the life of a structure subjected to random vibrations, such as those experienced in vehicles, aircraft, and industrial machinery. This type of analysis is essential for ensuring the reliability and durability of components and systems under real-world operating conditions.随机振动疲劳分析是工程设计和分析中的一个关键步骤。
它涉及预测结构在随机振动下的寿命,例如车辆、飞机和工业机械中经历的振动。
这种分析对于确保组件和系统在实际运行条件下的可靠性和耐久性是至关重要的。
One of the main challenges in random vibration fatigue analysis is the uncertainty in the input loads. Unlike deterministic loading, which is well-defined and repeatable, random vibrations have unpredictable characteristics that make it difficult to accurately predict the fatigue life of a structure. This uncertainty requires the use of probabilistic methods and statistical tools to assess the effects of random loading on the structural integrity.随机振动疲劳分析中的主要挑战之一是输入载荷的不确定性。
Fracture Mechanics and Fatigue

Fracture mechanics and fatigue are crucial concepts in the field of materials science and engineering. Fracture mechanics deals with the study of how materials behave when subjected to stress, particularly focusing on the initiation and propagation of cracks. On the other hand, fatigue is the phenomenon where materials fail due to repeated loading and unloading cycles, leading to the gradual growth of cracks until catastrophic failure occurs. Understanding these phenomena is essential for designing safe and reliable structures in various industries, such as aerospace, automotive, and civil engineering. One of the key aspects of fracture mechanics is the concept of stress intensity factor, which quantifies the stress field near the tip of a crack and predicts the likelihood of crack propagation. By analyzing the stress distribution around a crack, engineers can assess the critical conditions under which a crack will grow and ultimately lead to failure. This knowledge is crucial for determining the safety margins of structures and components, ensuring that they can withstand the expected loading conditions throughout their service life. Fatigue, on the other hand, poses a different challenge for materials engineers. Unlike static loading, fatigue loading involves cyclic stress variations that can lead to crack initiation and propagation even at stress levels below the material's ultimate strength. This phenomenon is particularly critical in applications where components are subjected to repeated loading, such as aircraft wings, automotive suspension systems, and offshore structures. By studying the fatigue behavior of materials, engineers can predict the fatigue life of a component and implement strategies to mitigate fatigue failure, such as improving material quality, introducing surface treatments, or redesigning the component geometry. In practice, fracture mechanics and fatigue analysis are often combined to assess the structural integrity of complex systems. Engineers use advanced modeling techniques, such as finite element analysis and computational simulations, to predict the behavior of materials under different loading conditions. By incorporating experimental data and theoretical models, engineers can optimize the design of structures and components to minimize the risk of failure due to fracture or fatigue. This integrated approach allows engineers to balance performance, cost, and safetyconsiderations in the design process, ensuring that structures meet the required standards and regulations. Despite the advancements in materials science and engineering, challenges still exist in predicting and preventing fracture and fatigue failures. The complex nature of material behavior, combined with the variability of loading conditions and environmental factors, makes it difficult to accurately predict the lifetime of structures and components. Moreover, unexpected failure events can have catastrophic consequences, leading to injuries, financial losses, and damage to the environment. As such, ongoing research and development efforts are focused on improving the understanding of fracture mechanics and fatigue behavior, developing new materials with enhanced durability and reliability, and implementing advanced testing and monitoring techniques to detect early signs of damage. In conclusion, fracture mechanics and fatigue are fundamental concepts in materials science and engineering that play a crucial role in ensuring the safety and reliability of structures and components. By studying the behavior of materials under different loading condition likelihood of crack initiation and propagation, assess the fatigue life of components, and optimize the design of structures to minimize the risk of failure. While challenges exist in predicting and preventing fracture and fatigue failures, ongoing research and development efforts are aimed at improving our understanding of material behavior and developing innovative solutions to enhance the durability and performance of engineering systems. By addressing these challenges, engineers can continue to push the boundaries of materials science and engineering, creating safer and more sustainable structures for the future.
疲劳分析与MSC.Fatigue
+∞
0
& ⋅ f (a , y & )dy & y
马 天 飞
γ =∫
+ a
+∞
0
− 2 σ & ⋅ f (a , y & ) dy & = Y& ⋅ e 2σ Y y 2πσ Y
a2
24
Ø4
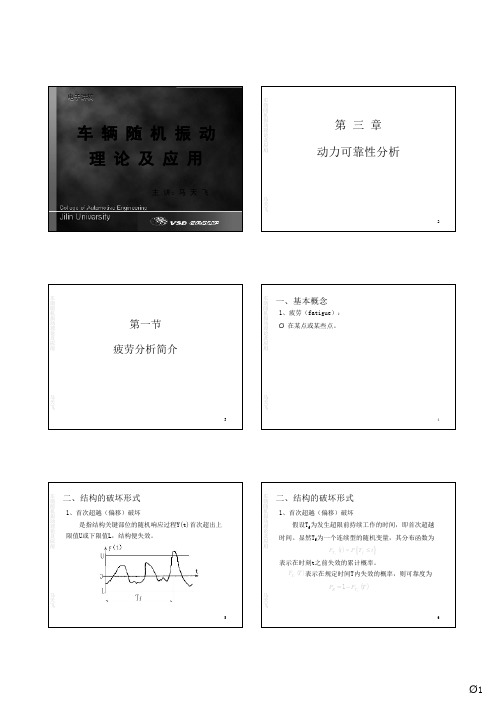
车 辆 随 机 振 动 理 论 及 应 用
四、正穿越a的期望频率
Ø 正穿越y=0的期望频率为
+ γ0 =
二、平稳宽带过程的峰值分布
Ø 随机过程 Y(t) 的 极 大 值( 峰 值)出 现 的 平 均 频率 称 为 极 大值频率。 Ø 平稳宽带过程Y(t)的峰出现 的条件是,在t时刻
& (t ) = 0 且 && y y (t ) < 0
马 天 飞
Ø 曲线关于直线是不对称的; Ø 当 a = σ Y 时,曲线有极大值; Ø 峰值 P非常小或非常大的概率很小,而且大多数峰值都出现在 标准差附近。 (例题3-2)
Ø 在dt时间内正穿越y=a的平均次数为 γ dt 。 Ø 显然,当dt很小时,可以认为dt时间内正穿越y=a的 平均次数与dt内发生正穿越a的事件的概率是相等的。 即
+ γa dt = dt ∫ +∞ 0
+ a
& ⋅ f (a , y & )dy & y
车 辆 随 机 振 动 理 论 及 应 用
四、正穿越a的期望频率
马 天 飞
11 12
Ø2
车 辆 随 机 振 动 理 论 及 应 用
二、窄带过程的理想化自谱
Ø 将响应过程的自谱曲线理想化成直线,用下式描述
Altair疲劳分析(RADIOSS)和优化(OptiStruct)功能介绍

S3 S4 S5
Cruise-Normal Cruise-Turbulence Descend Land
Altair Proprietary and Confidential Information
Hysteresis loop
σ
1/ n′
Neuber correction
∆σ ∆σ Fig. Definition of stable stress-strain curve∆ε = + 2 E 2K ′
Neuber correction
1/ n′
σε = σ eε e
Linear elastic FE results -> elastic-plastic results
Examples Concluding remarks
Altair Proprietary and Confidential Information Copyright © 2008 Altair Engineering, Inc. All rights reserved.
Stress-Life (S-N) Approach (RADIOSS 9.0) S-N Curve gives the relationship between nominal stress and cycles to failure.
̶ ̶ ̶ ̶ Max./Min. Principal, Max. Abs. Principal; Von Mises, Signed Von Mises; Tresca, Signed Tresca; One of the 6 stress components;
简述疲劳损伤累计假说

简述疲劳损伤累计假说
Miner 疲劳法则是一种疲劳累计损伤定律,它认为部分疲劳损伤可以线性相加。
Miner 疲劳法则的基本介绍COUNTING ALGORITHM FOR ACCUMUNITED FATIGUE ANALYSIS在声疲劳实验中,实际疲劳寿命的估算可以用疲劳累积损伤定律,最简单的是线性 Miner 疲劳法则,它认为部分疲劳损伤可以线性相加。
例如,有两种荷载,为荷载的损伤周数,为荷载的损伤周数。
若先加周的荷载,那么损伤部分为。
设为在荷载下的剩余损伤疲劳寿命(周数),则按 Miner 定律有,和可以由实验获得的曲线上求出。
对于多个荷载,可由实验得出相应损伤周数,根据判别式,认为结构不会产生疲劳损伤,满足抗疲劳要求。
疲劳分析
•
The cumulative fatigue damage on the car body from the proving ground test can be predicted by determining the fatigue cycle events and their corresponding fatigue lives The damage D in terms of percentage is calculated by Miner’s Rule as: k l
•
The torsional fatigue constant cannot be obtained from tests easily and an estimate has to be made: tf = 0.54ƒ and bo = b
Spotweld Fatigue Life Prediction
Fatigue Analysis in Post-Processor
Introduction
The PreSys software includes a fatigue post processing function, which allows users to analyze the model results, to determine the fatigue life of the system or component as a result of an event-type loading.
Case Study (continued)
• Taking the pothole track as an example,
– i is equal to 2, l (determined from the rainflow counting method) is equal to a certain number, say 20 – n2 is equal to110,000 (say).
疲劳用英语怎么说
疲劳用英语怎么说疲劳是一种主观不适感觉,但客观上会在同等条件下,失去其完成原来所从事的正常活动或工作能力。
那么你知道疲劳用英语怎么说吗?下面一起来学习一下吧。
疲劳英语说法1fatigue疲劳英语说法2tired疲劳的相关短语:疲劳测试 Fatigue T est ; Endurance Test ; endurance load弯曲疲劳 Bending fatigue ; flexural fatigue声疲劳 acoustic fatigue听觉疲劳 auditory fatigue ; fatigue auditory过度疲劳overfatigue ; overtoil ; excessive tiredness ; defatigation疲劳分析Fatigue Analysis ; Fe-safe ; fatigue of concrete in tension疲劳载荷 fatigue load疲劳的英语例句:1. Lack of exercise can lead to feelings of depression and exhaustion.缺乏锻炼会导致抑郁和疲劳。
2. Peppermint leaves are believed to relieve tiredness and nasal stuffiness.据信薄荷叶可以减轻疲劳和鼻塞。
3. Symptoms of anaemia include weakness, fatigue and iron deficiency.贫血的症状包括虚弱、疲劳和缺铁。
4. Losing a lot of blood makes you tired and anaemic.失血过多会导致你疲劳并且贫血。
5. Chronic fatigue is also one of the salient features of depression.慢性疲劳也是抑郁症的显著特点之一。
- 1、下载文档前请自行甄别文档内容的完整性,平台不提供额外的编辑、内容补充、找答案等附加服务。
- 2、"仅部分预览"的文档,不可在线预览部分如存在完整性等问题,可反馈申请退款(可完整预览的文档不适用该条件!)。
- 3、如文档侵犯您的权益,请联系客服反馈,我们会尽快为您处理(人工客服工作时间:9:00-18:30)。
Training Course on Offshore Structures14-24 July 2008at L & T Valdel Office, BangaloreDepartment of Ocean EngineeringIndian Institute of Technology Madras Offshore Structures –Fatigue Analysis FATIGUE ANALYSIS AND DESIGN21 July 2008Dr. S. Nallayarasu Department of Ocean Engineering Indian Institute of Technology Madras-363Where to Check Fatigue ?Any Connections subjected to cyclic stresses. e.gTubular Connections (Brace-Chord Interface)Tubular transitions both in thickness and diameter (inline fatigue )Plated Connections (Numerous types of connection configurations in offshore structures)Offshore Structures –Fatigue Analysis What Methods are available ? Simple Cumulative Fatigue Damage MethodProven method, for many yearsSimple but not reflecting the actual scenrio Still lot of studies going onFracture Mechanics MethodRecently getting popular but still need lot of researchLack practical application as it involves estimate of initial crack width21 July 2008Dr. S. Nallayarasu Department of Ocean Engineering Indian Institute of Technology Madras-365Fatigue ConceptFatigue can occur where there is aDiscontinuityChange in stress pathChange in thickness Change in materialApplied load is cyclicOffshore Structures –Fatigue Analysis Typical T Joint21 July 2008Dr. S. Nallayarasu Department of Ocean Engineering Indian Institute of Technology Madras-367Location of Saddle and Crown Offshore Structures –Fatigue Analysis But Welded Connection21 July 2008Dr. S. Nallayarasu Department of Ocean Engineering Indian Institute of Technology Madras-369Fabrication MisalignmentOffshore Structures –Fatigue Analysis Tubular Misalignment21 July 2008Dr. S. Nallayarasu Department of Ocean Engineering Indian Institute of Technology Madras-3611FATIGUE ANALYSIS STEPSFatigue analysis methodJacket ModelWave Climate (Scatter Data)Hydrodynamic CoefficientsStructural ResponseCyclic Stress CalculationsDynamic Amplification FactorSCF equationsS-N curveFatigue Damage CalculationsFactor of Safety Offshore Structures –Fatigue Analysis WAVE SCATTER DATAJOINT OCCURANCE DATADIRECTIONAL SCATTER DATA21 July 2008Dr. S. Nallayarasu Department of Ocean Engineering Indian Institute of Technology Madras-3613JOINT OCCURANCE DATA FOR WAVE HEIGHT AND PERIOD H maxOffshore Structures –Fatigue Analysis1521 July 2008Dr. S. NallayarasuDepartment of Ocean EngineeringIndian Institute of Technology Madras-36 Offshore Structures –Fatigue Analysis1721 July 2008Dr. S. NallayarasuDepartment of Ocean EngineeringIndian Institute of Technology Madras-36 Offshore Structures –Fatigue Analysis FATIGUE ANALYSIS METHODSSimplified FatigueAnalysisDetailed FatigueAnalysisDeterministic MethodSpectral Method(Stochastic)21 July 2008Dr. S. Nallayarasu Department of Ocean Engineering Indian Institute of Technology Madras-3619SIMPLIFIED FATIGUE ANALYSISUsed only for preliminary screening of joints for fatigue strength and will be used in concept stageMethod is based punching shear concept for tubular joints using allowable hot spot stresses compared with applied stresses Method is described as below.Static analysis using design wave as per API RP 2A clause 2.3.4-3Compute allowable hot spot stress using API RP 2A Figure C51-1 and 2Unity Check calculated and must be less than 1Offshore Structures –Fatigue Analysis DETERMINISTIC FATIGUE ANALYSISUsed for Detail design of jackets in water depth less than 400 ft and natural period less than 3 secondsMethod is based on Cumulative fatigue Damage concept Method is described as below.Establish sea-state scatter data and define applied cycles (n) for each wave (sea-state is described by discrete waves)Static analysis using design sea-state waves (DAF can be inlcuded)Compute nominal stresses at the brace chord intersectionsCompute SCF using efthymiou equationsCompute Hot Spot Stress Range (HSSR) = nominal stress range x SCFSelect Suitable S-N curve and find out the allowable number of cycles (N) for each wave Cumulative fatigue damage (D) is calculated by adding damage for all waves ∑=)/(N n D21 July 2008Dr. S. NallayarasuDepartment of Ocean Engineering Indian Institute of Technology Madras-3621Wave Scatter diagramDamage scatterdiagramS-N Curves “Centre of Damage”seastateLinearised foundation3-D structure computer model •wave loads•stiffness* -Dynamic analysisLong term cumulative distribution of waveheightsWave heights and periodsE N V I R O N M E N T A L A N DF A T IG U E D A T A & S T R U C T U R A L C O N F I G U R A T I O ND E T E R M I N I S T I C W A V E SContd….Number of occurrences of each deterministic waveOffshore Structures –Fatigue AnalysisNumber ofoccurrences of each stress range valueMiner’s ruleFigure livesS-N CurvesS T R E S S R A N G E S T A T I S T I C SF A T IG U E D A M A G ES T R E S S R A N G E SStructuralanalysisHot spot stress range valuesStressConcentration factorsF o r e a c h w a v e d i r e c t i o n a n dE a c h d e t e r m i n i s t i c w a v eF o r a l l l o c a t i o n s i n s t r u c t u r e21 July 2008Dr. S. NallayarasuDepartment of Ocean Engineering Indian Institute of Technology Madras-3623SPECTRAL FATIGUE ANALYSISUsed for Detail design of jackets in water depth less than400 ft and natural period more than 3 secondsMethod is based on Cumulative fatigue Damage concept Method is described as below.Establish sea-state scatter data and define applied cycles (n) for each wave (sea-state is described spectra, PM, ISSC, JONSWAP)Static / dynamic analysis using design sea-state waves Compute nominal stresses at the brace chord intersections Compute SCF using efthymiou equationsCompute Hot Spot Stress Range (HSSR) = nominal stress range x SCFSelect Suitable S-N curve and find out the allowable number of cycles (N) for each waveCumulative fatigue damage (D) is calculated by adding damage for all waves ∑=)/(N n D Offshore Structures –Fatigue AnalysisWave Scatter diagramDamage scatterdiagramS-N Curves “Centre of Damage”seastateLinearisedfoundation3-D structure computer model •wave loads * mass*•stiffness * damping** -Dynamic analysisWavefrequencies and wave heightsNatural frequencies*E N V I R O N M E N T A L A N DF A T IG U E D A T A & S T R U C T U R E C O N F I G U R A T I O NW A V E S F O R D E T E R M I N I N G T R A N S F E R F U N C T I O N SContd….21 July 2008Dr. S. NallayarasuDepartment of Ocean Engineering Indian Institute of Technology Madras-3625Offshore Structures –Fatigue Analysis Short term statisticsLong term cumulative distribution of hot spot stress rangesWave SpectrumMiner’s ruleFigure livesS-N CurvesS T R E S S R A N G E S T A T I S T I C SF A T IG U E D A M A G EHot spot stress range transfer functionsNominal member stressesStructural analysis(dynamic)*Stressconcentration factorsS T R E S S T R A N S F E R F U N C T I O NF o r a l l l o c a t i o n s i n s t r u c t u r eF o r e a c h w a v e d i r e c t i o nF o r e a c hF o r e a c h T R F f r e q u e n c yS e a s t a t e i n s c a t t e r d i a gOffshore Structures –Fatigue AnalysisPM SPECTRA452)(1exp[)(4)(−−=z z z sh fT fT T H f S ππ=)(f S h Single sided spectral density of waveamplitude )(2ncy unitfreque m Significant wave height (m)Zero up-crossing period (sec)Wave frequency=s H =z T =f Where21 July 2008Dr. S. NallayarasuDepartment of Ocean Engineering Indian Institute of Technology Madras-3627CENTRE OF FATIGUE DAMAGEzii bm sii T P HD =======i zi si i P T H b m D Damage of the ith sea-state Slope of the S-N curveSlope of log-linear wave height versus stress (assumed 1.80)Significant wave height of the ith sea-state Zero up-crossing period of the ith sea-state Probability of occurrence of the ith sea-stateWhereOffshore Structures –Fatigue AnalysisEQUIVALENT WAVE HEIGHT AND PERIODisii zisiiSD T D T D H D H ∑∑==21 July 2008Dr. S. NallayarasuDepartment of Ocean Engineering Indian Institute of Technology Madras-3629Hydrodynamic coefficientsStorm Waves (Large in relation to Size of members)Cd –0.65 (Clean), 1.05 (Rough) Cm –1.6 (Clean), 1.2 (Rough)Fatigue Waves (Small in relation to Size of members)Cd –0.5 (Clean), 0.8 (Rough) Cm –2.0 (Clean), 2.0 (Rough)Cd and Cm depends on the flow field and the structure size and related by Keulegan-Carpenter NumberDT U K m 22=Offshore Structures –Fatigue AnalysisWave DirectionsMinimum 8 Directions for 4 or 8 Leg jacketMinimum 12 Directions for Tripod21 July 2008Dr. S. NallayarasuDepartment of Ocean Engineering Indian Institute of Technology Madras-3631Wave DirectionsOffshore Structures –Fatigue AnalysisGeneration of Cyclic StressesVarious Methods available to generateSimplest will be to calculate static stress amplitude and multiply by a factor 2 (if we know that the stress variation is simple sinusoidal variation)Using wave loads options to generate stresses at crest and trough positions of the passing wave and the difference is the stress range21 July 2008Dr. S. NallayarasuDepartment of Ocean Engineering Indian Institute of Technology Madras-3633Generation of Cyclic StressesBut due to the complexity of the structure like jacket, the methods are not so simpleThe methods available in SACS can be usedWave load with MS and NS options, i.e. Maximum Base shear (MS) andMinimum base Shear (NS), the resulting difference in these two load cases will give the stress rangeOffshore Structures –Fatigue Analysis21 July 2008Dr. S. NallayarasuDepartment of Ocean Engineering Indian Institute of Technology Madras-3635Offshore structures are subjected to dynamic loadsfrom wave, wind and deck machinaryDynamic loads with specific cyclic period close to thenatural period may cause resonanceIn order to assess the vulnerability of the structureagainst dynamic loads, natural period and associated characteristics is requiredFor Simple systems such as cantilevers, simplysupported beams, fixed beams closed form solutions are available to calculate the natural period where as for large structures, FEM methods are usedOffshore Structures –Fatigue AnalysisWhy we need to do Dynamic AnalysisFixed template type platforms have natural periods less than 4 Seconds Compliant structures have natural period in excess of 10 seconds Fatigue wave periods ~ 3 to 12 secondsStorm wave periods ~ 6 to 16 seconds21 July 2008Dr. S. NallayarasuDepartment of Ocean Engineering Indian Institute of Technology Madras-3637Inappropriately configured jacket withnatural period greater than 3 seconds could cause large problem with regards to fatigue loading as DAF will be very highHence as a first step in configuring a jacket structure, we need to asses the natural period quicklyDo remedies by making the jacket baselarger, more foundation piles, less deck mass (if possible)Offshore Structures –Fatigue AnalysisStructural Response –Static Analysis}*{}]{[DAF F X K = If the natural period of the platform is considerably away from fatigue waves, assumption of equivalent static analysis is acceptableSimple calculations for DAF using SDOF model for each of the wave period can be calculated and applied to the wave loads Simple Static Analysis either with Pile Soil Interaction or equivalent linearised foundation can be used.21 July 2008Dr. S. NallayarasuDepartment of Ocean Engineering Indian Institute of Technology Madras-3639DYNAMIC AMPLIFICATION222)2()1(1TT T T DAF n N ς+−=DampingOffshore Structures –Fatigue AnalysisStructural Response –Wave Response analysisIf the natural period of the platform is close to the fatigue waves, assumption ofequivalent static analysis is not acceptableSimple calculations for DAF using SDOF model for will result in very conservative or non-conservative results depending on theassumptions made on average wave periods for the calculation of DAFHence a Dynamic Wave Response analysis needs to be performedDue to iterative calculations in Free Vibration analysis, equivalent linearised Foundation is required21 July 2008Dr. S. Nallayarasu Department of Ocean Engineering Indian Institute of Technology Madras-3641Structural Response –Wave Response analysis 0}"]{[}]{[=+X M X K The dynamic wave response analysis requires the dynamic characteristicsThe results of dynamic analysis will be used in Dynamic Wave Response analysis to generate structure response}{}"]{[}']{[}]{[F X M X C X K =++Free Vibration AnalysisWave Response AnalysisOffshore Structures –Fatigue Analysis STRESS TRANSFER FUNCTIONA transfer function defines the range of cyclic stresses to wave ratio over a range of wave period (or frequency))(*)()(f F f H f R =Including DynamicsForcing Function Final Response21 July 2008Dr. S. Nallayarasu Department of Ocean Engineering Indian Institute of Technology Madras-3643STRESS TRANSFER FUNCTIONA transfer function defines the range of cyclic stresses to wave ratio over a range of wave period (or frequency)WaveHeightStress Cyclic f H / )(=}{}"]{[}']{[}]{[F X M X C X K =++Offshore Structures –Fatigue Analysis STRESS TRANSFER FUNCTIONDetermination of H(f) involves response of the structure for various wave frequency for unit amplitude wavesSelection of frequencies for generation of H(f) is important so that the peaks and valley of the transfer function are included21 July 2008Dr. S. Nallayarasu Department of Ocean Engineering Indian Institute of Technology Madras-3645Selection of wave frequency for transfer function Offshore Structures –Fatigue Analysis WAVE HEIGHT FOR TRANSFER FUNCTIONWave height for each frequency selected shall be definedThis can be calculated by assuming certain wave steepness. Typically the wave steepness of 1/20 to 1/25 can be usedA minimum wave height of 0.3m and the maximum of design wave shall be achieved to cover all ranges21 July 2008Dr. S. Nallayarasu Department of Ocean Engineering Indian Institute of Technology Madras-3647CYCLIC STRESS RANGEOffshore Structures –Fatigue Analysis TYPICAL STRESS TRANSFER FUNCTION21 July 2008Dr. S. Nallayarasu Department of Ocean Engineering Indian Institute of Technology Madras-3649df f S f H f T df f S f H hi RMS z hi iRMS )()()()(22020∞∞∫=∫=σσOffshore Structures –Fatigue Analysis ds RMS s s N s RMS s n D i i )exp()()(2202σσ∞∫=z T mL s n =)(Design LifeFraction ofDesign Life21 July 2008Dr. S. Nallayarasu Department of Ocean Engineering Indian Institute of Technology Madras-3651Stress Concentration Factors (SCF)SCF = Hot Spot StressNominal Stress•SCF can be evaluated using physical models testing•SCF can be computed using FEM model studies•SCF using Lloyds register equation•SCF using Efthymiou Equations•SCF using Kuang et al, or Alpha-KelloggOffshore Structures –Fatigue Analysis FEM Model of T Joint21 July 2008Dr. S. Nallayarasu Department of Ocean Engineering Indian Institute of Technology Madras-3653LOCAL INCREASE IN STRESSES Offshore Structures –Fatigue Analysis TYPES OF JOINTSSIMPLE JOINTSGROUTED TUBULAR JOINTSINTERNAL RING STIFFENED JOINTS OVERLAPPING JOINTSCALCULATION OF SCF FOR THE ABOVE JOINTS DIFFER21 July 2008Dr. S. Nallayarasu Department of Ocean Engineering Indian Institute of Technology Madras-3655GEOMETRIC CLASSIFICATIONTYKX COMBINATION OF THE ABOVEJOINTS ARE TREATED IN ONE PLANE –PLANER JOINTS Offshore Structures –Fatigue Analysis JOINT TYPES21 July 2008Dr. S. Nallayarasu Department of Ocean Engineering Indian Institute of Technology Madras-3657GROUTED PILE / LEG SECTIONPILE JACKET LEGGROUTOffshore Structures –Fatigue AnalysisANNULAR GROUTED TUBULAR JOINTS22Lp eq T T T +=Where p T is the thickness of pile wall and L T is the thickness of jacket leg .21 July 2008Dr. S. Nallayarasu Department of Ocean Engineering Indian Institute of Technology Madras-3659S-N CURVESVARIOUS TYPES OF S-N CURVES AVAILABLE FROMAmerican Welding Society, AWSAmerican Petroleum Institute API RP 2ADet Norske Vritas DNV RP C203American Bureau of Shipping, Guidance Health and Safety Executive, HSE UK Offshore Structures –Fatigue Analysis SCF FOR T JOINT -API RP 2A21 July 2008Dr. S. Nallayarasu Department of Ocean Engineering Indian Institute of Technology Madras-3661S-N CurvesStress-Cycles (S-N) curve is material characteristicsGenerated using experimental methods API RP 2A suggest use of X and X’curves for Tubular Joints (Now its is called WJ and Improved WJ)Health and Safety Executive (HSE) has many Classes of S-N curves for different connections including Tubular JointsOffshore Structures –Fatigue Analysis BASIC S-N CURVE (API RP 2A)21 July 2008Dr. S. Nallayarasu Department of Ocean Engineering Indian Institute of Technology Madras-3663S-N CURVES)(10)1(10)(10S mLog k Log N Log −=)(10log )1(10log 10s m k N −=Offshore Structures –Fatigue AnalysisS-N Curve Improved profile (API RP 2A)21 July 2008Dr. S. Nallayarasu Department of Ocean Engineering Indian Institute of Technology Madras-3665HSE S-N CURVE FOR NODAL JOINTSOffshore Structures –Fatigue Analysis FACTOR OF SAFETY (API RP 2A)∑==alli N n D 1FATIGUE DAMAGE MINERS’RULEn = Number of occurrences in each sea-state N = Allowable number of cyclesOffshore Structures –Fatigue AnalysisWhere to Check ?21 July 2008Dr. S. Nallayarasu Department of Ocean Engineering Indian Institute of Technology Madras-3669LOCAL FATIGUEComputation of Cyclic stresses using global loads can only maximise the global responseLocal member response needs to be looked into especially in deterministic analysisOffshore Structures –Fatigue Analysis RING STIFFENED JOINTS21 July 2008Dr. S. Nallayarasu Department of Ocean Engineering Indian Institute of Technology Madras-3671RING STIFFENED JOINTSRings are effective means of reducing SCF’s at brace / chord interfaceThe SCF’s at saddle get reduced considerably but not at the crownsIf the load is axial or OPB, the rings are effective but for IPB it is not effective in reducing the SCF’s at the Crown locationMay have to use Two rings just below the Crown to be effective in reducing the SCF at crownSCF’s at ring / chord interface shall be checked. This location being cannot inspect, keep the ring bending modulus to ring area high as much as 8 to 15.Offshore Structures –Fatigue Analysis OTHER FATIGUE ISSUESPile Driving fatigueWind induced FatigueFatigue non-tubular connections Fatigue on Topsides due to platform DisplacementFatigue on Riser and Wellhead piping21 July 2008Dr. S. Nallayarasu Department of Ocean Engineering Indian Institute of Technology Madras-3673Fatigue Life ImprovementProfile Grinding the weldWeld Toe grindingHammer peening of the weld toeSmoothening Weld caps in butt weldsPost weld heat treatmentAdding Internal rings Adding external reinforcements Offshore Structures –Fatigue Analysis WELD PROFILE21 July 2008Dr. S. Nallayarasu Department of Ocean Engineering Indian Institute of Technology Madras-3675TRANSITIONOffshore Structures –Fatigue Analysis BUT WLED。