A METHODOLOGY FOR ENTERPRISE PERFORMANCE MANAGEMENT
OpenText SAP测试服务商品介绍说明书

FlyerSAP T esting ServicesMeet Y our SAP Quality Challenges with OpenT ext SAP T esting ServicesExecutive SummarySAP matters. Users expect it to be robust, per-form, and function reliably. So you must improve the platform to match those expectations. The ever-increasing pace of change requires faster testing while ensuring current performance and existing functionality is not impacted.OpenT ext Professional Services offer a range of testing services to help your organization meet your SAP application delivery chal-lenges. The multiple test automation frame-works within our SAP testing services help you deliver high-quality changes to your SAP platform. We power our testing services with industry-proven OpenT ext Application Delivery Management (ADM) tools such as:■Application Lifecycle Management (ALM) ■Business Process T esting (BPT)■UFT One (UFT)■LoadRunner■Service VirtualizationUsing these tools and our considerable ex-pertise, OpenT ext Professional Services can rapidly complement your current SAP testing capability, or accelerate your efforts to new heights.SAP T esting Service TypesBecause every SAP platform is customized, every customer has different testing requirements. Our SAP testing services can be adapted to match your SAP test requirements and engagement model. We provide:■Functional T est Automation for SAP:A projectbased, fixedscope service using OpenT ext ALM, BPT, UFT and Service Virtualization platforms for system, integration or end-to-endSAP functional testing. ■Performance T esting for SAP: Use ourLoadRunner toolset to identify the causeof performance issues in your SAPplatform using fixedscope, fixed costload and performance testing.■T est Automation Frameworks for SAP:Let us build an SAP T est Frameworksuited to your SAP platform, and deliverusage and maintenance coaching.■T esting-as-a-Service (TaaS) for SAP:Created for those needing a moreextensive, predictable, but elastic testingservice, this engagement model includesfixed price testing deliverables andscalable, mixed-shore delivery.Functional T est Automationfor SAP ServicesThe OpenText Functional Test AutomationService for SAP is an opportunity to engagewith OpenT extProfessional Services experts;to discover how functional test automation canbuild, test, and execute a library of components,scripts, and test cases for their SAP platform.Activities generally include:■Expert consultations: We work withyour test/QA leads and SAP subjectmatter experts to review test requirementsand current test cases to determinethe most effective test automationscenarios.■Collaborative test plan: This covers thedetail that will deliver the required testingscope.■Automation: Potentially, new manual andautomated test cases, and the automationof older test cases.■T est cases: Manual and automated,executed to an agreed number test plan.■Documented feedback: OpenT ext will logany defects, and provide test executionresults and a comprehensive report.■Multi-methodology approach: We useeither traditional, iterative or agile methods.■Asset retention: Customers keep allengagement assets, and we coach userson using this capabilityWe have proved our practices, methodologies,approaches, standards, and templates in thefield of SAP platform quality and testing overmany years, across hundreds of projects. Wehave delivered our customers an acceleratedcapability to execute their SAP testing and en-joy new value from investments in OpenT extALM, BPT, UFT One and SV software.Performance T esting for SAPOpenText Performance Testing Servicesfor SAP is based on our industry-leadingLoadRunner software and measures applica-tion performance to reduce the risk of poorSAP platform performance in production. Theservice uses the LoadRunner SAP protocol tocreate iterative, automated test scripts, basedon customerdefined business processes ortest cases, to execute performance tests andprovide a summary of the run results.These results help you determine whether yourSAP platform changes are ready for productionor need further configuration and optimization.OpenT ext Performance T esting Services forSAP deliver validation services remotely forinternal, or Internet-accessible SAP servicesThis service includes:■An individual SAP performance testingprogram, including analysis, requirementscapture, and test plan creation.FlyerSAP T esting ServicesAutomated Scripts Virtualized ServicesFigure 1. A OpenT ext Performance test framework for SAP example■Performance test script creation and scenarios using OpenT ext LoadRunner technology, including any web generated load, and SiteScope profiles.■T est scenario execution, arranged iteratively for different performance test types.■Reports and log defects based on test results, and consultation with customer stakeholders.T est Frameworks for SAPWe deliver a rapidly implemented platform and SAP testing assets to help fill any knowledge or capacity shortfall, and the expertise to utilize the implemented test framework. We include these deliverables and activities:■Automation framework solution design, based on our ALM, BPT, UFT, LR and SV software, and third party integrations.■Ready-deployed software and integration solution.■Any testing script import or adaptation into the automation framework or test case automation to an agreed scope.■Mentoring for your team—you will be ready to begin using the framework solution. T esting-as-a-Service for SAPCustomer requirements for apps testing vary,and each customer is different. T estingasaService (TaaS) uses a fixed price, termbasedconsumption approach reducing the total costof quality, while increasing it.What Is T aaS?It is an elastic testing delivery model thatenables customers to scale their testing, withpredictable costs, based on fixedpriced test-ing deliverables.TaaS supports traditional, agile or hybrid ap-proaches to delivery and can work alongsideoutsourced delivery. We offer TaaS across allphases of testing, and for specific capabilitiessuch as functional, performance, security andmobile testing.How Is T aaS Priced?OpenT ext uses testing units, a relative mea-surement framework. Purchase units in min-imum monthly packs by ‘testing type’; theseassigned to your testing catalog services, asagreed through a OpenT ext term agreement.Consume them according to demand for SAPfor your preferred term and scope (see Figure 2).SAP T est Governance & PlanningValidate the prereqs, validate environments, build test plans, validate test dataSAP T est Execution & Optimization AssistExecute tests, results analysis & report, provide recommendations276641604820 Figure 2. Catalog Services & T est Unit examples for SAP T aaSFigure 3. OpenT ext Professional Services approach to T esting-as-a-ServiceWhat Does T aaS Include?Each T aaS service includes access to certified, platform-independent and highly productive OpenText testing professionals, enterprise testing methods, practices, and accelerators.How Does T aaS Work?Our TaaS model operates with the following basic tenets:■Managed test supply to ensure consistent, customer-focused engagement.■T esting on demand from a catalog with predictable costs.■Customers are empowered to manage their testing budgets.■Scaled up or down as required.■Full transparency—labor, expenses and other costs included.Why Choose T aaS?T aaS suits customers wanting to focus on their business and leverage our quality and testing expertise. T aaS lowers the cost of testing, im-proves time to-market, and minimizes risk by delivering testing services through a flexible, outcome-based delivery model.Why Choose OpenT extas Y our T aaS Partner?■Strong focus on outcomes with accountability■SLAs on quality and other business outcomes ■We bear any staff training and ramp upcosts■Governance using Internal dashboardsand KPIs■Flexible service packages with specificscope and SLAs■Decades of experience and IPThe OpenT ext ProfessionalServices DifferenceOpenT ext provides unmatched capabilities witha comprehensive set of consulting and imple-mentation services and unique intellectualproperty that help you drive innovation throughstreamlined and efficient software delivery:■Proven OpenT ext software solutionimplementation expertise.■More than 20 years of experience helpinglarge, complex, global organizations realizevalue from their OpenT ext softwareinvestments.■Rich intellectual property and unparalleledreach into product engineering.■Education and support servicesto ensure adoption.Learn MoreFind more information about our ProfessionalServices’ capabilities:OpenT ext Professional ServicesConnect with Us。
Oracle医疗大数据解决方案

幸存
危险人群
预防护理
Oracle 医疗大数据解决方案
Operating Systems
Systems Management
Virtual Machines
Middleware Platform and Management
Business IntelligenceData Integration
Identity & Access Management
Oracle Healthcare Transaction Base (HTB)
临床集成的基础事务性临床数据信息库基于 HL7 参考信息模型 (RIM) 标准规范化的医疗卫生数据模型适用于多个标准医疗卫生领域的域模型,例如患者就医、实验室结果、综合观察、开处方、医务或病历、 过敏症、结构化文档 (CDA)、诊断、疾病/问题……临床文档架构 (CDA R2)支持 CDA 文档保存和查询批量提取数据将 ELT 定向到数据仓库或数据集市IHE XDS.b Repository
Security Gateway
、
Oracle Health Sciences Policy Manager
Oracle Enterprise Manager
Oracle SOA Suite、Oracle Service Bus
数据库网格和 Coherence 缓存
Sun 硬件、Sun 存储、ExaData、ExaLogic
源数据提取HLI ETL
MDI ETL
元数据发布例外管理业务规则OHADI: WIL OHADI: SIL 验证, 标准化, 和转换主索引主数据管理和相关服务
数据集市
OBI-EE/Java报表即席查询 联机分析 数据挖掘“Real” Time
潜在供应商评估指南中英文

ppm-data, ppm数据
non conformance data, 不合格品数据
quality costs, 质量成本
第 6 页 共 9ห้องสมุดไป่ตู้ 页
A1a
Does the supplier have a process to update their business plan? 供应商是否有更新商业计划的流程?
第 1 页 共 93 页
潜在供应商评估指南
(吕志勇 王琳译)
第 2 页 共 93 页
评估范围
A – Management 管理
B - Technology and Development 技术与开发
hybrid method

hybrid methodHybrid MethodHybrid Method is a powerful technique that has been used in many areas of research and development, including optimization, simulation, control, and machine learning. A hybrid method combines the strengths of both numerical and symbolic methods to develop an efficient and accurate algorithm. In this article, we will discuss the basic concept, applications, advantages, and limitations of the Hybrid Method.Basic Concept of Hybrid MethodA hybrid method combines the numerical power of mathematical modeling and the symbolic power of algorithmic approach. It is designed to tackle difficult problems that are beyond the reach of traditional numerical and symbolic methods. Hybrid method is a methodology that integrates numerical and symbolic algorithms in a single algorithmic framework. It combines the numerical accuracy of numerical methods with the symbolic reasoning ofsymbolic methods, thus providing a powerful toolfor solving complex problems.Applications of Hybrid MethodHybrid method has wide applications in many areas. For example, in optimization problems,hybrid methods are used to combine the strengths of different optimization techniques such as linear programming, genetic algorithms, and simulated annealing. This combination of methods results in a more efficient and effective optimization method. Hybrid methods are also used in control systems, especially for modeling and control of complex systems such as power plants, chemical plants, and robotics.In machine learning, hybrid methods are used in the development of intelligent algorithms, such as support vector machines, deep learning, anddecision trees. These algorithms combine the advantages of both numerical and symbolic approaches, resulting in better accuracy and performance. Hybrid methods are also used in simulation, particularly in the simulation ofphysical systems, where mathematical models and simulations are combined to create a more accurate and realistic simulation.Advantages of Hybrid MethodThe main advantage of hybrid method is its ability to tackle complex problems that are beyond the reach of traditional methods. Hybrid methods are capable of handling problems that are mathematically complex, computationally intensive, or have high dimensionalities. The hybrid method also provides a robust and flexible framework that can handle different types of problems and data structures.Hybrid methods provide accurate and efficient solutions by combining the strengths of different approaches. They allow for a more holistic understanding of the problem by utilizing multiple perspectives. Additionally, these methods are extensible, meaning that they allow for the integration of new techniques and algorithms as they become available.Limitations of Hybrid MethodDespite the many advantages of hybrid methods, they also have some limitations. First, hybrid methods can be computationally intensive, and they may require high-performance computing resources. Additionally, these methods may be difficult to implement and may require specialized expertise. As such, they may not be accessible to less experienced users or those without access to advanced computing resources.Another limitation is that hybrid methods may not always result in the best solution. Although hybrid methods can provide accurate and efficient solutions, they may not always be the optimal solution. This is because the hybrid method relies on combining multiple methods, and the final solution can depend on the specific combination of methods used. Additionally, the hybrid method may not always be the most transparent approach. This means that it may be difficult to understand why the algorithm produced a particular result.ConclusionHybrid Method is an important and valuable technique that has been widely used in various fields of research and development. The hybrid method combines the strengths of both numerical and symbolic methods to develop an efficient and accurate algorithm. The hybrid method has been used in optimization, simulation, control, and machine learning. It provides accurate and efficient solutions by combining the strengths of different approaches. Although hybrid methods have limitations, they are still an essential tool for solving complex problems. As such, hybrid methods remain an important area of research and development, and we can expect to see continued growth and application of this technique in the future.。
les AS gR学生手册英文

Deploying with Oracle JDeveloper
To deploy an application with JDeveloper, perform the following steps: 1. Create the deployment profile. 2. Configure the deployment profile. 3. Create an application server connection to the target
第十六页,共33页,
Planning the Deployment Process
The deployment process includes:
1. Packaging code as J2EE applications or modules
2. Selecting a parent application
including those in a cluster
第十页,共33页,
Deploying with admin_client.jar
The admin_client.jar tool: • Is a command-line utility • Is executed by using the following basic command:
– defaultDataSource to select the data source used by the application for management of data by EJB entities
– dataSourcesPath to specify a application-specific data sources
西工大SPM2017填空题
1. _____ include people, hardware, software, or other assets.2. In project management, the three limitations of scope, time, and cost are referred to as the _____.3. The question, “What unique product does the customer expect from the project?”is an example of a(n) _____ constraint.4. The _____ of project management includes quality, scope, time, and cost constraints.5. _____ is “the application of knowledge, skills, tools, and techniques to project activities to meet project requirements.”6. Project management _____ describe the key competencies that project managers must develop.7. A(n) _____ is “a group of related projects managed in a coordinated way to obtain benefits and control not available from managing them individually.”8. The critical path is the _____ path through a network diagram that determines the earliest completion of a project.9. A(n) _____ refers to a product or service, such as a report, a training session, a piece of hardware, or a segment of software code, produced or provided as part of a project.10. In the _____ phase of the project life cycle, the work is completed, and customers should accept the entire project.11. A(n) _____ is a framework for describing the phases involved in developing information systems.12. _____ life cycle models of systems development assume that the scope of the project can be articulated clearly and the schedule and cost can be predicted accurately.13. The term _____ describes new approaches that focus on close collaboration between programming teams and business experts.14. _____ is an organization’s acquisition of goods and services from an outside source.15. The three spheres of systems management are business, organization, and _____.16. _____ the project includes work required to introduce any new hardware, software, and procedures into normal operations.17. A(n)_____ is a series of actions directed toward a particular result.18. _____ progress from initiation activities to planning activities, executing activities, monitoring and controlling activities, and closing activities.19. A(n) _____ describes how things should be done.20. A(n) _____ is a meeting held at the beginning of a project so that stakeholders can meet each other, review the goals of the project, and discuss future plans.21. A risk register is the output of _____.22. The _____ is a very important tool in project management because it provides the basis for deciding how to do the work.23. A(n) _____ is the person responsible for the business value of the project and for deciding what work to do and in what order when using a Scrum method.24. A(n) _____ is a set period of time, normally two to four weeks, during which specific work must be completed and made ready for review when using Scrum methods.25. A(n) _____ is the person who ensures that the team is productive, facilitates the dailyScrum, enables close cooperation across all roles and functions, and removes barriers that prevent the team from being effective.26. A(n) _____ is a cross-functional team of five to nine people who organize themselves and the work to produce the desired results for each sprint.27. A(n) _____ is a Scrum artifact and consists of the highest-priority items from the product backlog to be completed in a sprint.28. _____ are short descriptions written by customers of what they need a Scrum system to do for them.29. The most time and money should be spent on30. If done well, the _________ can produce several releases of useful software.31. parallel/while32. large scale of small changes33. _____ are short descriptions written by customers of what they need a Scrum system to do for them.34. ______describe the work required to ensure that the project includes all the work and only the work required to complete the project successfully are collectively。
CH3知识要点
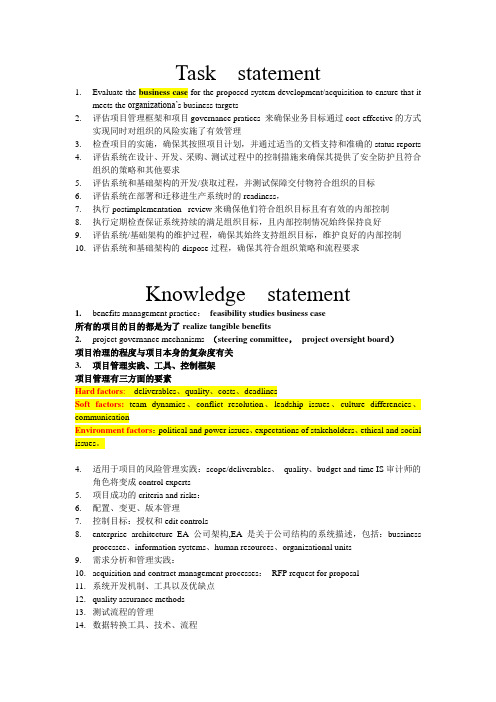
Task statement1.Evaluate the business case for the proposed system development/acquisition to ensure that itmeets the organizationa’s business targets2.评估项目管理框架和项目governance pratices 来确保业务目标通过cost-effective的方式实现同时对组织的风险实施了有效管理3.检查项目的实施,确保其按照项目计划,并通过适当的文档支持和准确的status reports4.评估系统在设计、开发、采购、测试过程中的控制措施来确保其提供了安全防护且符合组织的策略和其他要求5.评估系统和基础架构的开发/获取过程,并测试保障交付物符合组织的目标6.评估系统在部署和迁移进生产系统时的readiness,7.执行postimplementation review来确保他们符合组织目标且有有效的内部控制8.执行定期检查保证系统持续的满足组织目标,且内部控制情况始终保持良好9.评估系统/基础架构的维护过程,确保其始终支持组织目标,维护良好的内部控制10.评估系统和基础架构的dispose过程,确保其符合组织策略和流程要求Knowledge statement1.benefits management practice:feasibility studies business case所有的项目的目的都是为了realize tangible benefits2.project governance mechanisms (steering committee,project oversight board)项目治理的程度与项目本身的复杂度有关3.项目管理实践、工具、控制框架项目管理有三方面的要素Hard factors:deliverables、quality、costs、deadlinesSoft factors:team dynamics、conflict resolution、leadship issues、culture differencies、communicationEnvironment factors:political and power issues、expectations of stakeholders、ethical and social issues。
Performance Analysis of a Real-Time Java

Performance Analysis of a Real-Time JavaExecution Environment for IEC 61499Kleanthis C. Thramboulidis, George S. Doukas, Alkiviadis ZoupasElectrical and Computer Engineering, University of Patras, 26500, Greece(e-mail: {thrambo, gdoukas}@ upatras.gr, azoupas@upnet.gr).Abstract: The IEC 61499 standard enhances the 1131 Function Block model to exploit the advantages of the object technology in the industrial automation domain. Several prototype development environments have been developed by various research groups and the first commercial tools that support this model are already in the market. However, the absence of mature run-time environments that will allow the execution of IEC 61499 compliant applications is still evident. Even for the existing ones, there is no evidence about their efficiency to meet real-time constraints imposed by this kind of applications. Benchmarking of run-time environment is required to prove that these environments can be considered for the development of real-time applications. In this paper, a benchmarking framework is described and it is used to analyze the performance of an IEC 61499 run-time environment that is based on the real-time Java Specification. The recently released IBM and Sun RTSJ implementations are used to demonstrate the effectiveness of the RTSJ based framework. Performance results prove the applicability of the proposed run-time environment and the model driven approach that was adopted, in the control and automation domain.Keywords: IEC 61499, Function Block, Real-Time Java, RTSJ, run-time environment, performance analysis, benchmark.1. INTRODUCTIONThe Function Block (FB) construct is a well-known and widely used by control engineers. It was first introduced by the IEC 61131 standard on programming languages for programmable logic controllers, and was later extended by the IEC’s 61499 standard (IEC 61499, 2005) to share many of the well defined and already widely acknowledged benefits of object technology. The IEC 61499 describes a methodology that utilizes the FB as the main building block and defines the way that FBs can be used to define robust, re-usable software components that constitute complex distributed control systems (DCSs). Complete control applications, can be defined by one or more FB Networks (FBNs) that specify event and data flow among function block or sub application instances. The event flow determines the scheduling and execution of the operations specified by each function block’s algorithm(s).The majority of control and automation software deals with applications with more or less strict timing constrains. Although IEC 61499 does not provide a way to capture these constraints, the final executable should be deterministic, thus runtime timing behaviour of execution environments should be provided. Moreover, the standard intentionally leaves a lot runtime issues open to be defined later by developers. This results in IEC 61499 runtime implementations that demonstrate various execution behaviours, which may confuse control application engineers. To address the above issues, benchmarking proves to be a very useful tool, enabling better understanding and evaluation of the runtime behavior of IEC 61499 compliant execution environments.In this paper a framework for the benchmarking of IEC 61499 FB applications is described. The FB instance and the FB network are analyzed and specific measurements for the benchmarking are defined. A real-time Java based run-time environment, the RTSJ-AXE, is used to demonstrate the proposed benchmark. This work also proves the efficiency of the RTSJ-AXE run time environment for the real-time domain.The remainder of this paper is organized as follows: Background and related work is presented in the next section. The real-time Java execution environment that is used as basis for this work is described in section 3. Performance analysis and results are presented in section 4, and finally the paper is concluded in section 5.2. BACKGROUND AND RELATED WORKThe IEC 61499 standard enhances the 1131 Function Block model to exploit the benefits of the object technology in the industrial automation domain. It also proposes a methodology for the development of control applications based on the component concept. The Function Block is defined as the main building block that can be used by the control engineer to define the model of his application. The FB type, which defines the structure and behaviour of FB instances, is composed of a head and a body. The body encapsulates the algorithms and internal data; it is connected to input eventsProceedings of the 13th IFAC Symposium on Information Control Problems in ManufacturingMoscow, Russia, June 3-5, 2009and generates output events. The head captures the dynamics of the FB; it consumes the input events, triggers the execution of algorithms and generates output events. The dynamics of the head are specified by a special kind of state transition diagram that is called execution control chart.Several research groups are working to provide run-timeenvironments for IEC 61499 based DCSs. The FBRT () is the first run-time environment for IEC 61499 based control applications. FBRT utilizes Java but it supports neither timeliness, nor the run-time re-configurability of the system. The method invocation paradigm, which is adopted for the implementation of event connections, and the non-determinism of the Java platform make the environment inappropriate for real-time applications and imposes many restrictions to its use in real world applications. IsaGraph (/), a well known commercially available toolset for the IEC 61131, includes in its latest version support for IEC 61499. The proposed execution environment, even though not completely compliant with the standard, provides the first commercially available tool that supports it. The Fuber execution environment is under development at Chalmers University of Technology (Cengic et al. 2006). The 4DIAC-RTE (/) is a runtime environment that is provided in a PC version and an embedded ARM7 based version (Sunder et al. 2007) . These environments are not currently described in publicly available documents regarding the adopted implementation policies; performance measurements are not available. A FB-based model to support configuration and reconfiguration of DCSs is proposed and its implementation on real-time Java is discussed in Brennan et al. (2002). However, no proof of concept neither a prototype implementation is provided for the above real-time Java based approach. Benchmarking of IEC61499-compliant runtime environments is an issue of interest for researchers for the last couple of years. Soundararajan et al. (2007), study an agent-based software design pattern, utilized for the benchmarking of real-time distributed control systems, such as IEC61499, and applied it on a hybrid physical/simulation environment. Sunder et al. (2007), proposed a set of benchmarks to evaluate the capabilities (performance) of different IEC 61499 runtime environments regarding the execution of basic FBs and FB networks. Key steps of the basic FB execution procedure were identified and utilized to produce timing characteristics of FB execution on two different environments the C++FBRT and the MARTE. However, the proposed benchmark does not address the reconfiguration related characteristics of the run time environment. Both run-time environments are not described in any publicly available publication so it is not possible to understand the different behaviours for the described execution application scenarios, i.e., mixed serial and parallel and tree structure. The C++ FBRT run time environment is executed on a C167 Infineon microcontroller without operating system so it is evident that the control application is in the form of a monolithic application. This means that the component based model that is in the heart of the IEC 61499 FB model is not supported bythis run-time environment and thus the providedmeasurements cannot be considered for comparison.3. THE REAL-TIME JAVA EXECUTION ENVIRONMENT3.1. The Real-Time Java SpecificationIt is widely accepted that Java applications running on a general-purpose JVM can only meet soft RT requirements that are at the level of hundreds of milliseconds. The most important reasons for this nondeterministic performance of Java run-time environment are the dynamic class loading, the garbage collection and the native code compilation. However, a wide variety of researchers recognized the potential of Java in real-time applications and invented techniques to address most of the above issues. The Real-time Java Specification for Java (RTSJ) (Bollela, G., et al., 2000) is the most important and systematic approach to provide an extension to address the limitations of the Java language. RTSJ defines modifications and new features to the semantics of the JVM such as scheduling properties suitable for real-time applications with provisions for periodic and sporadic tasks, support for deadlines and CPU time budgets, and means to avoid garbage collection (GC) delays. RTSJ, apart from favouring productivity and portability, allows programmers to write real-time programs in a type-safe language, reducing many opportunities for catastrophic failures.RTSJ received a high acceptance from vendors and a variety of real-time Java implementations and products were introduced in the market. The first reference implementation, the RI, was developed by TimeSys () and runs on all Linux versions. Jamaica () runs on a wide variety of real time operating systems. It provides the programmer with an optionally activated real-time GC, which makes memory programming a more relaxed process compared to the RTSJ one. Other JVM implementations claiming compliance with RTSJ are jRate (/) and the JVM developed by aJile Systems (), which running directly on hardware, opens new horizons on the application of RTSJ in embedded systems domain. The recently released IBM and Sun RTSJ-compliant implementations are expected to give a great push in the use of real-time Java. IBM’s real-time Java is part of the WebSphere Real Time V1.0 (/software/webservers/realtime/) that contains a stand-alone Java Standard Edition 5 Runtime Environment to support real-time applications. Sun real-time Java (/javase/technologies/realtime/index.jsp) is a standards-based extension of the J2SE 5.0 platform designed to address, according to Sun, the growing demand for predictable computing in industries such as aerospace, financial services, industrial automation and telecommunications, as well as in scientific research.3.2. The RTSJ-Archimedes Execution EnvironmentThe RTSJ-AXE is a run-time environment that was developed in the context of the Archimedes system platform to allow the exploitation of real-time Java implementations inthe industrial automation domain and specifically in 61499 based applications.The Archimedes system platform is composed of a methodology, a framework and an ESS. The Archimedes ESS that currently supports the design and deployment phases in the application and partially in the resource layers of the Model Integrated Mechatronics (MIM) architecture was developed utilizing the General Modelling Environment (GME). GME is a configurable toolset with generic functionality for graphical development that supports the easy creation of domain-specific modelling and program synthesisenvironments (Ledeczi, et al., 2001). The Archimedes system platform adopts the model driven development which means that the control engineer constructs the models of hisapplication using a domain specific language, as for example the IEC 61499 FB notation and the systems automatically generates the executable model that will be executed on an IEC 61499 compliant run-time environment. In the case of RTSJ-AXE, the 61499 models are automatically transformed to RTSJ compliant java specifications which are ready to be executed on the RTSJ-AXE run-time environment.In more detail, Archimedes ESS or any other 61499 compliant ESS, such as Corfu FBDK, can be used to define the FB model of the application. New FB types and FB networks can be defined or imported from IEC- compliant XML specifications that have been produced by other IEC-compliant ESSs. These FB design models are further refinedand enhanced to capture the real-time constraints of the control application. The so constructed platform independentmodels, utilizing the RTSJ-AXE model interpreters, are transformed to the RTSJ-based FB platform-specific implementation model that can be executed on the execution environment running on RTSJ compliant implementations.The RTSJ-AXE extends the functionality of Archimedessystem platform so as to exploit RTSJ in the model driven development process of distributed control applications. It is composed of: a) An FB implementation model framework, i.e. a set of classes that enable the re-use of all these design decisions that have been done for the proper use of RTSJ constructs in mapping FB based design specifications of control applications to executable real-time Java implementations. b) An execution environment that is required for the deployment and execution of the proposed FB implementation model. This environment provides the infrastructure required to meet deployment and re- deployment needs, as well as stringent non-functional requirements such as maximum permissible response times, minimum throughputs and deadlines usually imposed by the nature of DCSs. c) A set of interpreters to automaticallygenerate the implementation model from the FB design model. d) A tool, the RTSJ launcher, to support the preparation and launching of the application on the target environment.To eliminate the major cause of unpredictability of the Javaimplementation, the RTSJ defines theNoHeapRealtimeThread (NHRT) class. The NHRT class isused in the RTSJ-AXE to allow selected FB instances to pre-empt the GC without delay since it runs at a higher prioritythan the GC. This allows the control application to beindependent from the GC. Event connections between FB instances are implemented in RTSJ-AXE, using theAsynchronous Event Handling Mechanism. This mechanism was derived in RTSJ by generalizing the traditional asynchronous event handling mechanism of Java. Based on this, asynchronous event handlers become schedulable entities that act as real time threads and inherit all the scheduling characteristics of threads. A detailed description of the RTSJ-AXE can be found in (Thramboulidis et al. 2005).4. PERFORMANCE ANALYSIS AND RESULTS In this section the RTSJ execution environment used to analyze the timing behaviour of the proposed run-time environment are described. The timing behaviour of IEC 61499 implementations is analyzed and benchmarking results obtained running the proposed RTSJ-based 61499 run-time environment are presented. The objective of this performanceanalysis is to contribute to the performance analysis of IEC 61499 implementations, and demonstrate the timingcharacteristics of the proposed execution framework on different implementations environments of RTSJ. It is not the objective of this work to compare the various RTSJ implementations. Such evaluations can be found in other works, i.e. (Enery, et al., 2007). 4.1. Hardware and Software test bedsThree different real-time Java platforms, i.e., TimeSys RI, IBM WebSphere Real Time, and Sun Java Real-Time System, were used to analyze the timing behaviour of theproposed IEC 61499 run-time environment. More specifically the three software/hardware platforms used for are:TimeSys RI : TimeSys has developed the official RTSJ implementation. RI runs on any Linux platform and its threading model maps directly the Java threads onto Linux POSIX threads. For the test bed, version 1.0-547.1 of RI was used running on TimeSys Linux/RT (GPL version) 4.1 Kernel 2.4.21. A significant improvement in performance was identified using the new version 1.1-alpha. The hardware platform used was a PC with AMD 64 2.4 GHz and 2Gb RAM.IBM WebSphere Real Time : Ver 1.0 of IBM WebSphere Real Time was used, running over Red Hat Enterprise Linux 4 patched with RTkernel 2.6.16 on a IBM server 798452G, X3455, Opteron Dual-Core model 2218, 2X2.6GHz/ 2x1MB L2 SE, 4x512MB. Sun Java Real-Time System : Sun Java Real-Time System (Java RTS) 2.0 RC2 was used running over Sun Solaris 10, on a Sun Fire 280R Server, with 2x Sun UltraSPARC III CU1.2 GHz with 4 GB RAM. It is important to note that Sun Java RTS was designed for a dual-CPU system, but can alsorun on a single CPU system. This will result in higher latencyand jitter numbers, but is still an effective solution forapplications with high temporal requirements.Naturally, it would have been more favourable to run the tests on the same hardware platform. However, the IBM and Sun real-time Java implementations supported, when the tests were run, only their own hardware platforms. 4.2. FB instance performance analysisThe performance analysis of the FB instance is mainly based on the ECC that describes the dynamic behaviour of the basic FB type instance. The state transition diagram shown in Fig.1, which describes the behaviour of the FB instance, was used for the analysis of performance characteristics of the FB instance. The FB instance is blocked in the idle state (S0) waiting for an event at its event inputs. The presence of an event at the event inputs of the FB instance fires the transition t1. During this transition the sampling of input data of the FB instance is performed and the internal data input variables are updated so as to be used in subsequent calculations.S1S2S0t1t2t3t4Fig. 1. State machine for the execution of basic FB instance. During S1 the transitions of the current state of the ECC are evaluated. If a transition fires, i.e., its condition evaluates to true, the transition t3 is fired. This means that the duration of S1 depends on the number and the type of transitions. During S2 the actions that are associated with the new state of the FB instance’s ECC are executed. Each action is performed by executing the associated algorithm, if any, and issuing an event at the associated event output. The transition t4 is fired after the execution of the associated actions and the FB instance enters the S1 state where the transitions of the current state of the ECC are evaluated again. If a transition fires, t3 is activated, otherwise t2 is activated and the FB instance enters the S0 state.For the benchmark analysis of the execution timing characteristics of the FB instance, a dummy FB type was defined and used (Fig. 2). The DummyFB has: one inputevent (EI), seven data inputs (D1, D2, … D7) of type Boolean, one event output (EO) and one data output (DO). The event input EI is used to activate the FB instance, which executes 1, 2, 3 or up to 7 subsequent state transitions depending on the values of associated data. One ‘dummy’ algorithm is assumed with just a return statement and only one event per EC action. The performance results of the DummyFB can be used to calculate the execution time of any basic FB type of the application, assuming that the worst-case-execution-times of its algorithms are available.Read Data Test (t1): This test measures the time required forthe transition t1 of the state machine that describes theexecution of the basic FB instance. For each platform usedfor the execution of the proposed run-time environment 1.000samples were collected and the average, standard deviation,min, max and 99,5 % are reported. Fig. 3 illustrates the read-data duration for IBM, Sun and TimeSys RI implementationsfor the DummyFB. In our implementation all input data areread from the DataConnectionManager independent of theevent WITH specifier. Better results can be obtained using the WITH specifier to read only the data related to the specific event that fired the transition.Fig. 2. The dummy FB type used in our benchmark.Evaluating Transitions Test (S1): This test measures the duration of the S1 state. The S1 time depends on the number and the type of transitions. Transition expressions in the DummyFB are: a) ei && d1, for the transition from START to the ST1 state, and dn for the transition from START to the STn state, where n=2..7. There is a transition which always fires from any STn state to the START state. Fig. 4 shows the results obtained using the DummyFB with one output event and up to seven transitions.Fig. 3. Read Data Duration performance measurements.Fig. 4. Evaluating Transitions (S1) Test results.Performing Actions (S2) Test: This test measures the durationof the S2 state. The S2 duration depends on the number ofactions, the algorithm execution time, and the output eventfiring time. Fig. 5 shows the results obtained using theDummyFB with one output event and up to seven associatedactions in a state. It should be noted that a great jitter in theexecution times was noticed until the IBM and Sunimplementations reach a steady state. This is why we had the systems to reach the steady state before starting the measurements of our tests (Enery, et al., 2007).Fig. 5. Performing Actions (S2) Test results. 4.3. FB Network performance analysisFor the FB network performance analysis, dispatch-latency,event-connection latency and the event-handler computation-time are presented. The Read data latency has no meaning forthe FB network, since for the proposed implementation this time is the one that was measured in the FB instance performance analysis.Dispatch latency Test:This test measures the time from when the output event of the event producer FB is fired, to when its handler, which is an instance of the EventHandler class, isinvoked. Fig. 6 illustrates the dispatch latency for the three platforms used to run the proposed run-time environment. Itshould be noted that standard deviation for allimplementations is quite small and better performance isachieved when a BoundAsyncHandler is used (Fig. 7). Event-connection latency Test: This test measures the time from when the event is fired, to when the corresponding consumer FB instance becomes ready for execution. To ensure that each event firing causes a complete execution cycle of the consumer FB instance, the producer FB instance fires the next event only after the processing of the previous event has terminated. Measurements for the event-connection latency on the three platforms used are quite similar to the Dispatch Latency ones.Event-handler computation-time (EHCT) Test: This testmeasures the time needed for the event handler to perform itstask without interruption, i.e., to update the events in the inputEventMonitors that have already been subscribed for the specific event (Fig. 8). The EHCT depends on the number of monitors to update. There is one monitor per FB instance that accepts the corresponding event. It should be noted that Std. Dev. is greatly improved in the case of the Sun execution environment using BoundAsyncHandler (Fig. 9), whereas it remains the same for the case of IBM and RI.4.4. Deployment and re-deployment performance analysis For the deployment and re-deployment performance analysis the Festo MPS example application was used. Festo MPS is a laboratory system widely used in IEC 61499 related papers. It is composed of three units: the distribution unit, the testingunit and the processing unit. Cylindrical work pieces are forwarded from the distribution unit to the testing unit andnext to the processing unit, where a drill performs the most important processing of this mechanical unit. A detaileddescription of this case study can be found inhttp://seg.ee.upatras.gr/seg/dev/FestoMPS.htm. The whole control application for the Festo MPS system in the form of FB notation can be downloaded from the same site.Fig. 6. Dispatch latency for Async Event Handler Fig. 7. Dispatch latency for BoundAsync Event HandlerFig. 8. Event-handler computation-time for Async EventHandlerFig. 9. Event-handler computation-time for BoundAsync Event Handler.Table 1. Deployment timing characteristics for the Festo MPS application.Action # of timesperformedWebSphere RealTimeRI(1.1-alpha)Java RTSJava RTS(Dedicated CPU)FB instantiation 5 64,314 ms 21,564 ms 38,181 ms 38,934 msData Connection 10 2,160 ms 0,736 ms 1,390 ms 1,516 msEvent Connection 8 8,797 ms 20,845 ms 5,103 ms 5,456 ms Table 2. Re-deployment timing characteristics for the Festo MPS application.Action # of timesperformedWebSphere RealTimeRI(1.1-alpha)Java RTSJava RTS(Dedicated CPU)FB instantiation 2 4,065 ms 5,705 ms 7,033 ms 6,816 ms Create DataConnection1 0,023 ms 0,028 ms 0,076 ms 0,043 ms Create EventConnection5 1,227ms 14,543 ms 2,939 ms 2,732 ms Delete EventConnection2 0,106 ms 0,130 ms 0,379 ms 0,274 msTable 1 presents the timing characteristics of the deployment process for 5 FB instances. It must be noted that the 5 instances were all of different FB types so the load time for 5 different classes is responsible for the long total instantiation time. Deployment was executed in two steps: The first step is executed with priority 20 whereas the second step is executed with high priority (35). Times are for the given number of repetitions of the corresponding action. It is evident that our framework does not exploit the second CPU of the hardware platform when this is dedicated to RT threads.After the deployment of the first version of the Festo MPS example application that does not count the illegal workpieces, a re-deployment scenario was executed to demonstrate the applicability of the proposed approach regarding re-configuration. Two FB instances, one CounterFB and one PrintInt, were appended to the control application during runtime to get the final version, which has exactly the same behavior as the first one, except that the number of illegal workpieces is printed on the operator’s display. Table 2 illustrates the timing characteristics of the proposed run-time environment for the various RTSJ implementations for the above re-deployment scenario. It should be noted that the create event connection operation isa time consuming action for RI.5. CONCLUSIONSA benchmark for the IEC 61499 function block model is described and performance measurements for a run-time environment based on real-time Java are provided. Performance results prove the applicability of the real-time Java execution environment for hard real-time applications. These measurements can be used to calculate the response time of the various transactions of any FB application. This work should be further extended to analyze the timing characteristics of an FB network that is deployed on a network of interconnected nodes.REFERENCESInternational Electro-technical Commission (IEC), 2005, International Standard IEC 61499, Function Blocks, Part 1 - Part 4Thramboulidis K. (2005), “Model Integrated Mechatronics – Towards a new Paradigm in the Development ofManufacturing Systems”, IEEE Transactions onIndustrial Informatics, vol. 1, No. 1. Feb 2005 Thramboulidis, K., and Zoupas, A. (2005), “Real-Time Java in Control and Automation: A Model DrivenDevelopment Approach”, 10th IEEE Int. Conf. onEmerging Technologies and Factory Automation,Catania, Italy, Sept. 2005Sünder, C., Zoitl, A., Strasser, T., and Brunnenkreef, J.(2007). Benchmarking of IEC 61499 runtime environments. In Name(s) of editor(s) (ed.), EmergingTechnologies and Factory Automation, ETFA. IEEEConference on, 474-481.Soundararajan, K., and Brennan, R. (2008). Design patterns for real-time distributed control system benchmarking.Robotics and Computer-Integrated Manufacturing, 606-615. Pergamon Press.Bollela, G., B. Brosgol, et al., 2000, The Real-Time Specification for Java, /Addison Wesley/.Cengic, G., Ljungkrantz, O., Akesson, K. (2006), “Formal Modeling of Function Block Applications Running inIEC 61499 Execution Runtime”, /11th IEEE International Conference on Emerging Technologies andFactory Automation/, September 20-22, 2006, CzechRepublic.Sunder, C., Zoitl, A., Rofner, H, Strasser, T., Brunnenkreef, J. (2007), “Benchmarking of IEC61499 runtimeenvironments”, /12th IEEE Int. Conf. on EmergingTechn. and Factory Automation/, Sept 2007, Patras,Greece.Brennan, R., Fletcher, M., Norrie, D. (2002), “An Agent-Based approach to reconfiguration of real-timedistributed control systems”, /IEEE transactions onRobotics and Automation/, vol. 18, No. 4, pp. 444-451,August 2002Ledeczi, A., M. Maroti, A. Bakay , G. Karsai, J. Garrett, C.Thomason , G. Nordstrom, J. Sprinkle and P. Volgyesi.“The Generic Modeling Environment”. Proc. ofWISP’2001, Budapest, 2001.Enery Mc Enery, D. Hickey, and M. Boubekeur, “Empirical Evaluation of Two Main-Stream RTSJ Implementations”, 5th International Workshop on JavaTechnologies for Real-time and Embedded Systems(JTRES ’07) Sept. 26-28, 2007 Vienna, Austria.。
Research methodology case02 Topic the impact of enterprise systems
Research methodologycase02// Topic: the impact of enterprise systemsHu ZhaoqiKhusnetdinov Sergey1. Introduction – what is the subject?The subject of this paper is impact of enterprise system; it is a very broadtopic, as it can cover all variety from impact on accounting to supply chainmanagement and overall company performance.The main research question is solving so-called “productivity paradox” (PP),PP is arising from the fact, that IT and ERP in particular have no impact oncompanies’ operations.2. Reviews of the three papersa. The impact of enterprise systems on corporate performance: A study ofERP, SCM, and CRM system implementationsThe influence of investment in enterprise systems is examined in this paper,particularly investments in ERP, SCM and CRM systems. The authorsselected 406 firms out of 4600 public firms, which announced their ESimplementation. With this sample firms they investigated impact of ERP, SCMand CRM on companies’ ROA and ROS using financial data bases and open-source information. They found some evidence of improvements in profitabilityof ERP adopters, but not in the stock returns. The firms adopted ERP earliergained more profitability improvements. Adopters of SCM showed bothimprovements in profitability and returns. However CRM adopters didn’texperience any increase in profitability neither return. The authors incontradiction to other papers used bench marking approach to assess whetherit is a base line performance or not and also they looked at the long timeperiod and failed implementation of ES.b. The usefulness of ERP systems for effective managementIn this paper extensive survey of Greek ERP adopters is presented. Authorsinvestigating connection among reasons of implementing ERP system,benefits from the ERP system implementation and ERP modules chosen. It issurprisingly evident that the clearer objectives company had about ERPimplementation more benefits or recognition of benefits it achieved. Otherrelation with set of modules and benefits retain the idea that less modules toimplement less benefits it gains, but less problems on the other hand.As a more narrow-specific theme of this paper is impact of ERP onmanagement and management accounting. It discovered that there is a strongpositive impact on the management decision making process asimplementation of ERP reduces time of reporting and improving quality ofinformation. It is also changing the role and prerequisites of managementaccountant, because of IT-led environment.c. The impact of ERP systems on firm and business process performanceThis paper represents research result of the connection between ERPinstallation and improvements in supply chain management. The survey foundno effect on supply chain for the firm who implemented ERPS, but they foundthat if a firm using ERP with some additional software for SCM then it receivedadvantages along supply chain. Authors studied different metrics for assessingERPS impact both financial and non-financial, all those measures wereincluded in a model as dependent variables and independent variables wererepresented by ERPS history and ERPS extension such as SCMS.Authors suggest that their research can contain some biases because of themethod and sample, so further research is implied to be conducted. Howeverthey find that the longer ago firm implemented ERPS, the higher firm’s overallperformance.3. A discussion of the relative merits of the different approaches - researchmethodsLet’s investigate all the methods have been exploited in the paper above. Inthe first paper authors clearly stated that they are going to critically review allpervious research on that topic, so we can identify it as part of criticalrationalism methodology, but then further they define the purpose of the paper:“contribution of this paper is a rigorous validation of this [ES will improvefinancial performance] premise”, what is an example of pure positivist approach of validating, but not refuting. As a main instrument of validating they use quantitative method.Next paper represents mixture approach: at the first step they are utilizing interviews with experts to better fit industries and topic specific, and then second step quantitative method of surveying.Third paper contains example of using two quantitative methods in one research (mail questionnaires and CATI) in order to extend and diversify their sample.As it becoming obvious we can’t use only one method of scientific research, because every method has its own weaknesses and straights, so the power of research is laying in combination of these methods: we are using interviews and qualitative methods for developing hypothesis, quantitative methods for testing hypothesis and case studies for deeper understanding and searching for hidden implications.In this particular research topic quantitative and qualitative methods are the most popular, because the result should be measured in numbers as the most trustable and undisputable measure.References[1] KB Hendricks, VR Singhal, JK Stratman. The impact of enterprise systems on corporate performance:A study of ERP, SCM, and CRM system implementations. Journal of Operation Management, 2006[2] C Spathis, S Constantinides. The usefulness of ERP systems for effective management. Industrial Management and Data Systems, 2003[3] B Wieder. The impact of ERP systems on firm and business process performance. Journal of Enterprise Information Management, 2006。
oracle销售行业解决方案

合作伙伴关系管理 (PRM) 战略
协作战略和应用,支持销售、营销和服务业务流程
呼叫中心 直接 ERP 供应链 财务 计费 货品计价 贷方 销售 CRM 市场营销 服务 分析
间接
代理/经销商
PRM
合作伙伴管理
批发商 分销商
公司
合作伙伴
客户
“更好与其合作”
“更佳的销售代表”
“更满意”
Oracle PRM 支持合作伙伴管理的整个生命周期
里程碑 A | 里程碑 B | 里程碑 C | 里程碑 D | 里程碑 E | 里程碑 F | 里程碑 G | 里程碑 H | 里程碑 I | 里程碑 J |
阶段 01 10%
阶段 02 20%
阶段 03 30%
阶段 04 40%
阶段 05 50%
阶段 06 80%
阶段 07 90%
阶段 08 98%
p lo ve 战 De 坚 攻
king Flan 战 迂回
De 保 fend 卫 战
Frag me n t 游击 战
Frontal 正面突击
通过商机评估确定的 攻守策略,即解决如 何“攻”和如何“守”的 问题 • 迂回:Flanking • 化整为零:Fragment • 正面进攻:Frontal
价值方案 60%
确认价值 80%
赢单 100%
管理
生成
赢单
团队大客户销售的销售方法(ESP) ——Enterprise Selling Process
客户 分类和细分 识别新客户 和新业务
创建客户计划
客户价值 分析和评估
ESP ESP
客户日常管理
分析当前业务
客户状态 复查和监控
APC技术英文缩写

加拿大货物储运中心 配置工程师 客户工程师 海关工程师组 市政工程 国家总经理 a.k.a Production Supervisor 持续改进领导 客户忠诚度计划 国家经理 可信材料授权 认证机械承包商 客户网络解决方案 协同定位 售出货物的成本 持续职业发展 A tool to work with projects and increase profitability 客户项目处理 持续保护服务 计算机房空调 客户关系管理 认证可靠合作伙伴计划 国家服务经理 认证服务合作伙伴 客户支持代表 第 3 页,共 30 页
第 1 页,共 30 页
Acronyms for Training
English Acronyms ATE ATP AUC AV AVL AXI BADM BCP BI BNG BNS BOD BOM BOT BRC BSC BTO BTW BZF CA CA CASC CCC CCF CCG CCG CCM Full Name Automatic Test Equipment Available to Promise Australian Distribution Center AudioVisual Approved Vendor List Automatic XRay Inspection Brag / Attack / Defend / Motherhood Business Continuity Plan Business Intelligence Business Network Group Business Networks Solutions Bill Of Distribution Bill of Materials Build Out Tool Business Reply Card Brazil Service Center Build To Order By The Way Brazil Factory Corrective Action Cause Analysis Certified Authorized Service Centre Custome Care Center Commission Claim Form Costs Controllable Goods Customer Centric Group Capacity and Change Management 第 2 页,共 30 页 Description 自动测试设备 澳大利亚货物储运中心 视听设备,视听教材 批准的供应商清单 自动X光检测 ??? 业务延续计划 商务情报 业务网络组 业务网络解决方案 发运清单 材料清单 扩建工具 巴西服务中心 按订单建造 顺便说一声 巴西工厂 纠正措施 原因分析 认证授权服务中心 客户关怀中心 请求调试表 成本可控制货物 容量和变化管理器 全称 中文
Transaction of the ASME

Transaction of the ASME Journal of Mechanical Design
(in press)
Key words: research evaluation, scienti c methodology, engineering practice, optimization,
1 The state of design research methodology
In many disciplines, research methodology is seldom discussed by researchers. Such neglect may result from several attitudes towards research methodology including indi erence or ignorance. Researchers may be indi erent because their research is well received by the community therefore they need not change or worry about it; or researchers may perceive their practice as science and wish to adopt as their methodology what they perceive to be the methodology used by scientists, henceforth referred to as the received scienti c methodology. Roughly, the received scienti c methodology consists of several steps: (1) observations or preliminary studies, (2) hypothesis formation, (3) hypothesis testing, (4) hypothesis evaluation, and (5) hypothesis acceptance or rejection. It is asserted that results of research discovered by this methodology lead to applied research and subsequently, to practical impact. In contrast to this assertion, it is proclaimed that the goal of this methodology is to advance knowledge for its own sake and not address practical needs nor be responsible for delivering practical results. Most researchers would rarely question this methodology, but since it is impossible to follow or even hard to approximate, researchers who would claim to have adopted it, would not practice it.
公司流程问题 分析方法

公司流程问题分析方法英文回答:Process Mapping: A visual representation of the flow of activities within a process, allowing for the identification of inefficiencies and bottlenecks.Value Stream Mapping: Extends process mapping by adding time and cost dimensions, facilitating the prioritization of improvements based on value-added activities.Process Simulation: Uses computer models to simulate the behavior of a process, allowing for the testing of process changes without disrupting live operations.Process Mining: Analyzes event logs to discover and visualize the actual processes, providing insights into bottlenecks and areas for optimization.Six Sigma DMAIC: A structured methodology for process improvement, involving Define, Measure, Analyze, Improve, and Control steps to systematically reduce defects and improve quality.Lean Six Sigma: Combines the principles of Lean and Six Sigma, focusing on eliminating waste and reducing variation to enhance efficiency and customer satisfaction.中文回答:流程分析方法。
浅析技术管理的重要性

浅析技术管理的重要性英国启航论文在现如今商业发展大环境下,技术管理是能够有效地提高工作效率的一种新的管理理念,一种新的技术。
现在的商业更需要技术驱动型的现代科技管理理念,也正因为这种管理理念的有效实践,为工作业绩做了很好的铺垫。
实际上,对于一家企业来说,管理技术是贯穿整个阶层和所有纪律最重要的部分。
因此,管理科技的原则对那些想要有效地处理应用,技术转移和集成整合的所有企业都很适合,而不仅仅是适应于传统的科学社会群体。
新的经营模式有助于企业创造更加优质的产品和服务,以及更加快捷和更高质量的商品,这一新技术在每一家企业中都占据着越来越重要得到地位。
有很多企业、政府部门、金融机构、建筑公司和医疗供应商都得在有效的技术型环境下运作,才能更有效的管理企业。
510转基因项目可以让我们更好的了解到管理技术的几个特点:Knowledge of modern technology management concepts and best practices provides the foundation for effective job performance in technology-driven business environments. Management of Technology discusses cutting-edge management concepts, tools, and techniques that effectively work in today's technology-intensive organizations.New management tools and techniques play an increasingly important role in every organization for creating quality products, services, and content faster, cheaper, and at a higher quality. Technology crosses virtually all levels and all disciplines of an enterprise. Therefore, the principles of managing technology are relevant not only to people in the traditional engineering-scientific community, but also apply to any organization and business that must effectively deal with the application, integration, and transfer of technology.Financial institutions, government agencies, architectural firms, and healthcare providers are just a few examples of the vast array of organizations that must function effectively in technology-based environments, and therefore be able to manage technology. Specifically, TMGT 510 course helps to understand following features:Methods for assessing the effectiveness and performance of the organization and its management processes.Insight into the functioning of contemporary work processes, such as concurrent engineering, design-build, integrated product development, and phase-gate processes.Special tools and techniques for effectively managing technology-based projects, including dealing with organizational interfaces from R&D to markets.Managerial Practices and ToolsTechnology-intensive projects are managed under a project management (PM) framework that includes a PM Plan, project organization, PM tools and techniques, and performance monitoring, and control. Thamhain (2009) suggested, “Tools such as the Project Maturity Model, the Six Sigma Project Management Process and focus groups, can serve as a framework for analyzing and fine-tuning the team development and management process” (p. 130, para. 1). The tools and techniques can be grouped in the categories based on their application as (1) Product Management, (2) Project Management, (3) General Management, (4) Strategic, (5) Quality Control. Organizational Behavior deals with the management of individuals, groups, organizations, processes and dynamic environments. Human Resources Management deals with the issues such as hiring, career management, management of hierarchical levels, management of competencies and training, remuneration, internal communication and evaluation of staff. HRM and OB have to deal with scientists, researchers, engineers, technicians and other technologists. Thamhain (2005) has stated, “Today’s business culture demands that project teams — in meeting and performing their project responsibilities —engage in multiple activities” (p. 35, para. 2). The work process in the technology-intensive enterprises is team-based, self-directed, and agile which are structured for parallel, concurrent execution of the work. They affect people issues, management style, and organizational culture and management tools such as scheduling, budgeting, and project performance analysis. Technology-intensive enterprises have a unique organizational culture with its own norms, value, and work ethics. These cultures are team-oriented in terms of decision-making, workflow, performance evaluation, and workgroup management.Project ManagementProject is a temporary task undertaken by a project manager and his team to produce a specific output and a product. Contemporary linear work processes and top-down controls are no longer adequate, but are steadily being switched with alternate organizational designs, new management methods and business processes, such as concurrent engineering (CE), design-build, and stage-gate protocols. CE is the consideration of the factors like product functionality, manufacturing, assembly, testing, maintenance, reliability, cost, and quality associated with the life cycle of the product during design phase. Thamhain (2005) explained the benefits of formal project management system so that managers can better respond to specific requirements, schedule management, short product life cycle, work culture differences, and diverse group dynamics (pp. 141-142). There are various practices of the PM and some of the best ones are described as to plan the work by utilizing a project definition document and to create a planning horizon. It is in the best interest to define PM procedures upfront and to look for warning signs ahead of time.Management should ensure that the sponsor approves scope-change requests and guard against the scope creep. It is very important to assess potential risk throughout the project and to work on a risk mitigation plan as necessary.Team managementThamhain (2005) has stated, “Today’s business culture demands that project teams — in meeting and performing their project responsibilities — engage in multiple activities” (p. 35, para. 2). Project teams are time limited and they produce one-time outputs, such as a new product or service. The tasks involved in the project teams are non-repetitive and require knowledge, judgment, and expertise. The project team consists of individuals from different functional unit. At the completion of the project, the individuals return to their respective units or move on to the next project. Not all projects may have the same members; however, they may have some common members. Staffing is also one of the most important elements for the success of the project. The team members of the project should possess just not only the pre-required skills, qualifications, and experience necessary for the job, but they must also possess those traits personality and ethics of work that are easily compatible with the values and the culture of the organization (Markopoulos et al., 2008, p. 366). The team should include people who understand the project thoroughly, who are technical experts, who can provide objectivity in the process and outcome, a nd suppliers. The knowledge workers of today’s modern world expect autonomy, a continuous level of learning, and innovation to be a vital part of the job. They are comparatively much better and educated as compared to their counterparts in the past. They function better in a self-directed and high performance groups and teams. Teams are an important asset when it comes to completing projects. When experiences teams are assigned tasks they come up with fruitful results for the organization; therefore, the design of the team is a much more important and significant managerial control. It also facilitates the better functioning and performance of self-directed teams and improvises the quality and worth of the member relationships and contentment.Decision making authoritiesThe Decision-making authority, accountabilities, and responsibilities of the team members should be defined in a very clear way to eliminate the role of any kind of ambiguity, uncertainty, or interdepartmental Conflicts. Once the project teams have been properly assembled and have settled down, then they should be supervised, coached, and supported at regular intervals to ensure that they are fulfilling their roles as expected (Markopoulos et al., 2008, p. 366). Motivation, empowerment, and mentoring are no doubt powerful and they exert indirect controls over the project in order to gain success by bringing out the best in an individual as well as project team performances. Evaluation of the project team and each individual involved in the team is important for the project manager and the organization. Evaluating teamproject performance is the key if the team needs to succeed and improve on future projects.The role of the organization in Project SuccessOrganizational design also plays a very vital role in controlling and supervising the technology intensive work in any organization. Organizational design contemplations consists of: the nature of the service or the product, the sequential as well as spatial distribution of the locations of the work, in-house in contrast to the outsourcing of the work, the convenience and flexibility given by virtual organizations, simultaneous engineering and incorporated product development, the extent of the use of technology, the availability and accessibility of core competencies and most important of all the strategic objectives of the company (Booth, 2011, pp. 111-113). The contemporary management practices indicate that the project management techniques and tools should be incapable of solving the complex problems, and at the same time, facilitating the effective and efficient control of deliverables of work, and eventually contributing to the continuous improvement.Tools & Control techniques for Project ManagementThe tools of project management should not only fulfill their aimed or intended purpose, but they should also be user friendly, easily compatible with the culture of the organization, and in alignment with the processes of the business (Markopoulos et al., 2008, p. 367). The new tools should be pre tested in the environment in which they will be used, and should ask for feedback from the users. Therefore, “fixing” incompatibilities eventually simplifies the introduction of the new tool in the organization or the workplace. PM control techniques are categorized into analytical management, people oriented and press oriented. The following discussions associate widely accepted PM techniques with the ‘monitoring and control’ feature of PMBOK as a source of knowledge (Markopoulos et al., 2008, p. 366). This is not an in-depth source as many other methods and means are present from which the Project Manager can have his pick. BenchmarkingBenchmarking is the comparison of tangible projects with comparable projects to spot the strong points of that project to come up with better ideas and serve as a standard to assess the performance. Institutions to assess their strong points and weak points as compared to the organization, which is considered the best, use benchmarking. It is the basis of controls, which stimulate the process of rectification. Benchmarking is a key method to verify estimates and schedules of a company by itself (Pinheiro, 2010, p. 7). Project Managers use benchmarks to compare and check on factors such as the time to market, major accomplishments, rates of accidents regarding safety, costs of production per unit, and satisfied customers. The selection of benchmarks is very specific and is relevant to the objectives of a company, which show great improvement. In order to choose a benchmark, theknowledge of how and what to benchmark, collection and analysis of data to pick out the ‘best in class’, assessing tactics, operations, and procedures alongside the benchmark, putting up targets of improvement, and rectification measures in case the result is below the benchmark (Pinheiro, 2010, p. 7).Change ManagementChange management is the process of shifting of technology, organization, person, processes, or political balance from current state to the next state. According to New man (2012), “a strong sense of imagination, creativity and patience is requiredif one is to persevere through the process” (p. 68). Change management can be either on the part of organization or on the part of an individual, it is about transforming and modifying in order to maintain or improve effectiveness. People resist and act conservative while undergoing a change. From organizational perspective, changes include mission/vision changes, strategic changes, operational changes, technological changes, and behavioral changes. According to Raineri (2011), “change management practices include a variety of organizational interventions that, when executed properly and in consistency with internal and external organizational events, facilitate the enactment of organizational change processes” (p. 266). Change affects entire organization both outside and inside the organization. Both the organization and the employees get under pressure while undergoing a change. Management requires some basic skills for managing changes that include:Skills to identify the problem.Skills to formulate techniques and strategies to solve those problems.Skills of implementing the processes leading towards change.Problem DiagnosisProblem diagnosis is the investigation to find out the root cause of any problem. Proper resource allocation is required to help diagnose forces and factors and resolve the problem. Technology facilitates rapid detection, diagnosis, and diffusion of problem by insuring systematic, detailed, clear, and reliable methods and techniques like rapid detection of problem, continuous monitoring, and correction from deviation ant it may include following steps: Is the problem recoverable?Does it need to be resolved?Are adequate resources available?How long will it take?Is this the appropriate time?MentoringA mentor is generally defined as a person with experience in an organization that has gained a certain rank or achievement and can support the professional development of people with less experience in that organizationInformal or traditional mentoring emphasize mainly on the protégé. Mentor and protégé work mutually to develop a plan that caters protégé’s career goals as well as private goals. The mentor and protégé pair together by their own internal forces that create the relationship. Generally, traditional mentoring lasts from several years to lifetime. This sort of mentoring usually takes place by spending time together and it flourish because both sides have a legitimate desire for each mutual interest (Kram, 1985, p. 22).Formal mentoring is based on a contract between a mentor and a protégé, a defined structure for mentoring and possibly a program of support. In a formal mentoring relation, there is expression of expectations, objectives, procedure going to be used the frequency, period of agreement and conditions are set first.Management of TechnologyTechnology Management is the set of management guidelines that enables an organization to maintain its technological essentials build a competitive advantage. The role of the Technology Management factor in an organization is to gasp the worth of certain technology for the firm. Steady technology development is valuable with the expectation that there is a value for the client and subsequently the Technology Management Function in an organization might as well have the ability to argue when to invest in technology infrastructure and when not to (Sabeel, Gopal and Rajashekhar, 2012, p. 2). Technology has empowered people to realize extraordinary change in the way they work by creating, advancing, utilizing and by progressing, upgrading technologyManagement confronts some running problems in Technology Management. The biggest around them is when the perfect time to finance technology. Most business fear to invest at present stage as they think that technology is adapting so quick that speculation made today will come to be basic soon and the investment may not ready to apprehend the sum cost brought about in it besides when and how to move to the next stage. Separated from running ahead with putting resources into technology outside of the norm, the firm needs to graph a point-by-point move toward how it will eliminate the present technology level to move to next level.Slow transformation over the period keeps the crux in managing technology both on the shop floor and in its financial accounts. Technology is not just modifyingstandard of how to work but it likewise taking it to the next level where most industry player should not just check out technology actually to cut expenses but in addition to drive technological enhancements and efficiencies (Dolinsek and Strukelj, 2012, p. 30).英国启航论文。
Inheritance of Workflows

Inheritance of WorkflowsAn approach to tackling problems related to changeW.M.P.van der Aalst1⋆and T.Basten2⋆⋆1Dept.of Computing Science,Eindhoven University of Technology,The Netherlandswsinwa@win.tue.nl2Dept.of Electrical Engineering,Eindhoven University of Technology,The Netherlandstbasten@ics.ele.tue.nlAbstractInheritance is one of the key issues of object-orientation.The inheritance mechanism allows forthe definition of a subclass which inherits the features of a specific superclass.When adaptinga workflow process definition to specific needs(ad-hoc change)or changing the structure of theworkflow process as a result of reengineering efforts(evolutionary change),inheritance conceptsare useful to check whether the new workflow process inherits some desirable properties of theold workflow process.Today’s workflow management systems have problems dealing with bothad-hoc changes and evolutionary changes.As a result,a workflow management system is not usedto support dynamically changing workflow processes or the workflow processes are supported ina rigid manner,i.e.,changes are not allowed or handled outside of the workflow managementsystem.In this paper,we propose inheritance-preserving transformation rules for workflow pro-cesses and show that these rules can be used to avoid problems such as the“dynamic-change bug.”The dynamic-change bug refers to errors introduced by migrating a case(i.e.,a process instance)from an old process definition to a new one.A transfer from an old process to a new process canlead to duplication of work,skipping of tasks,deadlocks,and livelocks.Restricting change to theinheritance-preserving transformation rules guarantees transfers without any of these problems.Moreover,the transformation rules can also be used to extract aggregate management informationin case more than one version of a workflow process cannot be avoided.Key words:Workflow management,Petri nets,inheritance,adaptive workflow,dynamic change, management informationContents1Introduction22Preliminaries62.1Notations for bags (6)2.2Labeled Place/Transition nets (7)2.3Branching bisimilarity (10)2.4WF-nets (12)2.5Soundness (14)3Inheritance163.1Inheritance relations (17)3.2Inheritance-preserving transformation rules (21)4Inheritance in the workflow-management domain294.1Ad-hoc change (29)4.2Evolutionary change (30)4.3Workflow templates (31)4.4E-commerce (32)5Dynamic change335.1Valid transfer rules (33)5.2Transfer of cases from superclass to subclass (35)5.3Transfer of cases from subclass to superclass (40)5.4Related work on dynamic change (46)6Management information476.1Management-information nets (47)6.2Greatest common divisor/least common multiple of workflow process definitions (50)6.3Inheritance-preserving transformation rules and management information (55)6.4Management information in the workflow-management domain (57)7Tool support587.1Verification of soundness (58)7.2Verification of inheritance relations (59)7.3Supporting dynamic change (62)7.4Providing aggregate management information (62)8Conclusion63 References63 1IntroductionWorkflow-management technology aims at the automated support and coordination of business pro-cesses to reduce costs andflow times,and to increase quality of service and productivity[26,38,39].A critical challenge for workflow management systems is their ability to respond effectively to process changes[37,58].Changes may range from ad-hoc modifications of the process for a single customer to a complete restructuring of the workflow process to improve efficiency[5].Today’s workflow man-agement systems are ill suited to dealing with change.They typically support a more or less idealized version of the preferred process.However,the real run-time process is often much more variable than the process specified at design-time.The only way to handle changes is to go behind the system’s back.If users are forced to bypass the workflow management system quite frequently,the system is more a liability than an asset.Adaptive workflow aims at providing process support similar to contemporary workflow systems, but in such a way that the workflow system is able to deal with process changes.Recent papers and workshops show that the problems related to workflow change are difficult to solve[5,7,9,18,22, 23,32,33,37,47,49,55,58].Therefore,we take up the challenge tofind techniques to addflexibility without loosing the support provided by today’s systems.Typically,there are two types of process changes:(1)ad-hoc changes and(2)evolutionary changes. Ad-hoc changes are handled on a case-by-case basis and affect only one case(i.e.,process instance) or a selected group of cases.The change is the result of an error,a rare event,or special demands of the customer.Exceptions often result in ad-hoc changes.A typical example of an ad-hoc change is the need to skip a task in case of an emergency.A workflow process definition resulting from an ad-hoc change is called a variant of the workflow process.Ad-hoc change typically leads to many variants of a given workflow process running in parallel.Evolutionary change is of a structural nature:From a certain moment in time,the workflow changes for all new cases to arrive at the system.The changeis the result of a new business strategy,reengineering efforts,or a permanent alteration of external conditions (e.g.,a change of law).Evolutionary change is typically initiated by the management to improve efficiency or responsiveness or is forced by legislature or changing market demands.A workflow process definition resulting from an evolutionary change is called a version .Evolutionary change results in new versions of a workflow process.New cases are handled according to the most recent version.Existing cases (i.e.,work-in-progress)may also be influenced by an evolutionary change.Sometimes it is acceptable to handle running cases the old way.However,in many situations,cases need to be transferred from the old version to the new version.Both ad-hoc and evolutionary change inevitably lead to one of the following two situations:Ei-ther there are multiple variants and/or versions which are active at the same time or cases need to be migrated from one variant/version to another.Today’s workflow management systems have problems dealing with both situations.We use the term dynamic-change problem (cf.[22])to refer to the anoma-lies caused by transferring cases from one process to another.The term management-information problem is used to refer to the problem of providing an aggregate overview of the work-in-progress in case of multiple versions and/or variants.The trend is towards an increasingly dynamic situation where both ad-hoc and evolutionary changes are needed to improve customer service and reduce costs continuously.Therefore,these problems are relevant for the next generation of workflow management systems.In this paper,we use Petri nets to illustrate process-related concepts.In fact,we use a restricted class of Petri nets,namely the so-called WF-nets [1,3].In a WF-net,there is one source place and one sink place and all other nodes are on a path from source to sink.Readers not familiar with Petri nets and workflow modeling are referred to Section2.shipmentp send shipmentp p sendshipments s sendbill N 0Figure 1.1:The dynamic-change bug.Figure 1.1shows two workflow process definitions illustrating the dynamic-change problem.If the sequential workflow process (left)is changed into the workflow process where tasks sendbill can be executed in parallel (right),there are no problems,i.e.,it is always possible to transfer a case from the left to the right.The sequential process has five possible states and each of these states corresponds to a state in the parallel process.For example,the state with a token in p 2is mappedonto the state with a token in s 2and s 3.In both cases,tasks preparegoods have been executed and sendshipment still need to be executed.Now consider the situationwhere the parallel process is changed into the sequential one,which means that cases need to be moved from the right-hand-side process to the left-hand-side process.For most of the states of the right-hand-side process,this is no problem,e.g.,a token in s1and a token in s2are mapped onto one token in p1,and a token in s2and a token in s3are mapped onto one token in p2.However,the state with a token in both s1and s4(i.e.,prepare bill have been executed)causes problems because there is no corresponding state in the sequential process(where it is not possible to execute send goods).The example in Figure1.1shows that it is not straightforward to migrate old cases to the new process after a change.The problem illustrated in Figure1.1is a result of reducing the degree of parallelism by making the process sequential.Similar problems occur when the ordering of tasks is changed,e.g.,two sequential tasks are swapped.Extending the workflow with new tasks,removing parts,or aggregating a group of tasks into a single task may result in similar problems.When changing a workflow on-the-fly,i.e., running cases are transferred to the new process definition,the dynamic-change bug is likely to occur. Therefore,the problem is very relevant for workflow management systems truly supporting adaptive workflow.Today’s workflow management systems are not able to handle this problem.These systems typically use a versioning mechanism,i.e.,every change leads to a new version and cases refer to the appropriate version.If a case starts using a version of the process,it will continue to use this version. The versioning mechanism may be suitable in some situations.An administrative process with a short flow time is a good candidate for a versioning mechanism.However,there are many situations where such a mechanism is not appropriate.If a case has a longflow time,then it is often not acceptable to handle existing cases the old way.Consider for example a process for handling mortgage loans. Mortgages typically have a duration of20to30years.If the mortgage process changes several times per year,this could lead to dozens of different versions running in parallel.To reduce costs and to keep the processes manageable,the number of active versions(i.e.,versions still used by cases) should be kept to a minimum.Also for processes with a shorterflow time,it may be undesirable to have many versions running simultaneously.In fact,there may be legal reasons(i.e.,starting from 1-1-2000a new step in the process is mandatory)forcing the transfer of cases to the new process. Unfortunately,problems such as the one illustrated by Figure1.1make a direct transfer hazardous. Note that the dynamic-change problem is relevant for both ad-hoc change and evolutionary change. However,the problem is most prominent for evolutionary change where potentially many cases need to be transferred.Another problem related to change is the problem that it may lead to multiple active versions/variants of the same process which makes it difficult to provide aggregate management information.Consider again Figure1.1.Assume that the two workflow process definitions are versions of the same workflow process.At some point in time,the left-hand process may contain six running cases,two in state p1,three in state p2,and one in state p3,whereas the right-hand process may contain four running cases,two in the state with tokens in s1and s2and two in the state with tokens in s1and s4.To provide aggregate management information,these numbers must be combined in such a way that the result provides a meaningful representation of the amount of work-in-progress.In the example, the solution is not very difficult because each state in the left-hand process definition of Figure1.1 has a corresponding state in the right-hand process definition.As a result,aggregate management information can be collected by projecting the states of all cases onto the right-hand process definition. Doing so yields that,for four of the total of ten cases,tasks send bill,and recordgoods and recordbill and recordshipment still needs to be performed.It is possible to summarize this information bycounting the number of tokens resulting in each place of the right-hand process definition of Figure 1.1when projecting the ten cases onto this process definition:Places i and o do not contain any tokens,place s1contains six tokens,place s2contains seven tokens,place s3contains four tokens,and,finally,s4contains three tokens.Although this example is not very complicated,in general,it is not straightforward to obtain aggregate management information when the different process definitions are more complex or their number is larger.The management-information problem explained above occurs if multiple versions and/or variants of the workflow process cannot be avoided.For evolutionary change,the number of versions is of-ten limited.In fact,if all cases are transferred,then there is just one active version(i.e.,all running cases use the same version).However,in some situations,it is not possible nor desirable to transfer cases to the most recent process.There can be legal,managerial,or practical reasons that prevent the transfer of cases.In such a situation,there are multiple active versions of the same process.Ad-hoc change may lead to the situation where the number of variants may be of the same order of magnitude as the number of cases.The variants are customized to accommodate specific needs.To manage a workflow process with different versions/variants,it is desirable to have an aggregated view of the work-in-progress.Note that in a manufacturing process the manager can get a good impression of the work-in-progress by walking through the factory.For a workflow process handling digitized in-formation,this is not possible.Therefore,it is of the utmost importance to supply the manager with tools to obtain a condensed but accurate view of the workflow processes.Although the problem of extracting aggregate management information is relevant for both ad-hoc and evolutionary change,it is most prominent for ad-hoc change.To tackle the dynamic-change problem and the management-information problem,we propose an approach based on the inheritance-preserving transformation rules introduced in[13,4].Inheri-tance is one of the key concepts of object-orientation.Classes and objects in object-oriented design correspond to workflow process definitions and cases in a workflow management context.In object-oriented design,inheritance is typically restricted to the static aspects(e.g.,data and methods)of an object class.For workflow management,the dynamic behavior of cases is of prime importance. The inheritance-preserving transformation rules used in this paper focus on workflow process defini-tions in a Petri-net-based setting.The four inheritance relations presented in this paper use branching bisimilarity(to compare processes)in combination with the notions of encapsulation and abstrac-tion.Encapsulation corresponds to blocking tasks,whereas abstraction corresponds to hiding tasks.1 Restricting process changes to the inheritance-preserving transformation rules presented in this pa-per makes a direct transfer possible in any state while avoiding problems such as the one illustrated by Figure1.1.Note that the inheritance rules can only be used to avoid the dynamic-change bug, i.e.,it is a preventive treatment of the problem.If changes such as the one shown in Figure1.1are allowed,the only cure is to postpone the transfer in case of problems.As a result,in such a case, there may be several active versions of the same workflow process.There may be other reasons for having multiple active versions,e.g.,by law,cases are forced to be handled the old way.In case of ad-hoc workflow,there are also multiple active versions of the same process(called variants).The presence of multiple active versions and/or variants of the same process can obscure the status of the whole workflow.Fortunately,the inheritance-preserving transformation rules can also be used to con-struct aggregate management information.The inheritance notions allow for the definition of concepts such as the Greatest Common Divisor(GCD)and Least Common Multiple(LCM)of a set of vari-ants/versions.These concepts can be used to create a condensed overview of the work-in-progress. Clearly,the dynamic-change problem and the management-information problem are related.By solv-ing the dynamic-change problem(i.e.,instantly migrating all cases to a single version of the process), there is no need to construct aggregate management information because there is just one active ver-sion.However,ad-hoc changes inevitably lead to multiple variants and,as illustrated by Figure1.1, multiple active versions of a workflow process are sometimes unavoidable.The remainder of this paper is organized as follows.In Section2,we introduce the basic concepts and the techniques we are going to use.The approach presented in this paper is based on a special subclass of Petri nets(WF-nets)and a notion of correctness named soundness[1,3].Section3intro-duces the inheritance notions and the inheritance-preserving transformation rules used in this paper. In Section4,the use of inheritance in a workflow management context is discussed.Section5tack-les the problems related to dynamic change using the inheritance-preserving transformation rules.In Section6,it is shown that the results can also be used to create aggregate management information.In Section7,we consider the use of tools to support the notions presented in this paper.Finally,Section8 summarizes the results.2PreliminariesThis section introduces the techniques used in the remainder.Standard definitions for bags and Petri nets are given.Moreover,more advanced concepts such as branching bisimilarity,workflow nets,and soundness are presented.These preliminaries are required to define the inheritance concepts in an unambiguous way.2.1Notations for bagsIn this paper,bags are defined asfinite multi-sets of elements from some alphabet A.A bag over alphabet A can be considered as a function from A to the natural numbers I N such that only afinite number of elements from A is assigned a non-zero function value.For some bag X over alphabet A and a∈A,X(a)denotes the number of occurrences of a in X,often called the cardinality of a in X.The set of all bags over A is denoted(A).The empty bag,which is the function yielding0 for any element in A,is denoted0.For the explicit enumeration of a bag,a notation similar to the notation for sets is used,but using square brackets instead of curly brackets and using superscripts to denote the cardinality of the elements.For example,[a2,b,c3]denotes the bag with two elements a,one b,and three elements c;the bag[a2|P(a)]contains two elements a for every a such that P(a)holds,where P is some predicate on symbols of the alphabet under consideration.To denote individual elements of a bag,the same symbol“∈”is used as for sets:For any bag X over alphabet A and element a∈A,a∈X if and only if X(a)>0.The sum of two bags X and Y,denoted X+Y,is defined as[a n|a∈A∧n=X(a)+Y(a)].The difference of X and Y,denoted X−Y,is defined as[a n|a∈A∧n=(X(a)−Y(a))max0].The binding of sum and difference is left-associative. The restriction of X to some domain D⊆A,denoted X|`D,is defined as[a X(a)|a∈D].Restriction binds stronger than sum and difference.The notion of subbags is defined as expected:Bag X is a subbag of Y,denoted X≤Y,if and only if,for all a∈A,X(a)≤Y(a).Note that anyfinite set of elements from A also denotes a unique bag over A,namely the function yielding1for every element in the set and0otherwise.Therefore,finite sets can also be used as bags.If X is a bag over A and Y is afinite subset of A,then X−Y,X+Y,Y−X,and Y+X yield bags over A.Moreover,X≤Y and Y≤X are defined in a straightforward manner.2.2Labeled Place/Transition netsIn this section,we define a variant of the classic Petri-net model,namely labeled Place/Transition nets.For a more elaborate introduction to Petri nets,the reader is referred to[21,41,48].Let U be some universe of identifiers;let L be some set of action labels.Definition2.1.(Labeled P/T-net)An L-labeled Place/Transition net,or simply labeled P/T-net,is a tuple(P,T,F,ℓ)where:1.P⊆U is afinite set of places,2.T⊆U is afinite set of transitions such that P∩T=∅,3.F⊆(P×T)∪(T×P)is a set of directed arcs,called theflow relation,and4.ℓ:T→L is a labeling function.In the Petri-net literature,the class of Petri nets introduced in Definition2.1is sometimes referred to as the class of(labeled)ordinary P/T-nets to distinguish it from the class of Petri nets that allows more than one arc between a place and a transition.Let(P,T,F,ℓ)be a labeled P/T-net.Elements of P∪T are referred to as nodes.A node x∈P∪T is called an input node of another node y∈P∪T if and only if there exists a directed arc from x to y; that is,if and only if x Fy.Node x is called an output node of y if and only if there exists a directed arc from y to x.If x is a place in P,it is called an input place or an output place;if it is a transition,it is called an input or an output transition.The set of all input nodes of some node x is called the preset of x;its set of output nodes is called the postset.Two auxiliary functions••:(P∪T)→(P∪T) are defined that assign to each node its preset and postset,respectively.For any node x∈P∪T,•x={y|yFx}and x•={y|x Fy}.Note that the preset and postset functions depend on the context,i.e.,the P/T-net the function applies to.If a node is used in several nets,it is not always clear to which P/T-net the preset/postset functions refer.Therefore,we augment the preset and postset notation with the name of the net whenever confusion is possible:N•x is the preset of node x in net N and x N•is the postset of node x in net N.A labeled P/T-net as defined above is a static structure.Figure2.2shows the graphical representa-tion of a P/T-net.Places are represented by circles;transitions are represented by rectangles.Attached to each place is its identifier.Attached to each transition is its label.Transition identifiers are only included if it is necessary to distinguish different transitions with the same label.Labeled P/T-nets have a dynamic behavior.The behavior of a net is determined by its structure and its state.To express the state of a net,its places may contain tokens.In labeled P/T-nets,tokens are nothing more than simple markers(see Figure2.2).The distribution of tokens over the places is often called the marking of the net.Definition2.3.(Marked,labeled P/T-net)A marked,L-labeled P/T-net is a pair(N,s),where N= (P,T,F,ℓ)is an L-labeled P/T-net and where s is a bag over P denoting the marking of the net.The set of all marked,L-labeled P/T-nets is denoted.The dynamic behavior of marked,labeled P/T-nets is defined by a so-calledfiring rule,which is simply a transition relation defining the change in the state of a marked net when executing an action. To define thefiring rule,it is necessary to formalize when a net is allowed to execute a certain action.send complaintcomplaint[⊆×L×is the smallest relation satisfying for any(N,s)in,with N=(P,T,F,ℓ),and any t∈T,(N,s)[t ⇒(N,s)[ℓ(t) (N,s−•t+t•).The labeled P/T-net shown in Figure2.2is used to illustrate thefiring rule.The net models the pro-cessing of complaints by the complaints desk of afictitious Company X.The complaints desk handles complaints of customers about the products produced by Company X.Each complaint is registered before it is classified.Depending on the classification of the complaint,a letter is sent to the customer or an inquiry is started.The inquiry starts with a consultation of the department involved,followed by a discussion with the customer.Based on this inquiry,the necessary actions are taken.Finally, the dossier isfiled.Figure2.2shows the process definition which is used to configure the workflow management system used by the employees of the complaints desk.The marking shown in Figure2.2 is[i],i.e.,the state with one token in place i.Transition register is the only transition enabled in this marking.Firing register results in the state[pendingcomplaint willfire followed by either send department, contact action.Finally,file dossier consumes two tokens and produces one token.Thefiring rule determines the set of so-called reachable markings of a marked P/T-net.A marking s is reachable from the initial marking s0of a marked net(N,s0)if and only if there exists a sequenceof enabled transitions whose execution leads from s0to s.This paper uses the following notations for sequences.Let A be some alphabet of identifiers.A sequence of length n,for some natural number n∈I N,over alphabet A is a functionσ:{0,...,n−1}→A.The sequence of length zero is called the empty sequence and writtenε.For the sake of readability,a sequence of positive length is usually written by juxtaposing the function values:For example,a sequenceσ={(0,a),(1,a),(2,b)},for a,b∈A,is written aab.The set of all sequences of arbitrary length over alphabet A is written A∗. Definition2.6.(Firing sequence)Let(N,s0)with N=(P,T,F,ℓ)be a marked,labeled P/T-net in .A sequenceσ∈T∗is called afiring sequence of(N,s0)if and only ifσ=εor,for some positive natural number n∈I N,there exist markings s1,...,s n∈(P)and transitions t1,...,t n∈T such thatσ=t1...t n and,for all i with0≤i<n,(N,s i)[t i+1 and s i+1=s i−•t i+1+t i+1•.Sequence σis said to be enabled in marking s0,denoted(N,s0)[σ .Firing the sequenceσresults in the unique marking s,denoted(N,s0)[σ (N,s),where s=s0ifσ=εand s=s n otherwise.The marked,labeled P/T-net(N,[i])shown in Figure2.2has many enabledfiring sequences.For example,firing sequence register classify department is enabled.Executing this sequence results in marking[pending cust].As mentioned,a marking of a labeled P/T-net is reachable if and only if there is afiring sequence leading from the initial marking to that marking.Definition2.7.(Reachable markings)The set of reachable markings of a marked,labeled P/T-net (N,s)∈with N=(P,T,F,ℓ),denoted[N,s ,is defined as the set{s′∈(P)|(∃σ:σ∈T∗: (N,s)[σ (N,s′))}.Consider for example the marked,labeled P/T-net(N,[i])shown in Figure2.2.There are twofiring sequences leading to marking[o].Therefore,[o]is reachable.In total,there are seven markings reachable from[i].For the purpose of analyzing processes defined by P/T-nets,many properties have been defined and studied.Some properties refer to the net structure,while others refer to the dynamic behavior of a marked P/T-net.The following two definitions refer to structural properties.Thefirst definition uses the standard notations for the inverse of a relation R(R−1)and the reflexive and transitive closure of R(R∗).Definition2.8.(Connectedness)A labeled P/T-net N=(P,T,F,ℓ)is weakly connected,or simply connected,if and only if,for every two nodes x and y in P∪T,x(F∪F−1)∗ N is strongly connected if and only if,for every two nodes x and y in P∪T,x F∗y.In the remainder of this paper,we assume all nets to be weakly connected.Moreover,we assume all nets to have at least two s without places or transitions do not make any sense.Another structural property is the so-called free-choice property.Definition2.9.(Free-choice P/T-net)A free-choice P/T-net is a(labeled)P/T-net(P,T,F,ℓ)as in Definition2.1such that,for all transitions t,u∈T,either•t∩•u=∅or•t=•u.Free-choice P/T-nets are characterized by the fact that two transitions sharing an input place always share all their input places.From a pragmatic point of view,the class of free-choice P/T-nets is of particular interest;many workflow management systems use a diagramming technique which corre-sponds to free-choice nets.The class of free-choice P/T-nets combines a reasonable expressive power。
PWC中国企业改造工具库—2dbenchmaringexplanation

Benchmarking _________________________________________________________________ 2 Benchmarking defined _________________________________________________________ 2 What is a Best Practice? ________________________________________________________ 2 What is Benchmarking? ________________________________________________________ 2 Enterprise Benchmarking _______________________________________________________ 3 Concluding Considerations ______________________________________________________ 4 Ratios ________________________________________________________________________ 4 Financial ratio analysis _________________________________________________________ 4 The limitations of ratio analysis __________________________________________________ 5 Non financial ratios ___________________________________________________________ 6 Key ratios ___________________________________________________________________ 6 Process mapping _______________________________________________________________ 9 Introduction _________________________________________________________________ 9 What Is A Process? ____________________________________________________________ 9 What Is Process Management? ___________________________________________________ 9 Why Are Processes Important? _________________________________________________ 10 Managing Processes To Improve Performance _____________________________________ 10 Process Mapping Techniques ___________________________________________________ 10 Level 1 Map ________________________________________________________________ 13 Level 2 Map ________________________________________________________________ 13 Level 3 Map ________________________________________________________________ 14 Process Analysis _____________________________________________________________ 14 Note On Value-Added Activities ________________________________________________ 15 Processes to be mapped _______________________________________________________ 16•In addition to the general review of a business discussed in the previous sections, application of other business analysis techniques from both within the business under review, and by looking outside, are capable of providing additional, valuable information about the business.•In this section we discuss:➢Benchmarking;➢Ratio analysis;➢Process mapping.BenchmarkingBenchmarking defined•"Benchmarking is a tool to help you improve business processes. Any business process can be benchmarked."•"Benchmarking is the process of identifying, understanding, and adapting outstanding practices from organizations anywhere in the world to help the client organization improve its performance."•"Benchmarking is a highly respected practice in the business world. It is an activity that looks outward to find best practice and high performance and then measures actual business operations against those goals."What is a Best Practice?•To us, "best practices" are documented strategies and tactics employed by highly admired companies. These companies are not "best-in-class" in every area - such a company does not exist.But due to the nature of competition and their drive for excellence, the profiled practices have been implemented and honed to help place their practitioners as the most admired, the most profitable, and the keenest competitors in business.•This information can be gained from a variety of sources. In some cases, this information is based on interviews, surveys, and other mechanisms of "primary" research - information that is simply not available in the public sector.•Other sources are distilled insights from secondary research -- books, magazines, libraries, Internet, and other public-domain resources. This is the more typical source of information for Consultants (particularly the internet).What is Benchmarking?•Benchmarking is a tool for improving performance by learning from best practices and understanding the processes by which they are achieved. Application of benchmarking involves four basic steps:➢Understand in detail your own processes;➢Analyse the processes of others;➢Then, compare your own performance with that of others analysed;➢Finally, implement the steps necessary to close the performance gap.•It follows that benchmarking involves looking outward (outside your own organisation, industry, region or country) to examine how others achieve their performance levels and to understand the processes they use. In this way benchmarking helps explain the processes behind excellent performance.•When the lessons learnt from a benchmarking exercise are applied appropriately, they facilitate improved performance in critical functions within an organisation or in key areas of the business environment.•Benchmarking is above all a practical tool. It is constantly evolving in the light of ever increasing experience, applying it to different organisational and cultural settings.Enterprise Benchmarking•At enterprise level, benchmarking is a tool for supporting management strategies. It is oriented towards continuous improvement through the identification and adaptation of best practice at process, organisation and management level, so leading to increased competitiveness.•It is a tool which can be applied irrespective of company size. Best practice examples are frequently found outside the industry sector in which the company operates. Thus, it is neither necessary nor desirable to confine a benchmarking exercise to competitor companies. The application of benchmarking by a company involves a number of stages, as illustrated below: ➢ A company first applies diagnostic benchmarking to explore the relative performance of different functions in the business. This diagnostic phase is normally a short duration analysis.It is often based on a questionnaire, which asks a manager to rate the company against a set of business criteria.➢The second stage, holistic benchmarking, involves examining the totality of the business. This is used to identify key areas for improvement within the business. It is more in-depth than the diagnostic phase. It examines all areas of the business. It addresses qualitative aspects by looking at systems and processes in the company. It also provides quantitative information based on trends and ratios. This diagnostic-holistic approach provides a relatively simple introduction to benchmarking. It offers structured, cost-effective feedback and requires only a minimum of resources to implement. It enables companies to improve their performance by identifying critical competencies, strengths and weaknesses, and then to use the lessons learnt from best practice in making the necessary improvements.➢In the third, mature stage, the company graduates to process benchmarking. This focuses on seeking to improve specific processes in order to achieve world-class performance. The first step is to specify a process, or a series of interconnected processes, to be studied. Process benchmarking helps a company find innovative solutions and offers a means of transferring them into the business. When correctly applied, process benchmarking fosters a learning culture in which knowledge is shared and there is a continuous striving for greater understanding. It can also be used to achieve improved performance in back-office functions within the company that are not directly under competitive pressure. Examples of possible results of the use of process benchmarking include:▪new or improved processes with shorter lead times;▪standardisation of activities;▪development of communication skills; and enhanced process orientation and team work. Concluding Considerations•Benchmarking should not be considered a one-off exercise. To be effective, it must become an integral part of an ongoing improvement process with the goal of keeping abreast of ever-improving best practice.•Finally, irrespective of the organisational context of a benchmarking initiative, open and committed high-level support is a prerequisite for success. Those in positions of authority must be prepared to accept criticism of current performance and provide the necessary leadership to bring about sustained improvement.Ratios•Ratio analysis is perhaps the most common technique used in benchmarking activities. Typically this applies to financial ratios, but can also be applied to other areas of a business.Financial ratio analysis•Financial statement ratio analysis involves:➢Comparing the firm’s performance with other firms in the same industry➢Evaluating trends in the firm’s financial position over t ime.•Financial statement ratio analysis can:➢Help management identify deficiencies and then take actions to improve performance;➢Help creditors or management ascertain a company’s ability to pay its debts;➢Evaluate risk and return.•Ratio analysis is based around understanding and interpreting financial statements. It is important to recognise and understand that ratio analysis does not supply definitive answers - it is merely one tool analysing financial and other information.•The methodology for calculating ratios must be applied consistently from period to period, in order for the ratios to make sense and to be able to be compared.•The comparisons that can be made when looking at a company's results include: ➢intra-industry comparisons - comparing one company with another company in the same industry;➢inter-industry - comparing one company with companies in different industries;➢intra-company - comparing one company's ratios across a period of time;➢arbitrary standards - comparing ratios to traditional standards or rules of thumb.•Because ratios are expressed as a percentage or relative measure, we can compare businesses of different sizes.•Ratio analysis is used:➢to identify trends - we need to make sure reasons behind those trends are still valid;➢as a tool to assist in forecasting earnings - examining margins, proportion of expenses to sales, etc.;➢to identify dangers or strengths - current ratio, look at composition of assets, actual cash balances held, etc..➢to aid in the search for under-valued assets, poor management, cash flow problems, etc.The limitations of ratio analysis•These include:➢Complexity of business relationships:▪continuously changing▪acquisition / divestment▪last year's ratios could now be meaningless➢Dangers in numbers:▪mathematics only▪numerator divided by denominator➢Benchmarks:▪Ratio analysis is designed to eliminate size differences across firms and over time, thus allowing for more meaningful comparisons. However, ratios may suffer from lack of anappropriate benchmark to indicate an optimal level.;▪As many large firms operate different divisions in different industries, for such companies it is difficult to develop a meaningful set of industry averages for comparative purposes.Thus ratio analysis is more useful for small, narrowly focused firms than large,multidivisional ones;▪The benchmark may have limited usefulness if the whole industry or major firms in the same industry are doing poorly.➢Timing and Window Dressing:▪Financial information used to compute ratios are available only at specific points in time, primarily when financial statements are issued. For annul reports, these points in timecorrespond to the end of a firm’s financial year / period, and the reported levels of assetsand liabilities may not reflect the firm’s level of normal operations (especially in the caseof seasonal businesses);▪The timing issue leads to another problem. Firms can employ “window dressing”techniques (manipulation of the ratios) to make their financial statements look stronger ormore favorable especially for the year end period.➢Accounting Methods:▪Accounting policies are frequently subjective, as demonstrated by their use of words such as "estimated", "likely", "appropriate", "normal", "foreseeable", "probable" and"expected";▪In practice, companies with an apparently similar accounting policy may adopt different approaches to an item of income or expenditure. These different approaches, oraccounting methods, can result in different effects from company to company;▪The effect of adopting a more aggressive accounting method than other businesses in the industry may be to reduce the reported profits compared with competitors;▪Accounting conventions and choice of accounting methods can greatly affect income and balance sheet accounts. Thus ratios resulting from differing accounting methods will notbe comparable either across firms or overtime (either within the firms or other firmswithin the same industry).•Ratio analysis is useful, but analysts should be aware of these problems and make adjustments as necessary. Ratios are not to be viewed as an end unto themselves but rather as a starting point for further analysis.Non financial ratios•As indicated above, ratios do not have to be restricted to financial items. Non-financial data such as employee ratios of sales per employee or profit per employee are common.•Such ratios will depend on the type of activity carried out by the company. For a road haulage company, for example, a useful ratio might be profit per road mile traveled or, for an airline, profit per passenger mile or costs per passenger mile might be useful.Key ratios•Common financial ratios used in the restructuring of debtors include:Balance Sheet RatiosSolvency related ratios:Current ratio Current assetsCurrent liabilities Measures the liquid and near liquid resources available to pay short term creditorsDebt to total assetsTotal debtTotal Assets Measures ability to covertotal liabilitiesQuick ratio (acid test) Current assets minus stocksCurrent liabilities Measures the more readily realisable or liquid assets available to pay creditorsDebt to equity ratioTotal debtTotal equityMeasure the ratio ofborrowings (debt) toshareholder funds to fund theassets of the companyOther balance sheet ratios:Debtor turnover Sales for the period (inc.VAT)Trade debtors Measures the efficiency of collections by giving the number of times debtors are turned overCreditor turnover Purchases for period (inc.VAT)Trade creditors Gives the number of times that the trade creditors are turned overStock turnover Cost of sales for the periodStock at the end of the period Gives the number of times that the stock has been turned over in the periodDebtor days (count back basis) Month end trade debtorsSales (incl. VAT) in prior1, 2, 3 or 4 monthsWhen calculated over anumber of month ends givesan indication of the averagetime taken to collectoutstanding debtsCreditor days (count back basis) Month end trade creditorsPurchases (incl. VAT) inprior1, 2, 3 or 4 monthsWhen calculated over anumber of month ends givesan indication of the averagetime taken to pay outstandingtrade liabilitiesStock turnover period (days) Stock at the period end x 365Cost of sales for the period Gives the average period that items have been held in stockSales and profits related ratiosReturn on equity ("ROE") %Profit after interest beforetax and extraordinary itemsAverage shareholders’fundsMeasures the efficiency inearning profits for ordinaryshareholdersEarnings per share ("EPS") Profit after int. & tax beforeext. itemsWeighted average numberof ordinary shares on issue Measures the return per share available to the ordinary shareholdersPrice-earnings ratio ("PE ratio") Market price per shareEarnings per shareReflects the Stock Market'sexpectations of futureearningsAsset turnover Total salesAverage net total assets Measures the performance of the company in generating sales from the assets at its disposalCash Flow related ratiosCash return on capital employed %Net cash inflow fromoperationsAverage capital employedMeasures the cash returngenerated by the capitalemployed in the business(cash equivalent of ROCE)Cash interest cover Net cash inflow fromtradingInterest paid Measures the sufficiency of cash from trading for the payment of interestProcess mappingIntroduction•Understanding and managing processes at work became an important objective for many organisations around five years ago. It was realised that process improvement was a key way of achieving greater effectiveness, since well designed processes could result in:Improved relationships with suppliersImproved responsiveness to clients and end-users of servicesImproved quality of serviceHigher productivity from individuals and teamsLower costsMaximum benefits from new technologiesImproved levels of employee skills and satisfaction•Before we look at the concepts and techniques involved in managing through processes it might be useful to start with a couple of definitions.What Is A Process?•Processes define the ways in which resources are used in an organisation to allow it to achieve its goals. The features of a process are definable inputs, a logical sequence of activities representing work done with the inputs and a quantified outcome or result. At an individual level we have all developed processes to help us get things done, for example making a cup of tea or going on holiday with the family.What Is Process Management?•Process management is a structured approach to analysing and improving fundamental activities in an organisation, typically in terms of quality, cost or timeliness of service provision.•It has close links to the quality management concept of continuous improvement. It can be applied across a whole organisation, to a specific department or unit or even to the activities of an individual. It is:A technique for visually analysing what is done and how it is doneA problem-solving aidA communication vehicle and a means of empowering staff•Process management can be described as best practice for the routine operation of an organisation.It has two particularly important features:A strong focus on customers – rather than defining work in terms of responsibilities, process management starts with defining customer requirements and then focuses on the processes needed to deliver services and products to meet these requirementsThe concept of process ownership – in other words an individual is made responsible for ensuring that the process delivers effective results and for finding ways of improving the process so that it can become even more effective.Why Are Processes Important?•Processes define how the organisation uses its resources, and any organisation has a responsibility to use its resources as wisely as possible. Many organisational processes may not have been designed carefully and as a result they can contain bottlenecks or disconnects which cost time, money or reputation. Common sense tells us we should keep processes under review and try to fix any problems that we find in them.Managing Processes To Improve Performance•There are three fundamental steps:Documentation and analysis of existing processes (usually called Process Mapping)Design of processes which will allow better levels of performance to be achievedImplementation and evaluation of these new processesProcess Mapping Techniques•Process mapping is a technique for identifying pictorially the steps taken to achieve a desired end result. It is primarily a thinking aid and problem-solving/decision-making tool and is generally used to involve a group of people in looking at the way something is done and coming up with ideas for doing it more effectively.•It can be applied in a number of ways:As is - identifying how things actually are done in practiceShould be - clarifying how things should be done according to established proceduresCould be - suggesting optional ways of doing things in futureTo be - specifying how things will be done in future•As well as a means of identifying desirable changes in an organisation, Process Mapping can be used as a communications or training tool, for example to promote better understanding between departments of how things are done or to give a member of staff an overview of how their job contributes to the big picture.•To start to flesh out the definition above, we can think of a process as a sequence of activities which converts inputs into outputs.INPUTS ⇒⇒ OUTPUTS• Inputs can be information (reports, computer print-outs, correspondence etc.), knowledge,materials, equipment or facilities.• Activities are whatever is done to or with the inputs to deliver the end result. Typically theyinvolve applying policies, procedures, techniques or methodologies. They may involve the use of tools or machinery.• Outputs are the deliverables or end results of the process which are used by a client or end user,either internal or external.• Applying this to an everyday example like making a cup of tea would give us: • Showing a process in this way gives us an idea about what is happening, but a much clearerpicture can be developed by drawing a map. Like any other map, we need some symbols:•outputHere are examples to show the use of these symbols.Level 1 Map• This is a high level map giving an overall view of the organisational functions involved inproducing an output. Each box in the map represents a major process chain, a group of processes which are linked together.Level 2 Map• A Level 2 Map takes a major process chain and identifies the individual processes in that chain.External customer InvoiceLevel 3 Map•This takes a Level 2 process and breaks it down into the tasks that are completed and the outputs produced. This is the level that is usually analysed when we are looking for improvement opportunities in a process. We can follow through on our example by detailing the activities in the Sales Process.Process Analysis•Once we understand the process and have it mapped we can look for improvement opportunities.One way of doing this is to classify each of the tasks in the process using a framework like this: Value-added V A task required to produce the service or product that the customerwantsPreparation P Getting ready to perform a taskQueue/wait Q An idle state when no work is being doneMove/transport M Moving people, information or other things from one location toanotherInspect/check I Ensuring a task was performed correctlyRedundant R Unnecessary or duplicate performance of a task•The reason for doing this analysis is to try to find ways of cutting out non value-adding tasks froma process. If the reason for doing a a task is anything other than “the customer needs it”, then weshould try to eliminate or change the task so that it uses less time and resources.•Good questions to ask when you are reviewing a process include:Guidelines For Process RedesignIs there a reason for this activity?Is the activity at the right location?Is the activity undertaken in an effective way?Is the activity completed at the appropriate time?Is the activity completed by the appropriate person?Note On Value-Added Activities•Ideally, we want to ensure that all tasks in a process are value-added, in other words directly associated with producing the output that the customer is expecting. There are two types of value-added tasks:Customer Value-Added – work done which directly contributes to the required output, for example a consultant preparing a set of recommendations for a client.Value Enabling Tasks – work done to allow a value-added task to be completed, for example the consultant referring to market research material to allow a recommendation to be developed.•By the time we have mapped a process and analysed it, we probably have some ideas about what we want to change. To make sure we have considered all the possibilities, here are some best practice guidelines:Eliminate redundant and non value-adding activities (as discussed above)Focus attention on parts of the process which:▪Take a long time to complete▪Incur significant costs▪Have significant impact on the quality of the outputOrganise around outputs that the customer wants. For example:▪Locate people and facilities needed to produce the outcome close to each other▪Give one person complete responsibility for all the tasks needed to produce the outcome▪Ensure that someone is responsible for checking customer satisfaction with the outcomeBuild in quality at the source to eliminate the need for inspection. For example:▪Ensure that the initial input to the process is of the right quality▪Ensure that everyone who works on the process understands the quality standards for the work that they do▪Use standardised best practice procedures but continue to look for improvements on current best practice•Ensure th at there is a “process owner” – an individual who is responsible for the effectiveness and quality of the process and who is also responsible for monitoring results and continuing to look for possible improvements.Processes to be mapped•Below is the suggested list of areas to be focused on for process mapping & business analysis.This list has been taken from the indicative deliverables in the standard TOE. Please note that this list is not exhaustive.➢Financial : Financial and Cost Management:▪Current budgeting process▪Management Accounting System (processes), including Costing▪Management Reporting system (processes)▪Key Performance Indicator (KPI) reporting processes➢Financial : Cost and Cash Flow Management:▪Cost management process▪Inventory management process▪Purchasing management process▪Customer credit management process▪Accounts receivable management process▪Internal documentation control process▪Internal Information crisis control system (process)➢Marketing and Sales Management:▪Marketing and Sales Management Process▪Marketing information (system) process▪Marketing Mix (Plan) process▪Sales forecasting process▪Other business analysis to support TOE deliverables as required.➢Human Resource Management (HRM):▪Client’s human resource manageme nt processes▪Staff recruitment process➢Health, Safety and Environment Protection Management:▪Production process mapping▪Input / Output balanceRelevant Toolkit Practice Aid。
- 1、下载文档前请自行甄别文档内容的完整性,平台不提供额外的编辑、内容补充、找答案等附加服务。
- 2、"仅部分预览"的文档,不可在线预览部分如存在完整性等问题,可反馈申请退款(可完整预览的文档不适用该条件!)。
- 3、如文档侵犯您的权益,请联系客服反馈,我们会尽快为您处理(人工客服工作时间:9:00-18:30)。
A METHODOLOGY FOR ENTERPRISE PERFORMANCE MANAGEMENTAdrien R. Presley,Truman State University100 East NormalKirksville, Missouri 63501816.785.4346L.E. Whitman, Donald H. LilesAutomation & Robotics Research InstituteThe University of Texas at Arlington7300 Jack Newell Blvd. S.Fort Worth, Texas 76118817.272.5900ABSTRACTThis paper presents a methodology for the strategic management of enterprise performance. The methodology uses and integrates tools and methods for performance management found in literature and practice. The paper first presents an introduction to performance management systems and their requirements. It then reviews approaches to performance management. The paper concludes with a description of the Enterprise Performance Management Methodology, a methodology developed to address many of the shortcomings of current performance management systems.INTRODUCTIONStrategy implementation is concerned with putting in the systems of feedback and controls necessary to ensure that the strategies are successfully achieved. To support implementation, the performance measurement and management system (PMMS) should be a combination of goals, performance measures and feedback. The PMMS provides the feedback to management necessary to determine if the plans are being effectively implemented and to institute necessary corrective actions. It also is important in that it provides information necessary for strategy formulation. The literature commonly reports five important themes related to PMMSs (adapted from [1]). Derived from Strategy: The need for the alignment of the PMMS to strategy is well documented [6]. Kaplan and Norton [9] describe performance measurement as "a way to operationalize the vision of the company."Activity Based: The PMMS used for control and improvement of enterprise activities should be derived from strategy [6, 9]. Actions taken by managers and operators to control and improve business processes and activities should be guided by performance metrics that are congruent with strategy [7].Customer focused.: Performance measures should be customer focused and must measure what is important to both internal and external customers [2]. There must be a market focus and a clear understanding of who the customer is and what their values and expectation are. Dynamic: As the competitive environment becomes increasingly dynamic, so too must the PMMS. Businesses should institutionalize a system allowing for new metrics to be developed as needed. This ability can provide manufacturers with a competitive advantage [6]. Participative Development Approach: A participative approach should be used for developing performance metrics for enterprise activities [2]. The development team should include the people who are responsible for the activities to be measured to help ensure acceptance of the metrics by the people who will use them.Other Desirable Characteristics: Among the basic structural characteristics that metrics must possess are that they should be consistent, easy to understand, easy to calculate, based on reliable, timely, and easily gatherable data, be at the appropriate level of detail, and minimal in number.REVIEW OF CURRENT PMMSIn this section we review two approaches to performance management developed to address the types of issues presented in the previous section: Activity Based Costing and Management (ABC/ABM) and the Balanced Scorecard Approach.ABC/ABMActivity based costing (ABC) was developed because of the inadequacies of cost accounting systems developed many years ago in accurately reflecting the costs of producing products and services [5]. Since the 1950s, businesses have extensively relied on cost accounting information for product costing for strategic product line decisions, and performance measurement for managing operations [8]. However, the accounting systems as designed were not equipped to provide the information necessary to make product line decisions and to control the firm at the overall, subunit, and individual levels. The fundamental difference between traditional cost accounting and ABC is that ABC asserts that it is not the making of products that directly affect costs. Activities directly affect costs. Traditional accounting systems allocate costs to products. In ABC, costs are allocated to activities. Activities and their costs are allocated to products [4].The logical extension to ABC was to use the data collected for uses other than product costing. The focus of Activity Based Management (ABM) is on the use of ABC information for management control [8] and continuous improvement [3]. ABM involves a new paradigm which involves moving away from the traditional functional view of organizational structure to one that facilitates a cross-functional view of the effectiveness of activities and business processes [3]. It attempts to better manage the value adding activities and to eliminate or reduce non-value adding activities.The Balanced ScorecardKaplan and Norton [9] introduced the concept of the balanced scorecard as a way to overcome problems with traditional performance measurement systems. The balanced scorecard is presented as a comprehensive framework that translates a company’s strategic objectives into a coherent set of performance measures. The scorecard looks at the business from four perspectives: 1) financial-how the company looks to its shareholders, 2) customer -how the company creates value for its customers, 3) internal business processes - which processes the company must excel at to meet its other goals, and 4) innovation and learning - how the company constantly improve itself.THE ENTERPRISE PERFORMANCEMANAGEMENT METHODOLOGYHaving presented the issues in enterprise performance measurement and management, we now present the Enterprise Performance Management Methodology (EPMM), a comprehensive methodology developed to address these issues. The methodology uses techniques and methods found in academic and industry literature and practice including the approaches described the previous section. It integrates activity based management with the use of a comprehensive set of performance measures.The EPMM has capability in two related areas: 1) the justification of new or proposed systems, and 2) the monitoring and management of ongoing enterprise performance. In both of these activities, many of the same concepts and measures are utilized. “System”, in this context, can refer to any practice, process, or technology. The performance to be monitored and managed is that which results from the implementation of the system, with an emphasis on the activities of the enterprise. A typical use of the EPMM would be to first use its justification capability to select a system to be implemented and then to monitor its effect on the enterprise through its impacted activities. The same metrics would likely be used for both purposes, although different metrics could be used. The EPMM could also be used as strictly a justification or performance management tool. The EPMM predicts and measures impact at the enterprise level. The EPMM requires that distinct objectives, strategies, and processes be identified for the enterprise.The methodology is realized as a set of forms and matrices which leads the user through the process. Relevant information to the analysis are first documented in forms. Based on the information in these forms, matrices similar to QFD matrices are created. These matrices link the system or process under consideration to the enterprise, both in terms of activities affected and strategic areas impacted. The methodology allows for the integration of strategic metrics with more traditional cost metrics in arriving at a final "score" for the alternative. The methodology encourages and supports a group-based approach to analysis. Included in the methodology are explicit considerations of importance rankings and utility functions to allow for the capture of the decision maker's (either an individual or group of individuals) preferences. At the highest level, the methodology is organized into five phases: Identify System and Transition Impact, Estimate Costs and Benefits, Perform Justification Analysis, Audit Decision, and Track Performance.The objective of the Identify System and Transition Impact phase is to identify the enterprise activities and strategies which are impacted by the system. Strategic impacts to be considered include those relating to product, process, organization, culture, and technology. System impact is determined by analyzing the relationship between the enterprise and the system being analyzed. In effect, linkages are drawn between enterprise activities, as represented by a enterprise reference model, and thecomponents of the system that interact with the activities. Linkages are also drawn between enterprise strategies and the strategic attributes of the system. One output of this phase is a set of analysis matrices identifying the activities and strategies affected by the system. The matrices form the basis of analysis to be performed later.In the Estimate Cost and Benefits phase, the analysis matrices are populated with the cost and benefit data necessary to perform the analysis. Activity based approaches may be used to accurately represent cost, benefit, and performance data. Strategic data may need to be quantified. Quantification approaches may include relative importance weighting, ordinal ranking, analytical hierarchy process, or a number of importance perception or ranking techniques.The objective of Perform Justification Analysis phase is to perform the traditional and strategic analyses using the previously documented impact of the system. The traditional and strategic approaches are integrated in a meaningful manner with the results documented and presented to the decision maker. This analysis will result in a business case for the new system. The main output is the decision on the system (if any) to implement.The Audit Decision phase performs an audit of the decision process some time after the decision has been made and the technology implemented. When this audit takes place may vary depending on the technology and the company involved. The purpose of the audit is to review the justification process for improvement.The Track Performance phase tracks the performance of the implemented technology. The completion of the analysis and the resulting justification decision is the initial phase of the performance management process. The enterprise and system performance must be monitored. This monitoring will focus on how the enterprise performance has been impacted by the implementation. The performance of the enterprise and its practices, processes and technologies are monitored to ensure that the enterprise is making desired progress toward its strategies. The output of this component of the monitoring activity is performance information (as measured by strategic and traditional (cost) metrics) including deviation from desired performance.IMPLEMENTATION EXPERIENCESTo date, the methodology, either in part or in whole, has been applied at several companies in a range of industries, including aerospace and automotive. The applications have included analyzing investments in computer technologies and research project selection. Feedback to date has been generally favorable. Most of the comments from the use have been in regard to the magnitude and breadth of the methodology. This was to be expected as the methodology is very comprehensive in its analysis and requires the consideration of many factors. However, it should be pointed out that the problems for which the methodology are to be applied are not trivial. The systems under consideration in the analysis will likely be those having significant long-term strategic impact. Comments from the use are being incorporated into the methodology.ACKNOWLEDGMENTSThe research described in this paper was supported in part by grants from the National Center for Manufacturing Sciences and the National Science Foundation supported Agile Aerospace Manufacturing Research Institute.REFERENCES1. Adams, S. M., J. Sarkis and D. Liles (1995). “TheDevelopment of Strategic Performance Metrics.”Engineering Management Journal 7(1): 24-32.2. Bititci, U. S. (1994). “Measuring your way to profit.”Management Decision 32(6): 16-24.3. Campi, J. P. (1992). “It's Not as Easy as ABC.”Journal of Cost Management 6(2): 5-11.4. Cooper, R. (1988). “The Rise of Activity-BasedCosting--Part One: What Is an Activity-Based Cost System?” Cost Management (Summer): 45-54.5. Cooper, R. and R. S. Kaplan (1992). “Activity-BasedSystems: Measuring the Costs of Resource Usage.”Accounting Horizons(Sept): 1-13.6. Dixon, J. R., A. J. Nanni, Jr. and T. E. Vollmann(1990). The New Performance Challenge: Measuring Operations for World-Class Performance. Homewood, Dow Jones-Irwin.7. Govindarajan, V. and J. K. Shank (1992). “StrategicCost Management: Tailoring Controls to Strategies.”Cost Management (Fall): 14-24.8. Kaplan, R. S. (1988). “One Cost System Isn't Enough.”Harvard Business Review 66(1): 61-66.9. Kaplan, R. S. and D. P. Norton (1992). “The BalancedScorecard - Measures That Drive Performance.”Harvard Business Review 70(1): 71-78.。