Generation of Three Dimensional Finite Element Bone Models From CT Scan Datasets Abstract
桥梁隧道英汉文翻译
LONG-TERM DETERIORATION OF HIGHDAMPING RUBBER BRIDGE BEARINGIn recent years, high damping rubber (HDR) bridge bearings have become widely used because of the excellent ability to provide high damping as well as flexibility. However, there are few systematic studies on the deterioration problems of HDRs during their service life, and usually the long-term performance was not considered in the design stage. In this research, through accelerated thermal oxidation tests on HDR blocks, the property variations inside the HDR bridge bearing are examined. A deterioration prediction model is developed to estimate the property profiles. Then using a constitutive model and carrying out FEM analysis, the behavior of a HDR bridge bearing during its lifespan is clarified. A design procedure is proposed that takes the long-term performance in the site environment into consideration.Key Words:high damping rubber bearing, thermal oxidation, deterioration, long-term performance1. INTRODUCTIONSince Hyogoken-Nanbu earthquake that occurred on January 17th, 1995, bridge bearings have been widely adopted in Japan as an effective means to weaken the severe damage of steel and concrete piers due to an earthquake1), 2). Rubber is frequently applied in bridge bearings because of its special properties such as high elasticity and large elongation at failure. However, natural rubber cannot afford sufficient damping which is indispensable to a seismic isolation system. Usually rubber bearing is used together with steel bars, lead plugs, or other types of damping devices. In order to add energy dissipation to the flexibility existing in laminated rubber bearings, in the early 1980’s, the development in rubber technology led to new rubber compounds, which were termed high damping rubber (HDR). HDR material possesses both flexibility and high damping properties. The bridge bearings made of HDR can not only extend the natural period of the bridge, but also reduce the displacement response of structures3). Moreover, because of the inherent high damping characteristics of HDR, there is no need of additional devices to achieve the required levels of protection from earthquakes for most applications, so that the seismic isolation system becomes more compact.In the manufacture process of HDR, natural rubber is vulcanized together with carbon black, plasticizer, oil and so on. Consequently HDR possesses specific characteristics such as maximum strain-dependency of stress evolution, energy absorbing properties and hardening properties. Yuan et al.4) experimentally studied the dynamic behaviors of HDR bearing. Yoshida et al.5), 6) developed a mathematical model of HDR materials and proposed a three-dimensional finite element modeling methodology to simulate the behaviors of a HDR bearing numerically. Besides, a series of accelerated exposure tests were performed by Itoh et al.7),8) on various rubber materials including HDR to investigate the degradation effects of differentenvironmental factors. It was found that the thermal oxidation is the most predominant degradation factor affecting theHDR material. Since oxygen is able to permeate into the interior of a thick rubber, in this research the deterioration of HDR bridge bearings is assumed to be mainly caused by the thermal oxidation. For the purpose of clarifying the deterioration characteristics of bridge rubber bearings during their lifespan, some bearings practically in use were recalled and their mechanical properties were tested9)~11). However, because of their scatter nature and the lack of data, the long-term performance of HDR is not very clear. During the design process, usually the behaviors of deteriorated bridge rubber bearings during their lifespan are not considered.In the previous research, Itoh et al. 12), 13) studied the long-term performance of natural rubber (NR) bridge bearings. Through accelerated thermal oxidation tests carried out on NR blocks, the deterioration characteristics of both the outer and the interior regions were examined. Based on the test results, a prediction model was established to estimate the property profiles of the deteriorated NR bridge bearing. Then using the constitutive law proposed by Yoshida5), finite element model was built and the analysis was performed, which enabled the long-term performance of NR bridge bearing to be predicted. The relations among property variation, temperature, aging time and bearing size were also investigated.In this research, through the similar accelerated thermal oxidation tests on HDR blocks, the deterioration characteristics of HDR bridge bearings are studied, and their long-term mechanical performance is investigated by taking the site environment taken into consideration. The HDR specimens are provided by Tokai Rubber Industries, Ltd. It is possible that when suffered by aging, the HDR from other companies may behave differently due to the difference of chemical compound. The deterioration characteristics of the HDR material with other compounding ingredients and additives will be discussed in the future study.2. ACCELERATED THERMAL OXIDATIONTESTSAmong different degradation factors such as oxidation, ultraviolet radiation, ozone, temperature, acid and humidity, it is found that thermal oxidation changes the HDR properties more greatly than other factors5), resulting in an increase of HDR’s stiffness and a decreases of elongation at break as well as tensile strength. Besides, for thick rubbers, it is obvious that the surface is more easily affected by deterioration factors than the interior because of the diffusion-limited oxidation effect14), 15). In order to understand the variation of the material properties inside HDR bearings, accelerated tests were performed using rubber blocks focusing on the most significant degradation factor, thermal oxidation. The test method and results are described as follows.2.1 Accelerated thermal oxidation test methodFifteen HDR blocks were tested. The dimension is 220×150×50mm(length×width×thickness). The specimens were kept in a Thermal Aging Geer Oven. The acceleration test conditions are listed in Table 1. The temperatures were kept at three elevated temperatures, 60℃, 70℃, and 80℃in the oven. For the test at each temperature, the experiment duration were set as 5 stages, with the maximum of 300 days. The similar tests have already been performed on NR10). When the aging test was finished, HDR blocks were sliced into pieces with a thickness of 2mm. From each slice, four specimens with No.3 dumbbell shape were cut out16), as shown in Fig.1. The number of the specimens was 1,500 in total. Then through the tensile tests on these dumbbell specimens, the stress-strain curves were obtained, which represented the rubber properties at the corresponding position.In this research, strain energy was chosen for examination because it can exhibit the effect of thermal oxidation more remarkably than stresses at certain strains. In the following description, U100 stands for the strain energy corresponding to the strain of 100%, UB stands for the strain energy up to the break, and M100 stands for the stress corresponding to the strain of 100%. Similarly, U100 profile stands for the distribution of U100 inside HDR blocks, and property profile means the distribution of the mechanical properties such as stresses corresponding to certain strains, elongation at break (EB) and tensile strength (TS). As for the rubber breakage, EB is focused on. In addition, U0 and EB0 stand for U100 and EB in the initial state, respectively.2.2 Test results and examinationsThe profiles of U100/U0 and EB/EB0 at every test temperature are illustrated in Fig.2 and Fig.3, respectively. The horizontal axis shows the relative position with regard to the thickness of HDR block. The values 0 and 1 on this axis correspond tothe surface of the block. The vertical axis shows the normalized change of U100 with the original value regarded as 1.0 in Fig.2, and shows the normalized change of EB in Fig.3. In these figures, every point represents the mean value of four specimens from the same slice. Because of the scatter nature of rubber materials, at any position four specimens are tested in order to improve the accuracy. Since the oxidized rubber inhibits the ingress of oxygen, and considering the shape of the rubber block, the four specimens are cut out in the area of at least 25mm, a half of the block thickness, away from the around surface. Thus these specimens only reflect the property variations in the thickness direction. The standard deviation of every four-specimen group is quite small and usually less than 5% of the mean value.From Fig.2 and Fig.3, it can be found that at the earliest stage of the test, the material properties at the outside surface change together with the interior regions. The property variation of the interior region soon reaches the equilibrium state and maintains stable. However, the properties near the surface keep changing over the time, and change most greatly at the surface.From the surface to the interior, the properties vary less and less, until to a certain depth,which is called “critical depth”. The critical depth is about 11.5mm from the block surface at 60℃, 8.5mm at 70℃, and 6mm under 80℃. From the results of the same tests on NR blocks12), it is found that generally HDR and NR have a similar tendency of property variation. Both U100 and EB profiles display the features of a diffusion-limited oxidation. Initially the profiles are relatively homogeneous, but strong heterogeneity develops with aging. The properties in the outer region change more than the interior and keep changing over the time. However, unlike the case of NR, the interior region of HDR block experiences a rapid increase and soon reaches the equilibrium state. In contrast, the interior region of NR block does not change at all. In addition, after the same aging time, the property change at the surface of NR block is larger than that of HDR block, which means NR is more vulnerable to thermal oxidation.Fig.4 shows the time-dependency of U100 and EB at the surface and in theinterior of HDR blocks. The horizontal axis shows the deterioration time, and the vertical axis shows the material property variations compared to its initial state. The data of the block surface are taken from the top and the bottom surfaces, while the data of the block interior are taken from two slices close to the middle slice. Therefore, there are 8 points corresponding to every measuring time. From Figs.4(a) and 4(c) it is found that U100 and EB at the block surface change nonlinearly over the time. In Figs.4(b) and 4(d), the properties in the interior region vary in a very short time, and soon become stable. U100 increases by 20~40% and EB decreases by about 20%.Besides the accelerated thermal oxidation test, a HDR block was exposed to the environment of Nagoya, where the yearly average temperature is 15.4℃. The properties of each layer was measured and the profiles were obtained after one year. The normalized change of EB profile is shown in Fig.5. It can be seen that EB decreased by nearly 20% after only one year. This figure offers a good proof of the rapid variation speed in the interior of HDR during the earliest stage. Using the deterioration prediction model that is to be introduced in the following section, the simulation of the deterioration after one year is found to be close to the test results.From the test results, it is clear the deterioration characteristics of HDR block can be observed in two regions, one is in the interior region beyond the critical depth, where the properties only change at the earliest stage, the other is in the outer region from the surface to the critical depth, where the properties continue changing after a rapid initial change. Oxidation cuts the cross-links between chains and accelerates the reformation of molecule structure, however, the latter restricts the ingression of oxygen. It is thought that the equilibrium is reached at the critical depth. The oxidation is a process related to the time, however, the properties in the interior region only vary in a very short time. There should be a factor except for oxidation affecting the interior region of HDR block. Because the property variation in the interior region increases with temperature, it is assumed the reaction is related to temperature. Therefore, it is thought that there are two factors affecting the deterioration of the HDR material, temperature and oxidation. The interior region is mainly affected by temperature, and this reaction finishes in a relatively short time. However, for the outer region near the surface, temperature and oxidation affect HDR simultaneously at first. After the reaction due to temperature reaching the stable state, only the oxidation deterioration continues.3. DETERIORATION PREDICTION MODEL FORHDRBRIDGEBEARING 3.1 Quantification of deterioration characteristicsTo predict the long-term deterioration of HDR bridge bearing, it is necessary to quantify the deterioration characteristics. From the accelerated thermal oxidation test results, the deterioration pattern of the HDR block can be schematically expressed by Fig.6. The vertical axis U/U0 means the relative property variation, which is the ratio of the current material property U comparing to the original value U0. The horizontal axis shows the relative position inside the HDR block. The interior region beyond the critical depth d* is mainly affected by temperature, and the relative property variationis ΔUi. The outer region from surface to the critical depth d* is influenced by both temperature and oxidation, and the property changes most greatly near the block surface. The relative property variation at the bearing surface is represented by the symbol of ΔUs. When pro ceeding into the block, because of the decrease in the amount of oxygen, the oxidation effect becomes weaker, and the property variation also declines. Once exceeding the critical depth, the gradient of the Fig.5 EB/EB0 profile of HDR block in Nagoya (15.4℃)property profile becomes zero.Moreover, from the test results shown in Figs.2 ~5, it can be said that at the lower temperatures, the critical depth becomes larger, however the property variation rate in both the inner and the outer region becomes slower. Hence the property profiles of aged HDR block at different temperatures are expected to be similar to the one shown in Fig.7.3.1.1 Critical depthMuramatsu and Nishikawa17) discovered that the critical depth can be expressed as the exponential function of the reciprocal of the absolute temperature, and the following formula was proposed to express the relationship between the critical depth and the temperature.⎪⎭⎫ ⎝⎛=*T d βαexp (1) where, d* is the critical depth, T is the absolute temperature, and the symbols α and βare coefficients determined by the aging test.The exponential relationship between the critical depth and the temperature is shown in Fig.8. In this fig ure it is found that for HDR, α=0.00012mm, β =3.82×10-3.3.1.2 Property variation of interior regionThe accelerated thermal oxidation test results show that the interior region changes in a relatively very short time, and then keeps stable. The properties change so rapidly that the time-dependency may be neglected. The EB decreases by about 20% and showing no dependency on the temperature. However, the equilibrium state of strain energy is correlated with temperature, as shown in Fig.9. The exact tendency is not clear because of the lack of tests at lower temperatures. In this study, the change of the relative strain energy in the interior region is assumed to be an exponential function of the reciprocal of the absolute temperature as follows:⎪⎭⎫ ⎝⎛=∆T B A U i exp (2) where, ΔUi is the normalized strain energy variation of the interior region, T is the absolute temperature, and the symbols A and B are coefficients.The symbols A and B in Eq.(2) are found to be related to the nominal strain. The strain-dependency of the both coefficients is shown in Fig.10. In this figure, the coefficients A and B versus the strain between 25% and 500% are illustrated. Hence they can be correlated approximately using the following equations.21ln ln b b A +=ε (3a)21ln c c B +=ε (3b)where, εis the nominal strain, the symbols b1, b2, c1, and c2 are the factors determined by the aging test.3.1.3 Property variation at block surfaceThe property variation at the block surface can be deemed as the combined effect of temperature and oxidation. Temperature not only causes the change in HDR properties, but also accelerates the oxidation reaction.Figs.11 (a) and 11(b) show the relative change of U100 and EB at the bearing surface with the propFig.8 Relations between critical depth and temperatureertyvariations due to the temperature eliminated.At a certain temperature, the property of HDR ex-posed to the air depends on time. It is found that the increase of U100 and the decrease of EB are linear with the aging time. For other material properties, the similar relationship is proved. The time-dependency can be expressed by the following equation:1/0+⋅='t k U U s s s(4a ) where, U’s/ Us0 is the relative variation of strain energy at the surface of the rubber bearing due to the oxidation only, ks is coefficient and t is the deterioration time.The relative property variation at the bearing sur-face also depends on strain. The relationship betweenthe coefficient ks and the nominal strain εis shown inFig.12, and the following equation can be obtained.21a a k s +⋅=ε (4b )where, a1 and a2 are the factors determined by the test.Since the normalized property variation at the bearing surfaceΔUs is affected by the deterioration effects due to both temperature and oxidation, the following equation is obtained.()()111-∆+⋅⋅+=∆i s s U t k U (4c)3.1.4 Shape model of property profileA simple equation is necessary to express the property variation in the region from the rubberbearing surface to the critical depth. The property variation U(t)/U0 should be the function of the position x. The boundary conditions are:()S U U t U ∆+=1/0 ()l or x 0= (5a )()i U U t U ∆+=1/0 ()**-≤≤d l x d (5b)()0/=dx t dU ()*=d x (5c)where, U(t) and U0 are the HDR properties at time tand initial state, respectively. ΔUi andΔUs are the relative property changes of the interior region and the bearing surface, respectively. l is the width of the HDR bearing.If the property variation U(t)/U0 is assumed to be a square relation of the position x, the function can be expressed as follows: ()32210/g x g x g U t U ++= (6)Considering the boundary conditions Eq.(6) can be written as:()[]i S s sU w U w U U ∆-+∆+='11/0 (7) ()()()()⎪⎪⎪⎩⎪⎪⎪⎨⎧≤≤-⎪⎪⎭⎫ ⎝⎛---≤≤≤≤⎪⎪⎭⎫ ⎝⎛-=********l x d l d d l x d l x d d x d d x w 200 (8) where, w is the coefficient correlated with the position x, the critical depth d* and the width l of the HDR bearing.Next, if the relationship between U(t)/U0 and x is a 3-order equation, it is expressed by:()432210/g g x g x g U t U +++= (9)Eq.(9) is resolved using the boundary conditions, the following equation is obtained.()()()[]{}i S U w U w d x x g U t U ∆-+∆+-=*1/10 (10)From the test results, it is found that the influence of the first part of Eq.(10) is only about 0.01%~10% of U(t)/U0. For simplicity, in this study the square relation as Eq.(7) is adopted.3.2 Comparison with test resultsUsing Eqs.(1)~(6), the property profiles of the deteriorated HDR blocks can be estimated. Based on the test results, the coefficients in these equations are obtained and listed in Table 2. Through the comparisons between test results and simulations shown in Fig.13, it is found that the simulations of the critical depth, the property variations on the block surface and in the interior region are in good agreement with the test results. Thus the feasibility of the deterioration prediction method is verified. Using this model, the material property can be predicted at any position inside the HDR bearing, at any temperature and at any aging time.3.3 Activation energyIn the thermal oxidation test the temperature applied is much higher than the real environment.This is because high temperature can accelerate the deterioration18). The Arrhenius methodology3) is commonly used to correlate the accelerated aging results with the aging under service conditions. Gerenally the thermal oxidation is assumed to be the 1st order chemical reaction for rubber materials3). Then the aging time in the accelerated exposure tests can be converted into the real time under the service conditions through the following formula:⎪⎪⎭⎫ ⎝⎛-=⎪⎭⎫ ⎝⎛T T R E t t r a r 11ln (11) where, Ea is the activation energy of the rubber, R is the gaseous constant (=8.314[J/mol·K]), Tr indicates the absolute temperature under the service condition, and T is the absolute temperature in the thermal oxidation test. The symbols tr and t are the real time and test time, respectively.Since the rubber surface contacts with the air, the surface is thought completely oxidized. Therefore, the time-dependency of the properties at the surface are used to determine the activation energy, for example, the data in Fig.4(a) and Fig.4(c). The principle of time/temperature superposition by shifting the raw data to a selected reference temperature Tref is employed19). This principle is shown in Fig.14. The reference temperature is chosen as 60℃ so that the curve at 60℃ is the master curve. The shift factors aT are chosen to give the best superposition of the data. If the data adhere to an Arrhenius relation, the set of the shift factors aT will be related to the Arrhenius activation energy Ea by the following expression:⎪⎪⎭⎫ ⎝⎛-=T T R E a ref ar 11exp (12) The activation energy is calculated and listed in Table 3. The average value of Ea is about 9.04×10⁴[J/mol]. Then using the Arrhenius methodology, the property variations of HDR under any service condition may be predicted based on the accelerated thermal oxidation test results.。
基于RHT本构模型的钢渣混凝土SHPB模拟研究
33总174期 2023.12 混凝土世界引言混凝土是一种广泛应用于工程结构中的复合材料,其在动态荷载作用下的力学性能与静态荷载作用下的力学性能有显著差异,因此研究混凝土的动态本构关系对于理解和预测混凝土结构在冲击、爆炸等极端条件下的响应和破坏具有重要意义。
为描述混凝土在高应变率下的非线性、各向异性、损伤和孔隙压实等特征,许多学者提出了不同的动态本构模型,如HJC模型、RHT模型、TCK模型等。
其中,RHT模型是由Riedel、Hiermaier和Thoma提出的一种基于损伤力学和孔隙压实理论的混凝土本构模型,其具有形式简单、参数少、适用范围广等优点[1]。
钢渣是一种由高炉冶炼铁或转炉精炼钢时产生的副产品,其主要成分为氧化铁、氧化硅、氧化铝、氧化钙等[2],具有良好的物理力学性能和耐久性能,可作为混凝土中骨料或水泥的替代材料使用,从而提高混凝土的强度、耐久性和抗渗性,实现钢渣的资源化利用,减少环境污染[3-6]。
然而,目前对钢渣混凝土在动态荷载作用下的力学性能和本构关系的研究还较少,尚缺乏适用于钢渣混凝土的RHT动态本构模型。
因此,本文首先通过力学试验获得不同掺量钢渣混凝土的静态力学性能参数,包括轴心抗压强度、弹性模收稿日期:2023-9-13第一作者:常银会,1997年生,硕士,主要从事固废混凝土的研究与应用相关工作,E-mail:****************项目信息:宁夏回族自治区重点研发计划“煤电与冶金多固废协同高效制备绿色高性能混凝土关键技术与规模化应用”(2022BDE02002)基于RHT本构模型的钢渣混凝土SHPB模拟研究常银会 楚京军 侯 荣 刘亚娟宁夏赛马科进混凝土有限公司 宁夏 银川 750000摘 要:本文采用试验和数值模拟相结合的方法,对钢渣混凝土的静力学性能和冲击动力学性能展开研究。
在试验部分,制备了四种不同钢渣掺量(0%、25%、35%、45%)的混凝土试件,并对其抗压强度和抗拉强度进行测试。
3DEC-用户手册-概况翻译
3 Dimensional D istinct E lement C ode User’s Guide3dec 用户指南1 INTRODUCTION1.1 Overview3DEC is a three-dimensional numerical program based on the distinct element method for discontinuum modeling. The basis for this program is the extensively tested numerical formulation used by the two-dimensional version, UDEC (Itasca 1996). 3DEC simulates the response of discontinuous media (such as a jointed rock mass) subjected to either static or dynamic loading. The discontinuous medium is represented as an assemblage of discrete blocks. The discontinuities are treated as boundary conditions between blocks; large displacements along discontinuities and rotations of blocks are allowed. Individual blocks behave as either rigid or deformable material.3DEC是一个三维数值方案的基础上不连续建模的离散单元法。
本方案的基础是广泛的测试数值制定的二维版本,UDEC(1996年艾塔斯卡)所使用的。
钢梁吊装吊点的三维有限元分析
钢梁吊装吊点的三维有限元分析张盛华【摘要】This article applies the ABAQUS software to the establishment of the three-dimensional finite element model of the steel girder. In combination with the loads and boundary conditions, it makes a finite ele-ment analysis of the hoisting point of the steel girder as well as makes the relevant calculations, which focuses on the study of the stress situation of two kinds of hoisting points, serving as a reference in theory for the selection of the hoisting point.%文章以ABAQUS有限元分析软件为工具,建立钢梁三维有限元模型。
通过施加载荷和边界条件,对给定起吊条件下钢梁起吊点进行了有限元分析,并做了相关理论计算,重点讨论了两种起吊点的受力情况,对于钢梁起吊点的选择提供了理论依据。
【期刊名称】《南通航运职业技术学院学报》【年(卷),期】2015(000)002【总页数】4页(P28-31)【关键词】ABAQUS;吊点;有限元;钢梁【作者】张盛华【作者单位】领新南通重工有限公司技术部,江苏南通 226017【正文语种】中文【中图分类】TB301笔者所在公司承接制作的大型钢梁是某国码头轨道用重要结构,整根钢梁长而重,客户要求整体交付,且交付前必须将涂装防腐一并完成。
由于吊点处受力形式复杂,用传统的力学方法很难求解,且计算过程复杂,计算精度也相对较低,而采用有限元法进行结构强度和刚度分析,不仅准确、经济、高效,还能得出构件在不同吊点下的应力分布情况。
基于三角面元的涂层目标FDTD共形网格生成技术
万方数据万方数据-1886·系统工程与电子技术第32卷算面片的法向量的方法得到的都是目标的外法向。
注意:不同软件生成的三角面元数据文件的编号格式可能不同。
例如有的从0开始编号,而有的则从l开始编号,在采用FDTD建模程序读取这些数据文件时要注意。
编程实现的具体步骤如F:(1)读人模型的三角面元数据文件。
首先,由文件1中数据的行数确定面元的个数Nface,由文件2中数据的行数确定顶点的个数Npoint。
然后,将文件l和文件2分别读入建模程序。
(2)求各三角面元的单位法向量。
搜索各面元所包含的三个顶点的编号,依次判断出包含各顶点的面元,并计算出相应各面元的单位法向量。
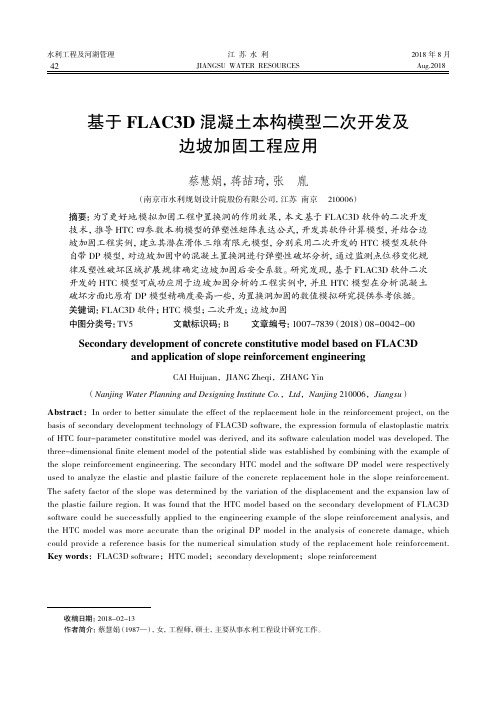
图2为包含点A的三角面元示意图。
D图2包含顶点A的三角面元如图2所示,假设共有7个围绕顶点A的三角面元:ABC、ACD、ADE、AEF、AFG、AGH、AHB。
三角面元ABC的顶点坐标分别为A(z^,Y^,z^),B(zB,YB,zB),C(xc,yc,zc),面元ABC所在平面,c的方程可写为a.T+by+倪一d(1)则面元ABC的单位外法向矢量为五,={a,b,c}/ ̄/口2+b2+C2(2)同理,按照上述方法可依次计算出三角面元ACD、ADE、AEF、AFG、AGH、AHB所在平面的单位外法向矢量。
(3)求各顶点的单位法向矢量。
将包含顶点A的7个三角面元的单位法向矢量求和得到的矢量即近似为目标表面在顶点A处的法向矢量。
A点的单位外法向矢量可写为h一一∑而,/I∑而。
I(3)以的3个分量,即3个方向余弦记为(z,m,咒)。
(4)根据涂层厚度,求各顶点移动后的坐标。
假设涂层厚度为d。
,将点A沿法线移动到点A7,使XA-'一士d。
献(外涂层取“+”,内涂层取“一”),如图3所示,A7的坐标为0.2m后,将原来的三角面元和移动后的三角面元同时显示时的结果。
(a)顶点爿内移(b)顶点A外移图3顶点A沿法线方向移动示意图图4涂敷发动机叶片的三角面元模型1.3局部涂敷的实现在实际工程应用中,为了减小目标的雷达散射截面(radarcrosssection,RCS),通常只在目标的强散射中心涂敷吸波材料,所以需要进行局部涂敷。
工业摩擦润滑技术国家地方联合工程研究中心技术委员会成立
108润滑与密封第45卷轮轨空间动态行为的影响,结果表明,轮轨系统动态响应随着非圆化磨耗幅值的增大而增大,但随非圆化磨耗阶次和车辆运行速度则呈非线性变化趋势。
参考文献[1]JOHANSSON A,NIELSEN J0.Out-of-round railway wheels:wheel-rail contact forces and track response derived from field tests and numerical simulations[J].Proceedings of the Institution of Mechanical Engineers,Part F:Journal of Rail and Rapid Transit,2003,217(2):135-146.[2]TAOG Q,WANG L F,WEN Z F,et al.Measurement and assessment of out-of-round electric locomotive wheels[J].Proceedings of the Institution of Mechanical Engineers,Part F:Journal of Rail and Rapid Transit,2018,232(1):275-287.[3]MORYS B.Enlargement of out-of-round wheel profiles on highspeed trains[J].Journal of Sound and Vibration,1999,227(5): 965-978.[4]ZHONG S Q,XIONG J Y,XIA0X B,et al.Effect of the first twowheelset bending modes on wheel-rail contact behavior[J].Journal of Zhejiang University Science A,2014,15(12):984-1001.[5]TAO G Q,WANG L F,WEN Z F,et al.Experimental investigation into the mechanism of the polygonal wear of electric locomotive wheels[J]. Vehicle System Dynamics,2018,56(6):883-899.[6]JIN X S,WU L,FANG J Y,et al.An investigation into the mechanism of the polygonal wear of metro train wheels and its effect on the dynamic behaviour of a wheel/rail system[J].Vehicle System Dynamics,2012,50(12):1817-1834.[7]王科,崔晓璐,陈光雄,等.高速铁路车轮多边形磨耗影响因素仿真研究[J].润滑与密封,2017,42(10):31-34.WANG K,CUI X L,CHEN G X,et al.Numerical study on the influence factors of wheel polygonalization of high-speed trains [J].Lubrication Engineering,2017,42(10):31-34.[8]陈光雄,金学松,鄒平波,等•车轮多边形磨耗机理的有限元研究[J].铁道学报,2011,33(1):14-1&CHEN G X,JIN X S,WU P B,et al.Finite element study on the generation mechanism of polygonal wear of railway wheels[J].Journal of the China Railway Society,2011,33(1):14-18.[9]肖乾,郑继峰,昌超,等.高速列车谐波磨耗车轮滚动接触疲劳特性分析[J].润滑与密封,2017,42(1):1-7.XIAO Q,ZHENG J F,CHANG C,et al.Analysis of harmonic wear wheels/rail rolling contact fatigue of high speed train[J].Lubrication Engineering,2017,42(1):1—7.[10]LIU X Y,ZHAI W M.Analysis of vertical dynamic wheel/railinteraction caused by polygonal wheels on high-speed trains [J].Wear,2014,314(1/2):282-290.[11]韩光旭,张捷,肖新标,等•高速动车组车内异常振动噪声特性与车轮非圆化关系研究[J].机械工程学报,2014,50(22):113-121,HAN G X,ZHANG J,XIAO X B,et al.Study on high-speed train abnormal interior vibration and noise related to wheel roughness[J].Journal of Mechanical Engineering,2014,50(22):113-121.[12]王兴宇,范军.高速列车车内噪声与车轮不圆顺关系的研究[J].铁道学报,2013,35(9)=14-18.WANG X Y,FAN J.Research on relation between interior noises and out-of-round wheels of high-speed EMU[J].Journal of the China Railway Society,2013,35(9):14-18.【13】刘佳,韩健,肖新标,等.高速车轮非圆化磨耗对轴箱端盖异常振动影响初探[J].机械工程学报,2017,53(20):98-105.LIU J,HAN J,XIAO X B,et al.Influence of wheel non-circular wear on axle box cover abnormal vibration in high-speed train [J].Journal of Mechanical Engineering,2017,53(20):98-105.【14】Railway applications:Noise emission:Rail roughness measurement related to rolling noise generation:BS EN15610:2009 [S].BSI British Standards,2009.[15]翟婉明•车辆-轨道耦合动力学[M].3版.北京:科学出版社,2007:12-84.[16]SHEN Z Y,HEDRICK J K,ELKINS J A.A comparison of alternative creep force models for rail vehicle dynamic analysis [J].Vehicle System Dynamics,1983,12(1/2/3):79-83. [17]LIU P F,ZHAI W M,WANG K Y.Establishment and verification of three-dimensional dynamic model for heavy-haul traintrack coupled system[J].Vehicle System Dynamics,2016,54(11):1511-1537.工业摩擦润滑技术国家地方联合工程研究中心技术委员会成立2020年11月25日,工业摩擦润滑技术国家地方联合工程研究中心技术委员会成立大会暨第一次全体会议在依托单位——广州机械科学研究院有限公司召开。
升降横移立体车库英文文献原文

Status of the development of solid garage Stereo garage is the storage which is used for automatic parking and scientific storage of kinds of automobile. As the quantity of urban automobile has increased continuously in nowadays ,the hard-to-park problem has become a common phenomenon. Mechanical stereo garage can use land resource sufficiently and bring space advantage into play and maximize the number of parking cars. It has become an important way for static traffic problem of cities. The issue studies the type mechanical parking system which named up-down and translation stereo garage, and regards of the two factors of manufacture and operational efficiency synthetically.On the basis of investigation on current situation and developing trend of garage in domestic and abroad, we choose three-layer and three-formulistic garage structure as the research model. According to the form of the dragging-forms of multi player up-down and translation ear-base, it is made of three pares -part of ear-base structure part of driving-framework and part of control system. The paper simply introduces main structure and characteristics of garage and also gives a short introduction to its control system. The finite element reliability checking of steel structure of garage is utilized according to the operation principle of up-down and translation stereo garage, the mechanics was used to comprehensively analyze the up-down and translation stereo garage the mechanics was used to comprehensively analyze the up-down and translation stereo garage. Including intension of the framework structure axes etc. The paper adopted PLC as control system in designing the up-down and translation stereo garage, PLC software of OMRON company was used to weave the program of control system, through debugging running. The result proved that adopted PLC as control system is simple and easy to realize. The characteristic of stabilization ,credibility , speediness and high capability made the control system very perfection of mechanical parking systems-general safety requirement and the facts of the up-down and translation stereo garage the paper introduced some safety technique which was used in the up-down and translation stereo garage. This can ensure absolute safetyfor car and make the whole stereo garage safety and running smooth .On the base of the project "Optimal design of the mechanisms in the stereoscopic garage",some mechanisms in the lift park garage has been designed optimally. At the first, we established the running mode and the structure of the mechanisms adapted to the running mode. And then, we chose the immobile comb as the parking space and the steel structure framework as support, the optimal design on the two mechanisms was carried through. The optimal design on the immobile comb and the steel structure framework was carried through with augmented multipliers method. At the end, the result of the optimal design is that the immobile comb will be more reasonable and decreased the whole weight of the garage and the load of the steel structure framework, and the weight of the steel structure framework become more light.With the rapid development of shanghai ,the settlement of the difficult of parking of shanghai has already reached the very urgent stage. In the city center where every inch of land is precious ,especially the area which such vehicles as the hotel ,market ,shopping center location ,etc. Dr.eye.concentrate ,can only develop to the sky ,to underground ,so has built and already to a great deal of three-dimensional garage parking reached the essential stage ,at the same time there are many advantages too in the three-dimensional garage parking.First ,economize the space. Generally speaking ,its floor space is about 1/2~1/25 of the level parking area ,machinery type "three-dimensional" .The garage can both be installed with ground underground ,the greatest advantage can fully utilize the small area to develop to the high altitude, try one's best to store more vehicles ,the place that the land resource in short supply ,the vehicle is big in capacity to park in the way best. For example ,are most suitable for using "vertical circulation" on the limited residential quarter ground on the space three-dimensional garage of the type. 8 storey s of every groups of this kind of garage ,that is to say ,only parked the three-dimensional garage built up on the area of a car and park 8 cars originally.Second ,automation is controlled ,easy to use. The three-dimensional automatic degree of garage parking is very high ,can hoist or lower the rotatory type ,for example ,district residents come off duty and park ,so long as according to the number that the brass-wind instrument is corresponding with the parking stall ,this parking stall will be rotated and landed to the ground ,after the car owner parks the good vehicle ,and then according to the number ,the parking stall circles round and rises ,restored to the throne again. From a complete set and install the intellectual administrative system of the parking area after installing the large-scale underground parking of the three-dimensional garage ,go on one on duty to manage hour through professional staff member of technical training.Third ,three-dimensional garage build cost lower than the traditional parking area greatly. It is reported, the occupation of land and building cost in the traditional parking area is quite high. Do not generally get on very well ,ordinary each occupation of land in the parking stall ,about 15 square meters ,the floors ,the floor space of each parking stall of underground parking is above 25 square meters at least on the ground. If use the three-dimensional garage parking, can park one group and 8 parking stalls of three-dimensional garage parking on the vacant lot of 30 square meters ,the average floor space of each parking stall is less than 4 square meters. In respect to building cost ,the house property developer of the district builds an underground parking stall to need to invest 60,000-80,000 yuan at present ,the construction cost of some top-grade underground parking stalls of office building is up to more than ten ten thousand yuan especially. If install the three-dimensional garage ,is it increase parking stall is can cost stand thin to reach 50,000-60,000 yuan each construction of parking stall to try one's best in a situation that the area of space does not change.Fourth, it is safe and reliable and beautifying the environment. Allocate the automatic detection system, various kings of sage organizations, autoalarm , fire-fighting system and other stick precautions facility. The automobile will not damage , loses. Suit measures to local conditions, utilize fragmentary vacant lot , shapebeautiful garage beyond mix ,beautify the urban environment.。
时域有限差分法求解微带结构S参数
Abstract:The Finite Difference Time Domain(FDTD) method is adopted to study the transmission characteristics of microstrip structure, and a novel method is proposed to improve the efficiency of S - parameter computation. The Input impedance Z in of the system can be obtained by recording the current and voltage values of reference points. According to transmission line theory, the relationship between reflection coefficient S 11 and the transfer impedance Z in can be built. And an expression for the relationship between S n 1 and Z in of n -port network is obtained by further studying.The method avoids a problem of separating the incident and reflect waves when using FDTD, which makes the model more compact, saves the computer memory, and reduces the complexity of programming. Key words: microstrip structure; scattering parameters; Finite Difference Time Domain; input impedance 微带电路的发展是电子技术发展史上的一次飞跃, 其体积小, 重量轻, 易于集成等优点使得其应用日益广泛。 微带电路参数的分析是微带电路设计的重要环节,目前使用比较广泛的是传输线理论、腔模理论及矩量法。但这 些方法都存在一定的局限性 [1] ,利用时域有限差分 (FDTD) 方法在很大程度上可以弥补这些方法的不足。FDTD 方 法由 Yee 在 1968 年提出 [2] ,采用网格离散的方法将电场 E 与磁场 H 巧妙地分配到网格的棱中心与面中心上,利 用蛙跳式的步进方式使电场与磁场在每一个时间歩进行迭代更新。FDTD 是目前广泛使用的一种数值方法,可应 用于微波结构 S 参数的提取、天线辐射方向图的计算以及散射体 RCS 的计算等 [3 5] 。 FDTD 方法结合计算机技术 已能处理十分复杂的电磁问题。
欧拉方程求解静气动弹性问题

硕士学位论文
欧拉方程求解静气动弹性问题
姓名:***
申请学位级别:硕士
专业:流体力学
指导教师:***
20050201
两北工业人学硕士学位论文第三章飞行器气动弹性问题的研究
35.Guruswamy G P ENSAERO - A Multidisciplinary Program for Fluid/Structural Interaction Studies of Aerospace Vehicles 1990(2-4)
36.Bayyuk S A.Powell K G.vail Leer B Computation of flows with moving boundaries and fluid-structure interactions.[AIAA 97- 1771] 1997
43.Davis G A.Bendiksen O O Unsteady transonic two-dimensional Euler solutions using finite elements 1993
44.Batina J T Unsteady Euler airfoil Solutions using unstructured dynamic meshes.[AIAA 89-0115] 1989
7.MacCormack R W The Effect of Viscosity on Hypervelocity Impact Cratering.[AIAA paper 69-354]
x P D.Wendroff B System of Conservation Lows
9.郑诚行.熊小依机翼跨音速非线性静气动弹性计算 1991
基于FLAC3D混凝土本构模型二次开发及边坡加固工程应用
42基于FLAC3D 混凝土本构模型二次开发及边坡加固工程应用蔡慧娟,蒋喆琦,张 胤(南京市水利规划设计院股份有限公司,江苏 南京 210006)摘要:为了更好地模拟加固工程中置换洞的作用效果,本文基于FLAC3D 软件的二次开发技术,推导HTC 四参数本构模型的弹塑性矩阵表达公式,开发其软件计算模型,并结合边坡加固工程实例,建立其潜在滑体三维有限元模型,分别采用二次开发的HTC 模型及软件自带DP 模型,对边坡加固中的混凝土置换洞进行弹塑性破坏分析,通过监测点位移变化规律及塑性破坏区域扩展规律确定边坡加固后安全系数。
研究发现,基于FLAC3D 软件二次开发的HTC 模型可成功应用于边坡加固分析的工程实例中,并且HTC 模型在分析混凝土破坏方面比原有DP 模型精确度要高一些,为置换洞加固的数值模拟研究提供参考依据。
关键词:FLAC3D 软件;HTC 模型;二次开发;边坡加固中图分类号:TV5 文献标识码:B 文章编号:1007-7839(2018)08-0042-00Secondary development of concrete constitutive model based on FLAC3Dand application of slope reinforcement engineeringCAI Huijuan,JIANG Zheqi,ZHANG Yin(Nanjing Water Planning and Designing Institute Co.,Ltd ,Nanjing 210006,Jiangsu )Abstract:In order to better simulate the effect of the replacement hole in the reinforcement project, on the basis of secondary development technology of FLAC3D software, the expression formula of elastoplastic matrix of HTC four-parameter constitutive model was derived, and its software calculation model was developed. The three-dimensional finite element model of the potential slide was established by combining with the example of the slope reinforcement engineering. The secondary HTC model and the software DP model were respectively used to analyze the elastic and plastic failure of the concrete replacement hole in the slope reinforcement. The safety factor of the slope was determined by the variation of the displacement and the expansion law of the plastic failure region. It was found that the HTC model based on the secondary development of FLAC3D software could be successfully applied to the engineering example of the slope reinforcement analysis, and the HTC model was more accurate than the original DP model in the analysis of concrete damage, which could provide a reference basis for the numerical simulation study of the replacement hole reinforcement. Key words:FLAC3D software;HTC model;secondary development;slope reinforcement收稿日期:2018-02-13作者简介:蔡慧娟(1987—),女,工程师,硕士,主要从事水利工程设计研究工作。
海域超软土地层大直径盾构掘进控制研究

1研究背景盾构掘进工法作为一种科学有效的隧道施工技术,近些年来取得了不断地发展和完善,为盾构隧道开挖面土体提供充足的支撑力是保证开挖面稳定和成功施工的关键,如果支护压力施加不当,隧道工作面就可能产生较大范围的坍塌或地表隆起等安全隐患,造成生命财产的损失以及周围环境的破坏。
近年来,众多学者对盾构掘进过程中地层的稳定性开展了系列研究。
但是对于海域超软土地层超浅埋大直径盾构掘进地层稳定性的研究尚无涉及,因此通过依托典型的工程项目开展数值模拟和现场监测对比分析研究,研究结果对于在减少地层失稳、控制施工风险、降低施工成本等方面都具有重要的学术意义和工程应用价值。
2工程背景2.1工程概况杧深圳珠海横琴洲隧道工程穿越马骝洲水道,位于横琴一体化区域,隧道段总长约1.74km(含隧道段、明挖暗埋段、敞口段和工作井),南岸工作井盾构机隧道埋深约7.5m。
隧道工程采用直径15.01m的泥水平衡盾构,隧道采用单层衬砌结构,管片外径为14.5m,内径为13.3m,厚度为0.6m,环宽为2m。
2.2工程地质本工程盾构机掘进线路所穿地层自上而下依次为冲镇土、淤泥、碎石质粉质黏土,全风化砂岩和强风化砂岩,隧道洞身主要位于淤泥中,如图1所示。
3满堂加固条件下大直径盾构开挖面稳定性数值分析3.1三维数值模型建立三维数值分析采用PLAXIS3D有限元软件。
由于结构对称性,模型取半结构建立,同时考虑到边界尺寸效应,模型尺寸取值如下:长9D(开挖方向),宽3D,高4D,其中D为开挖面直径,取14.5m,t为加固土层厚度。
模型边界条件为,底部完全约束,侧面约束法向方向,顶部自由;地下水位位于地表,不考虑地下水渗流影响,采用潜水位分析,三维计算模型如图2所示。
在盾构隧道掘进方向的第8环衬砌处的横断面的地表布置了横向沉降测点,在隧道轴线上方的地表布置了纵向沉降测点,其中有3个测点标记为WY1,WY2,WY3,具体测点布置图如图3所示。
研究重点是盾构掘进对地层扰动的影响,盾构隧道掘进过程采取逐环开挖的方法进行模拟,盾构推进示意图如图4所示,具体模拟过程如下:①建立与实际工程相符的地层模型。
三维编织复合材料的力学性能研究

三维编织复合材料的力学性能研究摘要:近年来,随着复合材料理论体系的完善以及设计与制造技术的不断进步,三维编织复合材料的运用越来越广泛,其力学性能的研究也更加具体和深入。
本文对三维编织复合材料的力学性能进行了探讨,从概念性的内容入手,对相关研究成果进行了归纳,同时结合三维五向编织复合材料的特点,对材料的细观结构进行了讨论,同时结合单胞模型,讨论了材料的力学性能,具有一定的现实参考价值。
关键词:复合材料材料;三维编织;力学;纱线;单胞三维编织复合材料在当前直升机结构设计中占有十分重要的地位,其能够运用特有的多向纤维束空间网状结构,为直升机的设计与制造提供良好的力学性能,并且损伤容限、断裂韧性较高,消除了过往复合材料中的“层”概念,因此本文对三维编织复合材料的力学性能进行了探讨,能够为直升机结构设计提供一定的理论基础和现实参考意义。
近年来,随着复合材料理论体系的不断完善和三维编织复合材料的广泛运用,越来越多的学者在研究中提出了具有较强实际意义的模型,例如学者Chou提出的纤维交织模型、纤维倾斜模型[1],学者Whyte提出的织物几何模型[2],Lei提出的有限单胞模型[3]等等。
也就是说,各类学者在对三维编织复合材料进行研究的过程中,根据其特性和力学性能提出了大量假设,并且在实验中得到了印证,但仍然缺少对三维编织复合材料几何特性与交织结构等方面的深入探讨与研究。
1 三维编织复合材料1.1 相关概念当前,三维编织复合材料广泛运用于各类直升机结构设计中,为该行业的发展提供了良好的支撑。
三维编织复合材料大多数采用了液体成型的工艺,在制造时进行浸胶固化,能够直接按照相应的要求,在模具的帮助下,形成结构件。
一般采用的工艺为传递模塑工艺(RTM)、树脂膜渗透工艺(RFI)以及真空辅助树脂渗透工艺(VARI)等等。
在制造复杂直升机构件方面,洛克希德·马丁公司生产的三维编织复合材料在技术上较为先进,能够有效的根据直升机的整体结构进行加强筋与进气道壳体的设计,节省了空间,提升了直升机的整体性能,并且在装配工艺上较为简便。
复合材料细观结构三维有限元网格模型的建立_关振群
1) 首先生成矩形模拟区域; 2) 输入生成随机椭球时的各种参数概率分布 模型及终止条件(以体积标度);
3) 检验模拟区域中颗粒的投放量,如果达到投
放量,存储并退出,否则执行下一步;
4) 随机椭球的生成;
5) 判别此椭球是否符合要求,是,转向 3);否
则转向 4)。 1.2 随机椭球和参数控制以及椭球方程的求解 1.2.1 椭球随机生成的控制参数
第 22 卷增刊 2005 年 6 月
工程力学 ENGINEERING MECHANICS
Vol. 22 Sup. June 2005
文章编号:1000-4750(2005)Sup.-0067-06
复合材料细观结构三维有限元网格模型的建立
关振群,*高巧红,顾元宪,宋 超,单菊林
(大连理工大学工业装备结构分析国家重点实验室,工程力学系 大连 116024)
关键词:复合材料;有限元网格;计算机模拟;随机骨料模型;椭球 中图分类号:O242.21 文献标识码:A
THE CONSTRUCTION OF THREE-DIMENSIONAL FINITE ELEMENT MESH FOR MICROSTRUCTURE OF MULTIPHASE COMPOSITES
1 大量椭球颗粒随机分布的几何模 型的建立
在给出随机颗粒自动生成的算法之前作如下 假设:①模拟区域为一个长方体 [xmin ymin zmin ] ×[xmax ymax zmax ] 。② 椭球形颗粒的位置、形状、
大小和旋转角度都服从在模拟区域内呈均匀分布。
③ 椭球形颗粒相互之间有一定距离。
1.1 建立几何模型的算法描述:
GUAN Zhen-qun , *GAO Qiao-hong , GU Yuan-xian , SONG Chao , SHAN Ju-lin
模具设计与制造外文翻译参考文献

模具设计与制造外文翻译参考文献(文档含中英文对照即英文原文和中文翻译)译文:模具设计与制造模具是制造业的重要工艺基础,在我国模具制造属于专用设备制造业。
中国虽然很早就开始制造模具和使用模具,但长期未形成产业。
直到20世纪80年代后期,中国模具工业才驶入发展的快车道。
近年,不仅国有模具企业有了很大发展,三资企业、乡镇(个体)模具企业的发展也相当迅速。
虽然中国模具工业发展迅速,但与需求相比,显然供不应求,其主要缺口集中于精密、大型、复杂、长寿命模具领域。
由于在模具精度、寿命、制造周期及生产能力等方面,中国与国际平均水平和发达国家仍有较大差距,因此,每年需要大量进口模具。
中国模具产业除了要继续提高生产能力,今后更要着重于行业内部结构的调整和技术发展水平的提高。
结构调整方面,主要是企业结构向专业化调整,产品结构向着中高档模具发展,向进出口结构的改进,中高档汽车覆盖件模具成形分析及结构改进、多功能复合模具和复合加工及激光技术在模具设计制造上的应用、高速切削、超精加工及抛光技术、信息化方向发展。
近年,模具行业结构调整和体制改革步伐加大,主要表现在,大型、精密、复杂、长寿命、中高档模具及模具标准件发展速度高于一般模具产品;塑料模和压铸模比例增大;专业模具厂数量及其生产能力增加;“三资”及私营企业发展迅速;股份制改造步伐加快等。
从地区分布来看,以珠江三角洲和长江三角洲为中心的东南沿海地区发展快于中西部地区,南方的发展快于北方。
目前发展最快、模具生产最为集中的省份是广东和浙江,江苏、上海、安徽和山东等地近几年也有较大发展。
虽然我国模具总量目前已达到相当规模,模具水平也有很大提高,但设计制造水平总体上落后于德、美、日、法、意等工业发达国家许多。
当前存在的问题和差距主要表现在以下几方面:(1)总量供不应求,国内模具自配率只有70%左右。
其中低档模具供过于求,中高档模具自配率只有50%左右。
(2)企业组织结构、产品结构、技术结构和进出口结构均不合理。
重度脊柱侧弯三维有限元模型模拟脊柱后路矫形术生物力学特点

Establishment of Three-dimensional Finite Element Model for Severe Rigid Scoliosis and Biomechanical Analysis of PVCR
[摘要] 目的 建立严重僵硬性脊柱侧弯的三维有限元模型,在该模型上模拟经后路全椎体切除术 (posterior vertebral column resection,PCVR) 并分析其生物力学特点。方法 以 1 例严重僵硬性脊柱侧弯患者 CT 为基础, 使用 Mimics10.01,Geomagic studio12,UG8.0 等软件建立,优化俯卧位严重脊柱侧弯的三维有限元模型。验证模 型与患者原始资料的几何相似性以及力学有效性。利用模型模拟 PVCR 术。结果 成功建立严重僵硬性脊柱侧弯 的三维有限元模型,并验证该模型有效。利用模型完成 PVCR 术模拟。椎体切除后,断端在轴位、冠状位及矢状 位均有移位趋势;术后矫形棒应力值区间为:0.0050214e7~0.045217e7 Mpa,应力值最大区域为截骨区及上下 2 个 椎体,其应力值为 0.045217e7 Mpa,应力最小为端椎区域,为:0.0050214e7~0.025121e7 Mpa。螺钉应力值区间: 3.1108e7~2.7961e8 Mpa,其中切除椎体的上位椎体凸侧第 1 枚螺钉应力最大,为 2.4577e8 Mpa。术后端椎区域 T2/3 及 T7/8、T8/9、T9/10 椎间盘上的应力较大,椎间盘受力最大区域均位于纤维环。结论 PVCR 椎体切除区 域,断端呈三维位移趋势,增加医源性脊髓损伤的风险;该区域内植物负荷最大,是术后发生内植物损耗的易发 区域;术后交界区椎间盘承载较大应力且较集中,易出现交界区病变。
三维有限元法分析腰椎不同尺寸关节突成形后相关节段的生物力学特征
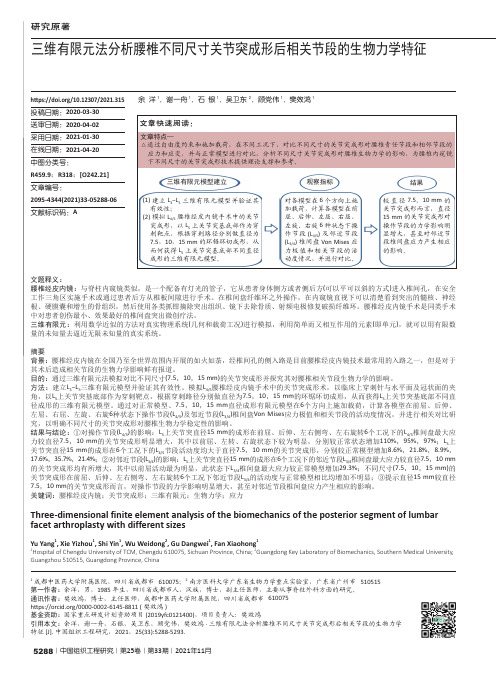
5288|中国组织工程研究|第25卷|第33期|2021年11月三维有限元法分析腰椎不同尺寸关节突成形后相关节段的生物力学特征余 洋1,谢一舟1,石 银1,吴卫东2,顾党伟1,樊效鸿1文题释义:腰椎经皮内镜:与脊柱内窥镜类似,是一个配备有灯光的管子,它从患者身体侧方或者侧后方(可以平可以斜的方式)进入椎间孔,在安全工作三角区实施手术或通过患者后方从椎板间隙进行手术。
在椎间盘纤维环之外操作,在内窥镜直视下可以清楚看到突出的髓核、神经根、硬膜囊和增生的骨组织,然后使用各类抓钳摘除突出组织、镜下去除骨质、射频电极修复破损纤维环。
腰椎经皮内镜手术是同类手术中对患者创伤最小、效果最好的椎间盘突出微创疗法。
三维有限元:利用数学近似的方法对真实物理系统(几何和载荷工况)进行模拟,利用简单而又相互作用的元素(即单元),就可以用有限数量的未知量去逼近无限未知量的真实系统。
摘要背景:腰椎经皮内镜在全国乃至全世界范围内开展的如火如荼,经椎间孔的侧入路是目前腰椎经皮内镜技术最常用的入路之一,但是对于其术后造成相关节段的生物力学影响鲜有报道。
目的:通过三维有限元法模拟对比不同尺寸(7.5,10,15 mm)的关节突成形并探究其对腰椎相关节段生物力学的影响。
方法:建立L 3-L 5三维有限元模型并验证其有效性。
模拟L 4/5腰椎经皮内镜手术中的关节突成形术,以临床上穿刺针与水平面及冠状面的夹角,以L 5上关节突基底部作为穿刺靶点,根据穿刺路径分别做直径为7.5,10,15 mm 的环锯环切成形,从而获得L 5上关节突基底部不同直径成形的三维有限元模型。
通过对正常模型、7.5,10,15 mm 直径成形有限元模型在6个方向上施加载荷,计算各模型在前屈、后伸、左屈、右屈、左旋、右旋6种状态下操作节段(L 4/5)及邻近节段(L 3/4)椎间盘Von Mises 应力极值和相关节段的活动度情况,并进行相关对比研究,以明确不同尺寸的关节突成形对腰椎生物力学稳定性的影响。
考虑地震动力响应的复杂地基碾压混凝土重力坝分缝优化研究

http://www.renminzhujiang.cnDOI:10 3969/j issn 1001 9235 2023 06 008第44卷第6期人民珠江 2023年6月 PEARLRIVER基金项目:湖南省自然科学基金资助项目(2020JJ5317);湖南省教育厅优秀青年项目(22B1005);湖南省水利科技项目(XSKJ2019081-20)收稿日期:2022-12-10作者简介:李金友(1984—),男,博士,高级工程师,研究方向为水工结构工程抗震评价。
E-mail:lijinyou2003@163.com李金友,胡江,顾振华.考虑地震动力响应的复杂地基碾压混凝土重力坝分缝优化研究[J].人民珠江,2023,44(6):63-69.考虑地震动力响应的复杂地基碾压混凝土重力坝分缝优化研究李金友1,胡 江2,顾振华3(1.湖南水利水电职业技术学院,湖南 长沙 410131;2.南京水利科学研究院大坝安全与管理研究所,江苏 南京 210029;3.上海勘测设计研究院有限公司,上海 200434)摘要:为了探究高碾压混凝土重力坝横缝切割对坝体抗震性能的影响,以高地震烈度、砂泥岩互层地基的巴基斯坦玛尔水电站碾压混凝土重力坝工程为研究对象,通过建立三维整体有限元模型,并引入自编黏弹性动力边界程序,分别计算了设计地震、最大可信地震(MaximumCredibleEarthquake,MCE)作用下,输入规范波、场地波、Koyna波时坝体的动力响应及差异;通过模拟横缝切割1/3高度、2/3高度和全分缝3个对比方案,并以承载能力极限状态设计式定义的比值为依据,综合评价了碾压混凝土重力坝抗震安全状态。
结果表明:当输入波为规范波时,在MCE作用下,横缝切割1/3高度和2/3高度方案坝基面的抗力效应比系数(η)均大于1,全分缝方案下ηmin=0.91,且总计6次在0.6s时长内η值均小于1,经综合考虑,横缝切割2/3高度可作为施工推荐方案。
三维有限元刚度矩阵的压缩存储算法
三维有限元刚度矩阵的压缩存储算法王忠雷;赵国群;马新武【摘要】为提高有限元分析效率、减少存储空间消耗,对刚度矩阵的压缩存储算法进行了研究.研究了"广义相邻节点对"与刚度矩阵中非零子矩阵的关系,确定了刚度矩阵中非零子矩阵的分布规律;提出了一种新的刚度矩阵压缩存储方法—"改进的CSR存储方法",给出了基于压缩存储的刚度矩阵的生成过程以及线性方程组迭代解法方法,并将提出的算法应用于三维体积成形有限元分析软件.有限元分析实例表明,该算法可以有效地减少存储空间,提高计算效率.%To improve the efficiency and reduce the storage space of finite element analysis,compression and storage algorithm of 3D-FEM stiffness matrix is studied.The relationship between "generalized adjacent double nodes" and the non-zero sub-matrix in stiffness matrix is researched for getting distribution of non-zero sub-matrix in stiffness matrix.A new algorithm of stiffness matrix of compressed storage-"improved CSR storage method" is proposed.Based on the algorithm,the generation process of stiffness matrix is given and iterative solution of linear equations method is proposed to improve the efficiency of solving linear equations.The algorithm is applied to the three-dimensional bulk forming finite element analysis software and the numerical results show that the algorithm can effectively decrease the storage space and improve the computation efficiency.【期刊名称】《材料科学与工艺》【年(卷),期】2012(020)002【总页数】6页(P96-100,107)【关键词】三维有限元方法;刚度矩阵;压缩存储;六面体网格【作者】王忠雷;赵国群;马新武【作者单位】山东大学材料液固结构演变与加工教育部重点实验室,济南250061/山东建筑大学机电工程学院,济南250101;山东大学材料液固结构演变与加工教育部重点实验室,济南250061;山东大学材料液固结构演变与加工教育部重点实验室,济南250061【正文语种】中文【中图分类】TG316.8随着计算机技术和有限元技术的发展,有限元模拟在金属塑性加工中获得了广泛应用,并发挥了不可替代的作用[1-3].近年来,所要分析的工程问题日益复杂、数据量大,尤其是在大型三维体积成形过程数值分析中,工件形状的复杂性导致单元模型节点数量的激增,从而使得有限元软件在分析该类问题时计算效率低下,甚至在分析大型、超大型问题时出现存储空间不足的情况,这大大限制了有限元软件在大型体积成形分析中的应用.工程问题的有限元分析最终都归结为求解大型线性方程组,有限元的求解效率在很大程度上取决于线性方程组的解法及刚度矩阵的存储结构.有限元刚度矩阵一般为大型、带状稀疏矩阵,矩阵的非零元素一般集中在对角线区域,为此出现了很多节约存储空间的存储方法,如半带存储、变带宽存储等.这些方法可以减少刚度矩阵的存储空间,但都不可避免地存储了部分非零元素,浪费了储存空间,而且受到节点编号的影响,需要对节点编号进行优化,浪费大量的计算时间.为了进一步节约存储空间,鲍益东等[4]针对板料成形问题提出了一种适合迭代算法的改进一维变带宽压缩存储方法,该方法采用一维数组按行的顺序保存刚度矩阵的非零元素,同时采用2个辅助数组记录列号和每列起始元素在刚度矩阵数组的位置.该方法节约了大量存储空间,也避免了节点编号的优化难题,但该方法采用的辅助数组与刚度矩阵存储数组具有同样长度,仍存在消耗部分存储空间的问题.本文根据刚度矩阵的组成特点,提出了一种新的刚度矩阵压缩存储方法,该方法在辅助数组中只记录非零子矩阵的位置,间接记录刚度矩阵非零元素的位置,进一步节约了刚度矩阵的存储空间,尤其适合于求解大型、复杂的三维工程问题.在有限元网格模型中,同一单元内的任意2个节点构成的节点对(包括节点自身与自身构成的节点对)称为“广义相邻节点对”.根据刚度矩阵的生成原理,有限元刚度矩阵中的非零元素与“广义相邻节点对”有着密切的关系,每组“广义相邻节点对”对应一个与所分析问题维数相同的非零子矩阵,非零子矩阵的位置由广义节点对的全局节点序号决定.例如同一个单元中的2个节点的全局节点编号为(I,J),构成一个“广义相邻节点对”Bij,该“广义相邻节点对”产生的非零子矩阵在广义矩阵中的位置为I行J列.如果考虑“广义相邻节点对”的顺序,即Bij和Bji作为2个不同的节点对,它们分别对应第I行、第J列和第J行、第I列的非零子矩阵,有序“广义相邻节点对”与整个刚度矩阵的非零子矩阵数量相同,且一一对应.由于刚度矩阵为对称矩阵,为节约存储空间,可只存储上三角矩阵,因此只需考虑Bij(I≤J)的节点对对应的非零子矩阵,不需考虑节点对的顺序问题.Bij和Bji作为同一个节点对,无序广义节点对与上三角矩阵存储的刚度矩阵的非零子矩阵数量相同,一一对应,因此,完全可以通过无序广义节点对及其数量来确定刚度矩阵中非零子矩阵的数量和位置.对于如图1所示的八节点六面体单元,其“广义相邻节点对”分为3个类型:一是边相邻节点对,例如节点对12、14、15;二是面相邻节点对,例如节点对16、18、13;三是体相邻节点对,例如节点对17.从整个单元模型来看,边相邻节点对由单元内相邻节点连线的数量决定,每条连线对应1个无序节点对;面相邻节点对的数量由单元面的数量决定,每个面有2条对角线,每条面对角线对应1个无序节点对;体相邻节点对的数量由单元的数量决定,每个单元有4条体对角线,每条体对角线对应1个无序节点对.图1所示单元模型的无序广义节点对的数量即非零子矩阵的数量,可由式(1)确定: 式中:NS为网格模型无序节点对数量;N1为节点数量,表示节点与自身生成的节点对;N2为同一单元内相邻节点连线的数量,表示边相邻节点对的数量;N3为单元的面数,2N3表示面相邻节点对的数量;N4为单元数量,4N4表示体相邻节点对的数量.对角线非零子矩阵的数量也为N1,每个对角线非零子矩阵只需存储上三角子矩阵和对角线元素,若设N为所求解问题的维数,则所需存储的非零元素为(N2+N)/2.对于三维问题N=3,则每个对角线非零子矩阵只需存储6个数据,其他非零子矩阵需要存储N2=9个数据,因此,总共需要保存的非零刚度矩阵元素数量为式中,NZ为网格模型非零刚度矩阵元素数量,N1、N2、N3、N4与式(1)中的意义相同.同理,对于如图2所示的由2个单元构成的简单六面体网格,N1=12、N2=20、N3=11、N4= 2.采用上三角矩阵存储时,其非零子矩阵数量为总共需要保存的刚度矩阵非零元素数量为一旦确定了非零子矩阵和非零元素的数量,即可准确地分配刚度矩阵的存储空间,这对于刚度矩阵存储算法的实现具有重要意义.稀疏矩阵有多种存储方式,在此采用了比较常用的 CSR格式(Compressed Sparse Row format).该方法采用3个一维数组保存稀疏矩阵,浮点型数组A按行顺序存储矩阵中的各非零元素;整形数组J中记录对应元素所在的列号;整形数组K 中记录每行第1个元素在A中的位置.其中A和J的长度相同,即为稀疏矩阵中非零元素的数量,而整形数组K的长度则为稀疏矩阵的维数.例如,对于图3所示的稀疏矩阵,采用CSR格式的存储格式如下所示:由于刚度矩阵为对称矩阵,可以只存储其上三角矩阵,因此K数组应保存对角线元素在数组A中的位置.CSR方法可以很大程度上减少刚度矩阵的存储空间,而且按行引用,其效率较高,比较适合存储有限元的刚度方程.但是整型数组J与浮点数组A长度一致,占用了大约1/3的存储空间,造成了存储效率的降低.由前面的分析可以看出,有限元刚度矩阵中非零元素的分布是有规律的,只分布于与“广义相邻节点对”对应的非零子矩阵中,因此,只要记录了非零子矩阵的位置,即可间接地确定非零元素的位置,该方法称为改进的CSR方法.对于三维问题,非零子矩阵有9个元素,只记录非零子矩阵的位置,就可以减少数组J的存储空间约90%,进而使整个刚度矩阵的存储空间减少约30%.在此方法中,整形数组J中记录对应非零子矩阵所在的列号;整形数组K中记录广义矩阵中每行第一个非零子矩阵在J中的位置.下面以如图2所示的单元模型的刚度矩阵为例进行分析,采用CSR方法的J数组数据长度为所有非零元素的数量,即NZ=522,K数组数据长度为刚度方程的维数,即为12×3=36,因此,总数据量为558;而采用改进的CSR方法后,J数组数据长度则为刚度矩阵非零子矩阵数量,即NS= 62,K数组数据长度为单元数量12,则总数据量减少为74.如果只比较2个辅助数组,则改进的CSR方法所节约存储空间为如果浮点型数组A采用单精度浮点数保存,则改进的CSR方法后,整个刚度矩阵所节约的存储空间为显而易见,改进的CSR方法进一步明显地节约了刚度矩阵的存储空间,但该方法间接表示非零元素的位置,增加了访问刚度矩阵的计算时间消耗,对计算效率有一定的影响,属于以时间换空间的方法.因此建议在单元数量较多时采用改进的CSR方法,以减少内存消耗;而单元数量较少时,则采用前一种方法,提高对刚度矩阵的访问效率,达到最好的综合效益.对于三维体积成形问题,内存不足是分析的主要问题,因此,宜采用能够节约内存的改进的CSR方法.在生成刚度矩阵时,首先根据单元模型的拓扑结构来确定非零子矩阵的数量和位置,生成索引数组J、K;然后根据刚度矩阵的生成规则和2个索引数组的数据,将单元刚度矩阵的数据对号入座地进行组合.对于改进的CSR存储方法,还需要对索引数据进行转换.下面通过一个实例说明刚度矩阵的生成过程.假设一个三维八节点六面体单元,其单元节点的整体编号为I[8],单元刚度矩阵为U[8× 3][8×3],单元刚度矩阵的任意元素可描述为式中:i、j=1、2、Λ、8为节点局部编号;k、l为物理量维数编号,k、l=1、2、3.其在整体刚度矩阵数组中的序号按如下步骤确定:1)确定Uijkl的整体节点编号为式中,I、J为Uijkl所在的非零子矩阵AIJ中的广义行号和列号,非零子矩阵的位置如图3所示.2)确定非零子矩阵AII之前非零子矩阵的数量NI:3)确定非零子矩阵AII之前非零元素的数量NNI:式中,(I-1)×3是由于对角非零子矩阵引起的非零元素的减少项.如图4显示的AII子矩阵只存储了6个非零元素,与其他子矩阵相比少存了3个.4)确定第I行非零子矩阵中第k行之前非零元素的数量NNIK(未考虑对角非零矩阵引起的非零元素的减少项):5)搜索数组J从标号K[I]到K[I+1]中J[II]=J的数组标号II,则第I行中,第J列之前的非零子矩阵数量NJ为确定NJ的列查询是整个刚度矩阵生成过程中消耗时间最多的步骤,而在此步骤当中,普通的CSR方法按元素搜索,而改进CSR方法按照子矩阵进行搜索.在三维问题中,普通CSR方法的搜索时间为该进CSR方法搜索时间的3倍,因此,改进的CSR方法在此步骤中较常规CSR方法更节约时间.6)确定 Uijkl在刚度矩阵中所在行中的编号NNJl:式中M为由于对角非零子矩阵引起的非零元素的减少项,k=1、2、3时M=0、1、3.7)确定 Uijkl在刚度矩阵数组 A中的编号NNIJkl:一旦确定了Uijkl在刚度矩阵数组A中的位置后,即可根据刚度矩阵的生成规则进行累加,从而获得总体刚度矩阵.大型有限元方程组的求解方法一般分为直接法和迭代法2种.所谓直接法是指在不考虑舍入误差存在的情况下,经过有限步运算就可以求得方程组的精确解的方法,此方法也称为精确法.而迭代法是一种逐次逼近的方法,它从一个初始向量出发,通过一个给定的计算格式,构造出一个无穷向量列,此向量列即是方程组的近似解,其极限为方程组的精确解.直接法求解精度高、稳定性好,但是在方程数量较多时,求解效率低,因此,在求解大型线性方程组时,往往采用迭代法[5-8].线性方程组的迭代方法有很多,其中松弛预处理共额梯度法(SSOR-PCG)是求解对称正定系数矩阵最受欢迎的方法之一.SSOR-PCG方法的基本原理如下[9].设线性方程组(11)的系数矩阵A为n阶对称正定矩阵,设M=(STS)-1为对称正定矩阵,则上式等价于式中A'=SA ST,b'=Sb,u'=S-Tu.M通常取为对称逐步超松弛迭代法(SSOR法)的分裂矩阵,即式中:0<ω<2,为松弛因子;D为A的对角阵;L为A的严格下三角阵,即在改进的SSOR-PCG方法中,不必对M求逆,也不必另开辟数组存放M矩阵,计算中仅对A的非零元素进行运算,所以仅需存储A的下三角阵(或上三角阵)中的非零元素,因此,该方法特别适合于本文中只存储非零子矩阵的刚度方程.为了验证本文所提出的算法在节约内存、提高计算效率方面的效果,将刚度矩阵压缩存储方法应用于自行开发的三维体积成形有限元分析程序CasForm中[10].以如图5所示的道钉成形为例,从内存占用和计算效率两个方面,将本文提出的压缩存储、迭代求解的算法与半带存储、直接求解的算法进行了比较.在内存占用方面,以八节点六面体单元模型为例,按照刚度方程采用单精度浮点数保存,即每个数据占用4个字节;辅助数组采用整形数据保存,即每个数据占用2个字节.在不同的节点和单元数量下,对采用不同方式存储的刚度矩阵所占存储空间进行比较,结果见表1.从表1可以看出,压缩存储方法所占的存储空间远远小于半带存储方法的存储空间,存储空间节约超过90%,而且随着节点数量的增加,空间节约的比例逐渐增大.这主要是因为压缩存储方法只保存了刚度矩阵的非零元素,刚度矩阵中每一行非零元素的数量仅与该行对应节点的广义相邻节点的数量有关,而与整体模型节点的数量无关.换言之,对于压缩存储方法,存储空间与节点数量的正比关系仅与刚度矩阵的行数增加有关,呈线性变化趋势.而对于半带存储方法,每一行的存储空间由刚度矩阵的半带宽决定,随节点数量增加,半带宽一般也随之增加,因此,随节点数量增加,不仅刚度矩阵的行数增加,而且每行需要存储的数据也有所增加,因而呈现抛物线变化趋势.由此可知,随着节点数量的增加,半带存储方法所需的存储空间呈二次幂指数函数增加,而采用压缩存储方法,其节约空间的比例更加显著.在计算效率方面,以求解单个方程的计算效率为例,对半带存储直接求解和压缩存储迭代求解两种方法的进行了比较,结果见表2.从表2可以看出,压缩存储迭代求解的效率远远高于半带存储直接求解的效率,而且节点数量越多,效率提高越明显.1)依据由网格拓扑结构决定的“广义相邻节点对”,可以确定有限元刚度矩阵中非零子矩阵的分布和数量.2)采用改进的CSR存储方法保存有限元刚度矩阵,可显著减少刚度矩阵的存储空间,而且节点数量越多,空间节约的比例越大.3)采用基于压缩矩阵的SSOR-PCG迭代方法求解有限元线性方程组,可显著提高方程组的求解效率,而且节点数量越多,求解效率提高的幅度越大.【相关文献】[1] GHAEI A,MOVAHHEDY R M.Die design for the radial forging process using 3D FEM[J].Journal of Materials Processing Technology,2007,182:534-539.[2] BEHRENS B A.Finite element analysis of die wear in hot forging processes[J].CIRP Annals-Manufacturing Technology,2008,57:305-308.[3] LU C,ZHANG L W,MU Z J,et al.3D FEM simulation of the multi-stage forging process of a gas turbine compressor blade[J].Journal of Materials Processing Technology,2008,198:463-470.[4]鲍益东,杜国康,陈文亮,等.冲压成形模拟中有限元方程组求解算法[J].南京航空航天大学学报,2009,41(5):606-610. BAO Yi-dong,DU Guo-kang,CHEN Wen-liang,et al. Solving algorithm for finite element equations in sheet metal forming simulation[J].Journal of Nanjing University of Aero nautics&Astronautics,2009,41(5): 606-610. [5]张永杰.大型稀疏方程组预处理迭代快速求解技术研究[D].西安:西北工业大学,2006. [6]刘艳芳,施法中,徐向阳.板料冲压成形数值模拟中有限元方程求解算法的研究[J].塑性工程学报,2006,13(4):15-19. LIU Yan-fang,SHI Fa-zhong,XU Xiang-yang.Study on algorithms of solving FE equations in the numerical simulation of sheet metal stamping [J].Journalof Plasticity Engineering,2006,13(4):15-19.[7]李静,陈健,云周晶.改进的SSOR-PCG迭代法在接触问题研究中应用[J].大连理工大学学报,2006,46(4):533-537. LI Jing,CHEN Jian,YUN Zhou-jing.Application of an improved SSOR-PCG iteration method to contact problems[J].Journal of Dalian University of Technology, 2006,46(4):533-537.[8]包劲青,杨强,陈英儒,等.对称超松弛预处理共轭梯度法在高拱坝整体大规模弹塑性有限元分析中的应用[J].水利学报,2009,40(5):589-594. BAO Jin-qing,YANG Qiang,CHEN Ying-ru,et al.Application of symmetric successive over relaxation precondition conjugate method to large-scale elasto-plastic FEM analysis for high arch dams[J].Journal of Hydraulic Engineering,2009,40(5):589-594.[9]林绍忠.对称逐步超松弛预处理共轭梯度法的改进迭代格式[J].数值计算与计算机应用,1997(4): 266-270. LIN Shao-zhong.Improved iterative format of symmetric successive overrelaxation-preconditioned conjugated gradient method[J].Numerical Methods and Computer Applications,1997(4):266-270.[10]王忠雷,赵国群,黄丽丽,等.六面体网格体积成形有限元分析关键技术[J].材料科学与工艺,2010,18(4):509-513. WANG Zhong-lei,ZHAO Guo-qun,HUANG Li-li,et al.Key technologies of 3D FEM analysis system for bulk forming with hexahedral mesh [J].Materials Science&Technology,2010,18(4):509-513.。
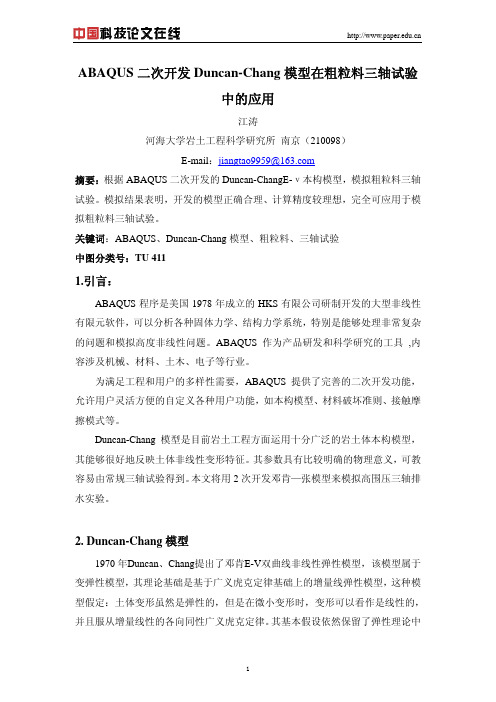
ABAQUS二次开发Duncan-Chang模型在粗粒料三轴试验中的应用
3.粗粒料三轴实验
粗粒料通常是指块石、碎石(或砾卵石)、石屑、石粉等粗颗粒组成的无粘性
2
混合料,或是粘性土中含有大量粗颗粒的混合土。《土工试验规程》(SL237-
含量(%)
46.2
38.4 15.4
试样直径 101mm,高度 200mm,采用击实制样,控制干密度取 ρ = 1.9g / cm3 。
进行 3 组常规三轴试验,围压分别为 200kPa、500kPa、800kPa,采用固结排水
剪,剪切速率取 0.001mm/s,固结和剪切过程均按《土工试验方法标准》(GB/T
Duncan-Chang 模型是目前岩土工程方面运用十分广泛的岩土体本构模型, 其能够很好地反映土体非线性变形特征。其参数具有比较明确的物理意义,可教 容易由常规三轴试验得到。本文将用 2 次开发邓肯—张模型来模拟高围压三轴排 水实验。
2. Duncan-Chang 模型
1970 年Duncan、Chang提出了邓肯E-V双曲线非线性弹性模型,该模型属于 变弹性模型,其理论基础是基于广义虎克定律基础上的增量线弹性模型,这种模 型假定:土体变形虽然是弹性的,但是在微小变形时,变形可以看作是线性的, 并且服从增量线性的各向同性广义虎克定律。其基本假设依然保留了弹性理论中
的斜率或截距得到。在拟合过程中,得到的参数是综合 3 组试验数据的结果,所
4
以高围压 0.8MPa 下模拟的曲线大部分在试验曲线以下,而围压 0.2MPa、0.5MPa 的情况下模拟曲线大部分在试验曲线以上。如果试验的过程严格安照规范的规 定,操作过程在没有失误的情况下,排除了人为因素,一定能得到很好的模拟效 果。
基坑开挖的角部效应分析_姜静育
越小, 基坑形状也更加不规整, 基坑设计困难加大。 如何保证基坑稳定的情况下充分利用土地资源, 成为当前设计的突出情况。 而这 些不规则基坑, 存在大量的转角, 如何考虑这些转角也是当前基坑设计的重要问题之一。 只有掌握转角对基坑稳定的影响规律, 才能 充分合理的考虑基坑的角部效应, 拟定相应工程措施来改善结构受力, 节省工程造价。因此,对于角部效应的分析对城市建设中基坑 开挖具有一定的指导意义。 论文运用三维有限元分析的相关原理建立基坑三维模型分析基坑的角部效应, 从而为实际工程提供一定 的参照。
【Abstract】 In the general design, people often will pit is simplified as a plane strain problem of two-dimensional analysis. The actual pit is
one has the length, width, depth of the three-dimensional space structure system, especially the foundation of city construction, excavation shape doesn't rule, there are many angle, mechanical effect of the corner by the general plane analysis can not reflect the good and. In this paper, applying the relevant principles of three-dimensional finite element analysis of three-dimensional model of the foundation pit excavation analysis angle effect, so as to provide some reference for practical engineering.
- 1、下载文档前请自行甄别文档内容的完整性,平台不提供额外的编辑、内容补充、找答案等附加服务。
- 2、"仅部分预览"的文档,不可在线预览部分如存在完整性等问题,可反馈申请退款(可完整预览的文档不适用该条件!)。
- 3、如文档侵犯您的权益,请联系客服反馈,我们会尽快为您处理(人工客服工作时间:9:00-18:30)。
Generation of Three Dimensional Finite Element Bone ModelsFrom CT Scan DatasetsKieran M. Pearse, Michael A. McCarthykieran.pearse@ul.ie, michael.mccarthy@ul.ieMechanical & Aeronautical Engineering Department,University of Limerick, Limerick, Ireland.AbstractTaken as a contiguous set CT scans are essentially three dimensional even though an individual scan is two dimensional. Therefore by applying surface detection methods to a set of scans a true three dimensional geometry model of a scanned internal human body structure of interest can be produced. This current research addresses this issue and outlines a program capability developed at the University of Limerick to extract bone geometry from CT scan datasets for the purpose of creating three dimensional finite element bone models. The program developed is called LIMEX and runs on a Silicon Graphics workstation platform. It enables the bone boundary to be detected in the individual scans by surface extraction techniques, and outputs this bone geometry in the form of a session file to interface with the finite element pre-processor Patran.1. IntroductionComputerised tomography or CT is an imaging modality that creates transverse slices of the human body by means of a CT scanner. CT scans are essentially three dimensional when taken as a contiguous set even though each scan is two dimensional. By applying surface detection methods to a set of scans a three dimensional geometric model of an internal body structure of interest such as a bone can be produced. This paper addresses this problem and outlines a capability to extract bone geometry from CT scan datasets for the purpose of creating three dimensional finite element bone models. Such a capability was devised at Cornell University in 1989 by McCarthy [1] to run on a Silicon Graphics workstation (SGI) platform. However since then the SGI operating system has changed considerably and the abilities of CT scanners have been enhanced greatly. Therefore this research was undertaken to re-investigate some of the issues involved in geometry extraction from CT and to create a facility at the University of Limerick to extract bone geometry from CT scan datasets which would be available to bioengineering researchers at the University of Limerick. This geometry extraction program is known as LIMEX.The medical and non-medical related applications of this potential to create three dimensional models are numerous. The main purpose of providing the facility at the University of Limerick is for computational studies of body structures. Finite element models of body parts using CT images is not a new concept and have become more and more common especially with the development of computational capabilities [2]. The main advantage of using CT in building these models is that it gives a very accurate definition of geometry. However the application potential of a program such as LIMEX is not restricted to finite element modelling. The ability to use CT scans to generate three dimensional models for the design of custom implants is an important concept in biomedical engineering. Such procedures have been reported widely from orthopaedic centres such as the Royal Orthopaedic Hospital [3]. Another potential use is as a tool in preoperative surgical planning. This has been demonstrated by Caponetti et al. [4]. Outside the field of medicine, such techniques haveapplication in the field of non-destructive evaluation of expensive components such as rocket nozzles.These numerous applications highlight the capabilities of a potential to generate three dimensional models from CT scan datasets such as that provided by LIMEX and are motivating factors for this research.2. Surface Extraction Method ImplementedSurface extraction in LIMEX is performed using a 2-dimensional region based method. As outlined by Rosenfeld [5], the following steps are generally necessary to perform region-based surface extraction: (a) Initial Segmentation, (b) Decomposition or Region Growing, (c) Representation.Segmentation is the process that subdivides an image into constituent parts or objects. Thresholding is one of the most common approaches to image segmentation and was the method implemented in LIMEX.The second step in region-based surface extraction is region growing. Region growing is a procedure that groups pixels into connected regions. The approach used to perform region growing was that proposed by Rosenfeld and Pfaltz [6]. The algorithm operates as follows: Each line of the thresholded binary image is scanned from left to right and labelsare assigned to pixels with a value of 1. (i.e. region values). This is illustrated byconsidering two lines of a binary image:line r-1 x x b x xline r x c a x xGiven that the pixel labelled a is a 1, a is assigned a label according to thefollowing rules.00then a=≠if b c==0 then a is given the next available label; if b c0000then a is given b’s label; if b c≠≠is given c’s label; if b c≠=then a is given the smaller of the two labels and b’s label and c’s label are markedas equivalentWhen this scan of the image S is complete, each pixel of S has a label, and no points belonging to different connected components have the same label. However it is quite possible that the points belonging to the same component have different labels, whose equivalence was not discovered until later in the scan. To eliminate these superfluous labels, the list of recorded equivalencies is processed, and for each label, the smallest label that is equivalent to it is determined. The image is then scanned again, and each label is replaced by its smallest equivalent label. After this second scan is finished, the points of each connected component all have the same label.The final step is representation and one algorithm for finding a simple two-dimensional boundary is that described by Rosenfield [7]. The image is scanned beginning at the top, left, and proceeding down each column in turn, until the first boundary pixel on the region of interest is found. The second boundary pixel is found by checking the eight neighbours of the first boundary pixel, beginning with the pixel to the left of the first boundary pixel and proceeding clockwise. Once a boundary pixel is found, the search is interrupted and thenewly found pixel is made current. Finding subsequent boundary pixels involves checking the neighbours of the current boundary pixel, beginning with the pixel which is one position clockwise of the previous boundary pixel and proceeding clockwise. As boundary pixels are found they are marked to prevent them being found again. The criterion to decide if a pixel with co-ordinates (x,y) is a boundary pixel is:if (x,y) is a member of the region of interest and any of its four-connected neighbours (x-1,y), (x+1,y), (x,y-1) or (x,y+1) are zero and not all are zero then (x,y) is a boundary pixel.Once a failure to find a boundary pixel among the neighbours of the current boundary pixel occurs, that boundary record is terminated and the image is scanned again for a start pixel for a new boundary. The process ends when no further start boundary pixels can be found.The main problem with this procedure is that it does not actively seek closed boundaries, so that boundaries are often terminated in an unclosed state. Other problems are related to the fact that when seeking internal as well as external boundaries, the region width sometimes reduces to only one pixel wide. The method used to overcome these problems is outlined in the next section.3. LIMEX ProgramThe code for LIMEX was written to run on a Silicon Graphics platform and Figure 1 provides a flow chart of the program. The steps involved will now be outlined in more detail.Figure 1 : Flow Chart of LIMEX ProgramThe first step in extracting bone geometry from CT scans is to select a set of CT scans which contains the bone of interest. When the first scan is opened it is possible to zoom in on the area of interest. It is also possible to scale the area of interest to provide a better visual view of the bone of interest.The next step is to extract the bone geometry from the loaded scan image. The extraction of the geometry is carried out using a region based method. The image is first thresholded as an initial segmentation process. This is to segment bone pixels of the bone of interest from surrounding tissue. Figure 2 displays an example of a scan before and after thresholding. Sometimes it is difficult to select a threshold value that will segment bone from surrounding tissue. This is most evident in skeletal regions of joints. In such cases it is sometimes necessary to apply image filters to enhance the image. Two broad categories of image enhancement techniques are implemented in LIMEX: spatial domain methods and frequency domain methods. Processing techniques in the first category refer to the image plane itself, and approaches in this category are based on direct manipulation of the pixels in an image. The frequency domain filters are based on modifying the Fourier transform of an image. Even with the aid of filters it may still be necessary to edit an image manually to provide segmentation in such regions. Therefore manual editing is a built in feature of LIMEX.Figure 2 : Thresholding an ImageHaving segmented the bone of interest from other tissue region growing is then performed as outlined in the previous section. This algorithm uses the concept of 4-connectedness to perform region growing. The result of the algorithm is a number of connected regions each with a different label. To decide which region is the region of interest some prior knowledge must be available about the region of interest. The region growing algorithm can provide information such as region area as a by-product. This results in several regions each with a different label. By choosing the region of interest carefully in the earlier step to select as closely as possible only the bone of interest, it can be assumed that the region with the largest area is the area of interest. Therefore this region is selected as the region of interest and pixels in other regions are given a value of zero.The resulting image is then scaled by three to overcome the problem of one element region width and others outlined in Section 2. This image is then scanned until the first member of the largest region which is judged to be a boundary pixel is found and the boundary followeroutlined previously is applied. This finds all the boundaries of the region of interest. However in extracting bone geometry for the purpose of this research, in general the boundary of interest is the outside boundary. This boundary is deemed to be the boundary which spans the greatest sum of pixels in the x and y directions.The co-ordinates of these boundary pixels are then output in the form of a “Session” file which can interface with the commercially available finite element post and pre-processor Patran (McNeal USA). This process is then repeated for each scan in the set. The outputted session file can then be ran within Patran to create the geometry of the bone of interest.4. ResultsAn example of a 3-dimensional geometry model of an in-vivo femur created with the aid of LIMEX is shown in Figure 3. A pelvic model among others has also been created.Figure 3 : Geometry Model of Femur Created Using LIMEX5. References1. McCarthy, M. A., 1989. Bone Geometry from CAT Scans for Finite Element Analysis, Image Processing Considerations and Modelling Effects. PhD Thesis, Cornell University, Ithaca, NY.2. Prendergast, P. J., 1997. “Finite element models in tissue mechanics and orthopaedic implant design.” In: Clinical Biomechanics, vol. 12.3. Crawford, H.V., P. S. Unwin, P. S. Walker, 1992. “The CADCAM Contribution to Customized Orthopaedic Implants”, In: IMechE, Vol. 206.4. Caponetti, L., A. M. Fanelli, 1993. “Computer Aided Simulation for Bone Surgery”, In: IEEE Computer Graphics and Applications.5. Rosenfeld, A., 1978. “Algorithms for Image Vector Conversion”, In: Computer Graphics (ACM) 12 (3).6. Rosenfeld, A., J. L. Pfaltz, 1966. “Sequential Operations in Digital Picture Processing”, In: J. Assoc. Comput. Mach. 12 (4), 471-494.7. Rosenfeld, A., 1968. “Picture Processing by Computer”, In: New York: Academic Press.。