Influence of dry density on HTO diffusion in GMZ bentonite
沉积温度对等离子增强化学气相沉积法制备的SiNx H 薄膜特性的影响
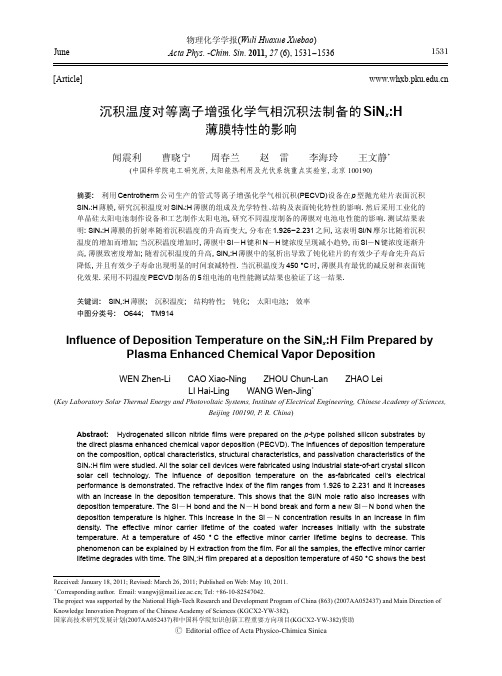
沉积温度对等离子增强化学气相沉积法制备的SiN x :H薄膜特性的影响闻震利曹晓宁周春兰赵雷李海玲王文静*(中国科学院电工研究所,太阳能热利用及光伏系统重点实验室,北京100190)摘要:利用Centrotherm 公司生产的管式等离子增强化学气相沉积(PECVD)设备在p 型抛光硅片表面沉积SiN x :H 薄膜,研究沉积温度对SiN x :H 薄膜的组成及光学特性、结构及表面钝化特性的影响.然后采用工业化的单晶硅太阳电池制作设备和工艺制作太阳电池,研究不同温度制备的薄膜对电池电性能的影响.测试结果表明:SiN x :H 薄膜的折射率随着沉积温度的升高而变大,分布在1.926-2.231之间,这表明Si/N 摩尔比随着沉积温度的增加而增加;当沉积温度增加时,薄膜中Si -H 键和N -H 键浓度呈现减小趋势,而Si -N 键浓度逐渐升高,薄膜致密度增加;随着沉积温度的升高,SiN x :H 薄膜中的氢析出导致了钝化硅片的有效少子寿命先升高后降低,并且有效少子寿命出现明显的时间衰减特性.当沉积温度为450°C 时,薄膜具有最优的减反射和表面钝化效果.采用不同温度PECVD 制备的5组电池的电性能测试结果也验证了这一结果.关键词:SiN x :H 薄膜;沉积温度;结构特性;钝化;太阳电池;效率中图分类号:O644;TM914Influence of Deposition Temperature on the SiN x :H Film Prepared byPlasma Enhanced Chemical Vapor DepositionWEN Zhen-LiCAO Xiao-Ning ZHOU Chun-Lan ZHAO LeiLI Hai-Ling WANG Wen-Jing *(Key Laboratory Solar Thermal Energy and Photovoltaic Systems,Institute of Electrical Engineering,Chinese Academy of Sciences,Beijing 100190,P .R.China )Abstract:Hydrogenated silicon nitride films were prepared on the p -type polished silicon substrates by the direct plasma enhanced chemical vapor deposition (PECVD).The influences of deposition temperature on the composition,optical characteristics,structural characteristics,and passivation characteristics of the SiN x :H film were studied.All the solar cell devices were fabricated using industrial state-of-art crystal silicon solar cell technology.The influence of deposition temperature on the as-fabricated cell ʹs electrical performance is demonstrated.The refractive index of the film ranges from 1.926to 2.231and it increases with an increase in the deposition temperature.This shows that the Si/N mole ratio also increases with deposition temperature.The Si -H bond and the N -H bond break and form a new Si -N bond when the deposition temperature is higher.This increase in the Si -N concentration results in an increase in film density.The effective minor carrier lifetime of the coated wafer increases initially with the substrate temperature.At a temperature of 450°C the effective minor carrier lifetime begins to decrease.This phenomenon can be explained by H extraction from the film.For all the samples,the effective minor carrier lifetime degrades with time.The SiN x :H film prepared at a deposition temperature of 450°C shows the best[Article]物理化学学报(Wuli Huaxue Xuebao )Acta Phys.-Chim.Sin .2011,27(6),1531-1536June Received:January 18,2011;Revised:March 26,2011;Published on Web:May 10,2011.∗Corresponding author.Email:wangwj@;Tel:+86-10-82547042.The project was supported by the National High-Tech Research and Development Program of China (863)(2007AA052437)and Main Direction of Knowledge Innovation Program of the Chinese Academy of Sciences (KGCX2-YW-382).国家高技术研究发展计划(2007AA052437)和中国科学院知识创新工程重要方向项目(KGCX2-YW-382)资助ⒸEditorial office of Acta Physico-Chimica Sinica1531Vol.27Acta Phys.-Chim.Sin.2011anti-reflection and surface passivation properties.The electrical performance of the fully functional solarcells is also demonstrated and the optimized results are highlighted and discussed.Key Words:SiN x:H thin film;Deposition temperature;Structural property;Passivation;Solar cell;Efficiency1引言晶体硅太阳电池的表面积与体积的比率大,表面复合严重.此外,与电子级硅片相比,太阳能级单晶体硅和多晶体硅体内存在大量的杂质和缺陷,而这些杂质和缺陷会充当复合中心,增加复合速率.1,2表面复合和杂质缺陷复合会显著降低少子寿命,降低电池的短路电流和开路电压,进而影响电池的转换效率.因此减少表面复合和杂质复合是进一步提高晶体硅电池效率的关键.3目前产业化生产的晶体硅太阳电池全部采用增强的等离子化学气相沉积(PECVD)工艺制备SiN x:H薄膜对硅片表面进行钝化,减少表面复合和杂质复合;这层薄膜同时还具有光学减反射的作用.PECVD法制备薄膜的优点有:(1)沉积温度低(<500°C),硅中少子寿命影响较小,而且生产能耗低;(2)沉积速度较快,产能大,工艺重复性好;(3)SiN x:H薄膜的折射率分布在1.8-2.3之间,与硅的折射率相匹配,可以获得完美的减反射效果;(4)薄膜氢含量高,具有优良的表面钝化和体钝化效果:薄膜中的固定正电荷能够对硅片表面起到场效应钝化效果,可以有效地降低表面复合,提高电池效率;薄膜中的H还会向硅片体内扩散进行体钝化,特别是对多晶体硅太阳电池的转换效率有很好的改善.3SiN x:H薄膜的物理、化学及钝化特性取决于制备方法和工艺参数,在过去的几十年里,研究人员进行了大量关于工艺参数对薄膜特性影响的实验研究,4-7得出了很多被广泛认同的一致规律,用于指导产业化生产中SiN x:H薄膜沉积工艺;然而在之前的实验研究中,SiN x:H薄膜大部分都是使用用于实验研究的小型PECVD设备制备的,因此实验结论对产业化生产的指导意义不大.而且这些研究都是针对NH3和SiH4流量比、功率、腔体压强这三个参数对薄膜性质的影响进行的.虽然也有人观察到了沉积温度对薄膜性质的影响.8但也局限于给出了沉积速率、折射率、钝化特性的实验结果,并没有给出沉积温度影响这些特性的机理.本文重点研究产业化中大量应用的直接PECVD法制备SiN x:H薄膜工艺,沉积温度对薄膜组成/减反射特性、结构特性/钝化特性的影响和机理.同时对SiN x:H薄膜表面钝化效果的衰退现象进行了观察研究.最后根据这些实验结果,研究不同沉积温度条件制备的SiN x:H薄膜对太阳电池性能的影响.2实验使用直接法低频(40kHz)管式PECVD设备(Centrotherm公司)制备SiN x:H薄膜.使用的工艺气体是SiH4(纯度:99.995%)和NH3(纯度:99.998%).衬底电阻率为1Ω·cm的单面抛光的p型Czoehralski 法(CZ)直拉单晶硅片,大小为125mm×125mm.在沉积SiN x薄膜之前用标准的RCA清洗工艺清洗硅片,在进入反应腔体之前用HF和HCl(HF:3%,HCl: 7%)的混合溶液清洗硅片,去掉硅片表面的氧化层和金属离子.在硅片抛光表面沉积氮化硅,沉积温度的变化范围是400-500°C,而其它的沉积参数(NH3和SiH4流量比42:5、功率810W、腔体压强226.674 Pa)保持不变.每一组温度实验的样品数为10片左右.PECVD沉积SiN x:H薄膜一般是由SiH4和NH3在等离子体气氛下反应生成,反应式如下:SiH4+NH3→SiNH+3H2(1)在低压下,令射频发生器产生高频电场,使电极间的气体发生辉光放电,产生非平衡等离子体.这时反应气体的分子、原子和离子均处于环境温度,而电子却被电场加速,获得很高的能量将反应的气体分子激活,使原本高温下才发生的反应在低温时就能发生.利用椭偏仪(波长633nm,法国SOFRA公司,型号:SOPRA-GEs)测量SiN x:H薄膜的折射率和厚度;采用傅里叶变换红外(FTIR)透射谱研究薄膜中氢含量和Si-H、N-H和Si-N键的密度,所用仪器为美国Agilent公司生产,型号为Varian Excalibur 3100;使用微波光电导衰退法(MWPCD)测量有效少子寿命(τeff),所用仪器为匈牙利Semilab公司生产,型号为WT-2000.最后在电池制作过程中选用200μm厚的硅片,采用标准的单晶硅太阳电池制造工1532No.6闻震利等:沉积温度对等离子增强化学气相沉积法制备的SiN x :H 薄膜特性的影响艺:制绒、扩散制结、等离子体去边、去磷硅玻璃、沉积SiN x :H 薄膜、表面金属化,制备5组单晶硅太阳电池,每组电池代表了不同的PECVD 沉积温度,然后测试太阳电池的性能参数,进行比较分析.3结果和讨论3.1薄膜组成特性和光学折射率在用直接PECVD 法生长氮化硅时,那些具有化学反应活性的原子、分子、基团是在电极间的射频电场中被电离的.这些具有反应活性的粒子将会在硅片表面反应生成SiN x :H 薄膜.相对于高能的等离子体,沉积温度的升高对到达硅片表面的活性粒子数量的影响非常有限,因此对沉积速率的影响很小.表1给出了不同沉积温度条件下制备的SiN x :H 薄膜的厚度、沉积速率和折射率的变化.沉积速率是由薄膜厚度除以沉积时间得到的.从表1中可以看出,虽然沉积速率有变大的趋势,但变化很小.但是随着沉积温度升高,衬底硅片的温度也在升高,这使吸附到硅片表面的活性原子、分子、基团的能量增加,并使这些活性粒子在基片表面的扩散、迁移能力增强.这样随着温度的升高虽然不能增加到达硅片的活性粒子的数量,但是会使这些粒子反应更加充分.由于Si -H 键较N -H 键具有更小的激活能,所以温度的升高会使参与反应的含有Si -H 键的活性粒子较含有N -H 键的活性粒子多,这就会增加薄膜的Si/N 摩尔比(下同).SiN x :H 薄膜的折射率与薄膜中Si/N 比密切相关.不同的研究人员分别给出了使用不同的设备制备的SiN x :H 薄膜的折射率与Si/N 比的近似经验公式,9,10其中Bustarret 给出的折射率(n )和Si/N 比近似公式适用于Centrotherm PECVD 制备的SiN x :H 薄膜:10,11n =1.22+0.61x (2)式中x 为Si/N 摩尔比.由表1的实验结果可知,随着沉积温度的升高,薄膜的折射率也在升高,并且处于1.926-2.231之间.根据近似公式(2)可以计算得出的SiN x :H 薄膜的Si/N 摩尔比从1.16提高到1.66.对于硅太阳电池,根据薄膜光学原理,满足在600nm 波长处最低反射率的薄膜的折射率应该选择为硅材料和空气折射率的几何平均值,即在2.0左右.根据表1可知,沉积温度在400-450°C 之间,SiN x :H 薄膜减反射效果最优.确定了薄膜折射率后,可以通过控制沉积的时间来控制薄膜的厚度,从而达到最佳的减反效果.3.2薄膜结构特性和钝化特性很多实验研究表明SiN x :H 薄膜的氢含量和致密度对薄膜的表面钝化效果和体钝化效果都至关重要.图1为在不同沉积温度下制备的SiN x :H 薄膜的傅里叶变换红外透射谱.图1中的各个吸收峰根据薄膜的厚度进行了归一化处理,并且为了便于比较,表1不同温度沉积的SiN x :H 薄膜的厚度(d ),沉积速率(v )和折射率(n )Table 1SiN x :H thickness (d ),deposition velocitys (v ),and refractive index (n )at different deposition temperaturesNo.12345T /°C 400425450475500d /nm 120.9117.9133.1130.7133.2v /(nm ·min -1)7.97.78.78.58.7n 1.9262.0522.0952.1372.231图1不同沉积温度下制备的SiN x :H 薄膜的傅里叶变换红外透射谱Fig.1The Fourier transform infrared transmission spectra with different deposition temperatures(A)spectra of Si -N bond,Si -H bond,N -H bond;(B)enlarged spectra of Si -H bond,N -H bondT /°C:400,425,450,475,5001533Vol.27Acta Phys.-Chim.Sin.2011在纵轴上人为地上下错开.850cm-1附近的峰对应着Si-N键伸缩模式,在1200cm-1附近为弯曲模式,在3360-3460cm-1为N-H键的伸缩模式,2170cm-1分别对应着Si-H键摇摆模式和伸缩模式.12从图1我们可以看到,随着沉积温度升高,SiN x:H薄膜中Si-N键吸收峰强度增强,而Si-H键和N-H键吸收峰强度减弱.在分析SiN x:H薄膜中的氢含量时,在3340cm-1处的N-H键和2200cm-1附近的Si-H键最重要.13我们使用Lanford和Rand14建议的方法,根据Si-H键和N-H键的吸收峰计算出Si-H和N-H键的浓度,将二者相加就得到总的氢键浓度.Si-N键的浓度可根据Bustarret10和Giorgis15等的分析方法计算得到.表2给出了计算得到的不同沉积温度下制备的SiN x:H薄膜中Si-N 键、Si-H键、N-H键浓度以及H键的总浓度.从表2中可以看到,SiN x:H薄膜中Si-N键浓度随着沉积温度升高明显增加,而Si-H键和N-H 键浓度则随着沉积温度升高明显减少,H键总浓度自然也明显减少.这是因为随着沉积温度升高,在反应过程中所生成的Si-H键和N-H键被破坏,导致Si-H键和N-H键浓度降低,由于Si-H键键能比N-H键键能小,所以随着温度的升高,Si-H键浓度迅速降低,而N-H键浓度减少幅度小得多. Si-H断裂开的Si原子和N-H键断裂开的N原子结合生成了一些新的Si-N键,使得Si-N键浓度升高.仔细研究发现,随着温度的升高,N-H键浓度的降低(N-H键和Si-H键浓度降低小的一个)小于Si-N键的增加.这说明Si-N键浓度随温度的增加不仅仅来源于N-H和Si-H键的断裂重组,还来源于前面讨论提到的,即随着沉积温度升高,使吸附到基片表面的活性原子、分子、基团的能量增加,粒子在基片表面的扩散、迁移能力增强,使得薄膜结构致密.SiN x:H薄膜中Si-N键的浓度反映了薄膜的致密度,16随着薄膜的Si-N键的浓度增加,薄膜的质量密度会变大.17图2给出了不同沉积温度条件下制备的SiN x:H 薄膜在浓度为5%(w)的HF溶液中的腐蚀速率v ER,随着沉积温度升高,薄膜的腐蚀速率明显减小.这正是因为薄膜的密度增加,导致HF对薄膜的腐蚀速率降低.在这些SiN x:H薄膜中,Si-N键的浓度均大于1×1023cm-3,这比相关文献给出的Roth&Rau公司用PECVD法制备的SiN x:H薄膜的Si-N键浓度大了将近一个数量级,18说明Centrotherm公司用PECVD法制备的SiN x:H薄膜更加致密.Centrotherm 公司的PECVD是直接法,Roth&Rau公司的PECVD法是间接法,间接法等离子体是离子离化后形成SiN x:H,然后再扩散到硅片表面的,所以薄膜的质量较为疏松.SiN x:H薄膜中Si-N键浓度对薄膜表面钝化和体钝化效果至关重要,19在H含量相同的情况下,对于致密的薄膜,其钝化特性和减反射特性都要优越得多.沉积SiN x:H薄膜的硅片的有效少子寿命测试结果如表3所示,表中还给出了有效寿命随着时间表2不同沉积温度下制备的SiN x:H薄膜的Si-N键、Si-H键、N-H键以及H键总浓度Table2Bond concentration of Si-N,Si-H,N-H,and total H(TH)bonds of SiN x:H film at different depositiontemperaturesNo. 1 2 3 4 5T/°C40042545047550010-23n Si-N/cm-31.031.061.171.241.2910-22n Si-H/cm-31.691.271.211.111.1110-22n N-H/cm-31.131.001.020.980.9710-22n TH/cm-32.822.272.232.092.08表3不同沉积温度下制备的SiN x:H薄膜表面钝化的硅片的有效少子寿命(τeff)和衰减情况Table3Minority carriers lifetime(τeff)of silicon surfacepassivation SiN x:H film change with different depositiontemperatures andtimeNo.12T/°C400425τeff/μsinitial20.130.515d13.017.630d10.615.145d11.015.4图2不同沉积温度的SiN x:H薄膜在HF溶液中的腐蚀速率(v ER)Fig.2Etching rate(v ER)of SiN x:H film deposited atdifferent temperatures in HFsolutionNo.6闻震利等:沉积温度对等离子增强化学气相沉积法制备的SiN x :H 薄膜特性的影响的变化.表3的结果显示,SiN x :H 薄膜表面钝化的硅片的有效少子寿命随着沉积温度的升高先升高后降低,在450°C 处有效少子寿命达到最大值.沉积温度过低和过高都会对薄膜的表面钝化效果有不利影响,这与薄膜中的固定电荷密度和界面态密度的变化有关.硅悬挂键在SiN x :H 薄膜的深能级缺陷中占主导地位,又以Si ≡N 3为主,称为K 心,在禁带中心形成高密度的缺陷态.在氮化硅薄膜中K 心存在的稳定态是K +(Si ≡N +3),使氮化硅薄膜带正电.20根据前面讨论的结果(如表2所示),随着沉积温度的增加,断裂的Si -H 键要多于断裂的N -H 键,这说明随着氢从薄膜中析出,硅悬挂键增多,导致固定电荷密度增加.因此尽管薄膜中的氢含量降低,但是由于薄膜的场钝化效应增强,从而使硅片的有效少子寿命变大.当温度进一步升高后,随着大量的氢从薄膜中析出,在SiN x :H 薄膜与硅界面处的氢含量也开始减少,从而导致硅表面大量的悬挂键存在,增加了界面态密度,从而使硅片的有效少子寿命呈现下降趋势.另外一个现象就是有效少子寿命t eff 随着时间有显著的减小,经过一个月才趋于稳定,表面钝化效果的衰减可能与Si-SiN x :H 或SiN x :H 薄膜内部特殊的“弱键”在紫外光照射下被破坏有关.213.3电池的结果表4为按照标准的单晶硅太阳电池制作工艺制备的5组电池的电性能测试结果,每组的数量仍为10片左右.为了保持每组电池对太阳光的外反射一致,SiN x :H 薄膜厚度略有不同(因为不同的沉积温度折射率不一致).其余的制作工艺和参数完全一致.由表4可见最高效率点并没有出现在由前面实验结果得出的最佳有效寿命的制备温度450°C,而是出现在425°C.在采用本文实验中所用的硅片(200μm 厚,1Ω·cm 电阻率)时,开路电压主要是由基区决定的.由于PECVD 沉积薄膜主要影响发射结表面的钝化特性,所以5组电池的开路电压全部相同.直接能体现表面钝化特性的短路电流的变化规律与3.3节中的有效少子寿命实验结果相一致,即随着温度升高先升高然后降低,但是最高点出现425°C.这是因为短路电流不仅受表面钝化特性的影响而且还受串/并联电阻的影响.串联电阻并没有随沉积温度呈现规律性的变化,可以认为不受沉积温度的影响;但是并联电阻却随着沉积温度的升高而明显单调降低.并联电阻越低,短路电流和填充因子越低.同理,填充因子受串/并联电阻和短路电流的影响最高值也出现在425°C.这样在本实验的工艺条件下,425°C 的PECVD 沉积温度给出了最优化的效率.随着沉积温度的升高,SiN x :H 薄膜越来越致密;而薄膜结构越致密导热性就越好,所以在烧结过程中,玻璃银浆更加容易熔化烧穿薄膜.这样沉积温度越高,在相同的烧结工艺下,并联电阻越低(如表4所示).这也说明在本实验中,如果能够精细地调节450°C 沉积的薄膜所对应的烧结工艺,使并联电阻足够高,串联电阻足够低,将会在450°C 达到最优化的电池效率值.4结论在PECVD 法制备SiN x :H 薄膜工艺中,沉积温度对薄膜的Si/N 摩尔比、折射率、硅、氮和氢成键结构以及表面钝化效果有很大影响.在400-500°C 的温度区间制备的SiN x :H 薄膜的折射率分布在1.926-2.231之间.薄膜中的Si/N 摩尔比随着沉积温度的增加而增加,导致薄膜的折射率升高.而Si -H 键和N -H 键浓度随着沉积温度升高会减小,薄膜中氢含量降低.随着沉积温度的增加,Si -H 键断裂形成正电中心提高了场钝化效应,而H 的析出又降低了体钝化效应,这两者相互竞争造成了SiN x :H 薄膜钝化硅片的有效少子寿命先增加后下降.SiN x :H 薄膜钝化的硅片还出现明显的时间衰减特性,对于造成这种衰减原因还需要进一步的研究.沉积温度为450°C 时制备的SiN x :H 薄膜具有较好的减反射和表面钝化效果.采用相同类型的硅片制作的太阳电池的测试结果也验证了此钝化效果规律.同时还发现沉积温度越高,薄膜越容易被浆料烧穿,从而并联电阻越低.精细地调节烧结工艺将会使450°C 的沉积温度给出最优化的效率.致谢:感谢江苏欧贝黎新能源科技股份有限公司提供部分Eff:efficiency;V oc :open circuit voltage;I sc :short circuit current intensity;R s :series resistance;R sh :shunt resistance;FF:fillfactorNo.12T /°C 400425Eff./%17.717.8V oc /mV 626626I sc /A 5.345.35R s /m Ω65.5R sh /Ω72.637FF 0.7850.788表4电池性能参数Table 4Electrical performance of solar cells1535Vol.27 Acta Phys.-Chim.Sin.2011实验设备及屈盛博士、汤叶华硕士给予的有价值的讨论.References(1)Jana,T.;Mukhopadhyay,S.;Ray,S.Sol.Energy Mater.Sol.Cells2002,71(2),197.(2)Nijs,J.Advanced Silicon and Semiconducting Silicon-alloyBased Materials and Devices;Taylor&Francis:Bristol,1994.(3)Duerinckx,F.;Szlufcik,J.Sol.Energy Mater.Sol.Cells2002,72(1-4),231.(4)Schmidt,J.;Kerr,M.Sol.Energy Mater.Sol.Cells2001,65(1-4),585.(5)Soppe,W.;Rieffe,H.;Weeber,A.Progress in Photovoltaics-Research and Applications2005,13(7),551.(6)Santana,G.;Morales-Acevedo,A.Sol.Energy Mater.Sol.Cells2000,60(2),135.(7)Lauinger,T.;Moschner,J.;Aberle,A.;Hezel,R.J.Vac.Sci.Technol.A-Vacuum,Surfaces,and Films1998,16,530.(8)Yoo,J.;Dhungel,S.;Yi,J.Thin Solid Films2007,515(12),5000.(9)Dauwe,S.Low-temperature Surface Passivation of CrystallineSilicon and Its Application to the Rear Side of Solar Cells.Ph.D.Dissertation,Hannover University,Germany,2004.(10)Bustarret,E.;Bensouda,M.;Habrard,M.;Bruyere,J.;Poulin,S.;Gujrathi,S.Phys.Rev.B1988,38(12),8171.(11)Lelievre,J.;Fourmond,E.;Kaminski,A.;Palais,O.;Ballutaud,D.;Lemiti,M.Sol.Energy Mater.Sol.Cells2009,93(8),1281.(12)Tsu,D.;Lucovsky,G.;Mantini,M.Phys.Rev.B1986,33(10),7069.(13)Morimoto,A.;Tsujimura,Y.;Kumeda,M.;Shimizu,T.Jpn.J.Appl.Phys1985,24(11),1394.(14)Lanford,W.;Rand,M.J.Appl.Phys1978,49,2473.(15)Giorgis,F.;Giuliani,F.;Pirri,C.;Tresso,E.;Summonte,C.;Rizzoli,R.;Galloni,R.;Desalvo,A.;Rava,P.PhilosophicalMagazine Part B1998,77(4),925.(16)Hong,J.;Kessels,W.;Soppe,W.;Rieffe,H.;Weeber,A.;van deSanden,M.Structural Film Characteristics Related to thePassivation Properties of High-rate(>0.5nm/s)PlasmaDeposited a-SiN x:H.In3rd World Conf.on PhotovoltaicEnergy Conversion;Osaka,2003;Wcpec-3OrganizingCommittee:TYokyo,Japan,2003;1185.(17)Soppe,W.;Hong,J.;Kessels,W.;van de Sanden,M.;Arnoldbik,W.;Schlemm,H.;Devilée1,C.;Rieffe1,H.;Schiermeier1,S.;Bultman,J.;Weeber1,A.On CombiningSurface and Bulk Passivation of SiN x:H Layers for mc-SiSolar Cells.In Proc.29th IEEE Photovoltuic SpecialistsConference,New Orleans,2002;IEEE:New York,USA,2002;158-161.(18)Cuevas,A.;Chen,F.;Tan,J.;Mackel,H.;Winderbaum,S.;Roth,K.FTIR Analysis of Microwave-Excited PECVD SiliconNitride Layers.In4th World Conference on PhotovoltaicEnergy Conversion,Waikoloa,Hawaii,2006;IEEE:New York,USA,2006;1148-1151.(19)Weeber,A.;Rieffe,H.;Romijn,I.;Sinke,W.;Soppe,W.TheFundamental Properties of SiN x:H That Determine ItsPassivating Qualities.In31st IEEE PVSC Conf,Florida,2005;IEEE:New York,USA,2005;1043-1046.(20)Robertson,J.;Warren,W.;Kanicki,J.J.Non-Cryst.Solids1995,187,297.(21)Hezel,R.;Jaeger,K.J.Electrochem.Soc1989,136(2),518.1536。
古龙页岩油高温高压注CO2驱动用效果
大庆石油地质与开发Petroleum Geology & Oilfield Development in Daqing2024 年 2 月第 43 卷 第 1 期Feb. ,2024Vol. 43 No. 1DOI :10.19597/J.ISSN.1000-3754.202305001古龙页岩油高温高压注CO 2驱动用效果李斌会1,2,3 邓森1,2,3 张江1,2,3 曹胜1,2,3郭天娇1,2,3 徐全1,2,3 霍迎冬1,2(1.多资源协同陆相页岩油绿色开采全国重点实验室,黑龙江 大庆163712;2.中国石油大庆油田有限责任公司勘探开发研究院,黑龙江 大庆163712;3.黑龙江省油层物理与渗流力学重点实验室,黑龙江 大庆163712)摘要: 为了明确古龙页岩油高温高压注CO 2驱动用效果,首先根据页岩压汞和氮气吸附实验结果,给出页岩T 2值与孔喉半径转换系数,根据饱和页岩的T 2谱特征,将页岩孔隙分为小孔、中大孔和页理缝;然后通过计算页岩油采出程度,考察吞吐周期、闷井时间、裂缝对吞吐驱油效果的影响,并且分析吞吐后岩心孔隙结构的改变程度;最后对比页岩油CO 2吞吐和CO 2驱替的驱油效果,并给出最优的驱油方式。
结果表明:吞吐动用幅度最大的是中大孔和页理缝中的页岩油,小孔中的页岩油采出程度最低,增加闷井时间,页岩油采出程度仅提高0.81百分点,压裂可以使小孔中的页岩油采出程度提高11.33百分点,使小孔中的页岩油得到有效动用;吞吐比驱替可以使页岩油采出程度提高30.98百分点,并且可以动用干岩样中的页岩油,效果优于驱替;驱吞结合驱油方式比只进行吞吐可以使页岩油采出程度提高12.88百分点以上,并且可以大幅度提高小孔中页岩油的采出程度;吞吐后岩心孔隙结构发生明显变化,页岩砂砾含量不同是导致页岩吞吐前后孔隙结构变化差异大的重要原因。
研究成果可为古龙页岩油矿场实践提供重要的基础参数。
关键词:古龙页岩油;孔隙结构;CO 2驱替;CO 2吞吐;高温高压;核磁共振中图分类号:TE357 文献标识码:A 文章编号:1000-3754(2024)01-0042-10Producing effect of CO 2 displacement injection at high temperature and high pressure for Gulong shale oilLI Binhui 1,2,3,DENG Sen 1,2,3,ZHANG Jiang 1,2,3,CAO Sheng 1,2,3,GUO Tianjiao 1,2,3,XU Quan 1,2,3,HUO Yingdong 1,2(1.National Key Laboratory for Multi⁃resource Collaborated Green Development of Continental Shale Oil ,Daqing 163712,China ;2.Exploration and Development Research Institute of Daqing Oilfield Co.,Ltd.,Daqing 163712,China ;3.Heilongjiang Provincial Key Laboratory of Reservoir Physics & FluidMechanics in Porous Medium ,Daqing 163712,China )Abstract :In order to clarify the effectiveness of CO 2 injection at high temperature and high pressure for Gulong shale oil , the conversion coefficient between shale T 2 value and pore throat radius is firstly given based on the re⁃sults of shale mercury injection and nitrogen adsorption experiments. Shale pores are divided into small pores , medi⁃um -large pores and lamellation fractures based on T 2 spectrum characteristics of saturated shale. Then , through cal⁃收稿日期:2023-05-04 改回日期:2023-08-08基金项目:国家科技重大专项“大庆古龙页岩油勘探开发理论与关键技术研究”(2021ZZ10)。
风积砂非饱和水力参数研究英文
Th e U n s a tu ra te d Hyd ra u lic P a ram e te rs fo r A e o lia n S a n dCH EN G D o n g 2hu i 13,W ANG W e n 2ke 1,L IW e i 2,W AN G Hu i11.C o l lege o f E nvir o nm en tal Sc i en ce a nd En gi n ee ri n g,C h anga n Un i ve rs ity,Xi πan 710054;2.Q i ngh ai Hydro geo l og y E ng i nee ri ng of Geo l o gy Su rvey I ns titu t e ,Xi n i ng 810008Ab s t ra ct The w ater cha racte ris ti c cu rve fo r aeo li an san d in t wo p r o ces se s o f we tting and d ryi ng wa s o btained b y the n ega ti ve w ate r co lum n techn i que.The va l ue s o f fitti ng p a ram e t e rs w e re calcul a ted a cco rd i ng t o Van Genuch t e n fo r m u l a and the p aram ete rs t ha t cha racte ri zed the p ro s 2p eriti e s o f aeo li an san d such as the un sa t u ra t ed i nfi ltra ti o n co effi ci en t and s p ec i fi c wa t e r cap acit y we re ob tained.The re su lts showed tha t the wa 2ter cha racte ris ti c cu rve f o r a eo li an sand i n w etting p r o ces s had gre ate r hys tere s i s qua l ity than that i n d ryi ng p ro ce s s .The m ax i m um o f s p eci fi c wa ter capac i ty bet w een t wo p r o ces s es w as si m il a r,bu t t h e m axi m um o ccu rred a t d i ffe ren t sucti o n,a t 30cm H 2O in d rying and at 10cm H 2O i n we tti ng.The u ns atura ted i nfil trati o n coeffi cient o f d rying p r o ce ss wa s fa rm o re than tha t i n we tting p r o ce ss .W hen the s ucti o n w as a t 70cm H 2O ,the d i ffe rence o f the i nfi ltra ti on coeffi c i en t be t ween t h e dry i ng p r o ces s and we tti ng p r o ce ss w a s up t o fou r o rd ers o f m ag nitude.Key w o rds Nega ti ve wa ter co l um n t e ch ni q ue;So il 2wafer cha racteristic cu rve;We tti n g and d ryi ng;U ns atura ted infiltrat i o n co effi ci e nt;Sp eci fi c wa ter cap ac i ty;Aeo li an sandR e ce i ve d:Decem be r 31,2009 Accep t e d:M a rch 23,2010Suppo rted by Key P r o j ect o f Sci en ce a nd Techno l og y R es ea rch o f M y f (3);S I T f M y f (I R T );G S y 2j f G S y (333)32@ So il 2wa te r C ha ra c te ristic Cu rve (SW CC )tha t show s the re la ti onshi p be t we en soil m a tri x pote nti a l a nd so il wa te r con 2t e nt,is a l so known a s So i l 2wa te r Re t e nti on Cu rve o r So il 2m ois t u re C urve,re fl e c ti ng the re l a ti onshi p be t w e e n wa te r con 2t e nt i n a ce rta i n ki nd of soil and po t e nti a l .It is a powe rful too l fo r studyi ng the re ten ti on and tran spo rt of so ilwa te r i n un sa t u 2ra te d zone ,a nd the c ha nge a cti on of shea r stre ss a nd vo l 2um e.It is ge ne ra l ly re cogni ze d t ha t SW CC i s re l a te t o so il m i ne ra l compo siti on,po re structu re ,m e cha nica l p r ope rti e s of so il pa rtic l e ,li qui d p r ope rti e s and po re a ir .It is no t ye t t o e duce t h is re la ti onshi p a ccordi ng t o the ba si c p r ope rti e s of so il from theore tica l a na l ysis,on l y ca n be m ea sure d by te s tm e t h 2od .F r om m ea su red SW CC ,a se ri e s of i m po rtan t pa ram e t e rs on un sa tu ra te d sta te ,such a s so il po ros it y,dry cap ac ity,spe c i fi c w a te r ca pac ity,equi va l e nt di am e te r and unsa t u ra te d pe r m e a bilit y coe ff i c i e nt,ca n be obta i ne d by using the re l a ti o n 2sh i p be t w e e n soilwa t e r and othe r unsa tura t e d so ilc ha ra c t e ris 2ti c pa ram e te rs .The aeo li a n sa nd i n M u U s De se rt wa s use d a s m a te ri a l ,a nd the wa te r cha ra c te ristic c urve of a eo li a n sa nd wa s ob 2t a i ned by Nega ti ve W a te r Co l u m n Tec hni que.Ma i n pa ram e te rs we re fitted by cha ra cte ri za ti o n Van Genuc ht e n em piri ca l form u 2l a,a nd t he se pa ram e te rs we re used t o ca l cul a t e i m po rta nt pa 2ram e te rs of a eoli a n sa nd o n unsa tura te d sta t e ,suc h a s unsa tu 2ra ted pe r m e abilit y coe ffi c i en t a nd sp ec i fi c wa te r capa city .D e te r m in a tio n o f W a te r C h a ra c te ris ticC u rveNe ga ti ve W a t e r Colu m n Tec hn i que is a comm on m e t ho d fo r l a bo ra tory study of SW CC.Typ i c a l nega ti ve wa t e r co l u m n appa ra tus is show n i n F i g .1.F i g.1 B uchne r fu nne l app ara tus w ith ce ram ic d i s k fo r o bta i 2ning wa t e r chara cteristi c cu rveD e te rm ina tion m e th od fo r w e tti n g c urve a nd drying cu rveThe a eo li a n sa nd i n Mu Us D e se rt wa s c ho se n a s re 2sea rch objec t i n the study .The di am e te r of u se d B uchne r fun 2ne l is 6cm ,a nd t he a ve ra ge po re di am e t e r of ce ram i c d isk is 4-7μm.The a que duc t is tra nsp a re nt p l a s ti c p i pe ,a nd the sam p l e so il is a eo li a n sa nd .The te sti ng s t e ps of d ryi ng curve a re a s f o ll ow s:grit funne l wa s i m m e rse d i n a ir 2fre e wa t e r fo r 24h t o sa tura t e sufficien tl y;aqueduc twa s j o i ne d t o grit funne l a nd g l a ss tube ,the a ir in funne l a nd duc t we re e xha uste d,g l a ss tube w a s fi xe d a nd kep t e rec t with butt e rfl y tube duri ng j oini ng,B uchne r funne l wa s a l so fi xe d;sand samp le w a s l oade d i n t o funne l ,the l oa ding sa nd qua ntit y wa s accounte d a cco rding t o the used co ntr o l bul k den sity and fixe d vo l u m e,a nd comp ac te d the sa nd ac co rd i ng t o t he l oa di ng he i ght de 2c i de d by the l oa di ng volu m e;Duri ng l o ading,hem os ta tic fo r 2q ,2f f ;f f ,f q ,f ,j f ,Ag ri cu lt u ra l Science &Techno l o gy,2010,11(2):1-3C op yri gh t κ2010,I n f o r m a ti on Ins titute of HAAS.A l l right s re s erved.A gricultura lB a s ic Sc ience a nd M e thodi nis tr o Educa ti o n 08021C h ang J iang cho l a rs nno va ti o n e am o i n i s tr o Ed uca ti o n 0811eo l o g i ca l u rve P ro e ct o C h i na eo l o g i cal urve 1212010102.C o rre spo n di n g au tho r .E m ail :chdh b sh c eps w a s u sed t o c l i p a ueduc t avo i di ng a ire nte ring the w a te r c ham be r o unne l A te r the l oa di ng o sa nd samp l e the i niti a l v o l um e o l i u i d i n g l a ss tube w a s note d t he n l oo se ne d hemo sta ti c o rcep s ad uste d the he igh t o gl a ss tube a ndsl ow l y i nl e t wa te r from t he bott om of po rous p l a te ,sa t u ra te d so il samp l e a nd plac ed f o r 12h,the vo l u m e of wa t e r outfl ow wa s no ted;holed pla stic fil m w a s use d to o cc l ude the o ri fi ce s of funne l a nd gla ss tube ,re duc i ng wa te r e vapora ti on a nd ke ep i ng the con stan t pre ssure in grit funne l ;droppe r wa s l ow 2e red 1-2cm t o l e t li qui d i n so il sam p l e exha usti ng fre e l y a nd re ac hi ng e quili bri um ,a nd the dista nce from li qui d surfa ce in dropp e r to so il ce nte r wa s m ea su re d with g ra dua te d sc a l e ,the vo l u m e of disc ha rge d l iquid w a s a lso no ted w ith sca l e.W hen de te r m i n i ng w e tti ng curve ,the po siti on of dropp e r wa s a dj u sted grada ti m to re duc e suc ti on,nam e l y the suc ti o n i n the de te r m i na ti on of we tti ng curve w a s adjuste d fr om bi g t o s m a ll .O t he r app roa che s a re t he sam e a s t he de te rm ina ti on of drying cu rve.Re s ults of w e tting c u rve an d d ry i n g c u rvesThe w e tti ng c urve a nd drying cu rve ob ta i ned from e x p e ri 2m e nt a re shown i n F i g .2.It c an be se e n from F i g.2tha t the re la ti onshi p be t wee n so ilwa te r m a tri x po t e nti a l a nd wa te r con 2t e nt is no t si ngl e 2va l ue.W he n wa te r con t e nts a re sam e ,the m a tri x po ten ti a l i n we tting a nd drying pro ce ss a re d i ffe re nt,a nd t h i s hyste re sis phenom eno n is e spec ia ll y o bvi ous i n a eo li 2a n sa nd m e diu m.I n a dditi on,the m a xi m um suc ti on of a eo li a n sa nd w a s 85cm H 2O ,l e ss tha n 10kP a ,du ri ng d ryi ng a nd we tting p roce ss.F ig.2 The relati o ns hi p b et we en the s ucti o n a nd wa t e r co nten ti n Aeo li an s andU n s a tu ra te d P rop e rty o f A e o lia n S a n dW a te r ch a ra c te ris tic cu rve m ode l o f ae o lia n s an dI n orde r t o buil d the re l a ti onshi p be t w ee n so il m a tr i x po 2t e nti a l a nd wa te r conte nt,fo re ign sc ho l a rs have propose d a se rie s o f emp iri c a l fo r m u l a s,a nd som e rep re se nta ti ve emp iri 2ca l fo r m ula s a re a s foll ow i ng:ψm (θ)=a e xp (-b θ)(e x pone ntia l ty p e)[1](1)ψm (θ)=a (θ-b )(powe r func ti o n ty p e)[1](2)ψm (θ)=a (θs -θ)b θc(V isse r fo r m ul a )[2](3)ψme ψm λ=(θ-θr )(θs -θr )(B r ooks fo r m ul a )[3](4)(θ-θr )(θs -θr )=1[1+(αψm )n ]m m =1-1n (Va n f o rm ul a )[4](5)In the form ul a s:ψm is the so il m a tri x po te ntia l ;θis the so il wa te r conte nt ;θr is the sa tura te d w a te r con ten t ;θs is the re 2;α,x y f y f x f V f ,2pro vem ent tha n fo r m ul a (1)and (2).B rooks fo r m ul a a ndVa n for m ul a use d bo th re si dua l wa te r conte nt a nd sa t u ra te d wa t e r con tent to e xp re ss the re l a ti onshi p be t we en w a te r co n 2ten t and suc ti on .Espe c i a ll y i n Va n f o r m ul a tha t adds pa ram e 2te r αwhi c h cha rac te rize s a ir en try va l ue a nd pa ram e te r m a nd n which cha ra c t e ri ze curve shape ,e xte ndi ng the app li ca ti on ra nge of fo r m ul a a nd m aking the e xp re ss i o n of suc ti o n a nd wa t e r conte nt c l ose r to the ac tua l situa ti on .Va n Genuchte n fo r m ul a wa s adop ted t o fit m e a su re d da ta a nd obta i n em p i rica l pa ram e te rs in fo r m u l a.Afte r i nve rs i o n of l e a st squa re m e tho d,the obta i ne d pa ram e te rs a re shown i n Table 1,a nd the m ea su red da ta a nd fitti ng re su lts a re shown i n F i g .3.Tab le 1 The va l ue s o f pa ram e ter fit acco rd i ng t o Van Gen uchten fo r 2m u l aC u rve typ e s θscm 3/cm 3θrcm 3/cm 3α1/cm n D ryi ng 7.8640.000.028143 4.0419We tti ng8.0041.040.0823973.6195F i g.3 The wa t e r cha racterist i c cu rve fo r Aeo l ian s and (byVan Genuch t e n f o rm ul a ) It ca n be see n from inve rsi on pa ram e t e rs tha t αa nd n a rem a i n p a ram e te rs whi ch diffe re ntia te d ryi ng p r o ce ss a nd we t 2ting p roc e ss in the a eo li a n sa nd cha rac te risti c c urve of Va n fo r m u l a.Sp e c if i c w a te r c ap a c itySp ec i fic wa te r cap ac ity exp re sse s the wa t e r co nten t c ha nge bego t by unit m a trix po te nti a l .S pe cifi c w a te r c apa city tha t changed w ith wa te r con tent o r m a tri x pote nti a l is a n i m 2po rtan t pa ram e te r for a na l yzing the tra nspo rt of so il w a te r .Sp ec i f i c wa t e r ca pac ity is ge ne ra ll y exp re s se d by fo l l ow i ng fo r m u l a:C (θ)=5θ5ψm (θ)(6)Com bi ne d w ith Va n fo r m ula ,spe c i fic wa te r ca pac ity u se dm a tri x po t e nti a l a s va ri a bl e c an be obta i ne d .C (ψm )=-αm n (θs -θr )(αψm )n -1[1+(αψm )n ]m +1(7)Consequen tl y,t he sp ec i f i c wa te r c apa c i ty curve o f aeo li 2a n sa nd ca n be obta ine d ac co rd i ng t o w a te r c ha ra cte risti c c urve.The obta i ne d spe cifi c wa te r ca pac ity curve a cco rding t o fo r m u l a (7)a nd suc ti o n va l ue w a s shown i n Fig .4.It is sugge ste d t ha t in F i g .4t ha t duri ng the dryi ng p roce s s f ,x f y f 5O 3O;,x f y f 5O O 2Ag ri cultura l Sc i ence &Tech no l o gy Vo l .11,No.2,2010si dua lwa te r co ntent m and n a re the emp iri ca l co nsta nts.E pone ntia l t pe and powe r unc ti on t pe o r m u l a s ca n we ll e p re ss t he so il m ed i a o l a rge r sucti o n .And isse r o r m ula i ntr o duce d the sa tura ted wa te r conte nt so it ha s gre a te r i m o aeo li a n sa nd the m a i m um spec i ic wa t e r cap ac it o 7cm H 2appe a rs whe n suc ti on is 0cm H 2du ri ng we tti ng p r o ce ss the m a i m um sp ec i ic wa te r c apa cit o a bout 0cm H 2appe a rs whe n suc ti o n is 10cm H 2.F ig.4 Spec i fic wa ter capa ci ty i n we tting p roce s s and dry i ngp r o ces sU ns a tura ted p e rm e ab ility co eff i c ien tUnsa tura ted pe r m ea bility coe ffi c ient is func ti on of wa te r conte nt a nd m a tri x pote nti a l .The un sa tu ra te d p e r m e a bil ity co 2e ffi c ient t ook w a te r conte nt a s va riab l e is:K(θ)=K s S 121-1-S 1mm 2(8)or t ook m a tri x po t e nti a l a s indepe nde nt va ri a bl e ,e xp re ss i ng a s:K (ψm )=K s {1-(αψm )n -1[1+(αψm )n ]-m }2[1+(αψm)n]m 2(9)I n t he fo r m ul a s:K s is the sa tura ted pe r m ea bil ity coe ffi c i e nt .The l abo ra t o ry m e a surem en t va l ue of aeo l ian sand is 2.47m /d .Acco rdi ng t o fo r m u l a (9)and Ta bl e 1,the unsa t u ra te d pe r m e a bilit y coe ff i c i e nts in drying p roce s s a nd we tting p roce s s of a eo li a n sand can be o bta i ne d (F i g .5).It ca n be se e n from F i g .5tha t when m a tri x po te ntia l i s a bove 10cm H 2O ,t he un 2sa t u ra te d pe r m ea bility coe ffic i en t i n dryi ng pro ce ss is m uc h l a rge r t ha n we tting proc e ss;whe n the suc ti on i s 70cm H 2O ,the di ffe rence of p e r m e a bil ity coe ffi c i e nt rea che s m a xi m um ,nea rl y 4o rde rs o f m a gni tude.C o n c lu s io nB ec ause t he suc ti ons of a eo li a n sa nd i n dryi ng a nd we t 2ti ng p roce s s a re le ss t ha n 10kPa ,so the w a t e r c ha rac te risti c cu rve s of a eoli a n sand in drying and we tti ng p roce ss c an be conve ni e ntl y m e a sure d with ne ga ti ve wa te r co l um n te chn i que.Afte r e va l ua t e d t he fitti ng pa ram e te r va lue w it h Van Ge nucht 2e n fo r m ul a wh i ch e xp re sse d wa te r c ha ra cte risti c cu rve ,thepa ram e te rs w hi ch cha ra c te ri ze d un sa t u ra te d p r ope rty,such a s unsa tura ted pe r m ea bility co effi c i e nt a nd spe cifi c wa te r c a 2pac ity,ca n be ob t a ine d .It is sugge s t e d fr om re se a rch re sults tha t the wa te r cha ra c t e ri s ti c curve of a eo li a n sa nd i n we tti ng p r o ce ss ha s mo re hyste re sis na ture than dryi ng proc e ss;the d i ffe re nce of m a xi m u m spe c i fic wa te r c apa c i ty is littl e ,but the m a xi m um va l ue in dryi ng proce ss appe a rs when sucti on is 30cm H 2O w hil e it i n we tting p roce s s appe a rs the suc ti on is 10cm H 2O ;the un sa t u ra te d p e r m e a bil ity coe ffi c i e nt i n dryi ng p r o ce ss is m uch l a rge r t ha n w e tti ng p r oc e ss,a nd w he n the suc ti o n is 70cm H 2O ,the di ffe rence of pe r m ea bility coe ffic i en t re a che s m axi m u m ,ne a rl y 4orde rs of magnitude.F i g.5 U n satu rated p erm eab i lit y coe ffici en t i n we tti n g p r o ces sa nd dry i ng p r o ces sR e fe re n c e s[1]BRUCE RR ,LUX MO RE RJ.W ate r re t en ti o n:fi e l d m e t hod [M ]//M ethod s o f so i l ana l ys i s .Part 1.Phys i cal and m i ne r a l og i ca l m e t h 2o ds .2n de d .M adison ,W I :ASA and SSSA,1986:679.[2]V I SSER WC.P r o ges s i n t he know l edge abou t t he e ffect of s o i lmo is t u re con t e nt o n p l an t p rod ucti o n [C ].W ageni ng en,the Ne t h 2erl and s:I ns tit u t e f o r Land and W aterM anagem en t R es earch,1966.[3]BROO KS RH,COR EY AT .hydrau l ic p rope rties o f po r o u s m ed i a[C ].Fo rt Co ll ins:Co l o rado State U ni ve rs i ty,Hyd r o l ogy Pape rNo.3,1964.[4]VAN GENUC HTEN MTH.A cl o sed f o r m equati o n fo r Pred i cti ng thehydrau l i c co nducti vit y o f uns atura t ed so i l [J ].So il Sci Soc Am J ,1980,44(5):892.R es p o n s i b le ed ito r:ZHANG C a i 2li R es p on s ib le t ran s la to r:WANG C h e n g 2b in R e s p o n s ib l e p ro o frea d e r:WU Xiao 2y an风积砂非饱和水力参数研究程东会13,王文科1,李威2,王会1 (1.长安大学环境科学与工程学院,陕西西安710054;2.青海省水文地质工程地质环境地质调查院,青海西宁810008)摘要 利用负水柱方法测定了风积砂脱湿和吸湿2个过程的水分特征曲线,用Van Genuchten 公式求出拟合参数值,得到非饱和渗透系数、比水容量等表征风积砂非饱和性质的参数。
光化学污染对城市大气的影响(英文)

Effects of photo-chemical smog on urban airAbstract:Summary: along with the sustained and rapid development of China's economy, fuel consumption is increasing. Atmospheric carbon monoxide, nitrogen oxides and the emissions of pollutants such as hydrocarbons are also growing rapidly, these are raw material for formation of photochemical smog. Photochemical smog, once formed, affected a wide range. Its dangers have been on the urban environment, human health, and ecological balance causing great threat. Carry out energy-saving emission reduction policies, it is imperative to control emissions of air pollutants. This article is about the production of photochemical smog, and briefly describes the hazards and prevention measures.I. The production of photochemical smogOf atmospheric nitrogen oxides and hydrocarbons react to form photochemical smog, UV irradiation. The atmosphereNitrogen oxides are mainly from fossil fuel combustion and incineration of the plant, and the transformation of agricultural soils and animal waste. Among them, with automobile exhaust gas as the main source. [1]Formation of photochemical smog:1. The condition of pollutionIndustrial emissions, vehicle exhaust emissions such as nitrogen oxides and hydrocarbons.2. Meteorological conditions2.1 strong lightNO2 photolysis is a 290~420nm ' light, therefore, likely to in summer than in winter, around noon in the day light most likely to smoke.2.2 low winds, low humidity, weather temperature inversion.3. Geographical conditionsSolar radiation is one of the main conditions, intensity of solar radiation, depending on the height of the Sun, solar radiation angle with the ground and atmospheric transparency. Therefore, the concentration of photochemical smog, except under the influence of the diurnal variation of solar radiation, but also by the latitude, altitude, season, weather and other conditions influence. Studies have shown that at 60 ~ North latitude 60 between some major cities, smog can occur. [2] II.Second, the harm of photochemical smogPhotochemical smog is strongly oxidizing, stimulate the eyes and the respiratory tract Mucosa, injuries, accelerated ageing of rubber plant leaves, and reduced visibility. Harmful to human, animal and plant and materials is mainly ozone, PAN and secondary pollutants such as Acrolein and formaldehyde. Ozone, PAN can cause rubber products such as ageing, embrittlement, makes dyes fade, and damage to paint and coatings, textile fibers and plastic products. [3]Harmful effects is mainly manifested in the following aspects:1. The risk to human and animal health:Major injury to human and animal eyes and mucous membrane irritation, headache, respiratory disorders, abnormal lung function deterioration of chronic respiratory diseases, children and so on.Ozone is a powerful oxidizing agent. In 0.1ppm concentrations, it has a special smell. And can achieve deep stimulation under the mucosa of the respiratory system, causing chemical changes, it acts as a radiation, chromosomal abnormalities, red blood cell aging. PAN, formaldehyde, Carolina and other products for people and animals such as eye, throat and nose have a stimulating effect. Their domain is0.1ppm. Photochemical smog in addition can help asthma patients asthma attack, it can cause deterioration of chronic respiratory diseases, respiratory disorders, damagethe lungs and other symptoms of long-term inhalation of antioxidants can reduce the human cell's metabolism accelerate aging. PAN was reagents may cause skin cancer. In the 1943 United States Los Angeles the first event has attracted more than 400 people dead.2. Effects of plant growth:Ozone affect the permeability of plant cells. High performance can lead to good qualities disappear, even the loss of plant genetic ability. Ozone damage to plants, skin fade at the beginning was wax-like pigment changes over time reddish-brown spots appear on the leaves. Back of PAN leaves silver gray or bronze effect plant growth and reduce the plant's resistance to pests and diseases.3. Material quality:Contributes to formation of acid rain caused by photochemical smog rubber ageing, embrittlement, makes dyes fade paint buildings and machinery from corrosion and damage coatings, textile fibers and plastic products.4. Reduce the visibility:Photochemical smog is one of the most important characteristics of atmospheric visibility--visual range is shortened. This is mainly due to the formation of photochemical smog pollution in the atmosphere caused by aerosol. The aerosol particle size within the General 0.3~1.0 μ m. Due to the size of particles is not easy because gravity deposition can actually migrate long distances suspended in the air for a long time they are consistent with Visual wavelength and scatter sunlight, thus significantly reducing the atmospheric visibility. Thus impaired the car with the safe operation of aircraft, and other transport, leading to increased traffic accidents.5. Other hazards:Photochemical smog will accelerate the aging of rubber products and cracking, corrosion of buildings and clothing and shorten its life. [4]III.The mechanism of photochemical air pollution treatmentFirst of all, to understand the cause of photochemical smogMechanism of formation of photochemical smog: [5](1) The formation of photochemical smog conditions is the presence of nitrogen oxides and carbon dioxide in the atmosphere, atmospheric temperature is low, and there is strong sunlight, this will be a complex series of reactions in the atmosphere, generating some secondary pollutants, such as aldehydes, PAN, H2O2 and O3.Photochemical smog is a chain reaction, in which the key reactions can be simply divided into 3 groups: (1) formation of NO2 photolysis of O3: Chain initiation reaction of NO2 photolysis, reaction is as follows:NO2 +HV→NO +O O +O2 +M→O3 +M NO +O3→NO2 +O2(2) Hydrocarbons (HC) oxidation activity of free radicals, such as HO, HO2, RO2. In photochemical reactions, free radical reaction plays an important role, the free radical reaction is mainly caused by NO2 and resulting from formaldehyde photolysis:NO2 + HV→NO +O RCHO + HV→RCO +HThe presence of hydrocarbons is the root cause of transformation and proliferation of free radicals:RH +O→R +HO RH + HO→R +H2O H + O2 →HO2 R + O2→RO2 RCO+O2→[RC(O)O2]Where: r-n;RO2-alkyl peroxide; RCO-acyl;[RC ((O) O2]-benzoyl peroxide.(3) Through the above channels generated HO2, RO2, [RC ((O) O2] oxidation of NO to NO2.NO +HO2 →NO2 +HO NO +RO2→NO2 +RO RO +O2 →HO2 +RCHO NO + RC(O)O2→NO2 + RC(O)O RC(O)O→R +CO2Where: RO-alkoxy;RCHO-aldehyde①main pollutants of photochemical pollution from internal combustion engineCar ownership in the world has more than 500 million vehicles, vehicle output of more than 50 million vehicles a year. In the advanced industrialized countries, car exhausts constitute the main cause of air pollution. China's rapid growth in recent years, car production, without effective ways to control vehicle exhaust emissions on atmospheric formation of great harm. NOx is the formation of photochemical smog and acid rain pollutants in the atmosphere.Vehicle exhaust is a great mobile pollution sources, management is difficult. Currently recommended is using the method of exhaust gas purification system, it is the use of catalysts reduce exhaust gas phase activation energy in the process, improve the reaction speed. Especially for NOx control. Even though the installation of electronic-controlled air compensation device, also appears cold starts, fill valve not working, slow, prolonged idling, resulting in excessive emissions [6] in response to this situation, many scholars with an atmospheric pressure non-equilibrium plasma method to eliminate pollutants in automobile exhaust NOx. Atmospheric pressure non-equilibrium plasma is fast developing interdisciplinary disciplines, it has great potential and attractive prospects. [7] Japan set Fang Zhengyi, Xiao Tian Zhezhi, Shui Yezhang have been engaged in research on non-equilibrium plasma discharge pollutants, and certain progress has been made. East and tengjingkuanyi reported by discharge plasma beam control automobile exhaust, Ox removal rate of up to 29.2%.[8]Therefore, I think that the governance of photochemical smog pollution in the atmosphere, first of all, it is necessary to control Pollutants in automobile exhaust.Internal combustion engine exhaust contains a number of components, the basic ingredients are carbon dioxide (C02), water vapor (H20), excess oxygen (02) andkeep left nitrogen (N2), which is the result after the complete combustion of the fuel and air. In addition to these basic ingredients, exhaust also contains incomplete combustion products and combustion reaction intermediates include carbon monoxide (CO), hydrocarbons (HQ), Secretary of nitrogen oxides (Ox), Sulphur dioxide (S02), solid particles and aldehydes. Total quality of these components in the exhaust gas of diesel engine as a proportion of the not less than 1% of the total emissions in a diesel engine, sometimes up to about 5% in a gasoline engine, and most of them are harmful, or has a strong pungent odor, and some still have carcinogenic effects. Exhaust of harmful components, see table 2-1:Table 2-1: all kinds of harmful exhaust componentsInternal combustion engine emission pollutants nitrogen oxides (n Ox), carbon monoxide (CO), hydrocarbons (HC) air pollution is mainly caused by substances, these pollutants on human and environmental hazards are as follows [9]1. A nitric oxide (n Ox)Nitrogen oxides in the combustion chamber under high temperature and high pressure, nitrogen and oxygen. Nitrogen oxides in the exhaust (n Ox) includes NO, N02, N203, N20, N205, and N03 and so on. After combustion, the fuel discharged from the exhaust pipes of the nitrogen oxides in about 90%-95% NO, few N02, NO is a colorless gas that is highly unlikely after the encounter with the oxygen in the atmosphere will be further oxidized to N02. N02 Brown has a strong pungent odor, n Ox react in the atmosphere to form aerosols, oxygen phthalocyanine based nitric acid, nitric acid, nitrous acid, Nitro hydrocarbons as well as highly carcinogenic nitrosamines, directly harm to humans, animals and plants, and the environment. N Ox is the main cause of photochemical smog formation in the ground.2. Carbon monoxide (CO)Carbon monoxide is a product of incomplete combustion of fuel, seriously affecting the combination of hemoglobin in human blood and oxygen, life-threatening, and participate in various chemical reactions in the atmosphere, has an important role in the formation of smoke and methane.3. Hydrocarbon (HC)Hydrocarbons, including unburned hydrocarbons and incomplete combustion of fuel, lubricating oil and its pyrolysis and partial oxidation products, such as alkanes, alkenes, aromatics, aldehydes, ketones, and hundreds of compounds. Some hydrocarbons do not react, such as methane, ethane, propane, carbon and hydrogen and other reaction (NRHC) and so on. The percentage of non-methane hydrocarbons (total hydrocarbon 100%, minus the percentage of methane is non-methane hydrocarbon ratio), the smaller the better. HC contains benzene is considered to be a carcinogen if inhalation of gaseous benzene would reduce the red and white blood cells, reducing the number of platelets, in people exposed to large amounts of benzene can cause leukemia. Of these pollutants, HC, CO and n-Ox is a major exhaust pollutants. CO and HC can improve the structure of internal combustion engine for combustion and EGR and after treatment technology is effectively controlled,advanced countries have reached discharge standards. N Ox oxidation of N2 in the temperature in the cylinder is formed only by machine processing, cumbersome and difficult to governance, become the main object of study.Second common method of controlling internal combustion engine exhaust gasIn general reduce harmful ingredients in the exhaust gas of internal combustion engines, can be solved by two ways: one is the internal purification, the other is discharging to the exhaust pipe of the cylinder exhaust gas after treatment.1. The internal purificationInternal purification consists of the following measures:⑴improved combustion chamber design, compression ratio and spray nozzles, spray to improve the efficiency of combustion.B suction system air intake preheating temperature.C ignition system delayed ignition, after shortening the flame burning time.⑷firing system using lean combustion and high energy ignition.⑸using exhaust gas recirculation system to reduce n Ox.Services implementing secondary air combustion technology of exhaust pipes.2. Treatment after purificationInternal combustion engine exhaust gas purification technology is of NO x, HC, CO gas phase emission purification, usually using oxidation and reduction methods, with the help of catalysts to convert these harmful gases into N2, H20, CO2, this purification technology has been applied to gasoline engines. In addition to the gas in a diesel engine harmful ingredients, there are made up of solid-phase soluble hydrocarbons and soot particles, these substances are not in real time in the exhaust system catalyst for purifying, suitable particulate filter must be placed in the exhaust tube collection device, when soot particles as the main body to collect micro-particles to a certain number of heaters can be used to burn.Post-processing method in internal combustion engine are described as follows: [10] ①the exhaust gas recirculation (EGR)EGR (Exhaust Gas Recirculation EGR for short) is a fraction of the combustion emissions from exhaust pipes to introduce pipe mixed with fresh air, then burn. Exhaust gas recirculation through the following three aspects lower engine combustion temperatures, decrease the formation of n-Ox:A. improving the heat capacity of the heat capacity of the gas because the CO2 is 1.5 times of the O2, more of the mixture of exhaust gas heat capacity is higher.B. reduced O2 concentration in the mixture as part of the air are replaced by exhaust gas, mixture of O2 content was reduced accordingly.C. low combustion rate above two effects that reduce engine combustion speed, increase the heat of combustion chamber, reducing the maximum burning temperature.Ternary Catalysis II [11] such an approach can also purify the three main pollutants in the exhaust of gasoline engine C0, HC and n Ox. Three-way catalytic converter, is mounted in the exhaust system is the most important machine cleaning device, it can exhaust emission of CO, HC and n Ox and other harmful gases by oxidation and reduction into harmless carbon dioxide, water and nitrogen. Dang high temperature of car exhaust through purification device Shi, ternary catalytic device in the of purification agent will enhanced CO, and HC and n Ox three species gas of activity, prompted its for must of oxidation-restore chemical reactions, which CO in high temperature Xia oxidation became colorless, and nontoxic of carbon dioxide gas; HC compounds in high temperature Xia oxidation into water (H20) and carbon dioxide; n Ox restore into nitrogen and oxygen. Three types of harmful gases into harmless gas, purification of vehicle exhaust gas.IV. ConclusionThe World Health Organization (WHO) and the United States, and Japan and many other countries have ozone and photochemical oxidant levels serve as one of the air quality index, and photochemical smog warning was issued. Environmental protection has become an important subject in sustainable economic development, harm has drawn great attention of photochemical smog. While the world's growing environmental awareness, resistance to photochemical air pollution, prevent the occurrence of photochemical smog, is conducting a worldwide reduction of energy and automobile exhaust pollution cleaning revolution.Urban air pollution is closely linked to levels of economic development, and that China is in a period of rapid development, urban air pollution has become a major environmental problem. In order to prevent outbreaks of photochemical smog, in addition to the above methods, the means of interference of executive order must also be taken in order to have better results.V、Reference[1] Kang Xihui, Liu Meiqing, principles and applications of photochemistry, Tianjin: Tianjin University Press, 1984,1~21[2] Zhang Li; Analysis on photochemical smog pollution, Shandong: 1001-3644 (2005)04-0074-03[3] the voyage, Shao kesheng, Tang Xiaoyan, Li Chin; urban photochemical smog pollution in China [j]; Journal of Peking University (natural science Edition), 1998, Z1[4] The State environmental protection administration. Ozone layer damage [DB/OL]./ztbd/gjcyr/jbcs/200408/t20040830_60877.htm, 2004-08-30[5] The concise course of Biochemistry in early Xia Jian, Beijing: higher education press, 1992,56~601[6] Wan Junhua Xia Y unqing combustion theory based Harbin ship Engineering Academy Publishing House, 1992[7] Guo Guangyong. Experimental study on dielectric barrier discharge treatment of internal combustion engine exhaust gas NOx [d]. Dalian Maritime University, 2002.[8] Li Meng. Japan is how to control air pollution [j]. Legal persons, 2014 (4): 27-30.[9] zhoulongbaoliuchangjungaozongying internal combustion engine mechanical industry publishing house, 1999.[10] Guo Guangyong. Experimental study on dielectric barrier discharge treatment of internal combustion engine exhaust gas NOx [d]. Dalian Maritime University, 2002.[11] The Chen Chong. Catalytic converter structure and performance evaluation [j]. Journal of Sichuan industrial Institute, 2001, 20 (4): 1-3.。
反相毛细管电色谱硅胶整体柱的制备及其应用

反相毛细管电色谱硅胶整体柱的制备及其应用笪振良,丁国生*,袁瑞娟,李侃(天津大学药物科学与技术学院,天津 300072)摘要 采用改进的溶胶-凝胶技术制备了具有高机械强度和化学稳定性的毛细管硅胶整体柱。
详细考察了反应物配比对所制备整体柱结构和性能的影响,并在此基础上对制备条件进行了优化。
将所制备整体柱用正辛基硅烷修饰后得到反相整体柱,详细考察了流动相pH值、有机改性剂含量对电渗流的影响。
采用短端进样方式在优化实验条件下实现了中性化合物的快速分离,对硫脲获得了高达180,000 N/m的柱效。
使用所制备整体柱,在电色谱模式下对穿心莲片中的有效成份脱水穿心莲内酯进行了分离,并获得了高达80,000 N/m的柱效。
关键词 硅胶整体柱,反相毛细管电色谱,制备 ,脱水穿心莲内酯1引言毛细管电色谱(Capillary electrochromatography , CEC)是近年发展起来的一种以电渗流为驱动力的微分离分析技术。
它结合了微柱液相色谱(μ-HPLC)的高选择性和毛细管区带电泳(CZE)的高效性,具有高效、快速、微量的特点,成为目前微分离分析领域的研究热点之一。
CEC依固定相的存在方式可被分为三类:开管柱、填充柱和整体柱。
CEC开管柱虽可获得很高的柱效,但它也有相比较低、柱容量较小及检测灵敏度低的缺点。
而CEC填充柱因其制备过程复杂且易产生气泡,也限制了其应用。
CEC整体柱的制备由于采用了原位聚合技术,克服了以上缺点;同时,聚合单体的选择范围很广,可以在固定相中引入各种可能的作用基团,实现多种分离模式。
因此,它被誉为第四代分离介质而受到色谱工作者的广泛关注[1~3]。
毛细管整体柱按基质材料可分为有机基质整体柱和无机基质整体柱。
有机聚合物整体柱易在有机溶剂中发生溶胀现象而改变其孔结构,进而影响其色谱性能;相比之下,硅胶基质整体柱的机械强度较高,耐溶剂性能和热稳定性能较好,同时在孔结构控制方面也有一定的优势。
自流式空气除尘系统管道中过饱和度分布特征

第52卷第12期2021年12月中南大学学报(自然科学版)Journal of Central South University (Science and Technology)V ol.52No.12Dec.2021自流式空气除尘系统管道中过饱和度分布特征代安稳,张军,尹杰,叶晓辉(东南大学能源与环境学院,江苏南京,210096)摘要:为了探究自流式空气除尘系统的过饱和度,为系统优化提供依据,首先,简化自流式空气除尘系统,构建物理和数学模型;其次,使用Fluent 用户自定义标量(UDS)对水汽相变传热传质模型进行计算,研究自然对流情况下管道直径、进口空气温度、壁面热水温度、进口空气湿度及热水加入位置等因素对管道中过饱和度分布的影响;最后,使用响应面分析法进行三因素三水平单响应试验设计,确定管道直径、热水温度及热水加入位置对过饱和度的影响程度。
研究结果表明:随着管道直径增加,平均过饱和度呈现出先升高后降低的趋势;平均过饱和度随着空气与热水温差增大而增大;进口空气相对湿度对过饱和度的影响较小;相较于热水的全覆盖,热水加入位置靠近管道出口更有利于提高管道的过饱和度;热水温度对过饱和度影响要远大于管道直径与热水加入位置的影响,管道直径与热水加入位置对过饱和度影响相近。
在优化系统工况参数时,可着重考虑热水温度的影响,而将管道直径及热水加入位置作为次要因素考虑。
关键词:PM 2.5;过饱和度;水汽相变;Fluent 中图分类号:TK16文献标志码:A开放科学(资源服务)标识码(OSID )文章编号:1672-7207(2021)12-4252-10Distribution characteristics of supersaturation in pipeline ofgravity air dust removal systemDAI Anwen,ZHANG Jun,YIN Jie,YE Xiaohui(School of Energy and Environment,Southeast University,Nanjing 210096,China)Abstract:The supersaturation level of gravity air dust removal system was explored to provide a basis for system optimization.Firstly,the gravity air dust removal system was simplified and physical and mathematical models were constructed.Secondly,Fluent user-defined scalar(UDS)was used to analyze water vapor phase.The variable heat and mass transfer models were calculated.The influence of factors such as pipe diameter,inlet air temperature,wall hot water temperature,inlet air humidity and hot water adding position on the distribution of supersaturation in the pipe during natural convection was studied.Finally,a three-factor three-level single-response test design was carried out using response surface analysis to determine the degree of influence of pipe收稿日期:2021−03−10;修回日期:2021−05−18基金项目(Foundation item):国家自然科学基金资助项目(51876038)(Project(51876038)supported by the National Natural ScienceFoundation of China)通信作者:张军,男,博士,教授,从事燃煤污染控制研究;E-mail :****************.cnDOI:10.11817/j.issn.1672-7207.2021.12.006引用格式:代安稳,张军,尹杰,等.自流式空气除尘系统管道中过饱和度分布特征[J].中南大学学报(自然科学版),2021,52(12):4252−4261.Citation:DAI Anwen,ZHANG Jun,YIN Jie,et al.Distribution characteristics of supersaturation in pipeline of gravity air dust removal system[J].Journal of Central South University(Science and Technology),2021,52(12):4252−4261.第12期代安稳,等:自流式空气除尘系统管道中过饱和度分布特征diameter,hot water temperature and hot water addition position on supersaturation.The results show that as the pipe diameter increases,the average supersaturation increases firstly and then decreases.The average supersaturation increases with the increase of the temperature difference between air and hot water.The relative humidity of the inlet air has little effect on the degree of pared with the full coverage of hot water,it is more beneficial to increase the supersaturation level of the pipeline when the hot water is added to the location close to the outlet of the pipeline.The hot water temperature has a much greater impact on the supersaturation than the diameter of the pipeline and the location of hot water.The diameter and the position where the hot water is added have the same effect on the supersaturation.When optimizing the system working condition parameters,the influence of hot water temperature can be emphatically considered and the pipe diameter and hot water adding position can be considered as secondary factors.Key words:PM2.5;supersaturation;vapor phase transition;FluentPM2.5是雾霾的重要成分,控制PM2.5仍是环境领域研究的热点[1−3]。
水蒸气湿流密度的英文表达

水蒸气湿流密度的英文表达Title: The Significance of Wet Steam Density in Thermodynamics and MeteorologyIn the intricate world of thermodynamics and meteorology, the concept of wet steam density plays a pivotal role. This essay aims to explore the definition of wet steam density, its relevance in various scientific fields, and its practical applications. Understanding the properties and behavior of wet steam is crucial for optimizing industrial processes and predicting atmospheric conditions.Wet steam, often encountered in steam turbines and boilers, is a mixture of saturated liquid water and saturated vapor at a common temperature. The wet steam density is a measure of how much mass of wet steam is contained in a given volume.In thermodynamics, wet steam density is a critical parameter in the design and operation of steam turbines and heat exchangers. Engineers use this information to calculate the efficiency of steam cycles, ensuring that energy is utilized optimally. Moreover, understanding wet steam density allows for the precise control of moisture content, which is essentialfor preventing corrosion and maintaining the integrity of machinery.In meteorology, the concept of wet steam density, albeit under different names like "air moisture content" or "humidity," is fundamental to understanding weather patterns and climate conditions. The density of air saturated with water vapor influences cloud formation, precipitation, and atmospheric stability. Meteorologists use this knowledge to predict weather changes and to model global climate systems.Wet steam density, while seemingly a niche concept, holds significant implications for both thermodynamics and meteorology. Its accurate measurement and understanding are indispensable for advancing industrial technologies and for enhancing our comprehension of the dynamic Earth's atmosphere. As we continue to explore the complexities of our natural world, the study of wet steam density remains a cornerstone in scientific research and practical application.。
气液界面Marangoni效应对传质系数的影响
消除传质过程中 N2 向液相的 经电恒温装置后在气液接触 由 使
与气相传质后流入溶剂回收罐
电恒温装置由电加热器和 PID 控制仪表组成 PID 控制仪表控制电加热器对气体和液体加热 其温度稳定于 (25 0.1) 气液相间的质量传递 传质状况 温
因为本文考察的重点是 气液相保持相同温度以消除 使测量数据真实地反映 减少传质介质与 各
气液相传热对传质的干扰
另外气液接触所在区域用空气浴维持恒 此外为了减少振动的影响
使其温度与气液相温度相同
环境之间的热交换 装置组成元件如泵 施
气液接触器等均采取了防震措 气液接触长度为 液体由上部
主视图 Front view 图2 侧视图 Side view 气液接触器结构图
气液接触器结构如图 2 所示 15c m 气体流道宽 14c m 进口进入 厚度
2
实
验
本文建立了一套气液接触传质设备 N2 与液体 逆流接触将液体中使表面张力降低的溶质解吸出 来 从而可能引发 Marangoni 对流 提高传质速率 实验流程如图 1 所示 纯 N2 由气瓶经水罐预饱和水 蒸气后 经电恒温装置由下部进入气液接触器 与 液膜逆向流动接触传质后放空 溶液先由 N2 预饱和 扩散 然后由泵输送 器内呈液膜下流 储罐中的异丙醇稀
(5)
传质过程中如果液相 Marangoni 效应发生
否则 F 等于 1 因此根
据实验结果计算 F 的值即可判断 Marangoni 效应是否发生以及 Marangoni 效应对传质速率的影响程度
4
实验结果与讨论
图 3 和 4 中绘出了不同气速下按式 (2) 计算的实验总的液相传质系数 KLexp 随液相进出口浓度差∆C 从图中可以看出 KLexp 值总体上随浓度差∆ C 的增大而增大 但在浓度差很小和很大时
英文文章
EFFECTS OF AIR-DRYING ON PHOSPHORUS SORPTION IN SHALLOW LAKE SEDIMENT, CHINAWen-Juan Xiao1, 2, Chun-Lei Song1, Xiu-Yun Cao1 and Yi-Yong Zhou1,*1 Institute of Hydrobiology, Chinese Academy of Sciences, No. 7 Donghu South Road, Wuhan, Hubei Province, China2 Graduate School of the Chinese Academy of Sciences, No. 19 Yuquan Road, Beijing, ChinaABSTRACTAir-drying has significant influences on phosphorus sorption behaviors in soils. It is urgently necessary to expend the relevant knowledge to sediments of lakes, especially large eutrophic ones. Sediments were collected at different sites in a Chinese large shallow eutrophic lake (Lake Chaohu) and an urban shallow lake (Lake Donghu) in November 2007; contents of organic matter (OM) were measured. Phosphorus sorption behavior fitted Langmuir equation well. Compared to the field-moist sample, the air-dried sediments had significantly lower sorption energy (K). Additionally, there was a significant positive relation-ship between the OM content and K value in the field-moist sediments. The changes in geochemical characteris-tics of iron oxide and organic carbon may be mainly re-sponsible for the decreasing K value in air-dried sediment. Furthermore, in the incubation experiments, the air-dried sediments generally gave higher concentrations of soluble reactive phosphorus coupled with alkaline phosphatase activity, which was mainly due to the decreased phospho-rus sorption energy, because there was no significant differences of pH values and dissolved oxygen concentra-tions between the air-dried and field-moist sediments. Finally, in contrast with the field-moist samples, the air-dried ones showed a significantly positive relationship between OM content and EPC0 value, suggesting that the breakdown of OM during drying may be a major source of P upon reflooding.KEYWORDS: Air-drying, lake sediment, phosphorus sorption, organic matter, alkaline phosphatase activity, equilibrium phos-phorus concentration1. INTRODUCTIONPhosphorus (P) plays a major role in eutrophication of aquatic systems [1]. Naturally or artificially, their water * Corresponding author levels change in different frequency. As a consequence, the relevant sediment undergoes air-drying and flooding alternation. In the soils, air-drying increased P sorption [2]. However, the information on the relationship between air-drying and P sorption behaviors in sediments of aqua-tic systems is scarce. In a Spremberg reservoir, the sedi-ment increases the P release on reflooding [3]. There was an increase in P level after air-drying and reflooding of North Lake sediments [4]. Shortly, few studies on sedi-ments give the result contradictory to that obtained from soils. Additionally, sediment P behavior was measured using either air-dried [5, 6] or field-moist [7, 8] samples, which may yield different results; Moreover, there is the controversy over the role of OM in P sorption. For exam-ple, P sorption was positively correlated with OM [9-11], but then, a negative correlation between P sorption and OM was noted in soils [12, 13]. However, this subject was inadequately studied.In this study, sediments were collected in a Chinese large shallow eutrophic lake (Lake Chaohu) and an urban shallow lake (Lake Donghu) in November 2007. The OM content was measured and P sorption behaviors were described by Langmuir equation. Furthermore, the field-moist and air-dried sediments were compared for their abilities to shape the patterns of soluble reactive P con-centration and alkaline phosphatase activity under the aeration conditions by incubation experiments. The aims of this study were 1) to further describe the effects of air-drying on P sorption capacity in sediments of aquatic systems, especially lakes; 2) to have deeper understanding of the roles played by OM in modifying sediment P sorp-tion capacity; 3) to reveal environmental significance of drying and flooding alternation for the restoration and management of eutrophic lakes.2. MATERIALS AND METHODS2.1. Sample preparation2.1.2. Air-dried and field-moist sediment suspensionSediments were collected from Lake Chaohu and Lake Donghu in November 2007 (Fig. 1). The sediments were sampled by a Peterson grab sampler, stored at 4 °C,homogenized and sub-sampled randomly for two treat-ments. One portion of the sample was allowed to air-dry at room temperature (about 20 °C). Another portion wasimmediately mixed with distilled water (1:9) and stored at 4 °C [14].(a) Lake Chaohu(b) Lake DonghuFIGURE 1 - Map of sampling sites of Lake Chaohu (a) and Lake Donghu (b).2.2. Incubation experimentSediment samples were taken in February 2009 by polyethylene pipes, pushing 20 cm into the sediment with-out disturbing the sediment-water interface. Three field-moist sediment cores were incubated at 4 °C immediately. The other three cores were air-dried during 40 days at room temperature (about 20 °C). For the air-dried sedi-ments, the final water ratio decreased by 17%, on average. After air-drying, the sediment cores were reflooded with filtered original lake water (0.45 µm, stored at 4 °C) by siphoning to the same water levels as in the field-moist sediment controls. The reflooded and air-dried sediment cores are referred to as air-dried sediment cores. A 45-ml water sample was taken from each core for analysis and replaced by the same volume of filtered lake water. The whole incubation times were in the aeration state [15].2.3. Chemical analysis2.3.1. Phosphorus sorptionThe suspension was incubated with 0, 0.5, 1, 2, 5, 8, 10, and 15 mg P L-1 as KH2PO4 in 10-ml centrifuge tubes (each set has triplicate suspensions; modified by [14]). Tubes were shaken for 24 h at 20±3 °C, centrifuged at 3000 rpm for 20 min, and analyzed for soluble reactive phosphorus (SRP). Sorption parameters were calculated using equations as follows:Linear equation: Q=KC-Q0Langmuir equation:C/Q = C/Q max +1/K Q max Freundlich equation: LnQ=lnK f +nlnCC: P concentration in solution after 24 h equilibrium (mg L-1); Q: amount of P sorbed by the solid phase (mg kg-1).The equilibrium P concentration (EPC0) was meas-ured by Linear equation, where no P sorption or desorp-tion occurs, and is equal to the value of C when Q is 0. The maximum P sorption (Q max) and P sorption energy (K) were measured by Langmuir equation. Freundlich value (K f) was measured by Freundlich equation.Water SRP concentration was determined by the mo-lybdate blue method [16]. OM was measured by digestion with potassium dichromate plus sulfuric acid. Alkaline phosphatase activity (APA) in the water was determined using a procedure modified by [17, 18]. Dissolved oxygen (DO) was recorded with a portable JPBJ-608 meter and pH with a PHBJ-260 meter.2.4. Statistical analysisStatistical analyses of variance were performed using SPSS 17.0 program.3. RESULTS AND DISCUSSIONUnder both air-dried and field-moist conditions, se-diment P sorption fitted Langmuir equation well (r = 0.87-0.99). Compared to the field-moist samples, the air-dried ones had slightly higher EPC0 and lower Q max val-ues; furthermore, they showed significantly lower K val-ues (p<0.05) (Fig. 2). Taken together, air-drying weakened sediment P sorption capacity with the sorption energy being mostly affected.The decrease in sorption energy (K) could be ex-plained in terms of iron oxide and OM. Firstly, our phos-phate sorption data also fitted Freundlich equation well, and the adsorption of phosphate onto Fe(OOH) can be satisfactorily described with the Freundlich adsorption iso-therm [19]. Furthermore, in Chinese shallow lakes includ-ing the study lakes, the sediment OM content was posi-tively proportional to soluble reactive P concentration in interstitial water, in a form of exponential function, but inversely related to the sediment Fe/P ratio [20]. Iron-bound phosphates were the major P fractions in Lake Chaohu [21] and Lake Donghu [22]. Therefore, iron oxide plays an important role in P sorption in the sediments of the studied lakes, which might be adversely affected by air-drying. For example, in wetland sediment, iron extrac-tability of wet and air-dried sediments suggested an in-crease in iron crystallinity upon drying, correlated with the decrease in P-sorption capacity [23]. Complete desic-cation of sediments may lead to a decrease in the affinity of P for iron minerals [24]; Secondly, in the field-moist samples existed a significant positive relationship between OM content and K value (p<0.01) (Fig. 3), suggesting an important role of the sediment OM for binding phosphate. Consistently, positive correlations of both K and S-max with oxalate-extractable Fe (r values of 0.93 and 0.81, p < 0.05) and total carbon (TC) (r values of 0.89 and 0.74, p < 0.05) were found, suggesting that OM and amorphous or poorly crystalline Fe would play dominant roles in P adsorption in the headwater ditch sediments [25]. There-fore, the decomposition of the sediment OM upon air-drying could weaken the P sorption energy. For example, decreased P sorption after air-drying has been attributed to an increase in water-extractable OM [26]. DOM from decomposed organic materials inhibited P sorption to a greater extent than did DOM derived from fresh materials [27]. The relative affinity for phosphate decreases as the OM/specific surface area ratio increases supporting the hypothesis that phosphate and organic anions compete strongly for the same sorption sites. The amount of ox-alate + malate released from the solid phase was related roughly to that of P sorbed after the initial P sorption [28]. Moreover, the decrease in aerobic respiratory activity and humification index was observed in soil column from the surface to 1.5 m depth [29]; it means that, under aerobic conditions, the contents of humic substances were higher in the air-dried sediments relevant to the field-moist one, which also had adverse effects on P sorption. For example, amendment of the humic-fulvic acid mixture increased the amount of applied P in soils [30], and humic and fulvic acids competitively inhibit P sorption [31]. In short, changes in the geochemical characteristics of iron oxide and organic carbon would decrease the P sorption energy in air-dried sediments.FIGURE 2 - Variation in equilibrium phosphorus concentration (EPC0), maximum phosphorus sorption (Qmax), sorption energy (K) and Freundlich value (Kf) between field-moist and air-dried sediments of Lake Chaohu and Lake Donghu.FIGURE 3 - Relationship between sorption energy (K) and organic matter (OM) for field-moist sediments of Lake Chaohu and Lake Donghu.As shown in Fig. 4, SRP concentration and total APA derived from air-dried and field-moist samples differed greatly in the incubation solutions. Along the incubation course, the air-dried sample gave higher SRP concentra-tion from the second day and higher APA from the fourth day. The differences were significant, especially in the earlier incubation. Therefore, air-drying can enhance sediment P release by biological ways. For example, bacteria were important contributors of P during drying and rewetting, and their contributions occurred through two processes: (1) when sufficient moisture and oxygen were available, bacteria rapidly removed soluble P from the water, incorporated it into the particulate phase, andthe amount of P taken up was positively correlated with bacterial respiration; (2) upon drying, bacterially stored P was partly returned to the water, and the release was in-creased with increasing bacterial uptake [4]. Furthermore, the release of enzymes from dead organisms in water has been reported in many studies [32]. Additionally, enzyme-hydrolysable P may be more abandoned in the air-dried sediments. For example, the phytase preparation hydrolyzed large proportions of water-extractable molybdate-unreactive P in extracts of dry soils, suggesting the release of enzyme-hydrolysable inositol hexakisphosphate to water follow-ing the rapid rewetting of dry soils [33]. In short, in the air-dried sediment, the dead microorganisms liberated notonly phosphate but also alkaline phosphatase coupled with its substrates, leading to a significant increase in SRP concentration in overlying water.In the study lakes, the sediment P release was almost fully prevented by aeration. Under aerobic conditions, orthophosphate liberated is easily adsorbed by ferric iron in sediments with higher Fe/P ratio [20]. In addition, Fe-P possessed the greatest binding capability at pH 7-8 [34]. Therefore, both pH value and DO concentration were the major factors controlling P release at the sediment-water interface. However, there were no significant differences between pH value and DO concentration in the field-moist and air-dried sediments (Fig. 5); hence, these ef-fects did not appear to be a source of variations in SRP concentration in overlying water, which further high-lighted the role of sorption energy in P retention of lake sediments. EPC 0, where P is neither adsorbed nor desorbed, wasrelated to stream water DRP concentrations. EPC 0 values greater than SRP concentrations suggested the sediments were a potential source for water column P, whereas EPC 0 values less than SRP implied that the benthic sediments were serving as possible P sink [35]. For the field-moist sediments, an inverse association was found between OM and EPC 0. Contrastingly, in the air-dried sediments, there was a significantly positive relationship between these two variables (Fig. 6). This suggested that the breakdown of OM during drying may be a major source of P upon reflooding, which is of great environmental significance for the management of eutrophic lakes that undergo sea-sonal drying and rewetting along shoreline.FIGURE 4 - Comparison of soluble reactive phosphorus (SRP) concentration (4a) and alkaline phosphatase activity (APA) (4b) for air-dried and field-moist sediment cores (bars at each data point represents standard error).FIGURE 5 - Comparison of pH (a) and dissolved oxygen (DO) (b) in waters for air-dried and field-moist sediment cores (bars at data points represent standard error).FIGURE 6 - Relationship between equilibrium phosphorus concentration(EPC0)and organic matter (OM) for field-moist and air-dried sediments of Lake Chaohu and Lake Donghu.4. CONCLUSIONSAir-drying can inhibit P sorption in lake sediments chemically and enzymatically. It significantly decreased sorption energy that may be competitively weakened by the products in the process of OM decomposition under aerobic conditions. Furthermore, air-drying enhanced re-leases of alkaline phosphatase and phosphate from dead microorganisms, and gave rise to SRP concentration in overlying water. Finally, in contrast with its field-moist counterpart, the air-dried sediment showed a significant positive relationship between OM content and EPC0 val-ue; so, it tends to act as phosphorus source when reflooded.ACKNOWLEDGEMENTSThis work was supported by the grants from the State Major Project of Water Pollution Control and Manage-ment (2008ZX07101-013), the National Key Basic Re-search and development Program (2008CB418006), the National Science Foundation of Chian (41073066) and the State Key Laboratory of Freshwater Ecology and Biotechnology (2011FBZ15). The authors would like to thank Mr. Yun-bing Liu, Lei Ji and Jie Hou for their help in sampling work.REFERENCES[1]Pant, H. K., Reddy, K. R. and Lemon, E. (2001) Phosphorusretention capacity of root bed media of sub-surface flow con-structed wetlands, Ecol Eng. 17, 345-355.[2]Haynes, R. J. and Swift, R. S. (1985) Effect of liming andair-drying on the adsorption of phosphate by some acid soils,J Soil Sci. 36, 513-521. [3]Kleeberg, A. and Heidenreich, M. (2004) Release of nitrogenand phosphorus from macrophyte stands of summer dried out sediments of a eutrophic reservoir, Arch Hydrobiol. 159, 115-136.[4]Qiu, S. and McComb, A. J. (1995) Planktonic and microbialcontributions to phosphorus release from fresh and air-dried sediments, Mar Freshwater Res. 46, 1039-1045.[5]Stutter, M. I. and Lumsdon, D. G. (2008) Interactions of landuse and dynamic river conditions on sorption equilibria be-tween benthic sediments and river soluble reactive phospho-rus concentrations, Water Res. 42, 4249-4260.[6]Wang, Y., Shen, Z. Y., Niu, J. F. and Liu, R. M. (2009) Ad-sorption of phosphorus on sediments from the Three-Gorges Reservoir (China) and the relation with sediment composi-tions, J Hazard Mater. 162, 92-98.[7]Cyr, H., McCabe, S. K. and Nurnberg, G. K. (2009) Phos-phorus sorption experiments and the potential for internal phosphorus loading in littoral areas of a stratified lake, Water Res. 43, 1654-1666.[8]Smith, D. R., Warnemuende, E. A., Haggard, B. E. andHuang, C. (2006) Changes in sediment-water column phos-phorus interactions following sediment disturbance, Ecol Eng. 27, 71-78.[9]Lopez, P., Lluch, X., Vidal, M. and Morgui, J. A. (1996) Ad-sorption of phosphorus on sediments of the balearic islands (Spain) related to their composition, Estuar Coast Shelf S. 42, 185-196.[10]Bruland, G. L. and Richardson, C. J. (2006) An assessmentof the phosphorus retention capacity of wetlands in the pain-ter Creekwatershed,Minnesota,USA, Water, Air, and Soil Pollution. 171, 169-184.[11]Sallade, Y. E. and Sims, J. T. (1997) Phosphorus transforma-tions in the sediments of Delaware's agricultural drainage-ways: I. Phosphorus forms and sorption, Journal of Environ-mental Quality. 26, 1571-1579.[12]Dubus, I. G. and Becquer, T. (2001) Phosphorus sorption anddesorption in oxide-rich Ferralsols of New Caledonia, Aust J Soil Res. 39, 403-414.[13]Daly, K., Jeffrey, D. and Tunney, H. (2001) The effect of soiltype on phosphorus sorption capacity and desorption dynam-ics in Irish grassland soils, Soil Use Manage. 17, 12-20. [14]Istvanovics, V. (1994) Fractional composition, adsorptionand release of sediment phosphorus in the Kis-Balaton reser-voir, Water Res. 28, 717-726.[15]Qiu, S. and A.J.McComb (1994) Effects of oxygen concen-tration on phosphorus release from reflooded air-dried wet-land sediments, Aust J Mar Fresh Res. 45, 1319-1328. [16]Murphy, J. and Riley, J. (1962) A modified single solutionmethod for the determination of phosphate in natural waters, Analytica chimica acta. 27, 31-36.[17]Gage, M. A. and Gorham, E. (1985) Alkaline phosphataseactivity and cellular phosphorus as an index of the phospho-rus status of phytoplankton in Minnesota lakes, Freshwater Biol. 15, 227-233.[18]Boon, P. (1989) Organic matter degradation and nutrient re-generation in Australian freshwaters: I. Methods for exoen-zyme assays in turbid aquatic environments, Archiv fuer Hy-drobiologie AHYBA 4. 115.[19]Golterman, H. L. (1995) The labyrinth of nutrient cycles andbuffers in wetlands: Results based on research in the Camar-gue (southern France), Hydrobiologia. 315, 39-58.[20]Liu, Y. B., Guo, Y. X., Song, C. L., Xiao, W. J., Huang, D.Z., Cao, X. Y. and Zhou, Y. Y. (2009) The effect of organic matter accumulation on phosphorus release in sediment of Chinese shallow lakes, Fund Appl Limnol. 175, 143-150. [21]pan, C.-R., wang, J.-Q., zheng, Z.-X., liu, J.-J. and yin, F.-C.(2007) Forms of phosphorus and nitrogen existing in sedi-ments in Lake Chaohu Journal of Ecology and Rural Envi-ronment. 23, 43-47.[22]Jiang, P.-H., Ji, L., Xiao, W.-J., Huang, D.-Z., Liu, Y.-B.,Song, C.-L., Cao, X.-Y. and Zhou, Y.-Y. (2010) Bioturbation of two chironomid species on nutrient exchange at sediment-water interface in a chinese shallow eutrophic lake, Fresenius Environmental Bulletin. 19, 902-910.[23]Qiu, S. and McComb, A. J. (2002) Interrelations betweeniron extractability and phosphate sorption in reflooded air-dried sediments, Hydrobiologia. 472, 39-44.[24]Baldwin, D. S. and Mitchell, A. M. (2000) The effects ofdrying and re-flooding on the sediment and soil nutrient dy-namics of lowland river-floodplain systems: A synthesis, Re-gul River. 16, 457-467.[25]Luo, Z. X., Zhu, B., Tang, J. L. and Wang, T. (2009) Phos-phorus retention capacity of agricultural headwater ditch se-diments under alkaline condition in purple soils area, China, Ecol Eng. 35, 57-64.[26]Peltovuori, T. and Soinne, H. (2005) Phosphorus solubilityand sorption in frozen, air-dried and field-moist soil, Eur J Soil Sci. 56, 821-826.[27]Hunt, J. F., Ohno, T., He, Z., Honeycutt, C. W. and Dail, D.B. (2007) Inhibition of phosphorus sorption to goethite, gibb-site, and kaolin by fresh and decomposed organic matter, Bi-ol Fert Soils. 44, 277-288.[28]Afif, E. (1995) Organic matter delays but does not preventphosphate sorption by cerrado soils from Brazil, Soil Sci.159, 207andhyhen.[29]Cannavo, P., Dudal, Y., Boudenne, J. L. and Lafolie, F. (2004)Potential for fluorescence spectroscopy to assess the quality of soil water-extracted organic matter, Soil Sci. 169, 688. [30]Delgado, A., Madrid, A., Kassem, S., Andreu, L. and delCarmen del Campillo, M. (2002) Phosphorus fertilizer recov-ery from calcareous soils amended with humic and fulvic ac-ids, Plant and Soil. 245, 277-286.[31]Guppy, C., Menzies, N., Moody, P. and Blamey, F. (2005)Competitive sorption reactions between phosphorus and or-ganic matter in soil: a review, Aust J Soil Res. 43, 189-202. [32]Reichardt, W., Overbeck, J. and Steubing, L. (1967) Free dis-solved enzymes in lake waters.[33]Turner, B. L., McKelvie, I. D. and Haygarth, P. M. (2002)Characterisation of water-extractable soil organic phosphorus by phosphatase hydrolysis, Soil Biology and Biochemistry.34, 27-35.[34]Peng, J.-f., Wang, B.-z., Song, Y.-h., Yuana, P. and Liua, Z.(2007) Adsorption and release of phosphorus in the surface sediment of a wastewater stabilization pond, Ecol Eng. [35]Froelich, P. N. (1988) Kinetic control of dissolved phosphatein natural rivers and estuaries: A primer on the phosphate buffer mechanism, Limnol Oceanogr. 33, 649-668. Received: February 16, 2011Revised: May 17, 2011; July 12, 2011Accepted: September 28, 2011 CORRESPONDING AUTHORYi-Yong ZhouInstitute of HydrobiologyChinese Academy of SciencesNo.7 Donghu South RoadWuhan, Hubei ProvinceP.R. CHINAPhone: +86 27 68780709Fax: +86 27 68780709E-mail: zhouyy@。
环境湿度对硅橡胶材料憎水迁移性的影响_关志成
水性随迁移时间的变化过程。研究结果表明,在高湿环境 下 硅 橡 胶 的 憎 水 迁 移 特 性 显 著 变 弱 ;对 于IEC 标 准 推 荐
的2种人工污秽,高岭土的吸湿能力强于硅藻土,环境湿度对表面惰性物质为高 岭 土 时 的 憎 水 迁 移 特 性 影 响 较 大 ;
污秽中的可溶物质的吸湿性能也对硅橡胶材料的憎水迁移特性有很大影响,污秽中含有 糖 分 和 NaCl等 盐 类,会 使
憎水性的测量方法目前主要有喷水分级法(HC 法)和静态接触角法(CA 法)。前者的优点是比较灵 活,一般适用于绝缘子的现场评估,但缺点是受主观 因素影响较 大,不 能 用 于 定 量 分 析 比 较[22]。 本 文 需 要定量地研究表面憎水性的变化,因此,采用静态接 触角法 测 量 憎 水 性。试 验 中 采 用 德 国 Dataphysics 公司生产的 OCA20静态接触角测量仪对表面的静 态接触角进行测量,该仪器能够精确测量表面静/动
Abstract:Hydrophobicity and the unique hydrophobicity transfer property of silicone rubber material are the basic reason why composite insulators can prevent pollution flashover.Hydrophobicity transfer property of silicone rubber material is greatly influenced by ambient humidity.To deeply investigate the problem mentioned above,ambient humidity was controlled using saturated salt solution method,and the hydrophobicity status of the pollution surface was measured using static contact angle method.The results show that hydrophobicity transfer speed of HTV (high temperature vulcanization)slows down in high humidity environment;as to the two recommended pollutants by IEC standard,the moisture absorption ability of kaolin is better than kieselguhr,ambient humidity has a great impact on the hydrophobicity transfer property when the inert material is kaolin;the moisture absorption ability of the soluble substance in the surface pollutants has a great impact on the hydrophobicity transfer property,when surface pollutants contain sugar and soluble salts like NaCl,the hydrophobicity transfer speed slows down and the stable contact angle is low. Key words:composite insulator;silicone rubber material;hydrophobicity transfer;ambient humidity;inert material;soluble salt
温度和相对湿度对褐煤干燥动力学特性的影响
图1 F ig 11
恒温恒湿热风实验台
Ho t air ex perimental sy stem with
constant temper ature and hum idity
1 ) humidit y chamber; 2 ) inlet h ol e; 3 ) out let hole; 4 ) sam ple pan; 5 ) bracket ; 6 ) dyn ami c el ect ronic balance; 7 ) PC
引
言
褐煤约占我国煤 炭资源储量的 17% , 但 高水
分限制了它的利用。随着能源危机和环境问题的加 剧 , 对褐煤进行干燥提质, 拓宽褐煤的利用范围变 得越来越重要。褐煤开 采过程中会产 生大量末煤
2011- 01- 14 收到初稿 , 2011- 03- 03 收到修改稿。 联系人 : 向飞。 第 一作者 : 熊程 程 ( 1986 ) ) , 女 , 硕士 研究 生。
Received date: 2011- 01- 14 1 Corresponding author: D r 1 XIA N G Fei, xian gfei@ iet1 net
第 10 期
熊程程等 : 温度和相对湿度对褐煤干燥动力学特性的影响
# 2899 #
( 粒径为 0~ 10 mm ) , 约占总开采量的 60% 以上。 在当前技术水平条件下, 由于运输费用和装卸技术 的限制, 大量末 煤得不到有效 利用, 造成巨 大浪 费。在坑口就近建立气化炉, 利用现有技术进行气 化处理是末煤高效、清洁利用的重要途径。然而 , 由于这些褐煤颗粒水分较高 ( 通常 > 20% ) , 直接 入炉气化 , 水分在炉膛中蒸发会吸收大量潜热, 恶 化炉膛温度条件 , 降低气化产品 热值, 增加 CO 2 排放 ; 而且当入炉煤水分高于 8% 时 , 会出现进料 不畅的问题, 存在爆炸危险, 严重影响了煤的高效 利用。因此, 在气化前对入炉煤进行干燥处理是十 分必要的。而利用气化过程中产生的低温废热进行 热风干燥是较为经济可行的干燥方式。因此 , 研究 褐煤颗粒的低温干燥特性 , 开发褐煤颗粒低温干燥 工艺具有重要的实际意义 [ 1- 3] 。 目前 , 国内外对褐煤干燥特性的研究还较少且 主要针对煤粉, 如赵卫东等 利用热天平对褐煤煤 粉进行了等温干燥实验, 获得了褐煤煤粉在降速干 燥阶段的干燥机理 ; L i 等[ 5] 利用烘箱对印尼 褐煤 煤粉进行了干燥动力学研究, 而针对褐煤颗粒的干 燥特性研究还未见文献报道。此外 , 目前国内外关 于干燥的文献主要集中于研究温度对干燥特性的影 响, 相对湿度 对干燥特性影响 的研究也较少 见报 道, 而在一定的风速下, 影响颗粒干燥速率最主要 的因素是热风的温度和相对湿度。本文通过大量热 风干燥实验, 考察了不同温度和相对湿度对褐煤颗 粒干燥特性的综合影响, 为设计褐煤干燥工艺及设 备提供了基础数据。
相转化凝固浴对Al2O3中空纤维多孔载体微观结构的影响
利用气体泡压法测定中空纤维多孔载体的孔径分布
情况。采用微机控制电子万能试验机(SANS-CMT
6203, 深圳市新三思材料检测有限公司)对中空纤 维多孔载体进行三点弯曲强度测定。利用实验室自
制的纯水通量测试装置对中空纤维多孔载体进行纯
水通量测试, 用公式(1)进行计算:
J1
=
V A⋅ t
(1)
式中, J1 为中空纤维多孔载体的纯水渗透通量, m3/(m2·h); V 为纯水透过总量, m3; A 为有效面积, m2; t 为过
(State Key Laboratory of Materials Oriented Chemical Engineering, College of Chemistry and Chemical Engineering, Nanjing University of Technology, Nanjing 210009, China)
图 1 相转化过程示意图 Fig. 1 Schematic diagram of phase inversion process
1: NMP and internal coagulation bath; 2: NMP and external coagulation bath
第2期
陈园园, 等: 相转化凝固浴对 Al2O3 中空纤维多孔载体微观结构的影响
滤时间, h。
室温下, 在实验室自制的单组份渗透装置上对
中空纤维多孔载体进行 N2 渗透性能测试, 其计算公
式如公式(2)所示:
J2
=
Q ln(D / d ) πL(D − d )ΔP
(2)
式中, J2 为中空纤维多孔载体的 N2 渗透性, mol/(s·m2·Pa); Q 为渗透侧气体流量, mol/s; D 、d 和 L 分别为中空
211251882_基于反演法计算不同温度下小麦面团的水分扩散系数
李望铭,马荣琨,贾庆超,等. 基于反演法计算不同温度下小麦面团的水分扩散系数[J]. 食品工业科技,2023,44(11):111−117.doi: 10.13386/j.issn1002-0306.2022070354LI Wangming, MA Rongkun, JIA Qingchao, et al. Calculation of Moisture Diffusivity of Wheat Dough at Different Temperatures Based on Inversion Method[J]. Science and Technology of Food Industry, 2023, 44(11): 111−117. (in Chinese with English abstract).doi: 10.13386/j.issn1002-0306.2022070354· 研究与探讨 ·基于反演法计算不同温度下小麦面团的水分扩散系数李望铭1,马荣琨1,贾庆超1,张 杰1,赵学伟2(1.郑州科技学院食品科学与工程学院,河南郑州 450064;2.郑州轻工业大学食品与生物工程学院,河南郑州 450002)摘 要:水分扩散系数是食品加工过程中重要的物理参数。
估算水分扩散系数的主要方法是基于第二菲克定律,但在应用这些定律的方式上存在显著差异。
本研究采用Peleg 、Weibull 、双指数这三种常用的食品水分吸附动力学模型拟合了冻干面团在20、30及40 ℃时的吸湿曲线。
在此基础上,通过COMSOL 软件分别建立了瞬时平衡、对流、平行指数边界三种条件下的面团吸湿模型,并通过反演法计算出对应模型下的水分扩散系数。
结果表明,Weibull 模型和双指数模型决定系数均在0.999以上,较为适合冻干面团吸湿曲线的拟合;平行指数边界模型能较好的模拟出不同温度条件下冻干面团的吸附水分变化规律。
机械研磨 对 结构和粒度的影响

第35卷 2007 年第 10 期
论文编号:1001-3954(2007)10-0033-037
机械研磨对粘土
矿物结构和粒度的影响*
丁述理 宋 黑 徐博会 孙晨光
河北工程学院河北省资源勘测研究重点实验室 河北邯郸 056038
摘要:对高岭石、蒙脱石和伊利石粘土矿物分别进行了 4 h 的机械研磨,利用 XRD、IR 和激光粒度 分析等测试技术对不同时间段内粘土矿物结构和粒度的变化进行研究,结果表明:高岭石经过 1 h 研 磨后,其晶体结构发生明显变形,经过 2 h 的研磨后,其晶体结构几乎完全被破坏;蒙脱石经过 1 h 研磨后,其晶体结构发生明显变形,在后续的 3 h 的机械研磨过程中,其晶体结构变形不明显;伊 利石在经过 1 h 研磨后,其晶体结构发生也明显变形,当研磨到 3.5 h 后,其晶体结构几乎完全被破 坏。研磨 2 h 后,小于 2 µm 的颗粒含量排序为:蒙脱石>伊利石>高岭石。 叙词:干法研磨 超细粉体 粘土矿物 晶体结构
响。所以每次研磨时间为 4 min,且中间需停顿一定时
也完全有可能使结构中的各种键发生断裂而产生大量
间以保持温度不要太高,以免对研磨体产生损害。
的自由基。
高岭石的结构变化在 X 衍射图谱中也非常明显 (图
2 结果与分析
2.1 高岭石矿物
图 1 中 a 曲线为高岭石的红外光谱图。从图中可
2)。从图2中可以看出,18°~26°(2θ ) 范围内的衍射 峰形状完好 (11-1 峰并没有显示出来),表明高岭石的结 晶程度较好。在研磨到 20 min 后,系列衍射峰 (020)、 (11-0)、(111-)、(02-1)、(021-) 逐渐合并成两个峰,由此
正渗透传质系数ηmt定义、评价及应用
目录
摘要................................................................................................................... I Abstract........................................................................................................... II 第 1 章 概述 1.1 研究背景....................................................................................................1 1.2 问题阐述....................................................................................................2 1.3 研究内容....................................................................................................3 1.4 研究目的及意义........................................................................................3 第 2 章 不同正向渗透系统 ηMT 计算 2.1 σ 与 ηMT 的定义..........................................................................................5 2.2 实验装置、渗透通量与水头的测量 .......................................................7 2.3 结果与讨论................................................................................................9 2.4 本章小结..................................................................................................17 第 3 章 模型开发 3.1 基于 ηMT 的模型开发...............................................................................19 3.2 模型验证...................................................................................................23 3.3 灵敏度分析...............................................................................................24 3.4 模型应用...................................................................................................25 3.5 讨论...........................................................................................................27 3.6 本章小结...................................................................................................32 第 4 章 结论与建议 4.1 结论..........................................................................................................33
干燥工艺对碳纳米管再分散性的影响
干燥工艺对碳纳米管再分散性的影响邹应冬;王特;卢月美;巩前明;梁吉【摘要】Carbon nanotubes were dispersed in water or tert butyl alcohol (TBA) after they were treated by acid. These two kinds of suspensions were dried by oven or vacuum freeze dryer. Scanning electron microscopy (SEM) and UV-Vis spectrophotometer were used in characterizing the morphology and re-dispersibility of CNTs before and after drying processes. The results show that when the dispersing agent is water, the re-dispersibility of CNTs dried by vacuum freeze dryer is worse than that by oven. However, when TBA is used as the dispersing agent, the re-dispersibility of CNTs dried by vacuum freeze dryer is better than that by oven. It is also shown that it is better to choose TBA as the dispersing agent. Comparatively, optimal re-dispersibility of CNTs could be obtained by vacuum freeze-drying method with TBA as dispersing agent, which could reach 91.2% of the dispersity of the original acid-treated CNTs suspension. This should be attributed to the fact that when the dispersing agent is suitable, vacuum freeze-drying could decrease the aggregation caused by capillary pressure, hydrogen and chemical bonding.%以水和叔丁醇为分散介质,分别利用烘箱和真空冷冻干燥机对混酸处理后的碳纳米管进行干燥处理,并利用扫描电子显微镜及紫外-可见分光光度计等对干燥前后碳纳米管的形貌及再分散性进行表征.研究结果表明:以水为分散介质,采用真空冷冻干燥所得碳纳米管粉体的再分散性比烘箱干燥的差;而以叔丁醇为分散介质时,真空冷冻干燥所得碳纳米管粉体的再分散性比烘箱干燥的好;干燥方法相同时,叔丁醇是更好的分散介质.以叔丁醇为分散介质,经真空冷冻干燥后,碳纳米管再分散性最好,可达到干燥前的91.2%.这应归因于:分散介质适当时,真空冷冻干燥能减弱毛细管压力、氢键及化学键合等引起的团聚趋势,从而能得到再分散性更好的碳纳米管粉体.【期刊名称】《中南大学学报(自然科学版)》【年(卷),期】2012(043)010【总页数】8页(P3833-3840)【关键词】碳纳米管;再分散性;烘箱干燥;真空冷冻干燥;水;叔丁醇【作者】邹应冬;王特;卢月美;巩前明;梁吉【作者单位】清华大学机械工程系,先进成形制造教育部重点实验室,北京,100084;清华大学机械工程系,先进成形制造教育部重点实验室,北京,100084;清华大学机械工程系,先进成形制造教育部重点实验室,北京,100084;福州大学机械工程及自动化学院,福建福州,350108;清华大学机械工程系,先进成形制造教育部重点实验室,北京,100084;清华大学机械工程系,先进成形制造教育部重点实验室,北京,100084【正文语种】中文【中图分类】TB383碳纳米管(CNTs)的良好分散是提高其在复合材料中增强效率的前提[1−8]。
不同干燥条件对鲍鱼组织构造及流变特性的影响
15
热风
10
5
0
0
20
40
60
80 100 120
时 间/h
图 3 干燥速率随时间的变化曲线 Fig.3 Curves of drying rate varying with drying time
2.2 干鲍鱼微观结构分析 经晾晒、热风干燥处理的鲍鱼组织构造变化
的 扫 描 电 镜 结 果 如 图 4 所 示 。 以 煮 鲍 ( 沸 水 10 min) 作为对比。图 4a 清晰地显示出煮鲍的肌原纤 维束和胶原结缔组织, 其中肌原纤维排列较为紧 密, 并且受热变性出现部分凝结现象[21]。图 4b 和 图 4c 分别显示两种方式干燥后的鲍鱼肌肉 组 织 状态, 二者差异显著。晾晒干燥过程中, 由于自然 环境温度较低、相对湿度较高, 所以干燥强度很 低, 失水过程缓慢, 鲍鱼内肌原纤维收缩均匀、排 列紧密, 部分热变性成明胶的胶原纤维清晰可见。 热风干燥过程中, 环境温度相对较高, 相对湿度较
关键词 鲍鱼 干燥 复水涨发 胶原蛋白 肌肉纤维 组织结构 流变学特性 文章编号 1009- 7848( 2008) 03- 0108- 08
鲍 鱼 属 软 体 动 物 门 ( Mollusca) 、腹 足 纲 ( Gas- tropoda) 、前 鳃 亚 纲 ( Prosobranchia) 、原 始 腹 足 目 ( Archaeogastropoda) 、 鲍 科 ( Haliotidae) 、 鲍 属 ( Haliotis) 。全世界各海区鲍鱼有 216 种, 已定名的 66 种, 常见种类约 30 种。其中在中国沿海分布 7 种。我国南方与北方鲍的代表分别为皱纹盘鲍与 杂色鲍, 其中以皱纹盘鲍最为出名, 并以山东沿海 开发最早, 史上称“登莱鳆鱼”[1~2]。
Effect of far-infrared drying on the water state and glass transition
Effect of far-infrared drying on the water state and glass transition temperature incarrotsCongcong Xu a ,Yunfei Li a ,⇑,Huaning Yu a ,ba Department of Food Science and Technology,School of Agriculture and Biology,Shanghai Jiao Tong University,Shanghai 200240,PR China bState Key Laboratory of Dairy Biotechnology,Technical Centre,Bright Dairy and Food Co.,Ltd.,Shanghai 200436,PR Chinaa r t i c l e i n f o Article history:Received 18September 2013Received in revised form 10March 2014Accepted 22March 2014Available online 29March 2014Keywords:Glass transition temperature Water stateFar-infrared drying DSC NMRa b s t r a c tThe effect of far-infrared drying (FID)on the water state and glass transition temperature (T g )of carrots were assessed by nuclear magnetic resonance (NMR)and differential scanning calorimetry (DSC).Results showed that,with increasing time,FID caused dramatic changes in the water state in dehydrated carrots.The drastically decreased content of free water in vacuoles was accompanied by sharp increases in the content of immobilized water in the cytoplasm and extracellular space.Subsequently,the content of immobilized water decreased gradually with increasing time.FID elevated the T g values appreciably by decreasing the content of immobilized water in carrot tissues.In carrots with moisture content <0.39g/g dry matter,T g values were increased by 21.36,35.55and 40.99°C with the moisture content decreased by 0.20,0.25and 0.30g/g dry matter at respective infrared power values of 400,600and 800W.Ó2014Elsevier Ltd.All rights reserved.1.IntroductionCarrots are root vegetables that are cultivated worldwide.In recent years,possibly due to the appreciable amounts of vitamins (A,B 1,B 2,B 6,B 12),b -carotene,fiber content and important minerals contained within carrots,the consumption of carrots has increased steadily.Carrots usually need to be dried before use.Dried carrots are consumed in various ready-to-eat meals such as instant powdered soups,sauces,and seasonings (Doymaz,2004;Fan et al.,2005;Zielinska and Markowski,2007).Attributed to the advantages of higher drying rate,shorter drying time,energy-saving and uniform distribution of tempera-ture to give a better-quality product,far-infrared drying (FID)has received considerable attention for drying various agricultural products,such as peaches (Wang and Sheng,2006),sweet potatoes (Lin et al.,2005)and yams (Lin et al.,2007).Thus,FID could be a favorable way to dry carrots.However,most studies have concen-trated on the effect of FID on the quality of carrots,such as color,shrinkage,rehydration ratio and particle density (Baysal et al.,2003),or on the effect of infrared power on drying rate,drying time and energy consumption in carrots (Kocabiyik and Tezer,2009).The effect of FID on the water state and glass transition tempera-ture (T g )in carrots has not been investigated.A fundamental understanding of the water state in food is cru-cial for obtaining a product with favorable quality in the food industry (Hills and Remigereau,1997;Hills and Nott,1999;Xin et al.,2013).Additionally,the T g of various amorphous food mate-rials plays an important role in the processing and storage stability of products (Kasapis,2006).It is well known that,at temperatures below the T g ,the diffusion-controlled deteriorative process in product quality is arrested or not significant within a practical time scale.It has been reported that,if stored below the T g ,the loss rate of L -ascorbic acid of modified osmodehydrofrozen peas was re-duced by as much as threefold (Giannakourou and Taoukis,2003).Hence,foods should be stored at a temperature below their T g for better preservation.However,due to the high moisture content in plant tissues,the T g of fruits and vegetables is often lower than the common storage temperature (À20°C).Therefore,elevation of the T g of fruits and vegetables is necessary.Food materials are considered to be systems of water-plasticized natural polymers,and their T g is very sensitive to changes in moisture content and temperature.Symaladevi et al.(2009)reported that the T g of the freeze-dried raspberry was increased by 81.30°C with the moisture content decreased by 20.8%.Increasing the amount of water loss and solid content is often employed to substantially increase the T g of the matrix (Goula and Adamopoulos,2010)and thus enhance the stability of fruits and vegetables.Therefore,FID is a potential method to increase the T g of carrots by dehydration./10.1016/j.jfoodeng.2014.03.0220260-8774/Ó2014Elsevier Ltd.All rights reserved.⇑Corresponding author.Tel./fax:+862134206918.E-mail address:yfli@ (Y.Li).We investigated the effect of FID on changes in the water state in carrot tissues as well as the effectiveness of FID on the increase in the T g of carrots.Furthermore,the relationship between the T g and different water states in carrots was explored using correlation analysis and path analysis to assess the effect of the water state on the T g in carrots.2.Materials and methods2.1.MaterialsThe cultivar of the carrots used in this study was grown in Shanghai province and harvested in May.On the basis of unifor-mity and absence of damage,fresh carrots(Daucus carota L.)were purchased from a local market and stored at4°C.Raw carrots were peeled and cut with a sharp knife into slices with thickness 5.0±1mm(diameter,30.5±1.6mm).Samples of sliced carrots were placed uniformly on a wire mesh tray in a thin layer.Drying experiments were carried out at the infrared power of400,600and 800W(3W)at an air velocity of1.0msÀ1.Carrot samples were dried for10h and some samples were taken out every hour for the determination of indicators.2.2.Calculation of moisture content and water lossTo estimate the moisture content,sliced carrot samples(initial mass,W1)were dried in an oven at105°C to attain a constant mass,W2.Moisture content(X ws,g/g dry matter;X w,g/g total) and solid content(X s,g/g total)were calculated using Eqs.(1) and(2),respectively.X ws¼W1ÀW2W2;X w¼W1ÀW2W1ð1ÞX s¼1ÀX wð2ÞThe water loss(WL,g water/g initial dry matter)of carrot samples is expressed according to Eq.(3)(Lowithun and Charoenrein,2009).WL¼ðM0Àm0ÞÀðMÀmÞm0ð3Þwhere M0(g)is the initial mass of fresh carrots before drying treat-ment,M(g)is the mass of carrots after drying treatment,m0(g)is the dry mass of fresh carrots,and m(g)is the dry mass of carrots after drying treatment.Data were reported as the mean value of three replicates for each treatment.2.3.NMRA NMI20-Analyst system(22.6MHz;Shanghai Niumag Corporation,Shanghai,China)was employed to monitor the water state in carrot samples.The ideal center frequency and pulse width were found automatically by the system to achieve the optimal conditions for NMR.Approximately400mg of stripped carrot sam-ples was placed inside glass tubes(outer diameter,10mm)to avoid exceeding the active region of the radiofrequency coil. Carr–Purcell–Meiboom–Gill(CPMG)pulse sequences were used to measure the spin–spin relaxation time(T2).Optimal pulse parameters in the CPMG test were:90°pulse width=16.5l s; 180°pulse width=33.0l s;receiver frequency=23MHz;recycle time=3500ms,repeated scanning number=8;echo count=10,000;echo time=105l s.Data were reported as the mean value of three duplicate NMR measurements(total of six runs)for each treatment.2.4.DSCA differential scanning calorimeter(Pyris Diamond;Perkin–El-mer,Boston,MA,USA)was employed to measure the thermal tran-sitions in carrot samples obtained from FID treatment. Temperature and melting enthalpy(D H m)calibrations of the instrument were undertaken with distilled water(melting point=0.0°C,D H m=333.88J/g)and indium(melting point=156.60°C,D H m=28.45J/g).An empty sealed aluminum pan was used as a reference.Nitrogen gas at aflow rate of 50mL/min was employed as the purge gas to avoid water conden-sation around the sample during the runs.Samples(10–15mg) from each treatment were encapsulated into hermetically sealed aluminum pans and then loaded onto the equipment at room tem-perature.According to the method proposed by Shi et al.(2012), the T g of samples was assayed with some modifications.Briefly, samples were cooled from the load temperature(30°C)toÀ20°C and equilibrated atÀ20°C for5min.After equilibration,samples were cooled sequentially toÀ100°C at20°C/min,and then equil-ibrated atÀ100°C for5min.Finally,samples were scanned from À100to50°C at10°C/min to determine the T g.The TA universal analysis software provided with the DSC instrument was employed to assess the onset(T go),mid-point(T gm)and end(T ge)of the glass transition.The mid-point of the transition was taken to be the T g. Two thermograms are presented to show the glass transition: one for samples containing un-freezable water(Fig.1a)and another one for samples containing freezable water(Fig.1b).Mea-surements were made in triplicate and a mean value taken.The Gordon–Taylor model is considered to be a reliable predic-tor of the T g as a function of moisture content.The Gordon–Taylor empirical equation is:T g¼X sðT gsÞþkX wðT gwÞs wð4Þwhere X s and X w(g/g total)are the corresponding contents of solid matrix and water;T g,T gs and T gw are the T g of the samples,solid ma-trix and water;and k is the Gordon–Taylor parameter,respectively. The T g,X s and X w were detected in the study,and the T gw was À133.88°C.The k and T gs were estimated with non-linear regres-sion analysis using Matlab R2013a(MathWorks).2.5.Statistical analysesStatistical analyses were undertaken using one-way analysis of variance(ANOVA)followed by the Duncan test at a confidence level of95%.Data are expressed as the mean±standard deviation (SD).Pearson’s correlation analysis was conducted by combining the data from all treatments to address the relationship betweenC.Xu et al./Journal of Food Engineering136(2014)42–4743the selected indicators.Regression analysis and path analysis were carried out to show the linear relationship and different effects of the indicators.Data were analyzed using SAS v9.1(SAS Institute,Cary,NC,USA).The Gordon–Taylor parameters,k (Gordon–Taylor parameter)and T gs (T g of the solid matrix)were estimated with non-linear regression analysis using Matlab R2013a (MathWorks).3.Results and discussion3.1.Moisture content and water loss of carrotsValues of X ws and WL of different dried samples were shown in Fig.2.From an initial moisture content of 9.26g/g dry matter,values of X ws in dried carrots decreased gradually by 9.09,9.15and 9.17g/g dry matter at the respective infrared power of 400,600and 800W (3W)for 10h.The amount of WL increased contin-uously by 8.56,9.11and 9.61g water/g initial dry matter at 3W,respectively.These results indicated that total moisture content in carrots decreased significantly during FID.3.2.Water state as measured by NMR3.2.1.Water at different statesNMR is a non-destructive test and can be used to monitor thewater state in biological samples such as cells and tissues (Rucin ´s-ka-Sobkowiak et al.,2012).The spin–spin relaxation time (T 2)and relative area (M )were determined using NMR to investigate the ef-fect of FID on the state of water in carrot tissues.According to the analysis of T 2inversion spectra,the water state within raw fruits and vegetables can usually be categorized into ‘‘bound water’’,‘‘immobilized water’’and ‘‘free water’’,which cor-respond to different cell compartments:cell walls,cytoplasm and extracellular space and vacuoles (Shao and Li,2011;Xin et al.,2013).The population groups of the longest relaxation time (T 23),intermediate relaxation time (T 22)and shortest relaxation time (T 21)correspond to free water,immobilized water and bound water in tissues,respectively.The relative areas of M 0,M 23,M 22and M 21are employed to express the relative content of total water,free water,immobilized water and bound water in tissues,respectively.As shown in Fig.3,the initial distribution of T 2relax-ation data in raw carrot samples demonstrated the range of the three population groups:T 21(0.4–1ms),T 22(5–40ms)and T 23(50–850ms).The T 22and T 23were the two main population groups in carrots,and the T 21was negligible in the initial distribution.Therefore,only the two main population groups were analyzed further.3.2.2.Free water in vacuolesThe changes in T 23reflected the variation of free water in vacu-oles.As shown in Fig.4A,with increasing time,the T 23values de-creased gradually from 683.87ms in raw carrots to 0ms in all samples dehydrated for 10h.This feature was accompanied by a continuous reduction in M 23values from 732.31to 0(Fig.4B).These trends concurred with the report which stated the T 2peak value corresponding to the free water of microwave-dehydrated stem lettuces was reduced by 717.19ms compared with untreated samples (Wang et al.,2012).As can be seen from Fig.4B,there was a sharp decrease in M 23values at respective times of 5,4and 3h for 3W,indicating that a large amount of free water was lost at those times.In addition,values of M 0decreased gradually in accor-dance with decreases in X ws during the dehydration of carrots (Fig.4C).These findings suggested that FID caused a dramatic loss of most mobile water in vacuoles and,finally,that all of the free water in carrots was removed.3.2.3.Immobilized water in the cytoplasm and extracellular space The T 22represented the immobilized water and,because of the various changes of nutritional ingredients in the cytoplasm and extracellular space during FID dehydration,changes in the T 22were more complicated compared with those of the T 23(Fig.5A).The T 22values among the three treatments all increased at 1h.These increases may have been due to the shift of free water to immobi-lized water resulting from the increase in the concentration of carbohydrates (mainly glucose,fructose and sucrose)and the deg-radation of nutritional ingredients in the cytoplasm.Subsequently,44 C.Xu et al./Journal of Food Engineering 136(2014)42–47the T 22values decreased continuously within 3,2,and 1h at 3W due to the shift of immobilized water to water more tightly bound to the polysaccharides in the cell wall (e.g.,pectin).Li et al.(2012)also showed that immobilized water can be transformed into bound water during drying at 40,50and 60°C.After a short-term decrease,a sharp increase in the T 22values was observed at the respective times of 5,4and 3h under 3W treatments,during which the amount of free water decreased sharply.Hence,the sharp increase could have been associated with a sharp shift from free water to immobilized water.This process was followed by gradual decreases in the T 22values.Under conditions in which most of the free water was lost,immobilized water could become more mobile and undergo a considerable amount of loss.Simulta-neously,some immobilized water could also shift to more tightly bound water in tissues.In the present study,the M 22values at the beginning were not very large because of the sharply increased values of M 22at 5,4,and 3h under 3W (Fig.5B).Subsequently,the M 22values decreased from the highest values of 254.12,233.34and 244.97to the values of 56.56,42.36and 36.51in samples treated at 3W,respectively.Together with the results of T 22,we suggested that FID caused dramatic changes in the water state in dehydrated carrots with increasing time.Free water in vacuoles could shift to immobilized water in the cytoplasm and extracellular space of car-rots during FID.With increasing time,the immobilized water was reduced.3.3.The T g as measured by DSC3.3.1.The T g at high moisture contentFor samples (raw carrots and carrots treated at 400W for 1h)with moisture content (X ws P 5.21,g/g dry matter),the T g ap-peared to be practically negligible in comparison with the latent heat of ice melting (not shown in Table 1).Drying times shorter than 4,3and 2h at 3W resulted in samples with high moisture content (X ws P 0.77,g/g dry matter).In samples with high mois-ture content (0.776X ws 65.21,g/g dry matter),T g values were independent of the initial concentration and remained practically constant.This finding may have been because at high moisture content,the cells of samples represent a dilute solution system with low viscosity.In this system,the effect of the viscosity of cell solutions is quite small.In our case,the glass transition for samples with high moisture content started from À53.78°C and ended at À44.41°C (Table 1).The mean value of T g (total number of mea-surements)was estimated to be À49.42°C.Similar results were obtained by Bai et al.(2001)when testing the T g of apple slices with different moisturecontent.C.Xu et al./Journal of Food Engineering 136(2014)42–47453.3.2.The T g at low moisture contentDrying times longer than5,4and3h at3W resulted in samples with moisture content60.39g/g dry matter(Table2).Given the NMR results,practically all of the free water was removed at those times,and immobilized water dominated in tissues.The T g values increased obviously with decreasing content of immobilized water during dehydration.With moisture content decreased by0.20,0.25 and0.30g/g dry matter,the values of the onset temperature of glass transition(T go)for samples treated at3W increased by 20.75,33.18,and36.80°C,respectively;and the T g values of samples were elevated by21.36,35.55and40.99°C,respectively. Similar trends have been reported in several studies on various dried fruits and vegetables,such as kiwifruit,tomatoes and Agari-cus bisporus(Moraga et al.,2006;Goula et al.,2008;Shi et al., 2012).One main reason for the elevation in the T g with decreased moisture content is the plasticization effect of water on the amor-phous constituents of the matrix(Rahman et al.,2005).Additionally,fruits and vegetables can usually be regarded to be binary mixtures of solids and water.The Gordon–Taylor model is a reliable predictor of the T g as a function of moisture content.In the present study,it wasfitted well by the experimental data with the following parameters:T gs=3.14°C and k=2.34(R2=0.992).The calculated value of k=2.34for carrots was in the range reported for garlic(Rahman et al.,2005)and A.bisporus(Shi et al.,2012), but slightly different than for that for the Chinese gooseberry (Wang et al.,2008)and raspberry(Symaladevi et al.,2009).The dif-ference in the k value could result from differences in the chemical compositions of various fruits and vegetables(Goula et al.,2008). As can be seen,the plasticization effect of the immobilized water on T g was significant in FID–treated carrots.3.3.3.Relationship between the water state and T g in carrotsThe results of the correlation analysis were shown in Table3 and show that the T g was correlated negatively with the relaxation times of T22and T23(p<0.01)and the relative areas of M22 (p<0.05),M23(p<0.05)and M0(p<0.01)in carrots.These findings were consistent with the report by Xin et al.(2013), who stated that the T g of osmotically treated broccoli was corre-lated negatively with the relaxation times of the T22and the rela-tive proportion of the T23population.In addition,a regression equation(T g=À22.15–1.37T22(R2=0.90;p<0.05))and an equa-tion from path analysis(T g=À0.864T22(R2=0.90;p<0.05))were obtained in the present study.These equations showed that the T g had a linear relationship with the T22and that changes in the T g were affected appreciably by immobilized pared with the effect of immobilized water,the effect of free water was not as appreciable.In addition,compared with the correlation between the relative areas and T g,the correlation between the relaxation times and T g was higher.Thisfinding may be because that the relaxation behavior has a direct relationship with water mobility in different parts of the cell as well as the interaction between water and other cell components(Gussoni et al.,2007;Guizani et al.,2010).However,the relative areas reflect the relative content of water at different states.These results indicated that the relax-ation behavior correlated with the T g,and that the water state ex-erted a significant impact on the T g of FID–treated carrots.It is well known that water is a‘‘mobility enhancer’’in that its low molecular weight greatly enhances the mobility of macromol-ecules by increasing the free volume and reducing the local viscos-ity in food materials.NMR results showed that at high moisture content,the most mobile water(free water in vacuoles)dominated in tissues.Under these conditions,the matrix was a dilute solutionTable1The glass transition temperature(°C)of dried carrots with moisture content P0.77g/ g dry matter a.Time(h)X ws T go T g T ge400W09.26N N N1 5.21N N N2 3.81À54.97±4.21À51.96±0.21À46.74±1.493 1.30À55.10±0.24À49.86±2.41À44.49±2.5640.79À53.83±0.61À50.10±1.35À44.04±2.31600W09.26N N N1 3.98À54.14±1.59À51.52±0.95À46.23±0.142 2.50À52.32±0.25À47.55±0.64À42.55±1.2330.77À51.33±2.02À46.22±0.98À42.52±0.19800W09.26N N N1 2.86À56.23±0.72À51.25±0.08À46.16±0.382 1.66À52.32±3.42À46.91±1.20À42.55±2.31400,600,and800W:treatment under different far–infrared power;X ws:moisture content,g/g dry matter;T go:onset glass transition temperature;T g:glass transition temperature;T ge:end glass transition temperature;T m:onset melting temperature; N=not detected.a Data are the mean±standard deviation(SD).Mean values for all measure-ments:T go=À53.78±1.67°C;T g=À49.42±2.23°C;T ge=À44.41±1.79°C.Table2The glass transition temperature(°C)of dried carrots with moisture content60.39g/g dry matter a.Time(h)X ws T go T g T ge400W50.37À64.47±3.12À59.85±4.329À55.33±1.560.30À56.36±0.61À51.10±0.99À45.67±2.3270.22À49.97±1.45À44.65±1.32À40.02±2.5680.20À48.88±0.78À43.14±0.81À37.36±2.1190.18À46.19±1.48À40.31±1.26À35.21±0.61100.17À43.72±3.44À38.49±3.48À33.14±1.44600W40.35À60.33±4.23À58.6±3.06À57.71±3.1150.31À55.22±3.13À52.11±3.88À48.22±3.8860.18À46.33±1.43À39.16±1.33À33.85±4.1370.16À40.34±0.64À34.01±1.33À29.75±2.0180.13À38.34±3.10À30.01±2.33À22.27±2.3990.12À31.23±1.72À26.60±1.07À22.19±0.01100.11À27.15±0.52À23.05±0.72À19.36±2.34800W30.39À63.47±4.77À60.84±5.12À58.04±1.0940.26À53.23±0.24À50.41±0.49À47.42±2.4650.16À42.55±1.46À37.16±1.99À34.95±0.4860.14À40.86±0.35À33.01±0.04À26.75±0.3570.11À30.98±2.63À26.10±5.66À21.22±1.6980.10À28.82±3.35À22.94±1.02À16.06±1.3290.10À27.10±0.59À20.13±0.41À13.46±0.36100.09À26.67±1.93À19.85±1.60À13.03±0.74400,600,and800W:treatment under different far-infrared power;X ws:moisture content,g/g dry matter;T go:onset glass transition temperature;T g:glass transition temperature;T ge:end glass transition temperature.a Data are the mean±standard deviation(SD).All samples had the same initial moisture content.Table3Correlation coefficient between the water state and glass transition temperature in carrots.Coefficient T22T23M22M23M0T gÀ0.864**À0.655**À0.384*À0.408*À0.722**X ws:moisture content,g/g dry matter;T22and T23:relaxation times reflecting immobilized water and free water,respectively;M0,M22and M23:relative areas reflecting the relative content of total water,immobilized water and free water, respectively.*Correlation is significant at the0.05level.**Correlation is significant at the0.01level.46 C.Xu et al./Journal of Food Engineering136(2014)42–47system with low viscosity and so the T g was nearly independent of moisture content.During dehydration initiated by FID,free water in vacuoles was mostly removed and could shift to the less mobile water(immobilized water in the cytoplasm and extracellular space).Then,the immobilized water was also removed gradually. Thus,the decreased content of the mobility enhancer of cell tissue may cause considerable accumulation of carbohydrates in the space between the cell wall and plasmalemma,the plasmolyzed cytoplasm,and concentrated vacuoles(Hatakeyama et al.,2010). These features were followed by the decreased free volume and in-creased local viscosity of the matrix,which could decrease the mobility of the matrix.Collectively,the T g of samples was elevated. The curves in Fig.6indicated intuitively that the T g increased with increasing solid content in samples containing only immobilized water.Another reason for the increased T g may be the shift from immobilized water to bound water,which has a fast proton chem-ical exchange effect with hydroxyl protons on the polysaccharides in the rigid cell wall(e.g.,pectin).Pectin possesses three types of hydrophilic groups in its molecular structure that can reduce the dynamic mobility of surrounding water and increase local viscosity (Einhorn-Stoll et al.,2012).Therefore,we suggest that the water state exerts a significant impact on the T g of FID–treated carrots, and that the T g increases appreciably according to the decreased content of immobilized water.4.ConclusionsA combination of DSC and NMR was applied to investigate the effect of FID on the state of water and T g in carrots.FID caused dramatic changes in the water state in dehydrated carrot tissues. The water state exerted a significant impact on the T g of FID–dehy-drated carrots.Besides,FID enhanced the T g appreciably according to the decreased content of immobilized water in the cytoplasm and extracellular space,which could be due to the decreased mobility of the matrix in cells.AcknowledgmentThis work was supported by a grant from the National Natural Science Foundation of China(Grant number31271909).ReferencesBai,Y.,Rahman,M.S.,Perera,C.O.,Smith,B.,Melton,L.D.,2001.State diagram of apple slices:glass transition and freezing curves.Food Res.Int.34(2),89–95. Baysal,T.,Icier,F.,Ersus,S.,Yıldız,H.,2003.Effects of microwave and infrared drying on the quality of carrot and garlic.Eur.Food Res.Technol.218(1),68–73. Doymaz,I.,2004.Convective air drying characteristics of thin layer carrots.J.Food Eng.61,359–364.Einhorn-Stoll,U.,Hatakeyama,H.,Hatakeyama,T.,2012.Influence of pectin modification on water binding properties.Food Hydrocolloids27(2),494–502. Fan,L.P.,Zhang,M.,Mujumdar,A.S.,2005.Vacuum frying of carrot chips.Drying Technol.23,645–656.Giannakourou,M.C.,Taoukis,P.S.,2003.Stability of dehydrofrozen green peas pretreated with nonconventional osmotic agents.J.Food Sci.68(6),2002–2010. Goula,A.M.,Adamopoulos,K.G.,2010.Kinetic models of b-carotene degradation during air drying of carrots.Drying Technol.28(6),752–761.Goula, A.M.,Karapantsios,T.D.,Achilias, D.S.,Adamopoulos,K.G.,2008.Water sorption isotherms and glass transition temperature of spray dried tomato pulp.J.Food Eng.85(1),73–83.Guizani,N.,Al-Saidi,G.S.,Rahman,M.S.,Bornaz,S.,Al-Alawi, A.A.,2010.State diagram of dates:glass transition,freezing curve and maximal-freeze-concentration condition.J.Food Eng.99(1),92–97.Gussoni,M.,Greco,F.,Vezzoli,A.,Paleari,M.A.,Moretti,V.M.,Lanza,B.,Zetta,L., 2007.Osmotic and aging effects in caviar oocytes throughout water and lipid changes assessed by1H NMR T1and T2relaxation and MRI.Magn.Reson.Imaging25(1),117–128.Hatakeyama,T.,Tanaka,M.,Hatakeyama,H.,2010.Thermal properties of freezing bound water restrained by polysaccharides.J.Biomater.Sci.Polym.Ed.21(14), 1865–1875.Hills, B.P.,Nott,K.P.,1999.NMR studies of water compartmentation in carrot parenchyma tissue during drying and freezing.Appl.Magn.Reson.17(4),521–535.Hills, B.P.,Remigereau, B.,1997.NMR studies of changes in subcellular water compartmentation in parenchyma apple tissue during drying and freezing.Int.J.Food Sci.Technol.32(1),51–61.Kasapis,S.,2006.Definition and application of the network glass transition temperature.Food Hydrocolloids20,218–228.Kocabiyik,H.,Tezer,D.,2009.Drying of carrot slices using infrared radiation.Int.J.Food Sci.Technol.44(5),953–959.Li,X.,Ma,L.Z.,Tao,Y.,Kong,B.H.,Li,P.J.,2012.Lowfield-NMR in measuring water mobility and distribution in beef granules during drying process.Adv.Mater.Res.550,3406–3410.Lin,Y.P.,Lee,T.Y.,Tsen,J.H.,King,V.,2007.Dehydration of yam slices using FIR-assisted freeze drying.J.Food Eng.79(4),1295–1301.Lin,Y.P.,Tsen,J.H.,King,V.,2005.Effects of far-infrared radiation on the freeze-drying of sweet potato.J.Food Eng.68(2),249–255.Lowithun,N.,Charoenrein,S.,2009.Influence of osmodehydrofreezing with different sugars on the quality of frozen rambutan.Int.J.Food Sci.Technol.44(11),2183–2188.Moraga,G.,Martínez-Navarrete,N.,Chiralt,A.,2006.Water sorption isotherms and phase transitions in kiwifruit.J.Food Eng.72(2),147–156.Rahman,M.S.,Sablani,S.S.,Al-Habsi,N.,Al-Maskri,S.,Al-Belushi,R.,2005.Statediagram of freeze-dried garlic powder by differential scanning calorimetry and cooling curve methods.J.Food Sci.70(2),E135–E141.Rucin´ska-Sobkowiak,R.,Nowaczyk,G.,Krzesłowska,M.,Rabe˛da,I.,Jurga,S.,2012.Water status and water diffusion transport in lupine roots exposed to lead.Environ.Exp.Bot..Shao,X.L.,Li,Y.F.,2011.Application of low-field NMR to analyze water characteristics and predict unfrozen water in blanched sweet corn.Food Bioprocess Technol.,1–7.Shi,Q.L.,Wang,X.H.,Zhao,Y.,Fang,Z.,2012.Glass transition and state diagram for freeze-dried Agaricus bisporus.J.Food Eng.111(4),667–674.Symaladevi,R.M.,Sablani,S.S.,Tang,J.,Powers,J.,Swanson, B.G.,2009.State diagram and water adsorption isotherm of raspberry(Rubus idaeus).J.Food Eng.91(3),460–467.Wang,H.,Zhang,S.,Chen,G.,2008.Glass transition and state diagram for fresh and freeze-dried Chinese gooseberry.J.Food Eng.84(2),307–312.Wang,J.,Sheng,K.,2006.Far-infrared and microwave drying of peach.LWT-Food Sci.Technol.39(3),247–255.Wang,Y.,Zhang,M.,Mujumdar,A.S.,Mothibe,K.J.,2012.Experimental investigation and mechanism analysis on microwave freeze drying of stem lettuce cubes in a circular conduit.Drying Technol.30(11–12),1377–1386.Xin,Y.,Zhang,M.,Adhikari,B.,2013.Effect of trehalose and ultrasound-assisted osmotic dehydration on the state of water and glass transition temperature of broccoli(Brassica oleracea l.var.botrytis l.).J.Food Eng.119(3),640–647. Zielinska,M.,Markowski,M.,2007.Drying behavior of carrots dried in a spout-fluidized bed dryer.Drying Technol.25,261–270.C.Xu et al./Journal of Food Engineering136(2014)42–4747。
分子动力学模拟水分对小分子糖玻璃态转变温度及扩散性质的影响
分子动力学模拟水分对小分子糖玻璃态转变温度及扩散性质的影响周国辉,刘成梅,万婕,艾亦旻,王玲华,罗达文(南昌大学食品科学与技术国家重点实验室,江西南昌 330047)摘要:为了预测水分对蔗糖、海藻糖等小分子糖玻璃态温度和扩散系数的影响,在恒温恒压(NPT)系综和COMPASS力场条件下,利用分子动力学模拟方法,通过模拟小分子糖体系在180~460 K温度范围内的比体积,与对应的温度作图,获得不同水分含量下小分子糖的玻璃态转变温度;在298 K下,模拟得到在不同水分含量下糖体系中水分子的均方位移(MSD),分析了水分对小分子糖扩散性质的影响;同时研究了温度为298 K,水分含量为5.0%时,小分子糖体系中氧原子与水中氧原子之间的径向分布函数。
研究结果表明:在相同水分含量下,海藻糖的玻璃态转变温度大于蔗糖,海藻糖与水分子形成氢键的能力要大于蔗糖;随着水分含量的增加,两种糖模型的T g都呈现显著下降趋势,水分子更容易在糖模型中扩散,与糖分子发生相互作用的概率增大。
关键词:分子动力学;玻璃态转变温度;蔗糖;海藻糖;扩散系数;径向分布函数文章篇号:1673-9078(2014)9-154-160 DOI: 10.13982/j.mfst.1673-9078.2014.09.026 Effect of Moisture Content on Glass Transition Temperature andDiffusion Properties of Low-molecular-weight Sugars by MolecularDynamics SimulationZHOU Guo-hui, LIU Cheng-mei, WAN Jie, AI Yi-min, WANG Ling-hua, LUO Da-wen (State Key Laboratory of Food Science and Technology, Nanchang University, Nanchang 330047, China) Abstract: In this study, the effect of different moisture contents on glass transition temperature (T g) and diffusion properties of low-molecular-weight sugars (such as sucrose and trehalose) were evaluated, using the COMPASS force field and isothermal-isobaric (NPT) ensemble. Molecular dynamics simulation was used to obtain the glass transition temperatures of sugars by simulating a plot of the specific volume of low-molecular-weight sugar in a temperature range of 180 K to 460 K versus the corresponding temperature. At 298 K, the mean square displacement (MSD) of water molecules in the sugar systems with varying moisture content was simulated, and the effect of moisture content on the diffusion properties was analyzed. In addition, when the temperature was 298K and the moisture content was 5%, the radial distribution function (RDF) of ox ygen atoms in water and in the low-molecular-weight sugar system was studied. The results indicated that the value of T g and the ability to form hydrogen bonds with water molecules were higher for trehalose than for sucrose at the same moisture content. With increasing moisture content, the value of T g in the two sugar models showed a significant downward trend, water molecules more easily diffused into the sugar systems, and the chance to interact with sugar molecules increased.Key words: molecular dynamics; glass transition temperature; sucrose; trehalose; diffusion coefficient; radial distribution function玻璃化转变是指非晶态物质从玻璃态到橡胶态或橡胶态到玻璃态的转变,其转变温度称之为玻璃化转变温度(T g),其与物质储藏稳定性有着重要的联系[1]。
- 1、下载文档前请自行甄别文档内容的完整性,平台不提供额外的编辑、内容补充、找答案等附加服务。
- 2、"仅部分预览"的文档,不可在线预览部分如存在完整性等问题,可反馈申请退款(可完整预览的文档不适用该条件!)。
- 3、如文档侵犯您的权益,请联系客服反馈,我们会尽快为您处理(人工客服工作时间:9:00-18:30)。
13Journal of Radioanalytical and Nuclear ChemistryAn International Journal Dealing with All Aspects and Applications of Nuclear ChemistryISSN 0236-5731Volume 292Number 2J Radioanal Nucl Chem (2012)292:853-857DOI 10.1007/s10967-011-1523-yInfluence of dry density on HTO diffusion in GMZ bentoniteT. Wu, W. Dai, G. P. Xiao, F. J. Shu,J. Yao & J. Y. LiYour article is protected by copyright andall rights are held exclusively by Akadémiai Kiadó, Budapest, Hungary. This e-offprint is for personal use only and shall not be self-archived in electronic repositories. If youwish to self-archive your work, please use the accepted author’s version for posting to your own website or your institution’s repository. You may further deposit the accepted author’s version on a funder’s repository at a funder’s request, provided it is not made publicly available until 12 months after publication.13Influence of dry density on HTO diffusion in GMZ bentoniteT.Wu •W.Dai •G.P.Xiao •F.J.Shu •J.Yao •J.Y.LiReceived:17October 2011/Published online:8November 2011ÓAkade´miai Kiado ´,Budapest,Hungary 2011Abstract With the low permeability and high swelling property,Gaomiaozi (GMZ)bentonite is regarded as the favorable candidate backfilling material for a potential repository.The diffusion behaviors of HTO in GMZ ben-tonite were studied to obtain effective diffusion coefficient (D e )and accessible porosity (e )by through-and out-dif-fusion experiments.A computer code named Fitting for diffusion coefficient (FDP)was used for the experimental data processing and theoretical modeling.The D e and e values were (5.2–11.2)910-11m 2/s and 0.35–0.50at dry density from 1,800to 2,000kg/m 3,respectively.The D e values at 1,800kg/m 3was a little higher than that of at 2,000kg/m 3,whereas the D e value at 1,600kg/m 3was significantly higher (approximately twice)than that of at 1,800and 2,000kg/m 3.It may be explained that the dif-fusion of HTO mainly occurred in the interlayer space for the highly compacted clay (dry density exceeding 1,300kg/m 3).1,800and 2,000kg/m 3probably had similar interlayer space,whereas 1,600kg/m 3had more.Both D e and e values decreased with increasing dry density.Forcompacted bentonite,the relationship of D e and e could be described by Archie’s law with exponent n =4.5±1.0.Keywords HTO ÁAccessible porosity ÁEffective diffusion coefficient ÁGMZ bentoniteIntroductionIn China,Gaomiaozi (GMZ)bentonite has been studied as the potential backfill material in the high-level nuclear waste repository [1–4].It was selected for the Chinese program mainly according to its mineralogy composition and the quarry reserve [5].The physical and chemical properties like mineralogy and composition,hydraulic behavior,mechanical properties were performed on GMZ bentonite [5–8].They are different compared to relatively well studies reference bentonite,such as MX-80(USA,Switzerland and Sweden),Fo-Ca (France),FEBEX (Spain)and Kunigel V1(Japan)[9–11].To our knowledge,only a few studies have reported the investigation of radionuclides diffusion in GMZ bentonite.The interaction of radionuc-lides with GMZ bentonite should be investigated inten-sively before it is used as the backfill material.Porosity is the fundamental parameters for modeling the migration behavior of radionuclides for the risk assessment of repository [12].In compacted clays,not all the pores are interconnected or contribute to flow,part of pores is available for diffusion.Accessible porosity (e )is used to describe the transport of radionuclides [12–14].However,e of compacted GMZ bentonite is scare.In this study,the effect of dry density on the diffusion of HTO was inves-tigated in GMZ bentonite by through-and out-diffusion methods to determine e and effective diffusion coefficient (D e ).Moreover,the relationship of e and D e for HTO wasT.Wu (&)Department of Chemistry,Huzhou Teachers College,Huzhou 313000,People’s Republic of China e-mail:twu@W.Dai ÁG.P.Xiao ÁF.J.Shu ÁJ.Yao ÁJ.Y.Li China Institute of Atomic Energy,P.O.Box 275(88),Beijing 102413,People’s Republic of China W.DaiEast China Institute of Technology,Fuzhou,Jiangxi,People’s Republic of ChinaJ.Y.LiChina Resources New Energy Group Co.,Ltd.,Hong Kong,People’s Republic of China123J Radioanal Nucl Chem (2012)292:853–857DOI 10.1007/s10967-011-1523-ycompared between GMZ and other bentonite.The results may be helpful to estimate D e of neutral ions for a given type of bentonite.Materials and methodsDiffusion experimentGMZ bentonite(contains75.4wt%montmorillonite)[7] used was obtained from Beijing research institute of ura-nium geology without further processing.It was compacted to dry densities of1,600,1,800and2,000kg/m3,respec-tively.All experiments were carried out in artificial pore water of Gansu Beishan at room temperature.In diffusion experiments,0.003M NaN3was added in the pore water to stop bacterial growth.The diffusion set-up and experimental procedure were the same as that of used for through-and out-diffusion experiments[15].The compacted GMZ bentonite(diame-ter:2.54cm,thickness:0.86±0.1cm)was sandwiched between two stainlessfilter plates(thickness0.158cm, diameter 2.54cm,porosity0.3).For through-diffusion experiment,HTO was put in a in-reservoir with200mL whereas the out-reservoir had a volume20mL.Both out-reservoirs had a volume20mL for out-diffusion.The samples were measured by liquid scintillation counting (Perkin Elmer Tri-Carb3170TR/SL).5mL of sample was placed in a20mL polyethylene counting vial and13mL scintillation cocktail(Packard LLT USA)was added.The counting efficiency was0.42±0.01.Diffusion theoryThe D e value can be calculated using Fick’s second law for one-dimensional non-steady state diffusion by the follow-ing equation:o c o t ¼D eao2co x2;ð1Þwhere c(M or Bq/m3)is the radionuclide concentration or activity in water;t(s)is the diffusion time;x(m)is the diffusion distance;D e(m2/s)is the effective diffusion coefficient;a is the rock capacity factor.The analytical solution of accumulated activity of the tracer permeated through bentonite is given based on fol-lowing boundary and initial conditions:c x;tðÞ¼0;t¼0;8x;c0;tðÞ¼C0;x¼0;t[0;c L;tðÞ¼0;x¼L;t[0A L;tðÞ¼SÁLÁC0D eÁtLÀa6À2ÁapX1n¼1À1ðÞnnÁexpÀD eÁn2Áp2ÁtLÁa&'!ð2Þhere L(m)is the sample thickness;C0(Bq/m3)is the initial concentration of the radionuclide.A(L,t)(Bq)is the total amount of radionuclide diffused through a boundary at x=L at diffusion time t;S(m2)is the cross section area of the sample.Theflux is calculated by following equation:JðL;tÞ¼1SÁo Ao t:ð3Þwhere J(L,t)is theflux at the low-concentration boundary (x=L).The out-diffusion experiment is described by a one-dimensional single porosity medium model[15].The governing equations are:J0;tðÞ¼2ÁD eÁC0LÁX1n¼1eÀnÁp LðÞ2ÁD e aÁt at x¼0;ð4ÞJ L;tðÞ¼2ÁD eÁC0LÁX1n¼1À1ðÞnÁeÀnÁp LðÞ2ÁD e aÁt at x¼L;ð5Þwhere J(0,t)is theflux at the high-concentration boundary (x=0).The experimental data processing in through-and out-diffusion experiments has been described previously[15–17].Fitting for diffusion coefficient(FDP)was used for the experimental and modeling data processing[17,18].Results and discussionThe through-diffusion method includes transient and steady states.The diffusion parameters D e and a were determined by modeling the experimental data of both transient and steady-state phases using Eq.2.Figure1showed the accumulated activity as a function of diffusion time obtained by through-diffusion experiments of HTO at 1,600,1,800and2,000kg/m3dry densities,respectively. The accumulated activity increased with time,becoming a linear function of time at the steady phase.The slope of 1,600kg/m3was significantly higher than that of1,800and 2,000kg/m3,indicating that more HTO passed through the thickness of0.87±0.1cm compacted bentonite at dry density of1,600kg/m3.Figure2showedflux as a function of diffusion time. The shaded area represented the uncertainty of the calcu-lated curve.It was a typical shape which consisted of854T.Wu et al. 123transient and steady phases.The flux increases with dif-fusion time at the transient phase and becomes constant at the steady phase.In the transient phase,the flux depends on diffusion time,D e and a ,whereas in the steady state the flux depends only on D e .The experimental data of flux as a function of diffusion time were in good agreement with the modeled data.It showed that flux of 1,600kg/m 3was higher than that of 1,800and 2,000kg/m 3.1,600kg/m 3reached the steady state after circa 1.5days,while 1,800and 2,000kg/m 3took longer time (circa 3days)to reach it.Figure 3showed the flux as a function of time obtained by the out-diffusion experiments.The D e and a were determined by modeling the experimental data using Eqs.4and 5.The first 3experimental did not fit well with the modeled data at both high and low concentration sides.The main problem might come from the activity in deadvolume,the uncertainty of the solution volume and the measurement,whereas it agreed with each other at boundary x =L and x =0after first 3data (circa 1day).HTO was diffused out of GMZ bentonite after circa 6days.Since HTO is a neutral ion,the sorption effect can be neglect,i.e.K d =0,a is equal to e .The accessible porosity e (-)was calculated by following equation:a ¼e þq ÁK dð6Þwhere K d (m 3/kg)is the distribution coefficient;q (kg/m 3)is the bulk dry density.The results showed that both D e and e were decreased with increasing dry density.The e values obtained from out-diffusion experiments were systemically higher than the porosity value derived from the correspond-ing through-diffusion experiments.It may be explained by the heterogeneous distribution of total water and anion-accessible porosities between the boundary and central zones of the clay.Similar results were found in the diffusion of neutral and negative ions in compacted Volclay KWK ben-tonite [19]and Kunigel V1bentonite [13].However,this discrepancy was within the range of error.The diffusion behavior of HTO could still be considered as consistency during the through-and out-diffusion procedure.Table 1summarized the diffusion parameters D e and e for HTO.The total porosity e tot (-)was calculated by following equation:e tot ¼1Àqq s ð7Þwhere q s (kg/m 3)is the grain density.GMZ bentonite of q s equals 2,660kg/m 3[5].For the neutral and positive ions,the accessible porosity is equal to the total porosity.However,e obtained by both through-and out-diffusion method were system higher than e tot .Similar results were found in compacted FEBEX bentonite [20].It may be explained by following two reasons:1.e tot waschangedFig.1Measured (symbols )and fit (lines )A cum versus time for 1,600,1,800and 2,000kg/m 3compacted bentonite by through-diffusionmethodsFig.2Measured (symbols )and expect (lines )flux versus time for 1,600,1,800and 2,000kg/m 3compacted bentonite by through-diffusionmethodsFig.3Out-diffusion of HTO in GMZ bentonite at 1,600,1,800and 2,000kg/m 3dry densityInfluence of dry density855123when the clay was consolidated.2.The volume of com-pacted clay increased when it was contacted with water.The dry density decreased.As can be also observed,the D e values at 1,800kg/m 3was a little higher than that of at 2,000kg/m 3,whereas the D e value at 1,600kg/m 3were significantly higher (approximately twice)than that of at 1,800and 2,000kg/m 3.The pore space of water-saturated bentonite can be divided into ‘macropore’and ‘interlayer nanopore’compartments [21].The interlayer water forms more than 90%of the total water volume at dry density exceed 1,300kg/m 3[22],the diffusion of HTO may occur mainly in the interlayer space of the porous clay.Van Loon et al.[19]reported that the interlayer water was reduced from 3to 2layers of water between 1,300and 1,800kg/m 3for bentonite.Above 1,800kg/m 3,it is decreases from 2-layer to 1-layer hydrate and the percentage of 1-layer hydrate increases with increasing dry density.Thus,the dry density of GMZ bentonite at 1,800and 2,000kg/m 3may have similar interlayer space.And the dry density of GMZ bentonite at 1,600kg/m 3may have more.Figure 4showed the effective diffusion coefficient as a function of accessible porosity (solid dots)and the density as a function of accessible porosity (empty dots).For a given type of porous medium [19,23],D e can be related to the bulk water diffusion coefficient D w (2.3910-9m 2/s)and e by an empirical relationship analogous to Archie’s law:D e ¼D w Áe nð8Þwhere n is the cementation factor and has a constant value related to a given type of porous medium.The relationship of D e and e has also been compared between GMZ and other previously published bentonite [20,24–28].All measured D e and e are within the proposed uncertainly ranges with n =4.5±1.0.ConclusionsThe diffusion behavior of HTO in GMZ bentonite was investigated by through-and out-diffusion methods at dry density of 1,600,1,800and 2,000kg/m 3,respectively.D e and e were obtained by modeling both through-and out-diffusion experimental data with a computer code FDP.The D e values at 1,800kg/m 3was a little higher and that of at 2,000kg/m 3,whereas the D e value at 1,600kg/m 3were significantly higher (approximately twice)than that of at 1,800and 2,000kg/m 3,indicating that the diffusion of HTO mainly occurred in the interlayer space at highly compacted clay (dry density exceeding 1,300kg/m 3).And the interlayer space was decreased from 3-layers to 2-layers of water at 1,600kg/m 3and from 2-layers to 1-layer of water at 1,800and 2,000kg/m 3,respectively.e obtained by out-diffusion was systematically higher than that by through-diffusion,it could be explained that the heterogeneous distribution of total water porosity between the boundary and central zones of the clay.However,the discrepancy was within the range of error.The diffusion behavior of HTO in GMZ bentonite could be considered as consistency during the through-and out-diffusion pro-cedure.Both D e and e decreased with increasing dry density.The relationship of D e and e can be explained by Archie’s law with exponent n =4.5±1.0for bentonite.The effective diffusion coefficient of non-reactive species can be estimated from the knowledge of both e and the corresponding exponent n .Acknowledgments This work was financially supported by Qianjiang talents project in Zhejiang province and Project supported by the Scientific Research Starting Foundation for Returned Overseas Chinese Scholars,Ministry of Education,China.Table 1Diffusion parameters for HTO in GMZ bentonite q (kg/m 3)C 0(9109Bq/m 3)D e (910-11m 2/s)a e aD e (910-11m 2/s)b e be tot 1,600±50 1.47±0.0711.2±0.60.44±0.029.4±0.60.50±0.020.401,800±50 1.48±0.07 5.9±0.30.40±0.02 6.2±0.30.43±0.020.322,000±501.43±0.065.2±0.40.35±0.025.8±0.30.38±0.020.25a Measured in through-diffusion bMeasured inout-diffusionFig.4The effective diffusion coefficient of HTO as a function of accessible porosity856T.Wu et al.123References1.Chen L,Gao B,Lu SS,Dong YH(2011)Sorption study of ra-dionickel on attapulgite as a function of pH,ionic strength and temperature.J Radioanal Nucl Chem288(3):851–8582.Dong YH,Liu ZJ,Li YY(2011)Effect of pH,ionic strength,foreign ions and humic substances on Th(IV)sorption to GMZ bentonite studied by batch experiments.J Radioanal Nucl Chem 289(1):257–2653.Hu J,Xie Z,He B,Sheng GD,Chen CL,Li JX,Chen YX,WangXK(2010)Sorption of Eu(III)on GMZ bentonite in the absence/ presence of humic acid studied by batch and XAFS techniques.Sci China Chem53(6):1420–14284.Li JX,Hu J,Sheng GD,Zhao GX,Huang Q(2009)Effect of pH,ionic strength,foreign ions and temperature on the adsorption of Cu(II)from aqueous solution to GMZ bentonite.Colloid Surf A 349(1–3):195–2015.Ye WM,Cui YJ,Qian LX,Chen B(2009)An experimental studyof the water transfer through confined compacted GMZ bentonite.Eng Geol108(3–4):169–1766.Wang SW,Dong YH,He ML,Chen L,Yu XJ(2009)Charac-terization of GMZ bentonite and its application in the adsorption of Pb(II)from aqueous solutions.Appl Clay Sci43(2):164–171 7.Wen ZJ(2008)Selection and basic properties of the buffermaterial for high-level radioactive waste repository in China.Acta Geol Sin-Engl82(5):1050–10558.Ye WM,Chen YG,Chen B,Wang QO,Wang J(2010)Advanceson the knowledge of the buffer/backfill properties of heavily-compacted GMZ bentonite.Eng Geol116(1–2):12–209.Garcia-Gutierrez M,Cormenzana JL,Missana T,Mingarro M(2004)Diffusion coefficients and accessible porosity for HTO and Cl-36in compacted FEBEX bentonite.Appl Clay Sci 26(1–4):65–7310.Liu ZJ,Chen L,Dong YH,Zhang ZC(2011)Impact of envi-ronmental conditions on the sorption behavior of Co(II)on Na-rectorite studied by batch experiments.J Radioanal Nucl Chem 289(3):851–85911.Sato H,Suzuki S(2003)Fundamental study on the effect of anorientation of clay particles on diffusion pathway in compacted bentonite.Appl Clay Sci23(1–4):51–6012.Montavon G,Guo Z,Tournassat C,Grambow B,Le Botlan D(2009)Porosities accessible to HTO and iodide on water-satu-rated compacted clay materials and relation with the forms of water:a lowfield proton NMR study.Geochim Cosmochim Acta 73(24):7290–7302.doi:10.1016/j.gca.2009.09.01413.Glaus MA,Frick S,Rosse R,Van Loon LR(2011)Consistentinterpretation of the results of through-,out-diffusion and tracer profile analysis for trace anion diffusion in compacted montmo-rillonite.J Contam Hydrol123(1–2):1–1014.Montavon G,Alhajji E,Grambow B(2006)Study of the inter-action of Ni2?and Cs?on MX-80bentonite;Effect of compac-tion using the‘‘capillary method’’.Environ Sci Technol 40(15):4672–467915.Van Loon LR,Soler JM(2004)Diffusion of HTO,36Cl-,125I-and22Na?in opalinus clay:effect of confining pressure,sample orientation,sample depth and temperature.PSI Bericht Nr04-03 16.Van Loon LR,Soler JM,Bradbury MH(2003)Diffusion of HTO,36Cl-and125I-in opalinus clay samples from Mont Terri—effect of confining pressure.J Contam Hydrol61(1–4):73–8317.Wu T,Amayri S,Drebert J,Van Loon LR,Reich T(2009)Neptunium(V)sorption and diffusion in opalinus clay.Environ Sci Technol43(17):6567–6571.doi:10.1021/es900856818.Wu T,Amayri S,Drebert J,Loon LRV,Reich T(2010)Deter-mination of diffusion parameters by a computer code based on Mathematica6.0.Paper presented at the Proceedings of the18th International Conference on Nuclear Engineering,ICONE18-29334,Xi’an,China19.Van Loon LR,Glaus MA,Muller W(2007)Anion exclusioneffects in compacted bentonites:towards a better understanding of anion diffusion.Appl Geochem22(11):2536–255220.Garcia-Gutierrez M,Cormenzana JL,Missana T,Mingarro M,Molinero J(2006)Overview of laboratory methods employed for obtaining diffusion coefficients in FEBEX compacted bentonite.J Iber Geo32(1):37–5321.Bourg IC,Sposito G,Bourg ACM(2006)Tracer diffusion incompacted,water-saturated bentonite.Clay Clay Miner54(3): 363–37422.Pusch R,Karnland O,Hoekmark H(1990)GMM—a generalmicrostructural model for qualitative and quantitative studies of smectite clays.SKB Technical Report90–43,Swedish Nuclear Fuel and Waste Management Corporation,Stockholm23.Descostes M,Blin V,Bazer-Bachi F,Meier P,Grenut B,RadwanJ,Schlegel ML,Buschaert S,Coelho D,Tevissen E(2008)Dif-fusion of anionic species in Callovo-Oxfordian argillites and Oxfordian limestones(Meuse/Haute-Marne,France).Appl Geo-chem23(4):655–67724.Garcia-Gutierrez M,Missana T,Mingarro M,Samper J,Dai Z,Molinero J(2001)Solute transport properties of compacted Ca-bentonite used in FEBEX project.J Contam Hydrol47(2–4): 127–13725.Glaus MA,Frick S,Rosse R,Van Loon LR(2010)Comparativestudy of tracer diffusion of HTO,22Na?and36Cl-in compacted kaolinite,illite and montmorillonite.Geochim Cosmochim Acta 74(7):1999–201026.Choi JW,Oscarson DW(1996)Diffusive transport throughcompacted Na-and Ca-bentonite.J Contam Hydrol22(3–4): 189–20227.Kozaki T,Sato Y,Nakajima M,Kato H,Sato S,Ohashi H(1999)Effect of particle size on the diffusion behavior of some radio-nuclides in compacted bentonite.J Nucl Mater270(1–2):265–272 28.Szanto Z,Svingor E,Molnar M,Palcsu L,Futo I,Szucs Z(2002)Diffusion of3H,99Tc,125I,36Cl and85Sr in granite,concrete and bentonite.J Radioanal Nucl Chem252(1):133–138Influence of dry density857123。