Borcade FC SWITCH Troubleshooting
艾肯饮水机说明书
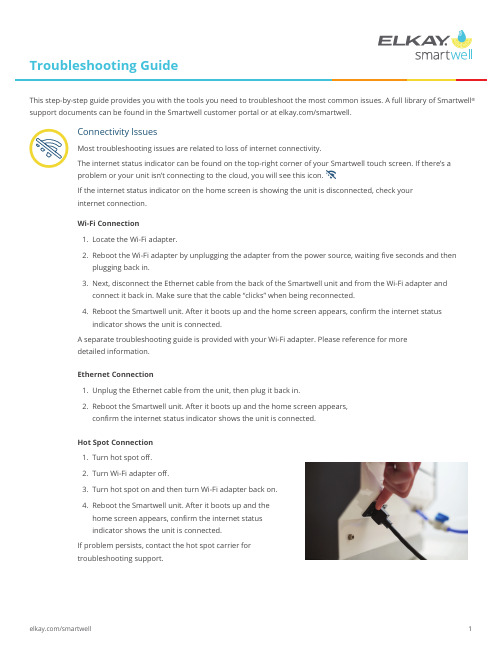
Most troubleshooting issues are related to loss of internet connectivity.The internet status indicator can be found on the top-right corner of your Smartwell touch screen. If there’s a problem or your unit isn’t connecting to the cloud, you will see this icon.If the internet status indicator on the home screen is showing the unit is disconnected, check yourinternet connection.Wi-Fi Connection1. Locate the Wi-Fi adapter.2. Reboot the Wi-Fi adapter by unplugging the adapter from the power source, waiting fi ve seconds and thenplugging back in.3. Next, disconnect the Ethernet cable from the back of the Smartwell unit and from the Wi-Fi adapter andconnect it back in. Make sure that the cable “clicks” when being reconnected.4. Reboot the Smartwell unit. After it boots up and the home screen appears, confi rm the internet statusindicator shows the unit is connected.A separate troubleshooting guide is provided with your Wi-Fi adapter. Please reference for moredetailed information.Ethernet Connection1. Unplug the Ethernet cable from the unit, then plug it back in.2. Reboot the Smartwell unit. After it boots up and the home screen appears,confi rm the internet status indicator shows the unit is connected.Hot Spot Connection1. Turn hot spot off .2. Turn Wi-Fi adapter off .3. Turn hot spot on and then turn Wi-Fi adapter back on.4. Reboot the Smartwell unit. After it boots up and thehome screen appears, confi rm the internet statusindicator shows the unit is connected.If problem persists, contact the hot spot carrier fortroubleshooting support.Connectivity IssuesThis step-by-step guide provides you with the tools you need to troubleshoot the most common issues. A full library of Smartwell ®support documents can be found in the Smartwell customer portal or at /smartwell.OffOnLow or No Water Flows From the Dispense NozzleThe main water line valve might be closed or not fully opened.1. Twist the blue handle on the check valve (back of unit) parallel to the water line to turn on.OperationalScreen Frozen/Screen Not RespondingReset Smartwell unit using the following procedure below:1. Flip the ON/OFF switch near base of unit to the OFF position to turn power off . Do not unplug the power cord from the wall outlet to turn the unit off .2. To turn power on, wait fi ve seconds and then fl ip the ON/OFF switch to the ON position. It typically takes one minute to reboot. A black screen will be displayed followed by reboot animation.3.When unit is fully rebooted, the home screen will appear and Smartwell is ready for use.All Flavor Icons Unavailable From Touch Screen Each fl avor option will become grayed out when the citric acid pouch is empty.1. Confi rm contents by unlocking the hood and locating the citric acid pouch in the unit.2. Replace with new pouch if citric acid pouch is empty. (See Care and Cleaning Guide for instructions on how to replace a pouch.)3. If you have recently (within a few days) replaced the citric acid pouch, follow the on-screen steps to confi rm the pouch is new to the unit. (See Care and Cleaning Guide for instructions.)4. In the event the fl avor icons do not reappear on the touch screen, restart the unit. If problem persists, contactSmartwell Customer Care.Flavor icons availableFlavor icons unavailableTasteSparkling Water Sputtering or Not DispensingIf still water is dispensing in place of sparkling water or sparkling water is not dispensing correctly, follow these steps to restore sparkling water:1. Turn off the CO 2 tank by turning the knob clockwise.2. Place a large receptacle in the alcove and dispense still water for 20 seconds.3. Select sparkling water and press touch screen to dispense. This will clear the CO 2 gas from the line andunit will start dispensing still water.4. Continue dispensing still water for 20 seconds.5. Reboot the unit and wait for the home screen to appear.6. Turn on the CO 2 tank by turning the knob counterclockwise.7. Select sparkling water and press touch screen to dispense.8. Dispense two to three 8-oz. glasses of sparkling water to ensure the CO 2 is optimally mixed with the water.Wrong Flavor Being DispensedIf the drink you have selected is not dispensing correctly, check to make sure the correct flavorpouch is installed:1. Open the unit and check to make sure the pouch in the flavor slot and the flavor displayed on thetouch screen match up.2. If there’s a mismatch, choose and replace with appropriate pouch from the flavor selection dropdown. (See Care and Cleaning Guide for instructions on how to replace a pouch.)3. Close and lock the unit hood and dispense again to ensure the flavor is correct.Drinks Have Too Much or Not Enough FlavorFollow these steps to modify your flavors content:Flavor Too Concentrated – Drinks Have Too Much Flavor1. Verify that the water line is fully open.2. Navigate to setup screen and modify “Flavor to Water Concentration” screen as desired.3. Exit the settings screen and dispense water again.4. If the issue persists, contact Smartwell Customer Care for additional support.Flavor Too Diluted – Drinks Do Not Have Enough Flavor1. Navigate to setup screen and modify “Flavor to Water Concentration” screen as desired.2. Exit the settings screen and dispense water again.3. If the issue persists, contact Smartwell Customer Care for additional support.Smartwell Customer Care is available via phone at 866.699.4507 or email at***********************,Monday–Friday,7a.m.–5p.m.CST.。
Troubleshooting
Troubleshooting
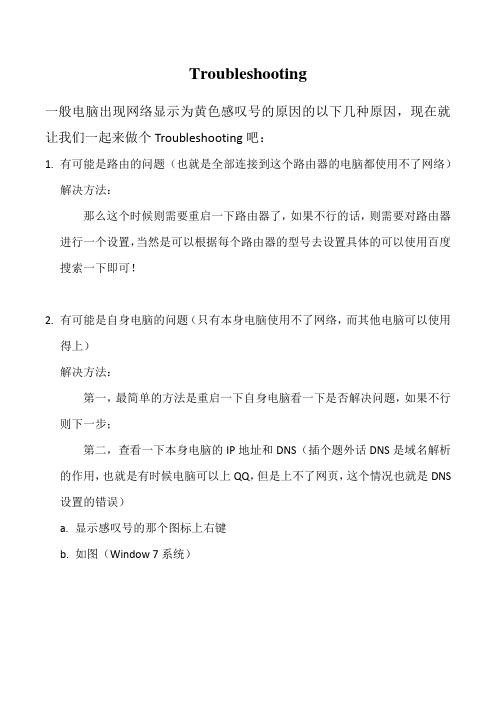
一般电脑出现网络显示为黄色感叹号的原因的以下几种原因,现在就让我们一起来做个Troubleshooting吧:
1.有可能是路由的问题(也就是全部连接到这个路由器的电脑都使用不了网络)
解决方法:
那么这个时候则需要重启一下路由器了,如果不行的话,则需要对路由器进行一个设置,当然是可以根据每个路由器的型号去设置具体的可以使用百度搜索一下即可!
2.有可能是自身电脑的问题(只有本身电脑使用不了网络,而其他电脑可以使用
得上)
解决方法:
第一,最简单的方法是重启一下自身电脑看一下是否解决问题,如果不行则下一步;
第二,查看一下本身电脑的IP地址和DNS(插个题外话DNS是域名解析的作用,也就是有时候电脑可以上QQ,但是上不了网页,这个情况也就是DNS 设置的错误)
a.显示感叹号的那个图标上右键
b.如图(Window 7系统)
c.如图,在右上角处点击更改选配器设置
d.如图,右击“属性”
e.如图,双击Internet协议版本4(TCP/IPv4)
f.如图,一般都会选择自动获取IP地址和DNS,如果不行的话,就按照其他
电脑里的IP地址和DNS设置吧!
这里回归下刚才提的题外话吧
由于DNS的原因使电脑只能上QQ而不能上网页的解决方法为:
根据电信用户、联通用户、或者其他的网络运营商可以百度一下这些网络运营商的DNS进行自己手动设置即可!(记得各大城市的DNS是不同的喔!)
附上深圳电信的DNS为:
202.96.134.133 202.96.128.68 202.96.154.8 202.96.154.15。
trouble-shootingguide故障排除指南
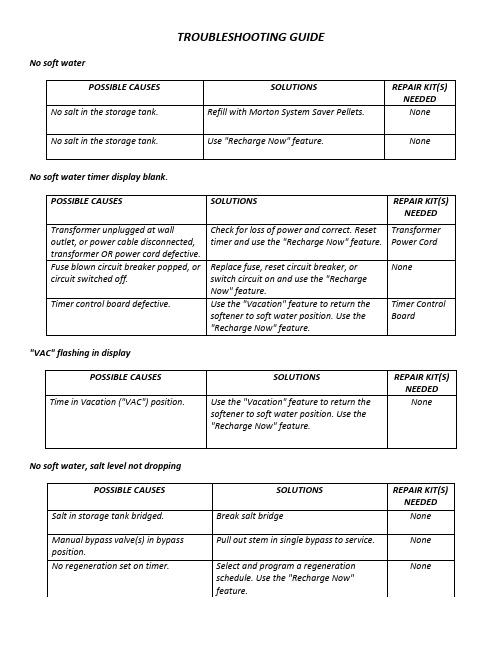
TROUBLESHOOTING GUIDE No soft waterNo soft water timer display blank."VAC" flashing in displayNo soft water, salt level not droppingNo soft water∙Salt storage tank full of water∙Water running to drain while unit in soft water cycle.Water is hard sometimesResin in household plumbing, resin tank leaking.Salt storage tank leakingMotor stalled or clicking.Error code E1, E2, E3 or E4 appears.Below is given annual work summary, do not need friends can download after editor deleted Welcome to visit againXXXX annual work summaryDear every leader, colleagues:Look back end of XXXX, XXXX years of work, have the joy of success in your work, have a collaboration with colleagues, working hard, also have disappointed when encountered difficulties and setbacks. Imperceptible in tense and orderly to be over a year, a year, under the loving care and guidance of the leadership of the company, under the support and help of colleagues, through their own efforts, various aspects have made certain progress, better to complete the job. For better work, sum up experience and lessons, will now work a brief summary.To continuously strengthen learning, improve their comprehensive quality. With good comprehensive quality is the precondition of completes the labor of duty and conditions. A year always put learning in the important position, trying to improve their comprehensive quality. Continuous learning professional skills, learn from surrounding colleagues with rich work experience, equip themselves with knowledge, the expanded aspect of knowledge, efforts to improve their comprehensive quality.The second Do best, strictly perform their responsibilities. Set up the company, to maximize the customer to the satisfaction of the company's products, do a good job in technical services and product promotion to the company. And collected on the properties of the products of the company, in order to make improvement in time, make the products better meet the using demand of the scene.Three to learn to be good at communication, coordinating assistance. On‐site technical service personnel should not only have strong professional technology, should also have good communication ability, a lot of a product due to improper operation to appear problem, but often not customers reflect the quality of no, so this time we need to find out the crux, and customer communication, standardized operation, to avoid customer's mistrust of the products and even the damage of the company's image. Some experiences in the past work, mentality is very important in the work, work to have passion, keep the smile of sunshine, can close the distance between people, easy to communicate with the customer. Do better in the daily work to communicate with customers and achieve customer satisfaction, excellent technical service every time, on behalf of the customer on our products much a understanding and trust.Fourth, we need to continue to learn professional knowledge, do practical grasp skilled operation. Over the past year, through continuous learning and fumble, studied the gas generation, collection and methods, gradually familiar with and master the company introduced the working principle, operation method of gas machine. With the help of the department leaders and colleagues, familiar with and master the launch of the division principle, debugging method of the control system, and to wuhan Chen Guchong garbage power plant of gas machine control system transformation, learn to debug, accumulated some experience. All in all, over the past year, did some work, have also made some achievements, but the results can only represent the past, there are some problems to work, can't meet the higher requirements. In the future work, I must develop the oneself advantage, lack of correct, foster strengths and circumvent weaknesses, for greater achievements. Looking forward to XXXX years of work, I'll be more efforts, constant progress in their jobs, make greater achievements. Every year I have progress, the growth of believe will get greater returns, I will my biggest contribution to the development of the company, believe in yourself do better next year!I wish you all work study progress in the year to come.Procedure for removing error code from faceplate:∙Unplug transformer∙Correct defect∙Plug in transformer.∙Wait for 6 minutes.The error code will return if the defect was not corrected. Press and hold the VAC/RCHG button for 3 seconds as an alternative way to clear an error code.Error code E5 appearsProcedure for removing error code from faceplate:∙Unplug transformer∙Correct defect∙Plug in transformer.∙Wait for 6 minutes.The error code will return if the defect was not corrected. Press and hold the VAC/RCHG button for 3 seconds as an alternative way to clear an error code.Brine tank full of water, No soft water or Not using salt.Solution: Disassemble and clean the nozzle and venturi:Clean all parts using a soft tooth brush, mild soap and warm water. Use resin bed cleaner if parts are iron coated. Rinse with clean fresh water. Do not use any sharp or hard objects to clean bottom of item #6. Remove parts 1-7, 9 and 10. Set parts aside and clean. Reinstall cap (#1) and o-ring (#2).Lift the brine valve assembly (#13) from the brinewell. Remove the plastic clip (#12) and pull the asembly apart. Use the SELECT or TOUCH HOLD button to enter the unit into a manual regeneration and advance the valve to the fill position.As the valve advances into FILL, there will be a flow of water from the tubing. Use this to wash down the brine valve assembly of any excess salt. Also wash down the brine well of excess salt. Move the bypass valve into BYPASS to shut off the flow of water to the valve. Use the toothbrush to thoroughly clean the nozzle and venturi (#6), flow plugs (#5 and #9) and screens (#4, #10 and #11). Carefully clean the flow plug center hole with a small wire.Reassemble all parts in the nozzle venturi. BE SURE #& is installed correctly, numbers up on the flow plugs (#5 and #9). Advance the valve into the BRINE position. Place the bypass valve into service and check for suction on the tubing that connects to the brine valve assembly. If not, recheck the assembly of the nozzle venturi. If suction is now working, reinstall the brine valve assembly and finish the regeneration.VALVE NOT WORKING∙Water running to drain∙Brine tank overflowing∙Motor stalled∙Water leaking from valveSolution: Before you start to service a valve, make sure it is in the service position. Place bypass valve in bypass to shut off water. Loosen 3 of 5 hex screws at top back of valve. This will relieve pressure in the softener.If water is running to drain in service, if brine tank is overflowing, or the motor is not turning the valve (valve stuck):1.Remove the 5 hex screws from the top of the valve and carefully remove the cover. Replace theseal kit parts #9 through #12. Be sure wear strip (#9) is placed on top of rubber seal (#10).Inspect the rotor for wear, scratches or cracks, and replace if needed. Check all o-rings for wear,cuts, flat spots, proper positioning, etc., and replace as needed. Install the valve cover and 5screws. Turn the water on and check to see if failure is corrected.If water is leaking from the top of the valve, or between #3 and #14, replace o-rings 4, 5 and 8. Turn water on and check again for leaks.If the brine tank is overfilling, with little or no water flow from the valve drain hose during regeneration, check flow plug #1, drain elbow #2, and the valve drain hose for obstruction.。
凯镭思互调仪操作手册(中英文)
F
升级标题页添加Summitek/Triasx 商标和联系方式
22/06/09
(IR7317)
Updates. New state editor GUI. (IR7402)
G
升级,新版本的测试设置文件编辑器用户界面
(IR7402)
17/08/09
Authorisation 批准
PDS PDS PDS TN
B
removed.
17/04/08
升级1.3.2和1.3.5 删除USB窗口
Changes to section 1.5 by adding report number to the state
C
editor GUI.
16/05/08
升级1.5在测试设置文件编辑器中添加报告编号
Changes to AC specifications in section 1.2 and section
WA R N I N G- RF HAZARD 警告—射频危害
This equipment is designed for use in association with radio frequency (RF) radiating systems and is capable of producing up to 50W of RF power in the 800 to 2200 MHz region. Users are reminded that proper precautions must be taken to minimise exposure to these RF fields to the recommended limits. Please pay particular care to the following areas: 此设备设计用于无线电射频(RF)发射系统,能够在800至2200兆赫的射频区域内 产生高达50瓦的射频功率(RF)。用户应注意,必须采取适当的预防措施,尽量 减少暴露在射频区域里,保持在建议的范围内。请特别注意以下几个方面:
GSM TROUBLESHOOTING
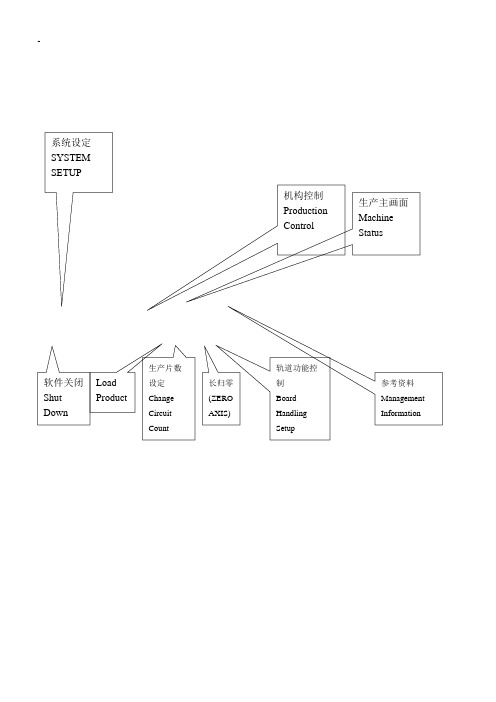
-机构控制Production Control 生产主画面Machine Status参考资料ManagementInformation软件关闭Shut Down LoadProduct生产片数设定ChangeCircuitCount长归零(ZEROAXIS)轨道功能控制BoardHandlingSetup系统设定SYSTEM SETUP2. 异常处理2-1 Reject Station 异常处理当有零件拋在Reject Station上时,此时机台停止生产,并显示下列讯息。
处理程序:将Bear Reject 上的零件移除按下Reject Station RESET 按钮按下画面中的OK。
2-2Fiducial Mark 异常处理当PCB进板不顺,导致PCB未到达定位,或PCB MARK反光度不足,此时PEC CAMERA 无法辨识,则画面出现下列讯息。
选择调整距离Mark Point处理程序:点选Increment决定想要调整的距离,并按下微调坐标轴按钮将坐标轴调整到Mark 点中心位置点选Alignment Done 确定坐标轴调整到Mark 点中心位置点选OK 此时机台开始生产,当此片生产完毕时,请务必确认零件座位置是否偏移。
2-3 卡板异常处理 (Board Handling Errors)讯息:Transfer error in zone <zone #> with no automatic recovery possible当一PCB进板不顺时(可能板弯或轨道过宽),导致PCB无法到达Main Table定点位置,而发生卡板讯息。
ZONE 2ZONE 1ZONE 0处理程序:确认PCB是卡在轨道的那一区(ZONE 0 ,ZONE 1 或ZONE 2)以手动放式将PCB移除鼠标点选Continue 按下机台控制钮start 按钮. 此时机台将重新执行进板动作,并继续生产。
2-4 恢复Feeder生产状态以Track2 Feeder为例,当此Feeder Track 1零件吸完时,机台自动去吸取Track 2上的零件,当补料员完成Track 1上的补料动作时,必须去执行Repair Feeders,以告知机台在此Track Feeder 中的Track 1已有零件可供机台吸取。
troubleshooting 中文
troubleshooting 中文
Troubleshooting指的是故障排除。
在电脑、网络、设备或软件出现问题时,通常需要进行故障排除以找到问题的根源并解决它。
以下是一些常见的故障排除步骤:
1.检查物理连接:检查设备是否连接正确,线缆是否插好。
2.重启设备:尝试关闭并重新打开设备。
3.更新软件:确保软件已更新至最新版本。
4.检查错误消息:查看提示消息,以确定问题的根源。
5.使用网络故障排除工具:例如ping命令、traceroute命令等。
6.联系技术支持:如果以上步骤无法解决问题,请联系设备或软件的技术支持。
故障排除是一个重要的技能,可以帮助您快速解决问题并提高工作效率。
- 1 -。
路由器故障诊断
Troubleshooting的工具Troubleshooting的工具有许多种,可以用路由器的诊断命令,Cisco网络管理工具(CiscoWorks)和规程分析仪等等方法.下面我们主要介绍路由器的诊断命令. 路由器诊断命令有四种:∙用show命令∙用debug命令∙用ping命令∙用trace命令用show 命令Show是一个很有用的监控命令和解决系统出现问题的工具.下面是几个通常用到的show命令:∙show interface---显示接口统计信息.一些常用的show interface命令:o show interface etherneto show interface tokenringo show interface serial∙show controllers---显示接口卡控制器统计信息.一些常用的show controllers命令:o show controllers cxbuso show controllers e1∙show running-config---显示当前路由器正在运行的配置.∙show startup-config---显示存在NVRAM配置.∙show flash---Flash memory内容.∙show buffers---显示路由器中buffer pools统计信息.∙show memory---路由器使用内存情况的统计信息,包括空闲池统计信息.∙show processes---路由器活动进程信息.∙show version---显示系统硬件,软件版本,配置文件和启动的系统映象. 用debug 命令在超级用户模式下的debug命令能够提供端口传输信息,节点产生的错误消息,诊断协议包和其它有用的troubleshooting数据.注意:使用debug命令要注意,它会占用系统资源,引起一些不可预测现象.终止使用debug命令请用no debug all命令.Debug命令默认是显示在控制台端口上的,可用log buffer命令把输出定向到buffers里面.若是telnet过去的,可用Router#terminal monitor监控到控制台信息.用ping命令Ping确定网络连通.用trace 命令Trace命令跟踪路由器包传输.TCP/IP连接的Troubleshooting现象:主机到本地路由器的以太口不通建议:我们可以把路由器的以太网口看作是普通主机的以太网卡,这就成了一个局域网连接问题,1.用show interface ethernet number命令Router#show interface ethernet 0Ethernet is up,line protocol is down2.若Ethernet is down,请把线缆(同轴线缆或双绞线)接上.若已接上,ethernet依然是down,请找你的代理联系.3.若Ethernet is admsinstratively down.Router#conf tRouter(config)#interface ethernet 0Router(config-if)#no shutdownRouter(config-if)#^ZRouter#4.若Ethernet is up,而line protocol is down.主机10M网卡接到路由器100M的以太口上面,它不是自适应的(目前版本).反之无问题.若是同轴线缆请检查线缆,T型头,终结器,是否连接正确.若是双绞线请检查线缆是否正确,中间是否通过HUB连接,若是直连主机要用交叉线.若是100BaseTX接口,需要用五类双绞线.若是一个接口提供两种物理介质,如粗缆AUI和UTPRJ45,默认为AUI的.要用RJ45需要:Router#conf tRouter(config)#interface ethernet 0Router(config-if)#media-type 10basetRouter(config-if)#^ZRouter#5.若Ethernet is up,line protocol is up;但ping不通.请查看路由器以太口的IP地址,是否与主机IP地址在同一个网段上.6.经过以上几个步骤,问题仍未解决,请找你的代理联系.现象:主机到对方路由器广域网口或以太网口不通.建议:假设主机到本地路由器的以太口已通.1.在路由器上检查两个广域网口之间是否通,若不通,请看下面关于广域网的troubleshooting.2.若路由器两个广域网口之间是通的.在主机上用"netstat -rn"命令查找路由,若没有请用"route add"加入.以SCO UNIX为例:#netstat -rn#route add 目的网段掩码网关1或#vi /etc/gatewaysnet 目的网段gateway 本地路由器以太口地址metric 1 passive3.若主机上有默认网关,检查路由器路由协议配置.Router#show ip routeRouter#show running-config...router eigrp 1network ...network ...两端路由器配置路由协议是否一致,是否在一个自治系统里面."network"加入的网段是否正确.现象:主机到对方目的主机不通.建议:按以下步骤解决.1.检查主机到本地路由器的以太口.2.检查两个广域网口.3.检查主机到对方路由器广域网口.4.检查主机到对方路由器以太网口.可用telnet命令远程登录到对方路由器上,按检查本地主机到本地路由器的以太口的方法检查对方局域网连接情况.5.重复3和4,检查对方到本地情况.6.经过以上几个步骤,问题仍未解决,请找你的代理联系.串口连接遇到问题的Troubleshooting现象:在专线连接时,路由器直连的两个广域网口间不通.建议:我们可以把两个路由器广域网口之间分成三段,如图所示:路由器A--1---MODEMA----2----MODEMB--3--路由器B我们的任务就是要检查出是哪一段不通并解决它.1.用show interface serial number命令2.若是Serial is down,表示路由器到本地的MODEM之间无载波信号CD.连接串口和MODEM,开启MODEM.看MODEM的发送灯TD是否亮,TD 灯亮表示路由器有信号发送给MODEM.TD灯若不亮,请检查MODEM,线缆(最好用Cisco所配的)和端口.你可以用另外一个串口再试试看.3.若Serial is up,但line protocol is down.有几种可能:a.本地路由器未作配置.b.远端路由器未开或未配置.路由器两端需要配置相同的协议打包方式.例如:路由器A打包HDLC,路由器B打包PPP,那么两台路由器的line protocol始终是down的.改变打包方式:Router#conf tRouter(config)#interface serial 0Router(config-if)#encapsulation pppRouter(config-if)#^ZRouter#c.若是使用Newbridge的26XX,27XX的DTU设备,它不发送CD信号,请在路由器上设置:Router#configure terminalRouter(config)#int serial 0Router(config-if)#ignored-dcdRouter(config-if)#^ZRouter#d.MODEM之间没通,即专线没通.解决办法:作测试环路.请电信局帮助确定具体出现问题是哪一段线路.若作环路成功,line protocol会变成up(looped).4.若Serial is up,但line protocol is up(looped).用show running-config看看端口是否作了loopback配置,若有删调它.MODEM是否作了环路测试.专线是否作了环路测试.5.若Serial is admsinstratively down,line protocol is down.Router#conf tRouter(config)#interface serial 0Router(config-if)#no shutdownRouter(config-if)#^ZRouter#电话拨号连接的Troubleshooting要解决用电话拨号网连接出现的问题,首先要:确定路由器与MODEM之间已连接明白show line输出的含义确定路由器与MODEM之间已连接我们在路由器上用反Telnet(Reverse Telnet Session)到MODEM,来确定路由器与MODEM之间的连接.也就是说,反向登录到MODEM上面可对它用AT指令作配置.具体步骤如下:1.在路由器控制台上,用命令telnet ip-address 20yy其中ip-address是一个活动端口的地址, yy是连接MODEM的line线.例如,下面例子是用IP地址192.169.53.52连接到辅助口上:telnet 192.169.53.52 20012.如果连接被拒绝,可能有其它用户连接在该口上.用show users EXEC命令决定是否被占用,若是,clear line清除它;若没有,重试反Telnet.3.如果连接仍被拒绝,确认MODEM控制modem inout.4.确定路由器txspeed和rxspeed与MODEM设置的数率一致.5.反Telnet登录成功后,AT命令确定应答OK.明白show line输出的含义Show line line-number EXEC是非常有用的trobbleshooting命令.现象:MODEM和路由器间无连接.试用反登录无反应或用户收到"Connection Refused by Foreign Host"信息.建议:1.用show line看MODEM一栏是否是"inout",若不是,在路由器上:Router#conf tRouter(config)#line aux 0Router(config-line)#modem inoutRouter(config-line)#^ZRouter#2.确定正确的线缆.3.硬件问题,请与你的代理联系.现象:MODEM不拨号.建议:MODEM不拨号,排除掉硬件,线缆的可能,就是:1.不感兴趣的包.用show running-config检查路由器配置,是否设置了dialer-list截段了你想传送的包,若是请重新配置access-list表.2.Chat script配置错误.打开debug信息.Router#debug dialer%LINEPROTO-5-UPDOWN: Line protocol on Interface Serial0, changed state to down%LINK-3-UPDOWN: Interface Serial0, changed state to down%LINK-3-UPDOWN: Interface Async1, changed state to downAsync1: re-enable timeoutAsync1: sending broadcast to default destination get_free_dialer: faking itAsync1: Dialing cause: Async1: ip PERMITAsync1:No holdq created - not configuredAsync1: Attempting to dial 8292CHAT1: Attempting async line dialer scriptCHAT1: Dialing using Modem script: backup & System script: none -- failed, not connectedCHAT1: process startedCHAT1: Asserting DTRCHAT1: Chat script backup startedCHAT1: Expecting string:Async1: sending broadcast to default destination -- failed, not connectedCHAT1: Timeout expecting:CHAT1: Chat script backup finished, status = Connection timed out; remote host not respondingAsync1: disconnecting call......帧中继连接的Troubleshooting1.用show interface serial查看interface和line protocol是否up.确定连接的线缆正确.2.如果interface is up,但line protocol是down.用show frame-relaylmi查看帧中继的LMI类型.3.用show frame-relay map查看打包类型.4.用show frame-relay pvc查看PVC.5.打开debug信息.X.25连接的Troubleshooting1.确定两个X.25端口连接上.MODEM状态:若线路已连通,MODEM的CD灯和RD灯应该亮,表示X.25交换机有数据发送过来.我们也可以用pad本地或对方的X.121地址,若能pad过去,说明行X.25网链路层已通.Router#pad 28050103(对方的X.121地址)2.用show interface serial命令.若serial is down,line protocol is down请检查路由器与MODEM连接线缆,换另外串口重试.3.若serial is up,但line protocol is down.请与电信局联系,检查LAPB参数是否匹配.4.若serial is up,line protocol is up.但ping对方广域网口不通.用show running-config查看串口是否作了x25 map ip设置.X.25设置中,最大虚电路数值是否超过了申请的值.5.若对方连接的不是路由器,而是一块X.25网卡(以博达卡为例)6.环境:7.知识:博达X.25卡上8.#cd /etc/x.259.#vi x25.profile (网卡参数设定文件)10.LOCADDR 28050103 (本地X.25端口X.121地址)11.VC 1612.IVC 0 (呼入VC数)13.OVC 0 (呼出VC数)14.PVC 0 (永久VC数)15.X25TIMEOUT 60 (拆链时间)16.故,SVC=VC-IVC-OVC-PVC.17.#x25reset (重启X.25网卡)18.#x25link (监控当前状态信息)19.#vi x25.addr (地址对应文件,IP层能互相通信,要把X.121地址与IP地址对应起来)20.130.132.128.4 28050104 SVC 021.130.132.128.3 28050103 SVC 022.#cd /etc23.#vi tcp 加上24.ifconfig x25 130.132.128.3 -arp network 255.255.0.025.一般X.25连接出现问题都是一方的IP地址与X.121地址之间映射没有设定.与IBM主机连接的Troubleshooting∙DLSw+ Troubleshooting∙STUN Troubleshooting∙CIP TroubleshootingDLSw+ Troubleshooting在用DLSw+通过路由器实现PU2.0/2.1与IBM大型主机之间连接,我们要同时用show dlsw和show interface serial命令解决出现的问题.1.首先检查DLSw+定义的两个对等peers是否连通2.Router#show dlsw peers3.Peers: state pkts-rx pkts-tx typedrops ckts TCP uptime4.TCP 17.18.15.1CONNECT16080 8400 conf0 0 0 00.03.275.TCP 1.1.12.1DISCONN0 0 conf0 0 0 00.00.006.Peers --- 对应"dlsw remote-peer"定义的对等peers IP地址.7.state --- 表示与对等peers的连接状态.8.其中:CONNECT表示对等peers已建立.9.CAP_EXG表示与远程peer交换性能信息.10.WAIT_RD是建立peer连接的最后一步,等待远程peer应答信息.11.DISCONN表示与对等peers没有建立连接,请参阅TCP/IP Troubleshooting检查TCP连接故障.WAN_BUSY表示TCP传输队列已满,不能传输数据.12.若对等peers已建立连接,请查看性能交换信息.Router#show dlsw capabilitiesDLSw: Capabilities for peer 172.18.15.166vendor id (OUI) : '00C' (cisco)version number : 1release number : 0init pacing window : 20unsupported saps : nonenum of tcp sessions :1loop prevent support : noicanreach mac-exclusive : noicanreach netbios-excl. : noreachable mac addresses : nonereachable netbios names : nonecisco version number : 1peer group number : 0border peer capable : nopeer cost : 3biu-segment configured : nolocal-ack configured: yespriority configured: noversion string :Cisco Internetwork Operating System SoftwareIOS (tm) GS Software (GS7-K-M), Experimental Version11.1(10956) [sbales 139]Copyright (c) 1986-1996 by cisco Systems, Inc.Compiled Thu 30-May-96 09:12 by sbales813.交换过性能信息后,就要寻找目的MAC地址了,显示出所有的路由器能够到达的MAC地址(本地和远端)14.Router#show dlsw reachability15.DLSw MAC address reachability cache list16.Mac Addr status Loc. peer/port rif17.0000.810f.6500 FOUND LOCAL TBridge-001 --norif--18.0006.e918.7b70 FOUND LOCAL TBridge-001 --norif--19.1000.5ae3.03f7 FOUND LOCAL TBridge-001 --norif--20.7500.9221.0000 FOUND REMOTE 16.201.30.250(2065)max-lf(4472)21.7500.9221.0000 SEARCHING LOCAL22.23.DLSw NetBIOS Name reachability cache listBIOS Name status Loc. peer/port rif25.SXUSER2 FOUND LOCAL TBridge-001 --norif--若本地MAC地址和目的MAC地址状态均是FOUND,请参看第五步.SEARCHING表示在寻找本地MAC地址或目的MAC地址.此时用show interface serial命令查看该口连接的PU状态.NOT_FOUND表示没有收到对PU轮询的应答.VERIFY表示确认缓存内信息.26.在SERACHING本地MAC地址或目的MAC地址.27.Router#show interface serial 028.Serial1 is up, line protocol is up29.Hardware is HD6457030.MTU 1500 bytes, BW 1544 Kbit, DLY 20000 usec, rely255/255, load 1/25531.Encapsulation SDLC, loopback not set32.Router link station role: SECONDARY (DTE)33.Router link station metrics:34.group poll not enabled35.poll-wait 40000 seconds36.N1 (max frame size) 12016 bits37.modulo 838.sdlc vmac: 4000.5555.00--39.sdlc addr C1 state is DISCONNECT40.cls_state is CLS_STN_CLOSED41.VS 0, VR 0, Remote VR 0, Current retransmit count42.Hold queue: 0/200 IFRAMEs 0/043.TESTs 0/0 XIDs 0/0, DMs 0/0 FRMRs 0/044.RNRs 0/0 SNRMs 0/0 DISC/RDs 0/0 REJs 0/0chain: C1/C1st input never, output never, output hang neverst clearing of "show interface" counters never47.Queueing strategy: fifo48.Output queue 0/40, 0 drops; input queue 0/75, 0 drops49. 5 minute input rate 0 bits/sec, 0 packets/sec50. 5 minute output rate 0 bits/sec, 0 packets/sec51.0 packets input, 0 bytes, 0 no buffer52.Received 0 broadcasts, 0 runts, 0 giants53.0 input errors, 0 CRC, 0 frame, 0 overrun, 0 ignored,0 abort54.0 packets output, 0 bytes, 0 underruns55.0 output errors, 0 collisions, 19 interface resets56.0 output buffer failures, 0 output buffers swappedout57. 6 carrier transitions58.DCD=up DSR=up DTR=up RTS=up CTS=up59.说明:60.Encapsulation SDLC---串口打包方式为SDLC.61.Router link station role: SECONDARY (DTE)---目前端口作secondary,由"sdlc role"命令设置.62.sdlc vmac: 4000.5555.00-- ---由"sdlc vmac"设置的MAC地址.注意它的最后两位是留给PU地址的.63.在本例中,端口MAC地址是4000.5555.00C1.64.sdlc addr C1 state is DISCONNECT ---该端口连接PU C1当前状态.有以下几种状态:65.DISCONNECT-与PU未连接,次站没有发TEST或XID帧请求建立连接.请检查下面连接的PU是否启动66.SNA进程,若是用DCE线缆连接PU请检查线缆是否正确,若是MODEM连接到远端PU上,请67.检查MODEM状态灯.68.69.DISCSENT-路由器发送断开请求(DISC)给次站,正在等待次站应答.70.71.SNRMSENT-路由器发送连接请求(SNRM)给次站,正在等待次站应答.这个状态出现在作主站的路由器72.上.若是在作主站路由器上出现SNRMSENT状态,检查下端PU是否开机,路由器端口与PU上73.SDLC口连接的MODEM是否已通(MODEM的DTR,CD,RXD,TXD灯应常亮).一句话,出现SNRMSENT74.状态是路由器端口与它下端PU之间问题.75.76.CONNECT-PU连接正常.路由器和它连接的次站正常连接.77.78.THEMBUSY-PU发送RNR帧.次站告诉路由器暂时不能接收任何信息.79.BUSY-路由器发送RNR帧.路由器告诉次站暂时不能接收任何信息.路由器已接收到次站对SNRM帧的81.应答帧UA,试图建立SDLC或LLC2会话.82.83.BOTHBUSY-双方均发送RNR帧.告诉对方暂时不能接收任何信息.84.85.ERROR-违反SDLC协议.路由器正在等待次站应答.86.87.SNRMSEEN-路由器作次站,接收到SNRM帧.88.当双方MAC地址都找到后,开始建立链路了.89.Router#show dlsw curcuit90.Index local addr(lsap) remote addr(dsap) state91.181**** ****.5ae3.430d(04) 4000.5555.00c1(04)CONNECTED92.用"show interface serial"查看PU状态应是"CONNECT".我们也可以用"debug dlsw"获得更多的信息帮助解决网络中出现的问题.你可以记录下debug传输信息提供给你的代理.问题:远端没有到达本端机器.远端peer的IP地址是172.18.16.156.建议:1.检查show dlsw peer输出,我们看到:2.Peers: state pkts-rx pkts-tx typedrops ckts TCP uptime3.TCP 172.18.16.156 DISCONN 0 0conf 0 0 0 --4.用debug dlsw peers命令决定问题:DLSw: action_a() attempting to connect peer 172.18.15.156(2065) DLSw: action_a(): Write pipe opened for peer 172.18.15.156(2065) DLSw: peer 172.18.15.156(2065), old state DISCONN, new stateWAIT_RDDLSw: dlsw_tcpd_fini() for peer 172.18.15.156(2065)DLSw: tcp fini closing connection for peer 172.18.15.156(2065)DLSw: action_d(): for peer 172.18.15.156(2065)DLSw: peer 172.18.15.156(2065), old state WAIT_RD, new stateDISCONNDLSw: Not promiscuous - Rej conn from 172.18.15.166(2065)诊断:试着打开peer 172.18.15.156,但不成功.DLSw+接收到来自172.18.15.166的打开请求,但是DLSw+拒绝它,因为这个peer没有定义.由此我们可以判断定义peer地址不正确.该peer地址为172.18.15.166就连通了. Peers: state pkts-rx pkts-tx type drops ckts TCP uptimeTCP 172.18.16.166 CONNECT 2 2 conf0 0 0 00:224:27问题:SDLC设备不能连接到主机.Milan是连接SDLC设备的远端peer.建议:1.用show dlsw peer命令显示peer是up的.an#sh dlsw peers3.Peers: state pkts-rx pkts-tx typedrops ckts TCP uptime4.TCP 172.18.16.166 CONNECT 2 2conf 0 0 0 00:224:275.Show dlsw circuits没有链路产生.an#show dlsw circuitsan#8.Show interface 命令显示SDLC 地址状态是USBUSY,这表示我们已经成功的连接到下端路由器上.9.Router#show interface serial 3/710.Serial1 is up, line protocol is up11.Hardware is HD6457012.MTU 1500 bytes, BW 1544 Kbit, DLY 20000 usec, rely255/255, load 1/25513.Encapsulation SDLC, loopback not set14.Router link station role: SECONDARY (DTE)15.Router link station metrics:16.group poll not enabled17.poll-wait 40000 seconds18.N1 (max frame size) 12016 bits19.modulo 820.sdlc vmac: 4000.5555.00--21.sdlc addr C1 state is USBUSY22.cls_state is CLS_STN_CLOSED23.VS 0, VR 0, Remote VR 0, Current retransmit count24.Hold queue: 0/200 IFRAMEs 0/025.TESTs 0/0 XIDs 0/0, DMs 0/1 FRMRs 20/2026.RNRs 620/0 SNRMs 3/0 DISC/RDs 1/0 REJs 0/0chain: C1/C127.sdlc addr C2 state is USBUSY28.cls_state is CLS_STN_CLOSED29.VS 0, VR 0, Remote VR 0, Current retransmit count30.Hold queue: 0/200 IFRAMEs 0/031.TESTs 0/0 XIDs 0/0, DMs 0/0 FRMRs 0/032.RNRs 730/0 SNRMs 7/0 DISC/RDs 0/0 REJs 0/0chain: C2/C2st input never, output never, output hang neverst clearing of "show interface" counters never35.Queueing strategy: fifo36.Output queue 0/40, 0 drops; input queue 0/75, 0 drops37. 5 minute input rate 0 bits/sec, 0 packets/sec38. 5 minute output rate 0 bits/sec, 0 packets/sec39.0 packets input, 0 bytes, 0 no buffer40.Received 0 broadcasts, 0 runts, 0 giants41.0 input errors, 0 CRC, 0 frame, 0 overrun, 0 ignored,0 abort42.0 packets output, 0 bytes, 0 underruns43.0 output errors, 0 collisions, 19 interface resets44.0 output buffer failures, 0 output buffers swappedout45. 6 carrier transitions46.DCD=up DSR=up DTR=up RTS=downCTS=up47.检查配置到达的目的MAC地址是4001.3745.1088.an#write terminal49....50.!51.interface Serial3/752.description sdlc config to MVS53.mtu 440054.no ip address55.encapsulation sdlc56.no keepalive57.clockrate 960058.sdlc role primary59.sdlc vmac 4000.1234.560060.sdlc N1 1201661.sdlc address C162.sdlc xid C1 05DCCCC163.sdlc partner 4001.3745.1088 C164.sdlc address C265.sdlc xid C2 05DCCCC266.sdlc partner 4001.3745.1088 C267.sdlc dlsw C1 C268.!69....70.用show dlsw reachability mac-address命令发现MAC地址没找到:71.Router#show dlsw reachability mac-address 4001.3745.108872.DLSw MAC address reachability cache list73.Mac Addr status Loc. peer/portrif74.0000.810f.6500 SEARCHING LOCAL75.在FEP连接的路由器一端,用show dlsw reachabilitymac-address命令发现MAC地址没找到:76.Router#show dlsw reachability mac-address 4001.3745.108877.DLSw MAC address reachability cache list78.Mac Addr status Loc. peer/portrif79.0000.810f.6500 SEARCHING REMOTE80.显示show source-bridge,没有令牌环口走SRB:bolzano#show source-bridgeGlobal RSRB Parameters:TCP Queue Length maximum: 100Ring Group 100:No TCP peername set, TCP transport disabledMaximum output TCP queue length, per peer: 100Rings:诊断:加上"source-bridge"命令,连接正常了.问题:同一个串口上,一个SDLC设备连接正常而其它几个不行.建议:1.用show dlsw peer命令显示peer是up的.an#sh dlsw peers3.Peers: state pkts-rx pkts-tx typedrops ckts TCP uptime4.TCP 172.18.16.166 CONNECT 2 2conf 0 0 0 00:224:275.用show dlsw reachability mac-address命令发现MAC地址:6.Router#show dlsw reachability mac-address 4001.3745.10887.DLSw MAC address reachability cache list8.Mac Addr status Loc. peer/port rif9.0000.810f.6500 FOUND REMOTE 172.18.15.166(2065)10.用show dlsw circuits mac-address命令告诉两个链路连接:an#show dlsw circuit mac-address 4001.3745.108812.Index local addr(lsap) remote addr(dsap) state13.250-00 4000.1234.56c1(04) 4001.3745.1088(04)CONNECTED14.251-00 4000.1234.56c2(04) 4001.3745.1088(04)CKT_ESTABLISHED15.16.用debug dlsw core命令输出:milan#debug dlsw core stateDLSw core state debugging is onmilan#DLSw: START-FSM (251-00): event:DLC-Id state:CKT_ESTABLISHED DLSw: core: dlsw_action_f()DLSw: END-FSM (251-00):state:CKT_ESTABLISHED->CKT_ESTABLISHEDDLSw: START-FSM (251-00): event:DLC-Id state:CKT_ESTABLISHED DLSw: core: dlsw_action_f()DLSw: END-FSM (251-00):state:CKT_ESTABLISHED->CKT_ESTABLISHEDDLSw: START-FSM (251-00): event:WAN-XIDstate:CKT_ESTABLISHEDDLSw: core: dlsw_action_g()DLSw: END-FSM (251-00):state:CKT_ESTABLISHED->CKT_ESTABLISHEDDLSw: START-FSM (251-00): event:DLC-Id state:CKT_ESTABLISHED DLSw: core: dlsw_action_f()DLSw: END-FSM (251-00):state:CKT_ESTABLISHED->CKT_ESTABLISHEDDLSw: START-FSM (251-00): event:DLC-Id state:CKT_ESTABLISHED DLSw: core: dlsw_action_f()DLSw: END-FSM (251-00):state:CKT_ESTABLISHED->CKT_ESTABLISHEDDLSw: START-FSM (251-00): event:DLC-Id state:CKT_ESTABLISHED DLSw: core: dlsw_action_f()DLSw: END-FSM (251-00):state:CKT_ESTABLISHED->CKT_ESTABLISHEDDLSw: START-FSM (251-00): event:DLC-Id state:CKT_ESTABLISHED DLSw: core: dlsw_action_f()DLSw: END-FSM (251-00):state:CKT_ESTABLISHED->CKT_ESTABLISHEDDLSw: START-FSM (251-00): event:WAN-XIDstate:CKT_ESTABLISHEDDLSw: core: dlsw_action_g()DLSw: END-FSM (251-00):state:CKT_ESTABLISHED->CKT_ESTABLISHEDDLSw: START-FSM (251-00): event:DLC-Id state:CKT_ESTABLISHED DLSw: core: dlsw_action_f()DLSw: END-FSM (251-00):state:CKT_ESTABLISHED->CKT_ESTABLISHED诊断:DLSw试图在下端SDLC设备和FEP之间传输XID,但FEP并不建立会话.它通常是XID(IDBK/IDNUM)引起的.在配置中加上"sdlc xid"后连接正常.STUN Troubleshooting1.确定stun peer连通2.rick#sh stun peer3.This peer: 10.17.5.24.5.*Serial2 (group 1 [basic])6.state rx_pkts tx_pkts drops7.all TCP 10.17.5.2 open5729 5718 08.若状态不是open,应是TCP/IP连接问题,请参阅TCP/IPTroubleshooting.9.用show interface确定路由器和主机之间serial is up,line protocol isup.若是"down/down"请检查线缆,正确使用DTE和DCE Cable.若serial一会儿up,一会儿down,不断反复.你的主机可能配置成半双工的而不是全双工的,使用MSD时路由器没有设成半双工的.10.如果serail is up,但line protocol is down.最大可能是一端是NRZ编码,另一端是NRZI编码.用"nrzi-encoding"命令设置NRZI编码.设定编码方式与大机相同.11.一旦line操作正常,最常出现的问题就是SDLC地址不对.SDLC地址要与主机PU地址一致.如果收到下面信息就表示SDLC地址与主机PU地址不匹配.Received data from wrong address! Expect for output addressC2/Got C4.Debug sdlc当工作正常时,debug输出信息顺序:SDLC Primary :DISCONNECT-->SDLC PRI WAIT-->NET UP WAIT-->CONNECTSDLC Secondary :DISCONNECT-->NET UP WAIT-->SDLC SECWAIT-->CONNECTCIP Troubleshooting1.用"show interface channel 3/0"显示物理通道端口状态.若channel3/0 is up,line protocol is up.2.表示物理接口连接正常.否则请检查物理接口,线缆,bypass等是否连接正确.3.Router#sh int c3/04.Channel3/0 is up, line protocol is up5.Hardware is cyBus Channel Interface6.MTU 4096 bytes, BW 36864 Kbit, DLY 270 usec, rely 255/255,load 1/2557.Encapsulation CHANNEL, loopback not set8.PCA adapter card9.Data transfer rate 4.5 Mbytes, number of subchannels 1st input never, output never, output hang neverst clearing of "show interface" counters never12.Output queue 0/40, 0 drops; input queue 0/75, 0 drops13. 5 minute input rate 0 bits/sec, 0 packets/sec14. 5 minute output rate 0 bits/sec, 0 packets/sec15.1677 packets input, 0 bytes, 0 no buffer16.Received 0 broadcasts, 0 runts, 0 giants17.0 input errors, 0 CRC, 0 frame, 0 overrun, 0 ignored, 0 abort18.1595 packets output, 0 bytes, 0 underruns19.0 output errors, 0 collisions, 5 interface resets, 0 restarts20.0 output buffer failures, 0 output buffers swapped out21.用"show interface channel 3/2"显示逻辑通道口状态.22.Router#sh int ch3/223.Channel3/2 is up, line protocol is up24.Hardware is cyBus Channel Interface25.MTU 4472 bytes, BW 98304 Kbit, DLY 100 usec, rely 255/255,load 1/25526.Encapsulation CHANNEL, loopback not set27.Virtual interfacest input 0:01:36, output 0:01:26, output hang neverst clearing of "show interface" counters never30.Output queue 0/40, 0 drops; input queue 0/75, 0 drops31. 5 minute input rate 0 bits/sec, 0 packets/sec32. 5 minute output rate 0 bits/sec, 0 packets/sec33.19090 packets input, 686391 bytes, 0 no buffer34.Received 0 broadcasts, 0 runts, 0 giants35.0 input errors, 0 CRC, 0 frame, 0 overrun, 0 ignored, 0 abort36.20314 packets output, 754513 bytes, 0 underruns37.0 output errors, 0 collisions, 0 interface resets, 0 restarts38.0 output buffer failures, 0 output buffers swapped out39.用"show ext ch 3/0 csna oper"显示CSNA通道连接设备状态.40."stat"替代"oper"获得CSNA通道连接设备的统计值.41.确认CSNA通道连接设备状态为"setupComplet".42.Router#sh ext c3/0 csna43.Path Dv maxpiu time-delay length-delay44.CSNA 0100 E1 20470 10 2047045.Router#sh ext c3/0 csna oper46.Path Dv Status SlowDown maxpiutime-delay length-delay47.CSNA 0100 E1 setupComplet off 2047010 2047048.用"show ext ch 3/2 conn llc"命令确定SAPs值和CIP上打开的连接.49.确认定义在XCA中的正确的SAP值在CIP internal TokenRing LAN adapter中已打开.50.SHANXI2#sh ext c3/2 conn llc51.N Token 0 Adapter 1 5808.0100.000053.No SAPs open on this interface54.55.Total : SAPs opened = 0 Connections active = 056.如果CSNA通道连接设备状态是"setupComplet",正确的SAP值(i.e.,SAP 08)打开在正确的CIP internal57.MAC adapter上,进入第七步.否则,问题可能是PATH/DEVICE或XCA Major Node.请检查通道地址定义是否58.正确.若PATH/DEVICE正确,再在主机上"vnet,act,id=<xcamajnode>"命令确认XCA Major Node激活.59.Router#sh ext c3/0 csna oper60.Path Dv Status SlowDown maxpiutime-delay length-delay61.CSNA 0100 E1 Close off 20470 102047062.用"debug source-bridge"命令确定是否产生探测帧.如果确定以CIPinternal MAC地址为目的的探测帧被接收到,请打开"debug channel vlan".63.用"show ext ch 3/2 lan"命令显示CIP internal MACadapters.核实CIP internal MAC adapter被64.CIP microcode确认.65.router#debug channel vlan66.router#show ext ch 3/2 lann TokenRing 068.source-bridge 1000 1 10069.Adapno Mac Address Name Vcnum70.0 4000.1234.0001 544 0041 ACK ... ... ... ......INU71.如果CIP internal MAC adapters没有收到CIP的应答,(在"show ext ch3/2 lan"显示不是ACK而是CRE或PNDIND),表明CIP microcode没有承认CIP adapter配置命令.在这种情况下,RP不发送探测帧给CIP. 72.如果CIP internal MAC adapters已经接收到CIP的应答,用"show extch 3/2 llc stat 4000.0008.0000",4000.0008.0000是CIP的internal MAC address,检查是否收到CIP MAC adapter的检测命令和应答. 73.如果正常,再用"show ext ch 3/2 llc stat 4000.0008.0000 08"命令确认SAP是否接收到XIDs和应答.如果没有应答,可能是Switched Major Node没被激活,或IDBLK/IDNUM不正确,或PU被占用.74.在下端路由器上"show dlsw"命令查看串口连接的SNA endstation状态.参阅DLSw+ Troubleshooting.75.用"show llc2"显示当前已建立的LLC2链接.76.SHANXI2#sh llc77.LLC2 Connections: total of 1 connections78.Channel1/2 DTE: 5808.0100.0000 4000.4700.10c1 04 04 stateNORMAL79.V(S)=38, V(R)=38, Last N(R)=38, Local window=7, RemoteWindow=12780.akmax=3, n2=8, Next timer in 752081.xid-retry timer 0/0 ack timer 0/100082.p timer 0/1000 idle timer 7520/1000083.rej timer 0/3200 busy timer 0/960084.akdelay timer 0/100 txQ count 0/20085.RIF: 0630.0641.0020感谢下载!欢迎您的下载,资料仅供参考。
Troubleshooting的小总结

lvcreate –L <LV sizes> -n <LV name> <vgname>
mke2fs –j /dev/vg/lv
扩展LV
umount /xxx
lvextend –L +<LV sizes> /dev/vg/lv
ext2online
14.autofs 配置
hosts allow 是主机访问控制,用法同/etc/hosts.allow文件
smbpasswd –a tom 添加帐户,设置用户密码
注意此用户必须是系统中已有的用户
密码文件位置/etc/samba/smbpasswd
3./etc/inittab 文件丢失
会出现
INIT: No
inittab file found
Enter
runlevel:
Inittab 文件属于initscripts-7.31.6.EL-1
rpm包
可以进入rescue模式来重装这个包,
也可以进入单用户模式来修复,进入单用户模式后要手动挂载根分区
在/etc/samba/smb.conf中添加
[group]
path = /home/group 指明在文件系统中的路径
valid users 列出允许使用的用户名,每个用户名空格格开
@<组名>
read list 列出只读用户
一般来说可能忘了加上initrd /initrd-2.4.21-4.EL.img(大多情况发生在使用scsi硬盘)
总的来说grub.conf里面必须存在的就几行。
#---------------------------------------------------------------#
troubleshooting专业术语
troubleshooting专业术语
Troubleshooting 是一个专业术语,通常用于描述解决问题或故障的过程。
它是一种系统性的方法,用于识别、分析和解决技术设备、系统或流程中出现的问题。
Troubleshooting 的目标是快速而有效地找到问题的根本原因,并采取适当的措施来解决它。
这个过程通常包括以下步骤:
1. 确定问题:明确问题的具体表现和症状,以便能够更好地理解问题的本质。
2. 收集信息:收集有关问题的相关信息,例如错误代码、日志文件、系统配置等。
3. 分析信息:对收集到的信息进行分析,以确定可能的原因。
4. 排除可能性:通过逐步排除可能的原因,缩小问题的范围。
5. 确定根本原因:通过实验和测试,确定问题的根本原因。
6. 解决问题:采取适当的措施来解决问题,例如修复故障、更新软件、更改配置等。
7. 验证解决方案:验证解决方案是否有效,以确保问题得到彻底解决。
8. 记录问题和解决方案:记录问题和解决方案,以便将来参考。
Troubleshooting 需要具备一定的技术知识和经验,同时需要系统性地思考和分析问题。
它是维护和管理技术设备、系统和流程的重要组成部分,有助于确保其可靠性、稳定性和高效性。
Troubleshooting
故障排除硬件1.当开启监控程序时,出现〝找不到保护锁(Can’t find keypro) 〞或〝卡片错误(Card Setup Fail) 〞讯息。
▪请检查监控卡片的驱动程序(Driver)是否已安装完毕(详阅第2页)。
▪请尝试将监控卡片插到另一个PCI slot插槽。
▪请执行C:\GV800\Dos2kreg.exe.▪较旧版本的监控卡片需要一个大的硬件保护锁,请确定已将其接入计算机的打印机连接端口(较新版本卡片的保护锁已内建在卡片上)。
2.监控软件的窗口上出现〝视讯异常〞讯息。
▪请确认摄影机的线路,并请将正常与异常的摄影机对调,以确定是摄影机、影像撷取卡或线路的问题。
▪请确认您的视讯标准设定(详阅第39页) 与您的摄影机规格符合(NTSC或PAL)。
▪请检查自动控制视讯增益AGC设定。
(详阅第40页)。
3.监控软件出现〝找不到I/O模块:1, 地址:1, 于Com1〞或〝无GV-IO于COM1 〞。
.▪检查GV-Net与GV-IO之间的RS-485连接线。
▪检查GV-Net与GV-IO的电源。
4.当设定PTZ摄影机时,软件出现〝预设PTZ设备未启用” 。
▪PTZ摄影机在设定时没有被激活,请依照第47页里的PTZ装置设定并依步骤4检查,并请勾选启用选项。
▪如果您需安装多支PTZ摄影机,每一支摄影机都应该被激活。
软件1.如何将软件升级至最新的版本?▪从奇偶科技网站下载最新版本的软件。
/tw/download.asp 请解压缩并执行Setup.exe,如果您旧版的监控系统软件不是安装在C磁盘驱动器,将会出现〝请选择旧版本所安装的目录〞讯息,选择旧版监控系统软件安装路径并按下下一步,跟着安装精灵以完成此次安装,升级版软件将会检查您的计算机里是否已安装V5.3.0.0版或之后的版本,才会继续安装更新程序。
2.无法自动循环录像,且录像停止。
▪离开主系统且执行系统目录下的"RepairDatabaseUtility.exe" 程序,修复此问题。
troubleshooting专业术语 -回复
troubleshooting专业术语-回复Troubleshooting is an essential skill in various fields, including technology, engineering, and computer science. It involves identifying and resolving problems or issues that may arise in a system, device, or process. To effectively troubleshoot, professionals often rely on a set of specialized terms and techniques. In this article, I will guide you through the process of troubleshooting, exploring and explaining key troubleshooting terms along the way.Step 1: Problem IdentificationThe first step in troubleshooting is to identify the problem. This requires carefully observing and analyzing the symptoms or issues that are occurring. Some common troubleshooting terms related to problem identification include:1. Symptoms: These are the observable signs or behaviors that indicate a problem. For example, a slow computer or a flickering screen are symptoms of potential issues.2. Error Codes: Error codes are numerical or alphanumeric codesthat indicate specific problems or malfunctions. These codes are often displayed on screens or reported by software applications. Understanding error codes can provide crucial clues about what is causing a problem.3. Logs: Logs are records of events or activities that occur within a system. They can be found in various forms, such as log files, event logs, or system logs. Analyzing logs can help troubleshooters identify potential causes or patterns related to issues.Step 2: Problem LocalizationAfter identifying the problem, the next step is to localize it. This involves narrowing down the scope of the issue and determining where it originates. Some key terms used in problem localization include:1. Root Cause: The root cause is the underlying reason or source ofa problem. It is important to identify the root cause to address the issue effectively.2. Isolation: Isolation involves separating components or elementsof a system to identify which one is causing the problem. This can be done through a process of elimination or by using tools like circuit testers or diagnostic software.3. Fault Domain: A fault domain is a specific area or location wherea problem is occurring. It can refer to a physical space or a specific software module.Step 3: Troubleshooting TechniquesOnce the problem is localized, troubleshooting professionals employ various techniques to resolve the issue. Here are some commonly used techniques, along with relevant terms:1. Reboot: Rebooting involves restarting a device or system to resolve certain issues caused by software glitches or temporary errors.2. Configuration: Troubleshooting configuration issues involves examining and adjusting the settings or parameters of a system or device.3. Patching or Updating: Patching or updating means applying software updates or patches to fix known issues or vulnerabilities.4. Rollback: Rollback is the process of reverting to a previous version of software or configuration when a recent change caused the problem.5. Swapping: Swapping entails replacing a component or device with a known working one to determine if the original one is defective or faulty.Step 4: Documentation and ReportingTo ensure effective troubleshooting in the future and facilitate communication with others, documenting and reporting are crucial steps. Some relevant terms in this step include:1. Troubleshooting Documentation: This refers to the detailed records and information about the troubleshooting process, including the steps taken, the results obtained, and any resolutions or recommendations.2. Incident Report: An incident report is a formal document that summarizes the problem, the steps taken to troubleshoot, and the resolution or current status of the issue. It is often used for communication between different stakeholders.Step 5: Prevention and ImprovementLastly, troubleshooting involves implementing preventive measures and making improvements to minimize future problems. Important terms related to this step include:1. Preventive Maintenance: Preventive maintenance involves regular inspection, cleaning, and servicing of systems or devices to proactively prevent issues or failures.2. Continuous Improvement: Continuous improvement refers to an ongoing effort to enhance processes, systems, or products based on lessons learned from troubleshooting and other activities.In conclusion, troubleshooting is a systematic process that requires a deep understanding of specialized terms and techniques. Byfollowing a step-by-step approach and using relevant troubleshooting terms, professionals can efficiently identify and resolve problems in various fields.。
TroubleshootingP...
Troubleshooting Post-POAP, Autoconfiguration,and Device Discovery IssuesThis chapter includes the following sections:•Troubleshooting Post-POAP Autoconfiguration and Device Discovery Issues,page 1Troubleshooting Post-POAP Autoconfiguration and Device Discovery IssuesThis section describes troubleshooting procedures for various issues that involve post-Power-on AutoProvisioning autoconfiguration and device discovery issues associated with Cisco Dynamic Fabric Automation (DFA).ResolutionCauseSymptomUse one of the following methods to configure the switch role:•Use the fabric forwarding switch-role [border ]{leaf |spine }command to identify theswitch role.•Log in to the DCNM Web UI.◦Choose Dashboard >Dynamic Fabric Automation >Inter Switch Links View ◦Click Override Switch Role to change the role of a switch from leaf to spine or vice-versa.The device is not configured with the fabric forwarding switch-role command to identify the switch role,or the device does not support thisfeature.If the device does not have the role configured or the imagedoes not support this feature,all Cisco Nexus 5000Series and Cisco Nexus 6000Series switches are categorized as leafs and Cisco Nexus 7000Series switches arecategorized as spines.Note The spine and leaf are not displayed correctly.ResolutionCauseSymptom1Instantiate all segments on the spine:•Layer 3segment ID for routed traffic•Layer 2segment ID for ARP,RARP,bridged-traffic2Use the vni command on the spine.Not all segments are instantiated on the spine.The spine is not inFabricPath mode transitTroubleshooting Post-POAP, Autoconfiguration, and Device Discovery IssuesTroubleshooting Post-POAP Autoconfiguration and Device Discovery IssuesResolutionCause Symptom 1Use the show evb host commandto verify that the VM is associated with the device.2Use the show vrf command to verify that the VRF is associated with the device.The VM or VRF is not associated withthe device.Cisco Prime DCNM displays fewer devices that have matched virtualmachines (VMs)or virtualrouting and forwarding (VRF)instances associated with them.1Log in to the Cisco Prime DCNMweb UI.2Click the View Details link to view more information.3Make sure that the device points to the correct XMPP server.4In the Cisco Prime DCNM web UI,on the menu bar choose Admin >Settings.5Make sure that DCNM uses the XMPP users specified on the DFA Settings page.6Make sure that DCNM and the device joined the same XMPP group.The device is pointing to an incorrectXMPP server.1Log in to the Cisco Prime DCNM web UI.2On the menu bar,choose Admin >Settings.3Verify if the XMPP response timeout specified on the DFA Settings page allows enough time.The device might be timed out.Use the appmgr status xmpp command to ensure that the XMPP server is up and running.The XMPP server may be down.Troubleshooting Post-POAP, Autoconfiguration, and Device Discovery IssuesTroubleshooting Post-POAP Autoconfiguration and Device Discovery IssuesResolutionCause Symptom 1Review the switch configuration.2If CDP is not enabled,use the cdpenable command to enable CDP.The Cisco Discovery Protocol (CDP)is disabled on switches.Cisco DFA isunable to detect neighbor links.Switches are not appearing in the Cisco DFA fabric.1Log in go the Cisco Prime DCNMweb UI.2On the menu bar,choose Inventory >Switches .3Locate the switch and review the Status column.•If the Status column is OK,the switch is discoverable and reachable.•If the Status column is not OK,check relevant discovery logs at /usr/local /c i s c o /d c m /f m /l o g /f m s e r v e r *.l o g *to identify the root cause.Cisco DCNM has not completeddiscovery for the switches you expectto be in the fabric.1Log in to the Cisco Prime DCNM web UI.2Choose Health >VPC .3Look for missing vPC peers.4If DCNM does not recognize the vPC pairing,review theconfiguration on the vPC peers.5Use the show vpc peer command to view the output and determine the state of the switches.Cisco DCNM is not recognizing the vPC pairing.The Edge port view is not showing in virtual port channel (vPC)peers.Troubleshooting Post-POAP, Autoconfiguration, and Device Discovery IssuesTroubleshooting Post-POAP Autoconfiguration and Device Discovery IssuesResolutionCauseSymptom1Log in to the Cisco Prime DCNM web UI.2On the menu bar,choose Config >Power-on Auto Provisioning (POAP)>DHCP Scope.3Review the Bootscript Status column for error messages.4Review the POAP log files in the switch bootflash to understand in what phase it failed.The files are poap.log.*and.*poap.*init.log)5If there are no error messages,the Bootscript Status column should indicate that the POAP script is finished and the Bootscript Last Updated Time should be current.The POAP script is not finished.A device remains in discovery mode.Make sure that the access credentials that were provided in the UI during POAP Creation or POAP editing iscorrect.Incorrect access credentials were used in the POAP creation or editing process.Make sure that the Management IP address provided in the POAP template is correct.The Management IP address provided in the template has not been learned from the uploaded e the appmgr restore all command to restore all applications.The autoconfiguration tenantinformation is stored in the database/LDAP/DHCP.Autoconfigurations are not restored after you used the appmgr backup dcnm and appmgr restore dcnm commands.Troubleshooting Post-POAP, Autoconfiguration, and Device Discovery IssuesTroubleshooting Post-POAP Autoconfiguration and Device Discovery IssuesResolutionCause Symptom Use the show running-configexpand-port-profile command to view autoconfigured VLAN information.For example:>!Command:show running-config interface Vlan11expand-port-profile>!Time:Thu Aug 2523:02:372011>>version 7.0(0)N1(1)>>interface Vlan11>no shutdown>vrf member Dept:Marketing >no ip redirects>ip address 11.1.1.1/24>fabric forwarding mode proxy-gateway>ip dhcp relay address 10.1.1.100use-vrf managementConfiguration that is instantiated through autoconfiguration is not shown as part of show run output.The VLAN information is not available when you use the show run output command.There are two options:1Apply a configuration at run time using XMPP.a Ensure that all of the switches have joined a fabric access XMPP group.b Send the command to alldevices in the group using the XMPP messenger.2Push a configuration to a switch that is up and running.a Log in to the Cisco Prime DCNM Web UI.b On the menu bar,choose Config >Templates.c Select or create a config template.For example,if youwant to add a single configuration,only include the single configuration in the template.Note d Launch the job creation wizard.e Choose the switch.fSubmit or schedule the job.The configuration is applied only during the next reload and POAP for the device.POAP definition changes are not being reflected in configurations on a device.Troubleshooting Post-POAP, Autoconfiguration, and Device Discovery IssuesTroubleshooting Post-POAP Autoconfiguration and Device Discovery IssuesResolutionCause Symptom •Make sure that VRF of Org:Partition configuration profiles (such as vrf-tenant-profile,vrf-common,vrf-common-services)are already on the device.•In most cases,the basic network profiles must be included in user-defined network profiles.Basic network profiles are not on the device.A device cannot execute a downloaded network profile successfully.Possible errors:•The Mobility-Domain was entered instead of the segmentID•An incorrect netMaskLength wasused.For example,255.255.255.0or /24instead of 24.Incorrect values have been entered for the Profile parameters,or there is amismatch between the values enteredfor some primary fields such as segmentId,vlanId,etc.,•From LDAP,verify that all the profile parameters (configArgs)are filled in,including"$include_vrfSegmentId"and "dhcpServerAddr".•If the service IP address is specified for the partition,"$include_serviceIpAddress"should also be part of configArgs.•Verify that the segment ID in configArgs,for example$segmentId,has the same value as is specified for the network.Profile parameter values are missing.The VRF name is inconsistent in profile parameters for all networks.Troubleshooting Post-POAP, Autoconfiguration, and Device Discovery IssuesTroubleshooting Post-POAP Autoconfiguration and Device Discovery IssuesResolutionCause Symptom Make sure that the VRF name is entered consistently in the profile parameters for all networks in that VRF.The format should be"organizationName:partitionName".Inconsistencies in the name can result in inconsistent network behavior due to a mismatch in VRF to segment-ID mapping.NoteUse the debug ip arp xxx command to review why the ARP is not hitting the leaf.No ARP is detected.Address ResolutionProtocol (ARP)address is not hitting leaf.Use the show fabric database statistics command to display fabricdatabase statistics.No connectivity to the database server exists ARP is hitting,but profile does not get instantiated.Troubleshooting Post-POAP, Autoconfiguration, and Device Discovery IssuesTroubleshooting Post-POAP Autoconfiguration and Device Discovery Issues。
常见DP问题中的trouble shooting
关于DP中的trouble shooting 目录(一)备份被锁,无法进行(二)磁带位置与IDB记录不一致(三)卡带处理(四)磁带出现fair状态(五)Tape显示NO HW(六)Device is locked(七)ESL322e firmware update(八)Drive超时问题的处理(九) DP中常用命令(十)IDB Export & Import(十一)TableSpace空间不足的相关问题(十二)Media Pool无法打开(十三)Drive abort 无法继续备份(一)备份被锁,无法进行问题现象:启动备份时产生如下错误:问题判定:产生此warning的原因是某个进程退出时没有正常退出而产生一个锁定文件,所以启动备份时不能正常启动。
解决办法:删除该锁定文件后重新启动备份。
Command:rm /var/opt/ignite/locked_file name返回目录(二)磁带位置与IDB记录不一致问题现象:在copy过程中因备份有问题,为了不影响业务重启了DP,重启成功后再重新启动该未完成的COPY任务时,备份中产生如下warning:问题判定:磁带的物理位置与IDB中所记录的不一致。
问题解决:进行barcode scan后重新备份。
返回目录(三)卡带处理问题现象:问题判定:磁带卡在drive里,无法退出。
问题解决:1.用命令将drive里的磁带强行退出-到DP里看带子卡在哪个drive(如10-180-lto的SCSI_1)。
-再到那个drive里,看看他的物理路径(SDSI Address)。
如:bjdcbk01 /dev/rmt/19mn-然后到secureCRT里进入bjdcbk01 , 进入那个带库(omni_lto1)。
-stat d,看看哪个磁带在那个drive里卡着呢(如s31)-到bjdcbk01 , #mt -f /dev/rmt/19mn offline 把磁带用命令导出-然后在进入omni_lto1, move d1 s31.把磁带放回原来的槽位。
故障英文-
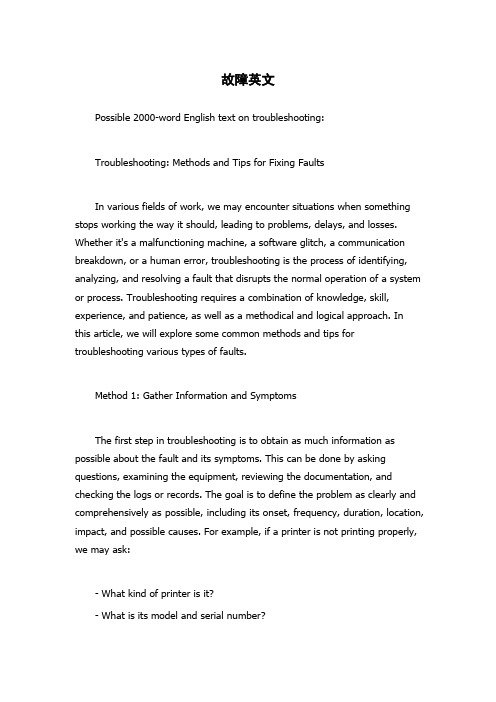
故障英文Possible 2000-word English text on troubleshooting:Troubleshooting: Methods and Tips for Fixing FaultsIn various fields of work, we may encounter situations when something stops working the way it should, leading to problems, delays, and losses. Whether it's a malfunctioning machine, a software glitch, a communication breakdown, or a human error, troubleshooting is the process of identifying, analyzing, and resolving a fault that disrupts the normal operation of a system or process. Troubleshooting requires a combination of knowledge, skill, experience, and patience, as well as a methodical and logical approach. In this article, we will explore some common methods and tips for troubleshooting various types of faults.Method 1: Gather Information and SymptomsThe first step in troubleshooting is to obtain as much information as possible about the fault and its symptoms. This can be done by asking questions, examining the equipment, reviewing the documentation, and checking the logs or records. The goal is to define the problem as clearly and comprehensively as possible, including its onset, frequency, duration, location, impact, and possible causes. For example, if a printer is not printing properly, we may ask:- What kind of printer is it?- What is its model and serial number?- When did the problem start?- What kind of documents or settings are affected?- Is there any error message or warning?- Have you tried any troubleshooting steps already?By gathering such information, we can narrow down the scope of the problem and rule out some possible causes. We can also decide how urgent or critical the problem is and how much time, resources, and expertise we may need to allocate for troubleshooting.Method 2: Conduct Tests and ExperimentsThe second step in troubleshooting is to perform some tests and experiments that can help us isolate the fault and confirm or refute our hypotheses. Depending on the type of fault and equipment involved, we may use various tools and methods, such as:- Visual inspection: We may look for physical defects or abnormalities such as cracks, leaks, discolorations, loose wires or connectors, and signs of wear or corrosion.- Functional testing: We may run some diagnostic or self-check routines that can detect faults in the software, hardware, sensors, or actuators of the equipment.- Environmental testing: We may measure some environmental factors such as temperature, humidity, pressure, or noise levels that may affect the performance or reliability of the equipment.- Comparative testing: We may compare the behavior of the faulty equipment with that of a similar or known-good equipment under the same conditions, to identify any differences or similarities.- Hypothesis testing: We may formulate a hypothesis about the most likely cause of the fault and design an experiment or test that can either support or refute the hypothesis.By conducting such tests and experiments, we can gather more evidence and data about the fault and its effects, and narrow down the range of possible causes. We can also gain more insight into the mechanisms and principles involved in the operation of the equipment, which can help us identify more effective and efficient solutions.Method 3: Analyze and Solve the ProblemThe third and final step in troubleshooting is to analyze the data and evidence obtained from the previous steps, and use them to devise a solution or strategy that can resolve the fault and restore the normal operation of the system or process. This may involve various techniques and principles, such as:- Root cause analysis: We may trace the fault back to its root cause, which is the underlying condition or event that triggered the fault to occur. By addressing the root cause, we can prevent the fault from recurring and improve the overall performance and reliability of the equipment.- Fault tolerance: We may design the system or process to be able to tolerate or bypass some faults or errors without causing major disruptions or losses. This can be done by adding redundant or backup components, using error-correcting codes, or implementing graceful degradation.- Troubleshooting guides or manuals: We may consult some guides or manuals that provide step-by-step instructions and tips for troubleshooting common faults or symptoms. Such guides may be provided by themanufacturer or vendor of the equipment, or developed internally by the organization.- Expert advice or consultation: We may seek the help of some external or internal experts who have more specialized or advanced knowledge or experience in troubleshooting similar faults or equipment. Such experts may be found online, in forums, or in professional associations; or within the organization, in other departments, teams, or individuals who have dealt with similar faults.- Documentation and feedback: We may document the steps, results, and solutions of the troubleshooting process and provide feedback to the stakeholders who were affected by the fault. This can help improve the communication, collaboration, and continuous improvement of the organization and its products or services.By applying such analysis and problem-solving techniques, we can improve our troubleshooting skills and become more efficient and effective in resolving faults. We can also prevent some faults from happening in the first place, by implementing some preventive and corrective measures based on our lessons learned from the troubleshooting process.Tips for TroubleshootingIn addition to the above methods, there are some tips and best practices that can enhance the success and quality of troubleshooting. Some of them are:- Keep calm and focused: Troubleshooting can be frustrating, tedious, and time-consuming, but it's important to stay patient and attentive and avoid rushing into conclusions or actions that may worsen the situation.- Use your senses: Don't rely only on your eyes or ears, but also use your sense of touch, smell, and taste (if applicable). Sometimes a fault may be caused by a loose or tight connection that you can feel or hear, or a burnt or leaking component that you can smell or taste.- Take notes and photos: Document your observations, tests, and experiments, and take some photos or videos (with permission) to illustrate the problem and its symptoms. This can help you recall the details later, share the information with others, and refer to the evidence when needed.- Test one thing at a time: Don't change multiple variables or parameters at the same time, as this can make it harder to pinpoint the source of the fault. Instead, change one thing at a time and test its effect before moving on to the next change.- Think creatively and logically: Sometimes a fault may be caused by an unexpected or seemingly unrelated factor. Try to apply some creativity and critical thinking to the problem, and use analogies, metaphors, or patterns to uncover the hidden cause or solution.- Learn from failures and successes: Don't give up or blame yourself or others if the first, second, or third attempt to solve the problem fails. Instead, use the feedback and lessons learned from the failures and successes to refine your troubleshooting skills and knowledge, and avoid repeating the same mistakes or oversights.- Celebrate the victory: When you finally solve the problem and restore the normal operation, take a moment to celebrate your achievement and recognize the efforts and contributions of others who helped you. This can boost your morale, motivate you to tackle the next challenge, and foster a culture of continuous improvement and excellence in your workplace.ConclusionTroubleshooting is an essential skill and mindset for anyone who deals with complex systems or processes that may encounter faults or errors. By following the above methods, tips, and best practices, you can become a more effective and efficient troubleshooter, who can identify, analyze, and resolve faults in a systematic, logical, and creative manner. Troubleshooting is not only about fixing problems, but also about discovering opportunities for improvement, learning from feedback, and enriching your knowledge and experience. So, next time you face a fault, don't panic, but take a deep breath, gather your tools, and troubleshoot like a pro!。
Linux命令及TroubleShooting技术总结
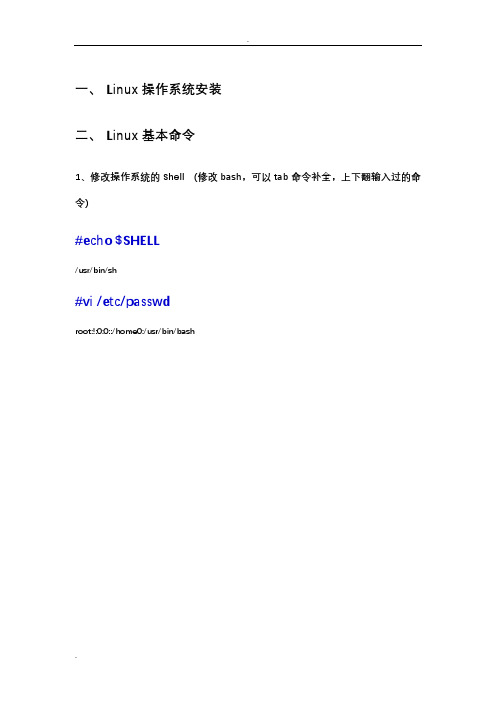
一、Linux操作系统安装二、Linux基本命令1、修改操作系统的Shell (修改bash,可以tab命令补全,上下翻输入过的命令)#echo $SHELL/usr/bin/sh#vi /etc/passwdroot:!:0:0::/home0:/usr/bin/bash2、查看AIX操作系统位数的方法:#bootinfo -y#bootinfo –K2、查看操作系统版本#oslevel –r3、查看小型机硬件型号#prtconf |more#lscfg -vp | grep -p alterable (查看硬件卡)4、查看CPU参数#prtconf#lsdev –Cc processor#vmstat5、查看内存参数#prtconf#vmstat6、查看硬盘参数#lsdev -Cc disk#prtconfSystem Model: IBM,9110-51A (机器型号)Machine Serial Number: 0697AC0 (机器序列号)Processor Type: PowerPC_POWER5 (Power Cpu 类型)Number Of Processors: 2 (Cpu 个数)Processor Clock Speed: 2097 MHzCPU Type: 64-bitKernel Type: 64-bit (Cpu 位数)LPAR Info: 1 06-97AC0Memory Size: 1904 MB (内存总数)Good Memory Size: 1904 MBPlatform Firmware level: Not AvailableFirmware Version: IBM,SF240_332Console Login: enableAuto Restart: trueFull Core: falseNetwork InformationHost Name: aixIP Address: 192.168.1.18 (网卡IP地址)Sub Netmask: 255.255.255.0Gateway: 192.168.1.1Name Server: 211.100.30.29Domain Name:Paging Space InformationTotal Paging Space: 512MBPercent Used: 42%+ hdisk1 U788C.001.AAA8364-P1-T11-L5-L0 16 Bit LVD SCSI Disk Drive (73400 MB) (硬盘信息)+ hdisk0 U788C.001.AAA8364-P1-T11-L8-L0 16 Bit LVD SCSI Disk Drive (73400 MB) (硬盘信息)7、查看某块硬盘详细属性#lsattr -El hdisk08、查看系统由那块硬盘启动及详细属性#lspvhdisk0 000b45c0688a5c5d rootvg activehdisk1 00c97ac06a9cef35 None#lspv –l hdisk0hdisk0:LV NAME LPs PPs DISTRIBUTION MOUNT POINThd2 44 44 00..06..38..00..00 /usrhd9var 5 5 00..00..05..00..00 /varhd8 1 1 00..00..01..00..00 N/Ahd4 41 41 00..00..41..00..00 /hd5 1 1 01..00..00..00..00 N/Ahd6 4 4 00..04..00..00..00 N/Ahd10opt 18 18 00..00..18..00..00 /opthd3 1 1 00..00..01..00..00 /tmphd1 5 5 00..00..05..00..00 /home0fwdump 1 1 00..01..00..00..00/var/adm/ras/platformlg_dumplv 8 8 00..08..00..00..00 N/A#lspv –p hdisk0hdisk0:PP RANGE STATE REGION LV NAME TYPE MOUNT POINT1-1 used outer edge hd5 boot N/A2-110 free outer edge111-111 used outer middle hd6 paging N/A112-112 used outer middle fwdump jfs2 /var/adm/ras/platform113-120 used outer middle lg_dumplv sysdump N/A121-123 used outer middle hd6 paging N/A124-213 free outer middle214-219 used outer middle hd2 jfs2 /usr220-220 used center hd8 jfs2log N/A221-221 used center hd4 jfs2 /222-222 used center hd2 jfs2 /usr223-223 used center hd9var jfs2 /var224-224 used center hd3 jfs2 /tmp225-225 used center hd1 jfs2 /home0226-226 used center hd10opt jfs2 /opt227-236 used center hd2 jfs2 /usr237-237 used center hd10opt jfs2 /opt238-277 used center hd4 jfs2 /278-293 used center hd10opt jfs2 /opt294-309 used center hd2 jfs2 /usr310-313 used center hd9var jfs2 /var314-317 used center hd1 jfs2 /home0318-328 used center hd2 jfs2 /usr329-437 free inner middle438-546 free inner edge这个视图告诉物理卷中哪些是空闲的、哪些已经被使用,以及在什么地方使用了哪些分区。
Nintendo Game Boy Color Rumble Pak Troubleshooting
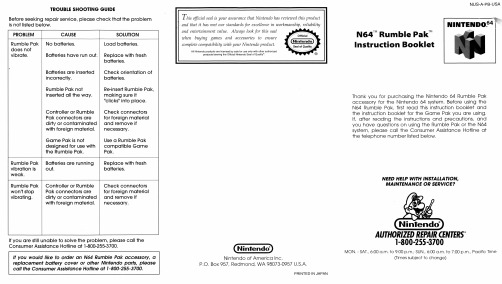
NEED HELP WITH INSTALLATION, MAINTENANCE OR SERVICE?
(Nintendo")
l\Jintendo of America Inc. P.O. Box 957, Redmond, WA 98073-0957 U.S.A.
PRINTED IN JAPAN
Nintendo® AUTHORIZED REPAIR CENTERS-
BATIERY PRECAUTIONS/WARNING
IA.WARNING I
FAILURE TO FOLLOW THE FOLLOWING INSTRUCTIONS MAY CAUSE THE BAITERIES TO MAKE "POPPING" SOUNDS AND LEAK BAITERY ACID RESULTING IN PERSONAL INJURY AND DAMAGE TO YOUR RUMBLE PAK OR N64 CONTROLLER. IF BAITERY LEAKAGE OCCURS, THOROUGHLY WASH THE AFFECTED SKIN AND CLOTHES. KEEP BATIERY ACID AWAY FROM YOUR EYES AND MOUTH . CONTACT THE BATIERY MANUFACTURER FOR FURTHER INFORMATION . l . Do not mix used and new batteries (replace all batteries at the same
TROUBLE SHOOTING GUIDE
Before seeking repair service, please check that the problem is not listed below.
Troubleshooting Management Connections说明书
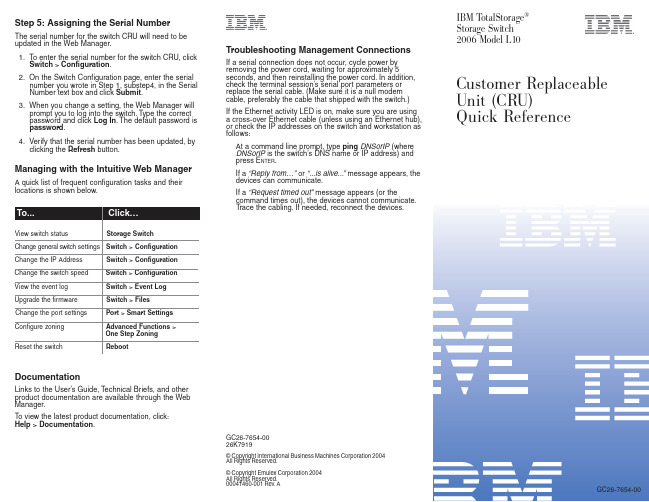
To view the latest product documentation, click: Help > Documentation.
Troubleshooting Management Connections
If a serial connection does not occur, cycle power by removing the power cord, waiting for approximately 5 seconds, and then reinstalling the power cord. In addition, check the terminal session’s serial port parameters or replace the serial cable. (Make sure it is a null modem cable, preferably the cable that shipped with the switch.) If the Ethernet activity LED is on, make sure you are using a cross-over Ethernet cable (unless using an Ethernet hub), or check the IP addresses on the switch and workstation as follows:
博科SAN交换机故障诊断相关命令
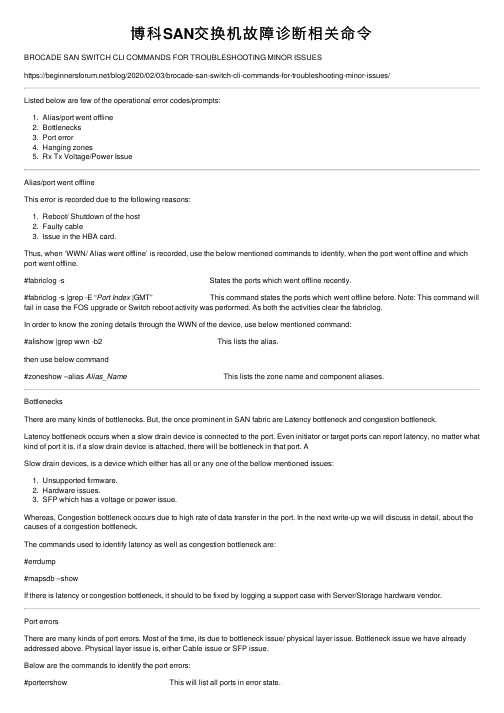
博科SAN交换机故障诊断相关命令BROCADE SAN SWITCH CLI COMMANDS FOR TROUBLESHOOTING MINOR ISSUEShttps:///blog/2020/02/03/brocade-san-switch-cli-commands-for-troubleshooting-minor-issues/Listed below are few of the operational error codes/prompts:1. Alias/port went offline2. Bottlenecks3. Port error4. Hanging zones5. Rx Tx Voltage/Power IssueAlias/port went offlineThis error is recorded due to the following reasons:1. Reboot/ Shutdown of the host2. Faulty cable3. Issue in the HBA card.Thus, when ‘WWN/ Alias went offline’ is recorded, use the below mentioned commands to identify, when the port went offline and which port went offline.#fabriclog -s States the ports which went offline recently.#fabriclog -s |grep -E “Port Index |GMT” This command states the ports which went offline before. Note: This command will fail in case the FOS upgrade or Switch reboot activity was performed. As both the activities clear the fabriclog.In order to know the zoning details through the WWN of the device, use below mentioned command:#alishow |grep wwn -b2 This lists the alias.then use below command#zoneshow –alias Alias_Name This lists the zone name and component aliases.BottlenecksThere are many kinds of bottlenecks. But, the once prominent in SAN fabric are Latency bottleneck and congestion bottleneck.Latency bottleneck occurs when a slow drain device is connected to the port. Even initiator or target ports can report latency, no matter what kind of port it is, if a slow drain device is attached, there will be bottleneck in that port. ASlow drain devices, is a device which either has all or any one of the bellow mentioned issues:1. Unsupported firmware.2. Hardware issues.3. SFP which has a voltage or power issue.Whereas, Congestion bottleneck occurs due to high rate of data transfer in the port. In the next write-up we will discuss in detail, about the causes of a congestion bottleneck.The commands used to identify latency as well as congestion bottleneck are:#errdump#mapsdb –showIf there is latency or congestion bottleneck, it should to be fixed by logging a support case with Server/Storage hardware vendor.Port errorsThere are many kinds of port errors. Most of the time, its due to bottleneck issue/ physical layer issue. Bottleneck issue we have already addressed above. Physical layer issue is, either Cable issue or SFP issue.Below are the commands to identify the port errors:#porterrshow This will list all ports in error state.#porterrshow port_number#porterrorshow -i Port_Index Both these commands will list the errors in a particular port.In case an error is listed, before troubleshooting clear the status using below commands and observe it again.#statsclear#slotstatsclear#portstatsclear port_numberApart from this, there are other commands to display the current data transfer rate of a port or all ports, such as:#portperfshow#portperfshow port_numberHanging ZoneHanging zones are the purposeless zones residing in the zoning configuration. The zone in which all initiators or all targets are inactive are considered as hanging zone.There is no specific command to list out hanging zones in the fabric, we have to use SAN health to identify the hanging zone. To check if all the aliases of a zone are active or not use the command mentioned below:#zonevalidate “zonename”In the result of the above command, there will be have a ‘*’ mark at the end of each active alias in the zone.Rx Tx Voltage/Power IssueThe Rx & Tx Voltage and power of an SFP can be validated only if, there is connectivity in the SFP with its port in online state.The command below will display the voltage, power and all the details related to the SFP.#sfpshow port_number -f。
TROUBLESHOOTING设备故障解决
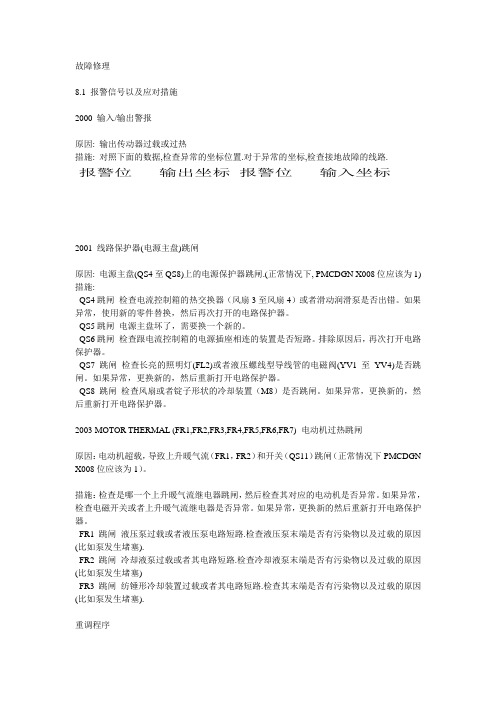
故障修理8.1 报警信号以及应对措施2000 输入/输出警报原因: 输出传动器过载或过热措施: 对照下面的数据,检查异常的坐标位置.对于异常的坐标,检查接地故障的线路.报警位输出坐标报警位输入坐标2001 线路保护器(电源主盘)跳闸原因: 电源主盘(QS4至QS8)上的电源保护器跳闸.(正常情况下, PMCDGN X008位应该为1) 措施:QS4跳闸检查电流控制箱的热交换器(风扇3至风扇4)或者滑动润滑泵是否出错。
如果异常,使用新的零件替换,然后再次打开的电路保护器。
QS5跳闸电源主盘坏了,需要换一个新的。
QS6跳闸检查跟电流控制箱的电源插座相连的装置是否短路。
排除原因后,再次打开电路保护器。
QS7 跳闸检查长亮的照明灯(FL2)或者液压螺线型导线管的电磁阀(YV1至YV4)是否跳闸。
如果异常,更换新的,然后重新打开电路保护器。
QS8 跳闸检查风扇或者锭子形状的冷却装置(M8)是否跳闸。
如果异常,更换新的,然后重新打开电路保护器。
2003 MOTOR THERMAL (FR1,FR2,FR3,FR4,FR5,FR6,FR7) 电动机过热跳闸原因:电动机超载,导致上升暖气流(FR1,FR2)和开关(QS11)跳闸(正常情况下PMCDGN X008位应该为1)。
措施:检查是哪一个上升暖气流继电器跳闸,然后检查其对应的电动机是否异常。
如果异常,检查电磁开关或者上升暖气流继电器是否异常。
如果异常,更换新的然后重新打开电路保护器。
FR1跳闸液压泵过载或者液压泵电路短路.检查液压泵末端是否有污染物以及过载的原因(比如泵发生堵塞).FR2跳闸冷却液泵过载或者其电路短路.检查冷却液泵末端是否有污染物以及过载的原因(比如泵发生堵塞)FR3跳闸纺锤形冷却装置过载或者其电路短路.检查其末端是否有污染物以及过载的原因(比如泵发生堵塞).重调程序(1)热继电器跳闸重置(电磁开关)[跳闸的表现]跳闸控制杆将会缩回装置内,如果热继电器跳闸.正常状态下,控制杆是外露的.[重置]消除报警故障(超载或者其他)后按下重启键(2)电路保护器跳闸重置(电磁开关)[跳闸的表现]当电路保护器跳闸时,装置指向OFF.正常状态下,应指向ON.[重置]消除报警故障(超载或者其他)后向上推控制杆,确保指示ON.(3)断路器跳闸重置[跳闸的表现]跳闸时,控制杆滑到中间位置[重置]消除报警故障(超载或者其他)后,先将控制杆拉到OFF,然后再推到ON2007 RIGID TAP(M29)COMMAND ERROR(Option)原因:没有通过主轴操作键指令M03或者M04指示刚性螺丝攻(M29)措施:按下重启键后,修改程序。
- 1、下载文档前请自行甄别文档内容的完整性,平台不提供额外的编辑、内容补充、找答案等附加服务。
- 2、"仅部分预览"的文档,不可在线预览部分如存在完整性等问题,可反馈申请退款(可完整预览的文档不适用该条件!)。
- 3、如文档侵犯您的权益,请联系客服反馈,我们会尽快为您处理(人工客服工作时间:9:00-18:30)。
IntroductionA SAN is a complex system that can consist of multiple switches, hosts, storage devices, routers, and hubs. A SAN can also be as simple as a single switch with attached storage and hosts. A breakdown of the individual components yields a range of subcomponents, from simple subcomponents, such as cables, to complex subcomponents, such as switches. At a macro level, the fabric itself is considered a component that might require troubleshooting. Switches are logically positioned in the middle of the network between hosts and storage, and have visibility to both storage and hosts. This visibility into both sides of the storage network enables you to use switches to determine the cause of any malfunction in the SAN. This chapter presents a structured process for identifying marginal or faulty SAN components by helping you figure out where to start and then to methodically home in on the problem. Specific areas of focus include troubleshooting the following symptoms and SAN components:▪▪Fabric▪▪“Missing” devices▪▪Marginal links▪▪Input/Output (I/O) interruptionsThe context of your problem influences how to interpret the data output by the variety of commands available in Fabric OS. For example, focus on the port state information for switchShow output when you are troubleshooting a port issue, and the switch status information from the same command when investigating a fabric issue.We will cover the details of how to troubleshoot using Fabric OS commands such as switchShow, errShow, portStatsShow, and other commands. Understanding host behavior and interpreting host information is also an important part of the troubleshooting process we discuss in this chapter.The Troubleshooting Approach: The SAN Is a Virtual CableWhen first approaching troubleshooting, think of the SAN as a virtual cable. Storage traditionally involved connecting a Small Computer Systems Interface (SCSI) disk via a SCSI cable to a host; with this scenario, you focus on four_components: the storage, the Host Bus Adapter (HBA), the host’s OS, and the cable/terminator. Troubleshooting a SAN is more challenging, but still has many things in common with the traditional storage troubleshooting process.To the operating system, the SAN provides a link to a disk, just as a traditional SCSI connection would.You can apply the same “tried-and-true” process of elimination used to trouble shoot a direct-attach SCSI issue or Ethernet network issue to SAN trouble shooting. At a macro level, if you consider the SAN a virtual cable, the issue can reside in three possible areas: the host, the “cable,” or the storage. Troubleshooting can work like a binary search when you start investigating these areas. Start in the middle and determine whether you are “above” or “below” the problem, and then keep dividing the suspect path until you resolve the problem.When troubleshooting with a simple single-switch configuration, a single host, and a single storage device, you need to focus on the HBA, the Gigabit Interface Converter (GBIC), the host’s OS, the cable, the switch, and the storage. Brocade fabrics run a single-image distributed operating system known as Fabric OS. Fabric OS delivers functionality such as Name Server, Registered State Change Notification (RSCN), Zoning, and security. These functions are part of the SAN and are also variables in the troubleshooting equation. A large SAN can consist of dozens of switches and is capable of growing to thousands of ports. Knowing where in the SAN to initiate troubleshooting can be daunting. The next section uses a typical SAN troubleshooting scenario—a host unable to “see” its disks—to illustrate the method of resolving the problem by treating the SAN as a virtual cable and working with a process of elimination.A Typical Scenario: “I Cannot See My Disks”We provide the scenario described in this section to introduce the troubleshooting process and to establish a framework with which you are familiar. Some terms, commands, and concepts may seem foreign. This is okay. We address everything discussed in this section in greater detail later in the chapter.When a host cannot see its disks, one thing to check is whether that device is logically connected to the switch by reviewing the output from the switchShow command. If the device is not logically connected (that is, it does not show up as an Nx_Port), you need to focus on the port initialization. Notice that port 15 in Figure 8.1 indicates a logically connected device, as this port is connected as an F_Port. Port 14 is an example of an unsuccessful device connection, as the device connected to port 14 is connected as a G_Port. A G_Port indicates an incomplete connection to the fabric. Initially knowing that the missing device is not logically connected eliminates the host and everything on that side of the data path from the suspect list, as depicted in Figure 8.2. This includes all aspects of the host’s OS, the HBA driver settings and binaries, the HBA Basic Input Output System (BIOS) settings, the HBA GBIC, the cable going from the switch to the host, the GBIC on the switch side of that cable, and all switchsettings related to the host. That is quite a lot for one command! If the missing device is logically connected to the switch, you need to check to see if the device is present in the Simple Name Server (SNS).Figure 8.1 Example of a Successful and Unsuccessful Device Connectioncore2:admin> switchshowswitchName:core2switchType:2.4switchState:OnlineswitchRole:SubordinateswitchDomain:5switchId:fffc05switchWwn:10:00:00:60:69:10:9b:5bswitchBeacon:OFFport 0: swOnlineE-Port10:00:00:60:69:11:f9:f7 "edge1"(upstream)port1: swOnlineE-Port10:00:00:60:69:10:9b:52 "edge2"port2: swOnlineE-Port10:00:00:60:69:11:f9:f7 "edge1"port3: swOnlineE-Port10:00:00:60:69:10:9b:52 "edge2"port4: swOnlineE-Port10:00:00:60:69:12:f9:8c "edge3"port5: swOnlineE-Port10:00:00:60:69:12:f9:8c "edge3"port6: —No_Moduleport7: —No_Moduleport8: —No_Moduleport9: —No_Moduleport 10: —No_Moduleport 11: idOnlineE-Port10:00:00:60:69:12:f9:8c "edge3"port 12: —No_Moduleport 13: —No_Moduleport 14: cuOnlineG-Port //incomplete fabric connectionport 15: idOnlineF-Port50:06:04:82:bc:01:9a:0cFigure 8.2 The SAN Virtual CableThe SNS is a directory service provided by the fabric. Initiators query the Name Server much in the same way you would query a telephone directory looking for a particular person or service. If a device is not in the Name Server,it is essentially invisible to other devices in the fabric. When a device connects to the fabric, that device will register itself with the Name Server. This is similar to the situation in which you change neighborhoods and have your name listed in the new telephone directory. When an initiator, which is normally an HBA, enters the fabric, it queries the Name Server to identify all accessible devices and obtain the addresses of these devices, just like you might scan your telephone directory for a name. Some targets also will query the Name Server. Then the initiator starts the process of establishing a connection with those devices for which the Name Server provides addresses.Check the Name Server for the presence of your missing device by issuing the nsShow command on the switch to which the device is attached (see the sample output in Figure 8.3). This will list all of the nodes connected to that switch, allowing you to determine if a particular node is accessible on the network. An alternate method is to check the Name Server list in the WEB TOOLS Graphical User Interface (GUI) on any switch in the fabric, as it contains a consolidated list of all devices in the fabric. Note that we started the process in the middle of the virtual SAN cable, which is the fabric. This is the process we described earlier as being like a binary search algorithm. You start in the middle half of the data path, figure out if you are “above” the problem or “below”it and keep dividing the suspect path in half until you identify the problem.Figure 8.3nsShow Sample Outputore2:admin> nsshowThe Local Name Server has 9 entries {Type PidCOSPortNameNodeNameTTL(sec)*N021a00;2,3;20:00:00:e0:69:f0:07:c6;10:00:00:e0:69:f0:07:c6; 895Fabric Port Name: 20:0a:00:60:69:10:8d:fdNL051edc;3;21:00:00:20:37:d9:77:96;20:00:00:20:37:d9:77:96; naFC4s: FCP [SEAGATE ST318304FC0005]Fabric Port Name: 20:0e:00:60:69:10:9b:5bNL051ee0;3;21:00:00:20:37:d9:73:0f;20:00:00:20:37:d9:73:0f; naFC4s: FCP [SEAGATE ST318304FC0005]Fabric Port Name: 20:0e:00:60:69:10:9b:5bNL051ee1;3;21:00:00:20:37:d9:76:b3;20:00:00:20:37:d9:76:b3; naFC4s: FCP [SEAGATE ST318304FC0005]Fabric Port Name: 20:0e:00:60:69:10:9b:5bNL051ee2;3;21:00:00:20:37:d9:77:5a;20:00:00:20:37:d9:77:5a; naFC4s: FCP [SEAGATE ST318304FC0005]Fabric Port Name: 20:0e:00:60:69:10:9b:5bNL051ee4;3;21:00:00:20:37:d9:74:d7;20:00:00:20:37:d9:74:d7; naFC4s: FCP [SEAGATE ST318304FC0005]Fabric Port Name: 20:0e:00:60:69:10:9b:5bNL051ee8;3;21:00:00:20:37:d9:6f:eb;20:00:00:20:37:d9:6f:eb; naFC4s: FCP [SEAGATE ST318304FC0005]Fabric Port Name: 20:0e:00:60:69:10:9b:5bNL051eef;3;21:00:00:20:37:d9:77:45;20:00:00:20:37:d9:77:45; naFC4s: FCP [SEAGATE ST318304FC0005]Fabric Port Name: 20:0e:00:60:69:10:9b:5bN051f00;2,3;50:06:04:82:bc:01:9a:0c;50:06:04:82:bc:01:9a:0c; naFC4s: FCP [EMCSYMMETRIX5267]Fabric Port Name: 20:0f:00:60:69:10:9b:5b}At this point, if the device is not present in the Name Server, you have narrowed your search along the virtual SAN cable to the Name Server interface between the storage. The missing device process defined in this section is summarized in flowchart form in Figure 8.4. Note that Figure 8.4 is an excerpt from the complete missing-device troubleshooting process, which is shown in Figure 8.25. Remember that we will go deeper into this missing-device troubleshooting process and flowchart later in the chapter.Where to Start and What Data to GatherAs stated in the previous section, SAN troubleshooting should begin in the center of the SAN and proceed outward. Once you know where to start troubleshooting, the next question is how to proceed. Start the troubleshooting process by gathering a preliminary set of data, and then analyze this data to identify where the problem resides: the host, the fabric, or the storage. Then gather additional data from the appropriate area and home in on the cause of the problem. _A plethora of data is available from the switches, hosts, and storage. Knowing what data to look at and when to look at it is fundamental to the SAN _trouble¬shooting process.Take a Snapshot: Describe the Problem and Gather InformationStart with a general description of the problem and identify as much supporting detail as possible. At the very least, this should include a statement about what the ―bad‖ behavior is, and a statement about what you are doing or have done to expose this behavior. Note that this is not the same as describing what you have done that causes the behavior. You might be doing something correctly, like plugging in a disk array and adding it to a zone, yet it might affect something else in the fabric if there is an underlying problem that is exposed whenever a zone change occurs.For example, an HBA responding incorrectly to an RSCN could fail when the new zone configuration is enabled. An RSCN is a fabric service for which an edge device optionally registers. When a device registers for an RSCN, it is asking the fabric to send that device a notice anytime something in the fabric changes. For example, when a new device is added to the fabric, any devices that registered for RSCNs will receive a notice. The registered device receiving the RSCN then checks the Name Server to see what has changed and takes appropriate action. For example, if the registered device is a host and a new disk drive is added to the SAN, the host might create the necessary device operating system structures so the new device is accessible to the user.This information will help you with the problem resolution, and might be necessary if you need to contact Brocade or any Brocade-authorized support channel. Some examples of a general problem description include:When I enable a switch zoning♣♣ configuration with cfgEnable, storage devices are no longer accessible to the host.There are frequent pauses in I/O when I copy large♣♣ files between arrays.My edge device sometimes connects as♣♣ an N_Port, and other times it connects as a Node Loop (NL)_Port when I power it up.The fabric segments and the following error message is♣♣ logged (provide error message in your description). It does this under normal operation, even when I do not touch any device on the SAN.Include the answers to the following questions with your problem description:♣♣ Can you recreate the problem on demand? If so, how? (Go into detail.)Is the problem intermittent? If so, how♣♣ frequently does it occur?Has anything at all changed♣♣ recently on the fabric? If so, what? (Provide a complete list.)♣♣ Is the problem localized or fabric-wide? For example, is the problem happening with other devices in the fabric, or just locally with a single device attached to the switch?Is this an initial install and the♣♣ device was never working, or was the device working and now it has stopped working?Other information to record:If there are any♣♣ error messages, include them with the problem_description.♣♣ Firmware and driver versions for the affected HBA and storage devices.♣ Firmware and operating system versions for affected hosts andall♣_fabric switches.External switch information, such as LED♣♣ state.External HBA and port information, such as LED♣♣ state.A diagram of the SAN configuration.♣♣♣♣ If long-distance links are present, include information about the length and quality of the lines, and the mechanism being used to achieve the distance (for example, ―The line is 10 km long, and we are using Long Wavelength [LWL] GBICs,‖ or ―It is 80 km long, and we are using a Dense Wave Division Multiplexor [DWDM] and the Extended Fabrics product‖).Finally, gather supportShow information from the switches. The supportShow command is a switch command used to gather information about the switch and the fabric; it can provide valuable clues about what is happening in your switch network. It is like a macro in that it executes a long list of switch commands, which Brocade identifies as important for the troubleshooting process. Note that the commands that supportShow executes vary between Fabric OS releases. The v2.4.1 supportShow command executes the following switch commands:♣♣ versionuptime♣♣tempShow♣♣♣ psShow♣licenseShow♣♣♣♣ diagShowerrDump♣♣switchShow♣♣♣ portFlagsShow♣portErrShow♣♣♣♣ mqShowportSemShow♣♣♣♣ portShowportRegShow♣♣♣♣ portRouteShowfabricShow♣♣♣♣ topologyShowqlShow♣♣faShow♣♣♣ portCfgLport♣nsShow♣♣♣♣ nsAllShowcfgShow♣♣configShow♣♣♣ faultShow♣traceShow♣♣♣♣ portLogDumpOne benefit of supportShow is that you do not have to repeatedly retrieve various types of data, since most of the data you need is available from supportShow in one place. As this command rapidly streams in a telnet window, capture mode should be turned on prior to executing the command so that it can be captured to a text file for later review.NOTEIt is important to execute the supportShow command at the time the problem is occurring, rather than waiting until the fabric is functioning normally.Due to the large volume of data created by supportShow, you might choose to gather the supportShow data once and then selectively issue a subset of its commands as part of your troubleshooting process.Troubleshooting ToolsMany tools are available to the SAN troubleshooter. Many of these tools are switch commands. Other tools involve viewing the switch LEDs, host information such as Solaris’ /var/adm/messages file, Fibre Channel analyzers, and diagnostics available on many storage arrays. Rarely is it possible to use a single tool to successfully troubleshoot a problem. It is more common to use several tools to attain a successful resolution of a problem.Using the Switch LEDsA significant amount of information can be gathered just by looking at the switch LEDs. At a rudimentary level, it is possible to identify that a device _has faulted or is not yet online by looking for a ―fast yellow.‖ If the switch is located in another room, you can get a visual real-time LED status using the WEB TOOLS interface. Fast flickering green lights are a sign of a healthy SAN. By physically observing the switches that comprise a SAN, it is possible to detect patterns and identify a marginal or faulty component. For example, if you have a situation in which you are trying to identify a device that is repeatedly toggling online and offline, you can use the switch LEDs.While observing a functional fabric, you can easily identify a potentially disruptive device by scanning for a port that goes offline (no LED light), sends light (steady yellow), comes online (steady green), and then cycles through the same steps—blank, yellow, green. You also want to look for correlations or patterns, such as one device going offline followed by a group of devices going offline and back online again. This situation is common in QuickLoop configurations when the first device going offline is sending a Loop Initialization Primative (LIP), which then causes the other devices to LIP.How to Identify a Healthy SAN Using the LEDsA settled and healthy fabric should have solid green or fast flickering green lights. A solid green light indicates an active link, while a fast flickering green light indicatesI/O activity.How to Identify a SAN Problem Using the LEDsA yellow light or blinking yellow light indicates a problem with your SAN. An LED that transitions from yellow to green, however, is not a problem. A powered-off edge device, or edge device that is not yet online, might cause the switch LEDs to blink yellow.Another helpful use for the LEDs is for fabric ―bring up.‖ When bringing up a fabric, one sign to look for that indicates a fabric has reached convergence are steady green lights. When the fabric is coming up, the Inter-Switch Links (ISLs) go through initialization, which appear to the observer as flickering green and yellow lights prior to the fabric fully converging. Once the fabric is converged, the lights go to a steady green. Then, as I/O in the fabric begins, you will see flickering green lights on the ISL ports and the edge device ports.A slowly flashing switch power LED indicates that the switch failed the Power-On Self-Test (POST) and is not able to come online. Refer to the associated switch manual for the location of the power LED. Table 8.1 lists the port LEDs and their definitions (you can also find this table in the Brocade SilkWorm 2800 Hardware Reference Manual).Table 8.1 Front Panel LED Port IndicatorsPorts LED DefinitionNo light showing No light or signal carrier (no module, no cable) for media interfaceSteady yellow Receiving light or signal carrier, but not yet onlineSlow yellow (flashes two seconds) Disabled (result of diagnostics, switchDisable, or portDisable command)Fast yellow (flashes a half second) Error, fault with portSteady green Online (connected with external device over cable)Slow green (flashes two seconds) Online, but segmented (loopback cable or incompatible fabric parameters)Fast green (flashes a half second) Internal loopback (diagnostic)Flickering green Online and frames flowing through portSwitch DiagnosticsA robust set of switch diagnostics is available so you can validate the operational level of a SilkWorm switch. Several of these diagnostics, such as portLoopbackTest, are also helpful in the troubleshooting process. For example, if you suspect a bad GBIC or switch port, you can use portLoopbackTest to confirm your suspicion. Using portLoopbackTest for troubleshooting is discussed in the section ―Troubleshooting Marginal Links‖ later in the chapter. The supportShow diagnostic command in particular, discussed in detail later in this chapter, is very helpful to the troubleshooting process. The Brocade Fabric OS manuals provide detailed description regarding the usage of diagnostic commands. To see what diagnostic commands are available online, issue the command diagHelp at the switch prompt. The following list of diagnostic commands is available in the V2.4.1 Fabric OS:ramTest System DRAM diagnostic♣♣♣♣ portRegTest Port register diagnostic♣♣ centralMemoryTest Central memory diagnosticcmiTest CMI♣♣ bus connection diagnosticcamTest QuickLoop CAM♣♣ diagnosticportLoopbackTest Port internal loopback♣♣ diagnosticsramRetentionTest SRAM Data Retention♣♣ diagnosticcmemRetentionTest Central Mem Data Retention♣♣ diagnosticcrossPortTest Cross-connected port♣♣ diagnosticspinSilk Cross-connected line-speed♣♣ exerciserdiagClearError Clear diag error on specified♣♣ portdiagDisablePost Disable Power-On-Self-Test♣♣♣ diagEnablePost Enable Power-On-Self-Test♣♣♣ setGbicMode Enable tests only on ports with GBICs♣♣ setSplbMode Enable 0=Dual, 1=Single port LB mode♣♣ supportShow Print version, error, portLog, etc.♣♣ diagShow Print diagnostic status information♣♣ parityCheck Dram Parity 0=Disabled, 1=Enable♣♣ spinFab ISL link diagnosticloopPortTest L_Port cable♣♣ loopback diagnosticHelpful CommandsWith dozens of switch commands at your disposal, it can be difficult to determine which command to use in a given situation. An annotated list of helpful commands follows in this section, with additional commands highlighted as they relate to specific issues discussed in following sections. This list of commands is a starting point for gathering data and initiating your troubleshooting process. While the information generated by these commands is also available in supportShow, you will want to use individual commands as you advance through the troubleshooting process. SupportShow creates a significant amount of data and is helpful when you want to perform the original snapshot of the configuration and environment (to report a problem to your switch supplier), or you are not sure what data to capture. NOTEAlthough the switch commands are shown with various capitalization as originally coded in Fabric OS, the commands are no longer case-sensitive and can be entered with all lowercase if desired.Entering the command help at the switch prompt generates a list of commands available to the user as shown in Figure 8.5. Entering the command help<command> generates a help page (similar to UNIX man pages) for that specific command. Many commands differ by the extension show or dump (for example, errShow and errDump). The difference is that show commands require you to type a return between entries, while the dump commands stream data to the screen without any pauses. Dump commands are used when you have a facility for loggingcommand output to a file. It might be necessary to execute commands on more than one switch in the fabric, especially if the location of the problem is unclear.As of Fabric OS 2.4.1, there is no time synchronization among the switches, which can make troubleshooting a challenge if the clocks between the switches are skewed. Before you begin troubleshooting your fabric, you should make a note of any time skew so that you can compensate for it when reading command outputs. You should also make an effort to keep switch clocks set correctly during normal operation to avoid this problem.Figure 8.5 Use the help Command to See What Commands Are Available or Type the help Command for Help About a Specific Commanddev172:admin> helpagtcfgSet Set SNMP agent configurationagtcfgShow Print SNMP agent configurationagtcfgDefault Reset SNMP agent to factory default...qlHelp Print quick loop help inforouteHelp Print routing help infotrackChangesHelp Print Track Changes help infozoneHelp Print zoning help infodev172:admin> help errShowNAMEerrShow - display the error logSYNOPSISerrShowAVAILABILITYall usersDESCRIPTIONThis command displays the error log, prompting the user to typereturn between each log entry. It is identical to errDump, except...SEE ALSOerrDump, uptimeThe errShow CommandThe errShow command provides a listing of up to 64 logged errors and is helpful for identifying where a problem might reside. It sends messages to the console and to the error log. Note that the error log is cleared after a reboot or power cycle; if you want to maintain error logs that persist after reboots or power cycles, consider using the syslog facilities of the switch to log errors to persistent storage. See syslogdIpAdd, syslogdIpRemove, and syslogdIpShow for further detail on how to set up persistent logging.When examining errShow data, which can be quite wordy, look for trends or patterns. For example, look for an excessive number of errors associated with a specific port. In addition, watch for high error-count values, which indicate a repeated error that has been logged many times. Logging error counts limits errors that occur multiple times from consuming the space provided for the error log. It is important to note that with every error, a severity level is associated. A warning (error level 3) is just that—a warning. An error (error level 2) or critical (error level 1) message is more severe and requires further attention.An excerpt from the errShow help entry is provided in Figure 8.6. Please refer to the help page or the Fabric OS manual for details on interpreting Diag Err#, as the list of codes is lengthy. A Diag Err# usually indicates a problem with hardware, so contact your switch supplier for further assistance.In addition to software errors, errShow logs environmental issues, such as over-temperature conditions, and equipment issues such as fan failures or power supply failures. A detailed list of error messages, descriptions, probable causes, and actions is maintained in the Fabric OS Reference Manual Version 2.4 (Publication Number 53-0001569-01).Figure 8.6 Excerpt from the errShow help EntryEach entry in the log has the same format:Error Number——————taskId (taskName): Time Stamp (count)Error Type, Error Level, Error MessageDiag Err#Error Number Starting from one. If there are more error thanthe size of the log, only the most recent errorsare shown.Task Id & Name The ID and name of the task recording the error.Time Stamp The date and time of the first occurrence ofthe error.Error Count For errors that occur multiple times, the repeatcount is shown in parenthesis. The maximum countis 999.Error Type An uppercase string showing the firmware moduleand error type. The switch manual contains adetailed explanation of each error type.Error Level 0 panic (the switch reboots)1 critical2 error3 warning4 information5 debugError Message Additional information about the error.Figure 8.7 is an example of an errShow message. The fabric is segmented, meaning that the switch that generated this message is logically disconnected from the SAN, and any devices in the SAN that are not directly connected to this switch are inaccessible to this switch. Moreover, any devices located on this switch are unable to access other devices in the fabric. The error level is a warning (3). The task ID (0x10e2b7f0) can be cross-referenced by issuing the telnet command ―i‖ to obtain additional information on the task in question. The Task Name is self-explanatory, and interpreting it is somewhat intuitive. For example, tTransmit is the transmit task. The Task Name can be helpful in identifying the nature of the problem. Finally, the error message indicates that there is a discrepancy between the zone information contained on this switch and the zone information contained in the rest of the fabric. When the switch tried to join _the fabric with this conflicting information, the join request was denied; hence, the segmented fabric. The message even identifies the zone that is causing the conflict; in this case, it is the ―red‖ zone. This zone should be checked and compared to the rest of the fabric, and if the zone information is different, either correct or delete it.Figure 8.7 errShow ExampleThe portErrShow CommandThe portErrShow command is an effective command for troubleshooting marginal ports. This command provides an error summary for all ports associated with the switch and provides a status of all ports from a link integrity perspective. The key to interpreting the statistics is looking for a very high number of errors relative to the frames transmitted and frames received. For example if 2,000,000 frames have been received and only three Cyclic Redundancy Check (CRC) errors have been logged, the CRC errors relative to the frames received is a very low ratio and the。
