Long Term X-ray Variability in GX13+1 Energy Dependent Periodic Modulation
LncRNA_SNHG12调控miR-138-5p

doi:10.3969/j.issn.1000-484X.2023.12.006LncRNA SNHG12调控miR-138-5p/HIF-1α轴改善缺氧/复氧人血管内皮细胞损伤的研究①魏宗强王琳茹胡文贤张娟子黄贤明李林李强②(青岛大学附属青岛市海慈医院血管外科中心,青岛 266033)中图分类号R289.5 文献标志码 A 文章编号1000-484X(2023)12-2494-07[摘要]目的:研究长链非编码RNA(LncRNA)小核仁RNA宿主基因12(SNHG12)调控miR-138-5p/低氧诱导因子-1α(HIF-1α)轴改善缺氧/复氧(H/R)人血管内皮细胞损伤的作用。
方法:体外培养人脐静脉内皮细胞(HUVECs),随机分为对照组、H/R模型组、H/R+LncRNA SNHG12过表达组、H/R+miR-138-5p mimics组、H/R+共转染组、H/R+共转染阴性对照组,各转染组分别进行转染处理,除对照组外,其余各组给予5 h缺氧,再进行复氧1 h处理,诱导细胞模型,然后通过CCK-8实验检测各组细胞活力情况;通过流式细胞实验检测各组细胞凋亡情况,比较各组细胞凋亡率;通过试剂盒测量各组细胞活性氧(ROS)、乳酸脱氢酶(LDH)及炎症因子IL-6、IL-17、IL-18水平;通过实时荧光定量PCR(qRT-PCR)实验测定各组细胞miR-138-5p及HIF-1α mRNA表达;通过免疫印迹实验检测各组细胞凋亡蛋白半胱氨酸天冬氨酸蛋白酶-9(caspase-9)、Bcl-2相关X蛋白(Bax)及HIF-1α蛋白表达。
结果:与对照组相比,H/R模型组细胞凋亡率、细胞ROS、LDH、IL-6、IL-17及IL-18水平、细胞HIF-1α mRNA 和蛋白水平、细胞caspase-9、Bax及HIF-1α蛋白水平升高(P<0.05),细胞活力、miR-138-5p水平降低(P<0.05)。
普利莱抗体长效保存液说明书

北京普利莱基因技术有限公司 电话:************,62053186 Email:************************
Applygen Technologies Inc. DocRev: 201910 Page 1 of 1 抗体长效保存液 (Antibody Stabilization Solution) C1231
描述:抗体在储存过程中效价降低主要有以下原因:(1) 不适当的储存和稀释条件导致抗体分子自身的凝聚和沉淀;(2) 容器对抗体的大量非特异吸附;(3) 蛋白酶水解;(4) 抗体与共价标记物的解聚和分离;(5) 抗体标记物如HRP 的稳定性和活性下降。
(6) 反复冻融等
普利莱抗体长效保存液专门为解决上述问题而设计和优化,可有效保护各种纯化和未纯化的一抗、二抗、共价标记的抗体如lgG-HRP 、lgG-AP 、lgG-FITC 、lgG-Cy5、lgG-Biotin 等,使抗体在-20o C 或4o C 储存时最大限度地保护其效价,同时抗体保存液优化的内在成分和条件,允许抗体耐受较多次数的反复冻融,也能够在较高稀释倍数时对抗体进行保护。
储存:4 o C 保存 一年有效
规格:50 ml 。
使用方法:
1. 将抗体原液以1:1~1:100比例稀释于抗体长效保存液中,振荡混匀。
2. 分装稀释后的抗体。
在分装管上标记稀释后的抗体浓度。
3. 将分装后的抗体保存在-20o C 长期保存,效价不会有明显下降。
说明:
1. 未溶解的抗体开封后可直接溶解在抗体长效保存液中。
2. 抗体保护液含有BSA ,因此不能用于抗BSA 抗体稀释。
3. 长期保存时,抗体浓度不能过度稀释。
COX6B2_在胃癌组织中高表达并影响患者的远期预后:基于抑制p53_信号调控胃癌细胞的增殖及细胞周

T-96(μmol/L)-+-+SC79(μmol/L)--++A549H1299M r 500005000035000T-AKT P-AKT GAPDH-+-+--++图5SC79逆转去甲泽拉木醛发挥的促进细胞凋亡作用Fig.5SC79reverses the pro-apoptotic effects of demethylzeylasteral.A ,B :Western blotting for detecting P-AKT/T-AKT expressions in A549and H1299cells treated with demethylzeylasteral and SC79.C ,D :Apoptosis of A549and H1299cells treated with demethylzeylasteral and SC79detected using flow cytometry with Annexin V-FITC/PI double staining.E -H :Western blotting for detecting the expressions of cleaved caspase-3,Bax and Bcl-2in A549and H1299cells treated with demethylzeylasteral and SC79.n =3;*P <0.05,**P <0.01,***P <0.001vs CON group;#P <0.05,##P <0.01,###P <0.001vs T-96group.T-96(μmol/L)-+-+SC79(μmol/L)--++A549Bcl-2Bax Cleaved Caspase3GAPDH25000200002000035000M r T-96(μmol/L)-+-+SC79(μmol/L)--++H1299M r 25000200002000035000Bcl-2Bax Cleaved Caspase3GAPDHCON T-96SC79T-96+SC79H1299Bcl-2Bax Cleaved-Caspase3R e l a t i v e p r o t e i n e x p r e s s i o n1.61.41.21.00.80.60.40.20######*****CON T-96SC79T-96+SC79A549Bcl-2Bax Cleaved-Caspase3R e l a t i v e p r o t e i n e x p r e s s i o n1.81.61.41.21.00.80.60.40.20#####*****EFGHCON T-96SC79T-96+SC79######******A549H1299A p o p t o t i c c e l l s (%)302520151050CON T-96SC79T-96+SC79P IH 1299A 549Annexin-FITCA549H1299P -A K T /T -A K T (f o l d )1.81.61.41.21.00.80.60.40.20CON T-96SC79T-96+SC79********###ABCD J South Med Univ,2024,44(2):280-288··287我们推测CREB 有可能是治疗NSCLC 的潜在有效靶点。
BmNPV_侵染后不同抗性家蚕品系中肠组织转录组学分析

引用格式:刘 勇,龚椿营,艾均文,等. BmNPV侵染后不同抗性家蚕品系中肠组织转录组学分析[J]. 湖南农业科学,2023(11):1-9,13. DOI:DOI:10.16498/ki.hnnykx.2023.011.001蚕桑文化是中国文明的起点,至少已有4 000 a 以上的历史。
家蚕作为重要的经济昆虫对人类文化、经济发展贡献巨大。
种桑养蚕至今仍是部分地区农民的重要收入来源。
然而生产上,家蚕始终受到细菌病、病毒病等的侵害,给农户造成一定的经济损失[1]。
其中,以家蚕核型多角体病毒(Bombyx mori nucleopolyhedrovirus,BmNPV)引起的血液型脓病对蚕桑产业的威胁最大,其传染性极强,一旦发病就难以控制[2]。
目前,环境消毒仍是预防蚕桑病害的主要措施,但该防治方法费时费力,严重制约了蚕桑业的发展。
在此背景下,学者们通过传统杂交育种、分子标记育种和转基因育种等方式选育抗性品种来预防家蚕频发性血液型脓病,虽然这种方式前期投入大、开发周期长,但是一旦成功选育出抗性品种,其经济效益、社会效益和生态效益都是不可估量的[3]。
因此,基于材料间所存在的抗性差异而进行家蚕抗病基因筛选、抗病机制解析成为近年来蚕桑领域的热门课题。
BmNPV是一种环状双链DNA的核型多角体病毒,具有包涵体衍生病毒(occlusion-derived virus,ODV)和出芽型病毒(budded virus,BV)2种不同形式,侵染家蚕的方式包括ODV引起的食下感染和BV引起的创伤感染[3]。
BmNPV在家蚕体内复制增BmNPV侵染后不同抗性家蚕品系中肠组织转录组学分析刘 勇,龚椿营,艾均文,薛 宏,何行健,贾超华,陈卓华,任立志(湖南省蚕桑科学研究所,湖南长沙 410127)摘 要:家蚕核型多角体病毒(BmNPV)是造成蚕业严重经济损失的主要病原体之一,主要通过食下感染引发家蚕血液型脓病,中肠是免疫病原体的重要组织器官。
世界首次用连续波长激光结晶甘氨酸

世界首次用连续波长激光结晶甘氨酸
佚名
【期刊名称】《现代化工》
【年(卷),期】2008(28)2
【摘要】21生命科学研究工作实验室(Hamano生命科学研究基金会的一部分)的一组研究人员成功开发出世界首个仅用远红外连续波长激光结晶甘氨酸(蛋白质的一种)的新技术。
新技术是由21生命科学研究工作实验室的首席科学家Masuhara Hiroshi、研究人员Sugiyam Teruki及其他研究者共同开发的,它被
用来结晶药物化合物和蛋白质,这些物质由于耐光性较弱而不能使用脉冲激光。
【总页数】1页(P90-90)
【关键词】脉冲激光;甘氨酸;结晶;波长;世界;科学研究工作;研究人员;蛋白质
【正文语种】中文
【中图分类】TQ226.36;TN241
【相关文献】
1.用半导体激光器作调制器的波长连续可调谐锁模光纤激光器 [J], 赵春柳;马宁;袁树忠;杨石泉;董新永;李朝辉;徐雁军;董孝义
2.波长锁定878.9nm激光二极管抽运内腔式YVO4/BaWO4连续波拉曼激光器[J], 张蕴川;樊莉;魏晨飞;顾晓敏;任思贤
3.波长锁定激光二极管共振泵浦Nd:YVO4晶体连续波自拉曼激光器的设计与研究[J], 张鑫;张蕴川;李建;李仁杰;宋庆坤;张佳乐;樊莉
4.波长锁定激光二极管共振泵浦Nd:YVO_4晶体连续波自拉曼激光器的设计与研
究 [J], 张鑫;张蕴川;李建;李仁杰;宋庆坤;张佳乐;樊莉
5.1550nm波长PNP型InGaAsP-InP异质结晶体管激光器材料设计与外延生长[J], 段子刚;柴广跃
因版权原因,仅展示原文概要,查看原文内容请购买。
抗单纯疱疹病毒1_型的IgY_制备及其生物学活性检测
第 50 卷第 2 期2024年 3 月吉林大学学报(医学版)Journal of Jilin University(Medicine Edition)Vol.50 No.2Mar.2024DOI:10.13481/j.1671‐587X.20240202抗单纯疱疹病毒1型的IgY制备及其生物学活性检测苏海涛1, 翟玥2, 宋秀玲2, 徐坤2,3(1. 吉林省疾病预防控制中心寄生虫病预防控制所,吉林长春130062;2. 吉林大学公共卫生学院卫生检验教研室,吉林长春130021;3. 湖南师范大学医学院食品与营养卫生教研室,湖南长沙410013)[摘要]目的目的:制备抗单纯疱疹病毒1型(HSV-1)的卵黄抗体(IgY),探讨该抗体的生物学活性,阐明其抗HSV-1的能力。
方法方法:制备HSV-1灭活疫苗,采用鸡胸多点注射法免疫高产蛋鸡,采用聚乙二醇-6000(PEG-6000)法提纯IgY,采用间接ELISA法、十二烷基硫酸钠-聚丙烯酰胺凝胶电泳(SDS-PAGE)技术和蛋白浓度定量试剂盒测定IgY效价、纯度及蛋白水平,采用间接ELISA法检测IgY中和病毒的能力,测定病毒阻断率,以Vero细胞为病毒感染靶细胞,测定不同抗体浓度(0.015 60、0.031 25、0.062 50、0.125 00、0.500 00、和1.000 00 g·L-1)作用后细胞病变效应(CPE),根据CPE程度测定IgY体外抗HSV-1能力。
结果结果:制备的IgY效价随免疫时间逐渐升高,达到1/1 024 000后保持稳定;IgY轻链重链条带清晰;IgY平均蛋白水平为11.544 g·L-1;IgY对HSV-1的阻断率可高达77.90%;HSV-1致CPE程度随抗体浓度升高而逐渐降低,当IgY浓度达到0.500 00 g·L-1及以上时,25%以下细胞(甚至无细胞)发生病变。
结论结论:成功制备出抗HSV-1的IgY,该抗体对HSV-1具有明显的中和阻断能力和体外抑制活性,可用于药物及诊断方法的开发。
不同酶消化法提取猪原代肝细胞的效果比较

532024.4·试验研究0 引言猪圆环病毒(PCV )是Circoviridae 科Circovirus 属的一种无囊膜的单链环状DNA 病毒。
在已知的4个血清型中,PCV2为猪易感的致病性病毒[1]。
PCV2感染会诱导宿主免疫抑制引起猪圆环病毒病(PCVD ),包括断奶仔猪多系统衰竭综合征、新生仔猪先天性脑震颤、皮炎与肾病综合征、猪呼吸道病综合征、母猪繁殖障碍等,给全世界养猪业带来较大的经济损失,是世界各国的兽医与养猪业者公认的造成重大影响的猪传染病[2]。
PCV2的感染在猪生长发育的不同阶段有不同的组织嗜性。
但无论是胎儿阶段还是出生后,肝细胞都是PCV2感染和复制的靶细胞。
因此,PCV2也被视为一种能够诱导猪肝炎的病毒[3]。
且PCV2诱导的肝细胞凋亡在PCV2引发的相关病变和疾病的发病机制中具有关键性作用[4]。
因此,方便、快捷地获取大量有活性的猪肝细胞对于研究PCVD 的致病机制具有重大意义。
目前获取肝细胞常用的方法主要包括机械分离细胞法、非酶分离细胞法、离体酶消化法和酶灌流法等[5]。
因此,本试验采用简便、经济、无需特殊设备、仅需部分肝组织的离体酶消化法,比较不同酶消化分离猪原代肝细胞的效果,为一般实验室提取分离大量有活性的猪肝细胞提供参考。
1 材料与方法1.1 材料1.1.1 主要试剂新鲜猪肝组织,Hank's 平衡盐溶液(HBSS ),磷酸盐缓冲液(无菌PBS ),4%多聚甲醛(PFA ),收稿日期:2024-01-27基金项目:国家自然科学基金项目:复杂器官与组织在脾脏内的功能性再生(32230056)作者简介:周徐倩(1999-),女,汉族,浙江温州人,硕士在读,研究方向:组织工程与再生医学。
*通信作者简介:董磊(1978-),男,汉族,安徽阜阳人,博士,教授,研究方向:组织工程与再生医学、生物材料。
周徐倩,董磊.不同酶消化法提取猪原代肝细胞的效果比较[J].现代畜牧科技,2024,107(4):53-55. doi :10.19369/ki.2095-9737.2024.04.014. ZHOU Xuqian ,DONG Lei .Comparison of the Effect of Different Enzyme Digestion Methods on Extraction of Porcine Primary Hepatocytes[J].Modern Animal Husbandry Science & Technology ,2024,107(4):53-55.不同酶消化法提取猪原代肝细胞的效果比较周徐倩,董磊*(南京大学,江苏 南京 210023)摘要:猪肝细胞是猪圆环病毒的靶细胞,简单快速地提取猪原代肝细胞对于研究猪圆环病毒病的致病机制具有重要意义。
异硫氰酸荧光素发光纳米微球标记双抗夹心固体基质室温燐光免疫分析法测定人IgG

分析 ( SR . 测定人 IG的一种新 方法. S . TPI A) g 本方法线性 范围为 O0  ̄2 .p . 8 00 g人 lG  ̄ ( g / 样品体积 O 肛 / . L 斑,对 4
o nm a s f 20 w s ynt sz d he i e by SolG e m e ho — l t d. i an em i tong and s abl old ubsr e r tc tsr t e s i s t at —oom t m pe a ur e rt e
文章编号:0 87 2 (0 00 —0 50 1 0—8 62 1)40 9 -5
异硫氰 酸荧光 素发光 纳米微球标记双抗 夹心 固体基质 室温膦光免疫分析法 测定人 IG g
林常青
( 漳州职业技术学 院 食 品与生物工程系,福建 漳州 330 ) 600
摘 要 :基 于 S 1 e 技 术合成 了粒径为 2 n o gl . 0 m、包含 了异硫 氰酸荧光素( I C F T )的 SO 纳米微球 ( i2 简写作
s e i c r a t n b t e g a ・ n ih ma I G a tb d l b ld wih FI p cf e c i e we n i o o ta t— u - ・ n g n i o y a ee t TC- i a d h ma l G ・ Oz n u S n g
De e m i ton o um an I t r na i fH gG ld Subs r t — o m by So i ta er o Te pe a ur m r t ePh0s ph0r s e eI m uno s a e c nc m a sy
两种方法研究不同茎部长度串联shRNA表达载体对EGFP基因的干扰效应

江西农业学报2010,22(10):118—121A c t a A 鲥cul t urae Ji angxi两种方法研究不同茎部长度串联s hR N A 表达载体对E G FP 基因的干扰效应肖红卫1,刘中华2,刘西梅1,郑新民H ,乔宪凤1,李莉1(1.湖北省农业科学院畜牧兽医研究所、湖北省胚胎工程与分子育种重点实验室,湖北武汉430064;2.西北农林科技大学动物医学学院,陕西杨凌712100)摘要:目的:旨在观察不同茎部长度串联s hR N A 表达载体对EG FP 基因的干扰作用。
方法:采用体外培养的V et o 细胞,选用不同茎部长度串联s hR N A 表达载体+E G FP 表达栽体+脂质体转染的方法。
将构建好的干扰载体转染V et o 细胞,然后使用实时荧光定量R T —PC R 对其沉默效应进行定量分析。
在小鼠腿部肌肉注射干扰质粒,实时荧光定量R T —PC R 对其沉默效应进行定量分析。
结果:转染V ero 细胞时,pG enes i l R 21、pG enes i l R 27和pG enes i l R 29荧光表达量仅为对照质粒pEG FP —C l 的4.3%、3,O %和6.9%;小鼠腿部肌肉注射干扰质粒时,pG enes i l R 21、pG enes i l R 27和pG enes i l R 29荧光表达量仅为对照质粒pE G FP —C 1的2.5%、1.3%和5.1%。
结论:在细胞和个体水平,不同茎部串联干扰载体对目的基因的抑制效应均很明显(达到90%以上),比单一位,最产生的沉默效应要强许多,不同茎部长度干扰效应彼此间差异不显著。
关键词:s hR N A 表达裁体;V er o 细胞;脂质体;E G FP 表达载体;转染中图分类号:Q TS6文献标识码:A 文章编号:100l 一8581(2010)10—0118—04St udyonSi l enc i ng E f f e ct of T andem s hRNA E xpr ess i on —-vect or s E m br ac i ngD i f i er ent St em sonE G FP G ene bv T w oM et hodsX I A O H ong —w e i ‘,U UZho ng —h na2,U U X i —m ei l ,Z H E N G X i n —m i nl ’,Q IA O X i an —f en91,L I Li l (1.I nst i t ut e of A ni m al H us ba ndr y a nd V et er i nar y S c i enc e ,H ube i A cadem y of A gr i eulr ur al Sc i ences :K e y Lab of 胁m s /Em br yoEn-gi neer i n g a nd M o l ecu l ar B r eedi n g of H ubei P r ovi nce ,W uhan430064,C hi na ;2.C ol l ege of V et er i nar y ,N or t hw est Sci —t e ch Uni ver s i -t y of A gr i cul t u r e a nd For es t r y 。
紫外-激光复合诱变选育天冬氨酸转氨酶高产菌株

[~ ] 1 3
0
斜面 培养基 : 白胨 7 氯化钠溶 液 0 5, 肉浸 蛋 , . 牛 膏 1, 0 无水 硫 酸镁 溶 液 0 2 磷 酸 二 氢 钾 溶 液 0 4, ., .
富马酸 l , 脂 2 . ,蒸 馏水 定容 ,氨水 调 p 为 0琼 17 H
7. , 0 0.1 MPa 2 n。 0 mi
瑚 1 。 n
平 板 培养 基 : 在斜 面 培养 基 的基 础上 加 入指 示
剂 , . M a灭 菌 2 i 01P 0m n
再生 培养 基 : 大肠 杆 菌 R 用 S 稳 定 液 配 M MM
置 , . MP 0 1 a灭 菌 2 n 0mi。 S MM缓 冲液 : 蔗糖 1 1 Mg 14 1 顺 丁烯 二酸 7 , C2 . ,
仅 可得 到遗传性 稳定 的高 产 菌株 , 且 操 作条 件 和 而 技 术要求 不高 , 实验操作 也较 为容易 , 因而使 其在 工 业微 生物 育种 中 占有绝对 优势 的地位 。 原生 质体诱变 是一种 在细胞 原生 质体化 后进行 诱变 的育种技 术 , 细胞被脱 去细胞 壁之后 , 使诱 变剂 更加 容易诱发 细胞 的遗传 基 因发 生突 变 , 而 以更 从
基于MCNP5对含有不同比例的CRT的普通混泥土的屏蔽能力的研究_杨奎_周四春_

第34卷第3期核电子学与探测技术Vol.34No.32014年3月Nuclear Electronics &Detection TechnologyMarch.2014基于MCNP5对含有不同比例的CRT 的普通混凝土的屏蔽能力的研究杨奎,周四春,程鹏亮,刘俊(成都理工大学核技术与自动化工程学院,成都610059)摘要:基于MCNP5对含有不同比例的CRT 的普通混凝土的屏蔽能力进行了研究。
通过模拟137C S源放出能量为0.662MeV 的γ射线穿过不同厚度的不同屏蔽体,得出γ射线穿过不同屏蔽体的透射光谱、线衰减系数和透射比。
模拟分析结果表明:随着CRT 部分比例的增加,出射光谱逐渐降低,线衰减系数逐渐增大,透射比逐渐减小,同时发现将CRT 部分比例占到9%时制造出来的混凝土的屏蔽性能和纯CRT 的屏蔽效果相同。
研究结果为将报废CRT 的回收提供了市场,也为制造抗辐射混凝土减小了代价,同时也为环境治理提供了一条途径。
关键词:MCNP5;CRT ;γ射线;屏蔽;混合中图分类号:TB 302文献标志码:A文章编号:0258-0934(2014)03-0327-04收稿日期:2013-12-24基金项目:国家自然科学基金资助项目(51272192)。
作者简介:杨奎(1989-),男,四川大邑人,在读硕士研究生,核资源与核勘查工程专业,从事核资源与核勘查技术研究。
通信作者:周四春(1954-),男,教授,研究方向为核勘查仪器与技术,E -mail :zsc@cdut.edu.cn 。
目前,常用于屏蔽γ射线的材料有铅、铁、普通混凝土[1]等。
铅的屏蔽效果好,但结构强度差,成本高,不耐高温,且铅是重金属[2],人体一旦摄入将导致严重后果;铁的机械强度高,易加工,但铁的屏蔽能力较弱,普通混凝土价格低廉,易获得,但屏蔽效果也不是很好。
传统的屏蔽材料已经不是屏蔽γ射线的最佳选择,必须寻找更好的屏蔽材料。
众所周知,报废的电视机等电子产品中的CRT 材料[3-4]中含有大量的重金属元素,如果随意丢弃,势必会对环境造成破坏,被列入《国家危险废物名录》中。
罗氏(英文版)-TUNEL-细胞凋亡原位检测试剂盒-POD

In Situ Cell Death Detection Kit, POD
y Version 14
Content version: July 2012
Kit for immunohistochemical detection and quantification of apoptosis (programmed cell death) at single cell level, based on labeling of DNA strand breaks (TUNEL technology): Analysis by light microscopy.
Cat. No. 11 684 817 910
Store the kit at Ϫ15 to Ϫ25°C
1 Kit (50 tests)
1. 1.1 1. 1.1 1.2 2. 2.1 2.2 3. 3.1 3.2
Preface Table of contents Preface .............................................................................................................................2 Table of contents ..................................................................................................................................... 2 Kit contents ................................................................................................................................................ 3 Introduction .....................................................................................................................5 Product overview ..................................................................................................................................... 5 Background information ....................................................................................................................... 8 Procedures and required materials ...........................................................................9 Flow chart .................................................................................................................................................10 Preparation of sample material ........................................................................................................10 3.2.1 Adherent cells, cell smears and cytospin preparations ..............................................11 3.2.2 Tissue sections ...........................................................................................................................11 3.2.2.1 Treatment of paraffin-embedded tissue ............................................................11 3.2.2.2 Treatment of cryopreserved tissue ......................................................................12 Labeling protocol ...................................................................................................................................13 3.3.1 Before you begin .......................................................................................................................13 3.3.2 Labeling protocol for adherent cells, cell smears, cytospin preparations and tissues ........................................................................................................14 3.3.3 Labeling protocol for difficult tissue ..................................................................................15 Signal conversion ..................................................................................................................................16 Appendix ....................................................................................................................... 17 Troubleshooting .....................................................................................................................................17 References ...............................................................................................................................................20 Ordering guide .......................................................................................................................................21
Differentiation of Human Pluripotent Stem Cells into Retinal Cells
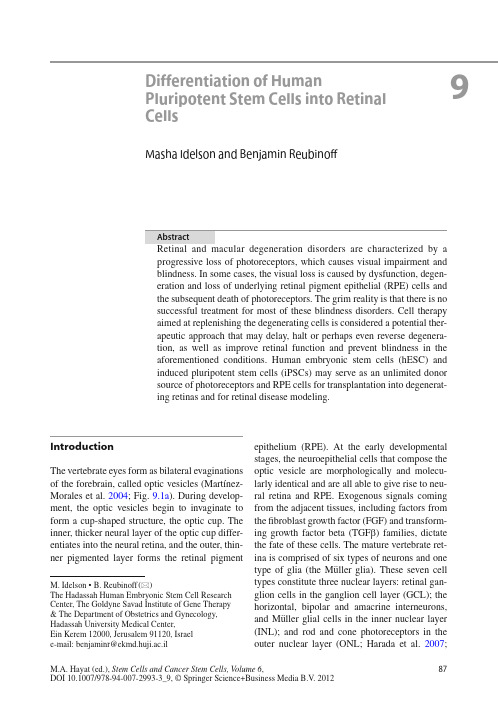
87M.A. Hayat (ed.), Stem Cells and Cancer Stem Cells, Volume 6,DOI 10.1007/978-94-007-2993-3_9, © Springer Science+Business Media B.V . 20129A bstractRetinal and macular degeneration disorders are characterized by a progressive loss of photoreceptors, which causes visual impairment and blindness. In some cases, the visual loss is caused by dysfunction, degen-eration and loss of underlying retinal pigment epithelial (RPE) cells and the subsequent death of photoreceptors. The grim reality is that there is no successful treatment for most of these blindness disorders. Cell therapy aimed at replenishing the degenerating cells is considered a potential ther-apeutic approach that may delay, halt or perhaps even reverse degenera-tion, as well as improve retinal function and prevent blindness in the aforementioned conditions. Human embryonic stem cells (hESC) and induced pluripotent stem cells (iPSCs) may serve as an unlimited donor source of photoreceptors and RPE cells for transplantation into degenerat-ing retinas and for retinal disease modeling.I ntroductionThe vertebrate eyes form as bilateral evaginations of the forebrain, called optic vesicles (Martínez-Morales et al. 2004 ; Fig. 9.1a ). During develop-ment, the optic vesicles begin to invaginate to form a cup-shaped structure, the optic cup. The inner, thicker neural layer of the optic cup differ-entiates into the neural retina, and the outer, thin-ner pigmented layer forms the retinal pigmentepithelium (RPE). At the early developmental stages, the neuroepithelial cells that compose the optic vesicle are morphologically and molecu-larly identical and are all able to give rise to neu-ral retina and RPE. Exogenous signals coming from the adjacent tissues, including factors from the fi broblast growth factor (FGF) and transform-ing growth factor beta (TGF b ) families, dictate the fate of these cells. The mature vertebrate ret-ina is comprised of six types of neurons and one type of glia (the Müller glia). These seven cell types constitute three nuclear layers: retinal gan-glion cells in the ganglion cell layer (GCL); the horizontal, bipolar and amacrine interneurons, and Müller glial cells in the inner nuclear layer (INL); and rod and cone photoreceptors in the outer nuclear layer (ONL; Harada et al. 2007;M . I delson • B . R eubinoff (*)T he Hadassah Human Embryonic Stem Cell Research Center, The Goldyne Savad Institute of Gene Therapy & The Department of Obstetrics and Gynecology , H adassah University Medical Center ,E in Kerem 12000 ,J erusalem 91120 ,I srael e -mail: b enjaminr@ekmd.huji.ac.il D ifferentiation of HumanPluripotent Stem Cells into Retinal Cells Masha Idelson and Benjamin Reubinoff88M. Idelson and B. ReubinoffFig. 9.1b ). The photoreceptor cells capture lightphotons and transform their energy into electrical signals by a mechanism called phototransduction. The visual pigment which is utilized in this process is located on membranal discs in the outer seg-ments of photoreceptors. The outer segments are continuously renewed: the old discs are shed and new disks form. When the photoreceptors absorb light, they send the signal through the retinal interneurons to the ganglion cells which transmit the electrical impulse to the brain by their axons forming the optic nerve. Rods are responsible for night vision, whereas cones are responsible for color vision and detecting fi ne details. The macula is a small part of the retina which is rich in cones and responsible for detailed central vision.R PE cells that compose the outer layer of the optic cup are pigmented cuboidal cells which lie between the neural retina and the choriocapil-laris, which include the blood vessels supplying the retina. The multiple villi on their apical side are in direct contact with the outer segments ofextraocular mesenchymeabneural retinalensoptic nerveoptic cupsurface ectodermRPEFGFoptic vesiclechoroidBM RPE cone ONLINL GCLlightHC BC MC ACONrod F ig. 9.1 D evelopment and structural arrangement of the retina. ( a ) Schematic representation of retinal development including the transition from optic vesicle to optic cup and retinal patterning. ( b ) Schematic diagram of retinal cells arrangement and connections. A bbreviations :A C amacrinecell, B C bipolar cell, B M Bruch’s membrane, G CL gan-glion cell layer, H C horizontal cell, I NL inner nuclear layer, M C Müller cell, O N optic nerve, O NL outer nuclear layer89 9 Differentiation of Human Pluripotent Stem Cells into Retinal Cellsthe photoreceptor cells; on their basal side, the RPE is in contact with the underlying basal mem-brane, termed Bruch’s membrane that separates the RPE from the choroid. These cells play cru-cial roles in the maintenance and function of the retina and its photoreceptors. As a layer of pig-mented cells, the RPE absorbs the stray light that was not absorbed by the photoreceptors. The RPE cells form a blood–retinal barrier due to decreased permeability of their junctions. The RPE cells transport ions, water, and metabolic end products from the retina to the bloodstream. They are involved in supplying the neural retina with nutrients from the bloodstream, such as glu-cose, retinol, and fatty acids. Another important function of the RPE is the phagocytosis of shed photoreceptor outer segments. After the outer segments are digested, essential substances such as retinal are recycled. Retinal is also recycled and returned to photoreceptors by the process known as the visual cycle. The precise functioning of the RPE is essential for visual performance. Failure of one of these functions can lead to degeneration of the retinal photoreceptors, vision impairment and blindness.T here are many inherited and age-related eye disorders that cause degeneration of the retina as a consequence of loss of photoreceptor cells. Retinal and macular degeneration disorders can be divided into two main groups. The fi rst group primarily affects the photoreceptors and involves the majority of cases of retinitis pigmentosa. In the second group, the primary damage is to the adjacent RPE cells, and as a consequence of this damage, the photoreceptors degenerate. This group includes age-related macular degeneration, Stargardt’s macular dystrophy, a subtype of Leber’s congenital amaurosis in which RPE65 is mutated, Best’s disease and some cases of retini-tis pigmentosa, as well.W ith regard to retinitis pigmentosa (RP), it is a group of inherited retinal degeneration diseases that are caused, as mentioned above, by a primary progressive loss of rod and cone photoreceptors, followed by a subsequent degeneration of RPE (Hartong et al. 2006). The disease affects approxi-mately 1.5 million patients worldwide and is the most common cause of blindness in people under 70 years of age in the western world. The disease can be characterized by retinal pigment deposits visible on the fundus examination. In most cases, the disease primarily affects rods. At later stages of the disease, the degeneration of cones takes place. As a consequence of disease progression, the patients’ night vision is reduced. Patients initially lose peripheral vision while retaining central vision (a visual status termed “tunnel vision”). In advanced cases, central vision is also lost, commonly at about 60 years of age. The disease affects about 1 in 4,000. The inheritance can be autosomal-recessive, autosomal-dominant or X-linked (in ~50–60%, 30–40%, and 5–15% of cases, respectively). Mutations in more than 140 genes have been iden-tifi ed as causing RP (Hartong et al. 2006).Among these genes are those involved in phototransduc-tion, like rhodopsin, the a- and b- subunits of phos-phodiesterase, the a- and b- subunits of Rod cGMP gated channel and arrestin. The additional muta-tions were found in genes encoding structural pro-teins, like peripherin, rod outer segment protein and fascin. They were also found in transcription factors involved in photoreceptors’ development such as Crx and Nrl, and in other genes, whose products are involved in signaling, cell-cell interac-tion and trafficking of intracellular proteins. Currently, there is no effective cure for RP. Treatment with vitamin A palmitate, omega-3 fatty acids and other nutrients may somewhat slow the rate of the disease progression in many cases. Reduction in exposure to light was also shown to decrease the rate of retinal degeneration.A mong the group of retinal degenerations that are caused by primary loss of RPE cells or their function, age-related macular degeneration (AMD) is the most frequent condition and the leading cause of visual disability in the western world (Cook et al. 2008).Among people over 75 years of age, 25–30% are affected by AMD, with progressive central visual loss that leads to blindness in 6–8%. The retinal degeneration pri-marily involves the macula. The dry form of AMD is initiated by hyperplasia of the RPE and formation of drusen deposits, consisting of meta-bolic end products underneath the RPE or within the Bruch’s membrane. It may gradually progress into the advanced stage of geographic atrophy90M. Idelson and B. Reubinoff with degeneration of RPE and photoreceptorsover large areas of the macula causing central visual loss. Ten percent of dry AMD patients will progress to neovascular (wet) AMD, with blood vessels sprouting through the Bruch’s membrane with subsequent intraocular leakage and/or bleed-ing, accelerating the loss of central vision. While the complicating neovascularization can be treated with anti-VEGF agents, currently there is no effective treatment to halt RPE and photore-ceptor degeneration and the grim reality is that many patients eventually lose their sight (Cook et al. 2008).S targardt’s macular dystrophy (SMD) is the most common form of inherited macular dystro-phy affecting children (Walia and Fishman 2009). The disease is symptomatically similar to AMD. The prevalence of SMD is about 1 in 10,000 chil-dren. The disease involves progressive central visual loss and atrophy of the RPE beneath the macula following accumulation of lipofuscin in RPE cells, which is suggested to consist of non-degradable material, derived from ingested pho-toreceptor outer segments. The inheritance is predominantly autosomal recessive, although an autosomal dominant form has also been described. The mutation in the ABCA4 gene was found to be a most common cause of SMD. The product of the ABCA4 gene is involved in energy transport to and from photoreceptors. The mutated protein cannot perform its transport function and, as a result, photoreceptor cells degenerate and vision is impaired. Currently, there is no effective treat-ment for SMD.C ell therapy to replenish the degenerating cells appears as a promising therapeutic modality that may potentially halt disease progression in the various retinal and macular degeneration dis-orders caused by loss and dysfunction of RPE cells and photoreceptors (da Cruz et al. 2007).I n this chapter we will discuss the potential of human pluripotent cells which includes human embryonic stem cells (hESC) and induced pluripotent stem cells (iPSCs), to gen-erate various types of retinal cells that could be used for transplantation therapy of retinal degen-eration disorders and disease modeling for drug discovery. C ell Therapy of Retinal and Macular DegenerationsT he eye is an attractive organ for cell therapy as it is easily accessible for transplantation and for simple monitoring of graft survival and potential complications by direct fundoscopic visualiza-tion. Anatomically, it is a relatively confi ned organ limiting the potential of unwanted extra-ocular ectopic cell distribution, and a low number of cells are required to replenish the damaged cells. The eye is also one of the immune privi-leged sites of the body.T he concept of replacing dysfunctional or degenerated retina by transplantation has been developing ever since the fi rst retina-to-retina transplant in 1986 (Turner and Blair 1986).In most studies, primary retinal immature (fetal) tissue has been used as donor material. It was demonstrated that such transplants can survive, differentiate, and even establish connections with the host retina to a limited degree (Ghosh et al. 1999). The subretinal transplantation of healthy RPE has some advantages over neural retinal transplantation, as it concerns only one cell type that is not involved in neural networking. Transplantation of RPE has been studied exten-sively in animal models (Lund et al. 2001).The most commonly used animal model of retinal degeneration is the Royal College of Surgeons (RCS) rat model, in which primary dysfunction of the RPE occurs as a result of a mutation in the receptor tyrosine kinase gene M ertk(D’Cruz et al. 2000). This leads to impaired phagocytosis of shed photoreceptor outer segments, with sec-ondary degeneration and progressive loss of pho-toreceptors within the fi rst months of life. It was reported that rat and human RPE cells rescued photoreceptor cells from degeneration when transplanted into the subretinal space of RCS rats (Li and Turner 1988; Coffey et al. 2002).The ability of transplanted RPE cells to restore retinal structure and function has been demonstrated in clinical trials. In humans, autologous transplanta-tions of peripheral RPE as well as macular trans-locations onto more peripheral RPE provide a proof that positioning the macula above relatively91 9 Differentiation of Human Pluripotent Stem Cells into Retinal Cellshealthier RPE cells can improve visual functionin AMD patients (Binder et al. 2004; da Cruz et al. 2007). Nevertheless, the surgical procedures for autologous grafting are challenging and are often accompanied by signifi cant complications. In addition, autologous RPE transplants may carry the same genetic background, environmen-tal toxic and aging-related effects that may have led to macular RPE failure and the development of AMD in the patient. It is also problematic to use autologous cells when all the RPE cells are damaged. Cell sources that can be used for such therapy include allogeneic fetal and adult RPE (Weisz et al. 1999; Binder et al. 2004; da Cruz et al. 2007). However, the use of fetal or adult retinal tissues for transplantation is severely lim-ited by ethical considerations and practical prob-lems in obtaining sufficient tissue supply. The search for a cell source to replace autologous RPE such as immortalized cell lines, umbilical cord-derived cells as well as bone marrow-derived stem cells continues.T he derivation of hESCs more than a decade ago has raised immense interest in the potential clinical use of the cells for regeneration (Thomson et al. 1998; Reubinoff et al. 2000).Along the years, signifi cant progress has been made towards the use of hESCs in clinical trials.T he other promising source of cells for transplantation therapy is iPSCs that are simi-lar to hESCs in their stemness characteristics and pluripotency. These cells could be gener-ated from different human somatic cells by transduction of four defi ned transcription fac-tors: Oct3/4, Sox2, Klf4, and c-Myc (Takahashi et al. 2007).G eneration of RPE and neural retina from hESCs and iPSC has numerous advantages, as it can be done from pathogen-free cell lines under good manufacturing practice (GMP) conditions with minimal variation among batches. Such cells can be characterized extensively prior to preclinical studies or for clinical applications, and an unlimited numbers of donor cells can be generated from them. In the following para-graphs, strategies for induction of differentiation of hESCs and iPSCs towards RPE and neural retina fate are reviewed. D ifferentiation into Retinal Pigment EpitheliumI t was reported for the fi rst time in mice and pri-mates that the differentiation of ES cells into RPE could be induced by co-culture with PA6 stromal cells (Kawasaki et al. 2002; Haruta et al. 2004). The resulting cells had polygonal epithelial mor-phology and extensive pigmentation. The cells expressed the markers that are characteristic of RPE. They developed typical ultrastructures and exhibited some functions of RPE. The differenti-ation of hESC into RPE was first reported by Klimanskaya et al. (2004).According to their protocol, hESCs underwent spontaneous differ-entiation by overgrowth on mouse embryonic fibroblasts (MEF), in feeder-free conditions or, alternatively, as embryoid bodies (EBs) in com-bination with withdrawal of bFGF from the medium. The yield of the formation of RPE cells after 4–8 weeks of spontaneous differentiation was relatively low; for example,<1% of EBs con-tained pigmented cells at this stage. However, after 6–9 months in culture, all the EBs contained pigmented cells. The areas of pigmented cells could be further isolated mechanically and prop-agated by passaging as RPE lines. Klimanskaya and colleges characterized the hESC-derived RPE cells by transcriptomics and demonstrated their higher similarity to primary RPE tissue than to human RPE lines D407 and ARPE-19. The low yield of spontaneously differentiating RPE cells was improved by induction of differentia-tion with Wnt and Nodal antagonists, Dkk1 and LeftyA, respectively, the factors that are sug-gested to promote retinal differentiation. This treatment gave rise to pigmented cells within 38% of the hESC colonies after 8 weeks (Osakada et al. 2008). Immunostaining with the ZO-1 anti-body showed that by day 120, hESC-derived pig-mented cells formed tight junctions (about 35% of total cells). We showed that differentiation toward the neural and further toward the RPE fate could be augmented by vitamin B3 (nicotin-amide; Idelson et al. 2009).We further showed that Activin A, in the presence of nicotinamide, effi ciently induces and augments differentiation92M. Idelson and B. Reubinoffinto RPE cells. This is in line with the presumed role of Activin A in RPE development i n vivo .In the embryo, extraocular mesenchyme-secreted members of the TGF b superfamily are thought to direct the differentiation of the optic vesicle into RPE (Fuhrmann et al. 2000).Under our culture conditions, when the cells were grown in suspen-sion as free-fl oating clusters, within 4 weeks of differentiation, 51% of the clusters contained pigmented areas and about 10% of the cells within the clusters were pigmented. When we modifi ed the differentiation conditions to includea stage of monolayer culture growth, the yield of the RPE-like pigmented cells was signifi cantly improved and 33% of the cells were pigmented after 6 weeks of differentiation. The derivation of RPE from hESCs and iPSCs without any external factor supplementation was also demonstrated by other groups (Vugler et al. 2008 ; Meyer et al. 2009 ; Buchholz et al. 2009).T he hESC-derived RPE cells were extensively characterized, including demonstration, both at the mRNA and the protein levels, of the expres-sion of RPE-specifi c markers, such as RPE65, CRALBP, Bestrophin, Tyrosinase, PEDF, PMEL17, LRAT, isoforms of MiTF abundant in RPE, and others. The cells expressed markers of tight junctions that join the adjacent RPE cells: ZO-1, occludin and claudin-1 (Vugler et al. 2008 ) . Electron microscopic analysis revealed that the hESC-derived RPE cells showed features characteristic of RPE. The cells were highly polarized with the nuclei located more basally, and the cytoplasm with the mitochondria and melanin granules of different maturity more api-cally. A formation of basal membrane was observed on the basal surface of the RPE cell. Similar to putative RPE, the hESC-derived RPE basal membrane was shown to be composed of extracellular matrix proteins, collagen IV , lami-nin and fi bronectin (Vugler et al.2008).The appearance of apical microvilli was demonstrated at the apical surface of the RPE. The presence of tight and gap junctions on the apical borders of the RPE cells was also confi rmed by electron microscopy. O ne of the most important functions of RPE cells i n vivo is phagocytosis of shed photoreceptor outer segments, as part of the continuous renewal process of rods and cones. The hESC-derived RPE cells demonstrated the ability to phagocyto-size latex beads or purifi ed photoreceptor outer segments, confi rming that these cells are func-tionali n vitro . It may be concluded from all these studies that human pluripotent stem cells have a potential to give rise to pigmented cells exhibiting the morphology, marker expression and functionof authentic RPE.D ifferentiation into Retinal Progenitors and Photoreceptors O ur group showed, for the fi rst time, the potential of highly enriched cultures of hESC-derived neu-ral precursors (NPs) to differentiate towards the neural retina fate (Banin et al. 2006).We demon-strated that the NPs expressed transcripts of key regulatory genes of anterior brain and retinal development. After spontaneous differentiation i n vitro , the NPs gave rise to progeny expressing markers of retinal progenitors and photoreceptor development, though this was uncommon and cells expressing markers of mature photorecep-tors were not observed. We showed that after transplantation into rat eyes, differentiation into cells expressing specifi c markers of mature photoreceptors occurred only after subretinal transplantation (between the host RPE and pho-toreceptor layer) suggesting that this specifi c microenvironment provided signals, yet unde-fi ned, that were required to support differentia-tion into the photoreceptoral lineage.P rogress towards controlling and inducing the differentiation of hESCs into retinal progenitors and neurons i n vitro was reported in the study of Lamba et al. ( 2006).They treated hESC-derived EBs for 3 days with a combination of factors,including Noggin, an inhibitor of BMP signaling, Dkk1, a secreted antagonist of the Wnt signaling pathway and insulin-like growth factor 1 (IGF-1), which is known to promote retinal progenitor dif-ferentiation. The cultivation of EBs with these factors was followed by differentiation on Matrigel or laminin for an additional 3 weeks in the presence of the combination of the three93 9 Differentiation of Human Pluripotent Stem Cells into Retinal Cellsfactors together with bFGF. Under these culture conditions, the majority of the cells developed the characteristics of retinal progenitors and expressed the specifi c markers Pax6 and Chx10 (82% and 86% of the cells, respectively). The authors showed that after further differentiation, the cells expressed markers of photoreceptor development Crx and Nrl (12% and 5.75%, respectively). About 12% of the cells expressed also HuC/D, the marker of amacrine and ganglion cells. The expression of markers of the other sub-types of retinal neurons was demonstrated, as well. However, only very few cells (<0.01%) expressed markers of mature photoreceptors, blue opsin and rhodopsin. The abundance of cells expressing markers of photoreceptors could be accelerated by co-culture with retinal explants, especially when the explants originated from mice bearing a mutation that causes retinal degeneration.T o better characterize the phenotype of retinal cells obtained with this differentiation protocol, a microarray-based analysis comparing human retina to the hESC-derived retinal cells was per-formed (Lamba and Reh 2011).It was demon-strated that gene expression in hESC-derived retinal cells was highly correlated to that in the human fetal retina. In addition, 1% of the genes that were highly expressed in the hESC-derived cultures could be attributed to RPE and ciliary epithelium differentiation.A n alternative protocol for the derivation of retinal progenitors and photoreceptors was pro-posed by Osakada et al. (2008).Similar to the protocol for the derivation of RPE cells, they used serum-free fl oating cultures in combination with the Dkk1 and LeftyA. After 20 days of cul-ture in suspension, the cells were replated on poly-D-lysine/laminin/fi bronectin-coated slides. Osakada and co-authors demonstrated that on day 35 in culture, about 16% of colonies were positive for retinal progenitor markers Rx and Pax6. Differentiation towards photoreceptor fate was augmented in the presence of N2 by treat-ment with retinoic acid and taurine, which are known inducers of rod fate differentiation. Under these conditions, after an extended culture period of 170 days, about 20% of total cells were positive for Crx, an early photoreceptor marker. On day 200, about 8.5% of the cells expressed the mature rod photoreceptor marker, rhodopsin, as well as cone photoreceptor markers, red/green and blue opsins (8.9% and 9.4%, respectively).A n alternative approach was proposed by the same group based on the use of small molecules. In this method, the chemical inhibitors CKI-7 and SB-431542 that inhibit Wnt and Activin A signaling, respectively, and Y-27632, the Rho-associated kinase inhibitor, which prevents disso-ciation-induced cell death, were used. These molecules were shown to mimic the effects of Dkk1 and LeftyA (Osakada et al. 2009).This strategy, which doesn’t involve the use of recom-binant proteins which are produced in animal or E scherichia coli cells, is more favorable for the gen-eration of cells for future transplantation therapy.I n another study that was published by Meyer et al .(2009), after initial differentiation in sus-pension for 6 days, the aggregates were allowed to attach to laminin–coated culture dishes. After further differentiation as adherent cultures, neu-roepithelial rosettes were formed, which were mechanically isolated and subsequently culti-vated as neurospheres. The authors didn’t use any soluble factors; moreover, they showed that under these conditions, the cells expressed endogenous Dkk1 and Noggin. They also demonstrated that in concordance with the role of bFGF in retinal specifi cation, the inhibition of endogenous FGF-signaling abolished retinal differentiation. Under their differentiation protocol, by day 16, more than 95% of the cells expressed the retinal pro-genitor markers, Pax6 and Rx. The authors dem-onstrated that by day 80 of differentiation, about 19% of all neurospheres contained Crx+ cells and within these Crx+ neurospheres, 63% of all cells express Crx and 46.4% of the cells expressed mature markers, such as recoverin and cone opsin.I n all of the above studies, differentiated cells expressing the retinal markers were obtained; however, the cells were not organized in a three-dimensional retinal structure. In a paper recently published by Eiraku et al. (2011),the authors cul-tured free-fl oating aggregates of mouse ES cells in serum-free medium in the presence of base-ment membrane matrix, Matrigel, that could also94M. Idelson and B. Reubinoffbe substituted with a combination of laminin, entactine and Nodal. Using a mouse reporter ES cell line, in which green fl uorescent protein (GFP) is knocked in at the Rx locus, the authors showed that Rx-GFP+ epithelial vesicles were evaginated from the aggregates after 7 days of differentiation under these conditions. On days 8–10, the Rx-GFP+ vesicles changed their shape and formed optic cup-like structures. The inner layer of these structures expressed markers of the neural retina whereas the outer layer expressed markers of RPE. The authors demonstrated that differen-tiation into RPE required the presence of the adjacent neuroectodermal epithelium as a source of diffusible inducing factors. In contrast, the differentiation into neural retina did not require tissue interactions, possibly because of the intrinsic inhibition of the Wnt-signaling pathway. Eiraku and colleagues showed that the retinal architecture, which was formed within the optic vesicle-like structures, was comparable to the native developing neural retina.R ecently, optic vesicle-like structures were also derived from hESCs and iPSCs using the protocol described above, which is based on iso-lating the neural rosette-containing colonies and culturing them in suspension (Meyer et al. 2011). The cells within the structures expressed the markers of retinal progenitors, and after differen-tiation gave rise to different retinal cell types. It was shown that the ability of optic vesicle-like structures to adopt RPE fate could be modulated by Activin A supplementation. The production of these three-dimensional retinal structures opens new avenues for studying retinal development in normal and pathological conditions.T ransplantation of Pluripotent Stem Cell-Derived Retinal CellsA key step towards future clinical transplanta-tions of hESC-derived RPE and neural retina is to show proof of their therapeutic potential i n vivo. Various animal models of retinal degeneration have been used to evaluate the therapeutic effect of transplanted retinal cells. Human ESC-derived RPE cells were transplanted subretinally to the degenerated eyes of RCS rats. Transplantation of the hESC-derived RPE cells between the RPE and the photoreceptor layer rescued retinal struc-ture and function (Lund et al. 2006; Vugler et al. 2008; Idelson et al. 2009; Lu et al. 2009).The subretinally engrafted hESC-derived RPE cells salvaged photoreceptors in proximity to the grafts as was shown by the measurement of the thick-ness of the ONL, the layer of photoreceptor nuclei, which is an important monitor of photore-ceptor cell survival. The ONL thickness was significantly increased in transplanted eyes in comparison to the degenerated non-treated eyes.I n order to evaluate the functional effect of transplanted cells i n vivo, the electroretinography (ERG) that directly measures the electrical activ-ity of the outer (a-wave) and inner (b-wave) retina in response to light stimulation was used. It was demonstrated that after transplantation of hESC-derived RPE, ERG recordings revealed a signifi -cant preservation of retinal function in the treated eyes as compared to control untreated eyes (Lund et al. 2006; Idelson et al. 2009).The visual func-tion of the animals was also estimated by an optomotor test, which monitors the animal’s refl exive head movements in response to a rotat-ing drum with fi xed stripes. Animals transplanted with hESC-derived RPE showed signifi cantly better visual performance in comparison to con-trol animals (Lund et al. 2006; Lu et al. 2009). The presence of rhodopsin, a major component of photoreceptor outer segments, within the sub-retinaly transplanted pigmented cells suggested that they could perform phagocytosis i n vivo (Vugler et al. 2008; Idelson et al. 2009).B ridging the gap between basic research and initial clinical trials requires immense resources to ensure safety and efficacy. Human ESC-derived RPE cell lines were generated using a current Good Manufacturing Practices (cGMP)-compliant cellular manufacturing process (Lu et al. 2009). Long-term studies analyzing safety and efficacy of transplantation of these GMP-compliant hESC-derived RPE cells revealed that the subretinally transplanted cells survived for a period of up to 220 days and provided prolonged functional improvement for up to 70 days after transplantation. The potential of the hESC-derived。
Incucyte

Product Information Presentation, Storage and StabilityThe Incucyte® Fabfluor-pH Antibody Labeling Reagents for antibody internalization are supplied as lyophilized solids in sufficient quantity to label 50 μg of test antibody, when used at the suggested molar ratio (1:3 of test antibody to labeling Fab). The lyophilized solid can be stored at 2-8° C for one year. Once re-hydrated, any unused reagent should be aliquoted and stored at -80° C for up to one year. Avoid repeated freeze-thaw cycles.Incucyte® Fabfluor-pH Antibody Labeling ReagentsFor Antibody Internalization AssaysAntibody Labeling Reagent Rehydrated: -80° C *Excitation and Emission maxima were determined at a pH of 4.5.Fabfluor_quick_guideBackgroundIncucyte ® Fabfluor-pH Antibody Labeling Reagents are designed for quick, easy labeling of Fc-containing test antibodies with a Fab fragment-conjugated pH-sensitive fluorophore. The pH-sensitive dye based system exploits the acidic environment of the lysosomes to quantify in-ternalization of the labeled antibody. As Fabfluor labeled antibodies reside in the neutral extracellular solution (pH 7.4), they interact with cell surface specific antigens and are internalized. Once in the lysosomes, they enter an acidic environment (pH 4.5–5.5) and a substantial in-crease in fluorescence is observed. In the absence of ex-pression of the specific antigen, no internalization occurs and the fluorescence intensity of the labeled antibodies remains low. With the Incucyte ® integrated analysis soft-ware, background fluorescence is minimized. These reagents have been validated for use with a number of different antibodies in a range of cell types. The Incucyte ® Live-Cell Analysis System enables real-time, kinetic eval -uation of antibody internalization.Recommended UseWe recommend that the Incucyte ® Fabfluor-pH Antibody Labeling Reagents are prepared at a stock concentration of 0.5 mg/mL by the addition of 100 μL of sterile water and triturated (centrifuge if solution not clear). The reagent may then be diluted directly into the labeling mixture with test antibody. Do NOT sonicate the solution.Additional InformationThe Fab antibody was purified from antisera by a combination of papain digestion and immunoaffinity chromatography using antigens coupled to agarose beads. Fc fragments and whole IgG molecules have been removed.Human Red (Cat. No. 4722) or Human Orange (Cat. No. 4812)—Based on immunoelectrophoresis and/ or ELISA, the antibody reacts with the Fc portion of human IgG heavy chain but not the Fab portion of human IgG. No antibody was detected against human IgM, IgA or against non-immunoglobulin serum proteins. The anti-body may cross-react with other immunoglobulins from other species.Mouse IgG1 (Cat. No. 4723), IgG2a (Cat. No. 4750) or IgG2b (Cat. No. 4751)—Based on antigen-binding assay and/or ELISA, the antibody reacts with the Fc portion of mouse IgG, IgG2a or IgG2b, respectively, but not the Fab portion of mouse immunoglobulins. No antibody was detected against mouse IgM or against non–immunoglobulin serum proteins. The antibody may cross-react with other mouse IgG subclasses or with immunoglobulins from other species.Rat (Cat. No. 4737)—Based on immunoelectrophoresis and/or ELISA, the antibody reacts with the Fc portion of rat IgG heavy chain but not the Fab portion of rat IgG. No antibody was detected against rat IgM, IgA or against non-immunoglobulin serum proteins. The antibody may cross-react with other immunoglobulins from other species.A.B.C.D.R e d O b j e c t A r e a (x 105 μm 2 p e r w e l l )Time (hours)A U C x 106 (0–12 h )log [α–CD71] (g/mL)Example DataFigure 1: Concentration-dependent increase in antibody internalization of Incucyte ® Fabfluor labeled-α-CD71 in HT1080 cells. α-CD71 and mouse IgG1 isotype control were labeled with Incucyte ® Mouse IgG1 Fabfluor-pH Red Antibody Labeling Reagent. HT1080 cells were treated with either Fabfluor-α-CD71 or Fabfluor-IgG1 (4 μg/mL); HD phase and red fluorescence images were captured every 30 minutes over 12 hours using a 10X magnification. (A) Images of cells treated with Fabfluor-α-CD71 display red fluorescence in the cytoplasm (images shown at 6 h). (B) Cells treated with labeled isotype control display no cellular fluorescence. (C) Time-course of Fabfluor-α-CD71 internalization with increasing concentrations of Fabfluor-α-CD71 (progressively darker symbols). Internalization has been quantified as the red object area for each time-point. (D) Concentration response curve to Fabfluor-α-CD71. Area under the curve (AUC) values have been determined from the time-course shown in panel C (0-12 hours) and are presented as the mean ± SEM, n=3 wells.CD71-FabfluorIgG-FabfluorProtocols and ProceduresMaterialsIncucyte® Fabfluor-pH Antibody Labeling ReagentTest antibody of interest containing human, mouse, or rat IgG Fc region (at known concentration)Target cells of interestTarget cell growth mediaSterile distilled water96-well flat bottom microplate (e.g. Corning Cat. No. 3595) for imaging96-well round black round bottom ULA plate (e.g. Corning Cat. No. 45913799) or amber microtube (e.g. Cole Parmer Cat. No. MCT-150-X, autoclaved) for conjugation step0.01% Poly-L-Ornithine (PLO) solution (e.g. Sigma Cat. No. P4957), optional for non-adherent cells Recommended control antibodiesIt is strongly recommended that a positive and negative control is run alongside test antibodies and cell lines. For example, CD71, which is a mouse anti-human antibody, is recommended as a positive control for the mouse Fab.Anti-CD71, clone MEM-189, IgG1 e.g. Sigma Cat. No. SAB4700520-100UGAnti-CD71, clone CYG4, IgG2a e.g. BioLegend Cat. No. 334102Isotype controls, depending on isotype being studied—Mouse IgG1, e.g. BioLegend Cat. No. 400124, Mouse IgG2a e.g. BioLegend Cat. No. 401501Preparation of Incucyte® Antibody Internalization Assay 1. Seed target cells of interest1.1 Harvest cells of interest and determine cell concentra-tion (e.g. trypan blue + hemocytometer).1.2 Prepare cell seeding stock in target cell growth mediawith a cell density to achieve 40–50% confluence be-fore the addition of labeled antibodies. The suggested starting range is 5,000–30,000 cells/well, although the seeding density will need to be optimized for each cell type.Note: For non-adherent cell types, a well coating may be required to maintain even cell distribution in the well. For a 96-well flat bottom plate, we recommend coating with 50 μL of either 0.01% Poly-L-Or-nithine (PLO) solution or 5 μg/mL fibronectin diluted in 0.1% BSA.Coat plates for 1 hour at ambient temperature, remove solution from wells and then allow the plates to dry for 30-60 minutes prior to cell addition.1.3 Using a multi-channel pipette, seed cells (50 µL perwell) into a 96-well flat bottom microplate. Lightly tapplate side to ensure even liquid distribution in well. Toensure uniform distribution of cells in each well, allowthe covered plate sit on a level surface undisturbed at room temperature in the tissue culture hood for 30minutes. After cells are settled, place the plate insidethe Incucyte® Live-Cell Analysis System to monitor cell confluence.Note: Depending on cell type, plates can be used in assay once cells have adhered to plastic and achieved normal cell morphology e.g.2-3 hours for HT1080 or 1-2 hours for non-adherent cell types. Some cell types may require overnight incubation.2. Label Test Antibody2.1 Rehydrate the Incucyte® Fabfluor-pH Antibody Label-ing Reagent with 100 µL sterile water to result in a final concentration of 0.5 mg/mL. Triturate to mix (centrifuge if solution is not clear).Note: The reagent is light sensitive and should be protected fromlight. Rehydrated reagent can be aliquoted into amber or foilwrapped tubes and stored at -80° C for up to 1 year (avoid freezing and thawing).2.2 Mix test antibody with rehydrated Incucyte® Fabfluor–pH Antibody Labeling Reagent and target cell growth media in a black round bottom microplate or ambertube to protect from light (50 µL/well).a. Add test antibody and Incucyte® Fabfluor–pH Anti-body Labeling Reagent at 2X the final concentration.We suggest optimizing the assay by starting with afinal concentration of 4 µg/mL of test antibody or theFabfluor-pH Antibody Labeling Reagent (i.e. 2Xworking concentration = 8 µg/mL).Note: A 1:3 molar ratio of test antibody to Incucyte® Fabfluor-pHAntibody Labeling Reagent is recommended. The labeling re-agent is a third of the size of a standard antibody (50 and 150KDa, respectively). Therefore, labeling equal quantities will pro-duce a 1:3 molar ratio of test antibody to labeling Fab.b. Make sufficient volume of 2X labeling solution for50 µL/well for each sample. Triturate to mix.c. Incubate at 37° C for 15 minutes protected from light.Note: If performing a range of concentrations of test antibody,e.g. concentration response-curve, it is recommended to createthe dilution series post the conjugation step to ensure consistentmolar ratio. We strongly recommend the use of both a negativeand positive control antibody in the same plate.3. Add labeled antibody to cells3.1 Remove cell plate from incubator.3.2 Using a multi-channel pipette, add 50 µL of 2X labeledantibody and control solutions to designated wells.Remove any bubbles and immediately place plate in the Incucyte® Live-Cell Analysis System and start scanning.Note: To reduce the risk of condensation formation on the lid priorto first image acquisition, maintain all reagents at 37° C prior toplate addition.4. Acquire images and analyze4.1 In the Incucyte® Software, schedule to image every15-30 minutes, depending on the speed of the specific antibody internalization.a Scan on schedule, standard. If the Incucyte® Cell-by-Cell Analysis Software Module (Cat. No. 9600-0031)is available, adherent cell-by-cell or non-adherentcell-by-cell scan types can be selected.b Channel selection: select “phase” and “red” or“phase” and "orange” (depending on reagent used).c Objective: 10X or 20X depending on cell types used,generally 10X is recommended for adherent cells,and 20X for non-adherent or smaller cells.NOTE: The optional Incucyte® Cell-by-Cell Analysis SoftwareModule enables the classification of cells into sub-populationsbased on properties including fluorescence intensity, size andshape. For further details on this analysis module and its appli-cation, please see: /cell-by-cell.4.2 To generate the metrics, user must create an AnalysisDefinition suited to the cell type, assay conditions andmagnification selected.4.3 Select images from a well containing a positiveinternalization signal and an isotype control well(negative signal) at a time point where internalizationis visible.4.4 In the Analysis Definition:Basic Analyzer:a. Set up the mask for the phase confluence measurewith fluorescence channel turned off.b. Once the phase mask is determined, turn the fluores-cence channel on: Exclude background fluorescencefrom the mask using the background subtractionfeature. The feature “Top-Hat” will subtract localbackground from brightly fluorescent objects withina given radius; this is a useful tool for analyzing ob-jects which change in fluorescence intensity overtime.i The radius chosen should reflect the size of thefluorescent object but contain enough backgroundto reliably estimate background fluorescence inthe image; 20-30 μm is often a useful startingpoint.ii The threshold chosen will ensure that objectsbelow a fluorescence threshold will not bemasked.iii Choose a threshold in which red or orange objectsare masked in the positive response image but lownumbers in the isotype control, negative responsewell. For a very sensitive measurement, for example,if interested in early responses, we suggest athreshold of 0.2.NOTE: The Adaptive feature can be used for analysis but maynot be as sensitive and may miss early responses. If interestedin rate of response, Top-Hat may be preferable.Cell-by-Cell (if available):a. Create a Cell-by-Cell mask following the softwaremanual.b. There is no need to separate phase and fluorescencemasks. The default setting of Top-Hat No Mask forthe fluorescence channel will enable backgroundsubtraction without generation of a mask. Ensurethat the Top-Hat radius is set to a value higher thanthe radius of the larger clusters to avoid excess back-ground subtraction.c. The threshold of fluorescence can be determined inCell-by-Cell Classification.Specifications subject to change without notice.© 2020. All rights reserved. Incucyte, Essen BioScience, and all names of Essen BioScience prod -ucts are registered trademarks and the property of Essen BioScience unless otherwise specified. Essen BioScience is a Sartorius Company. Publication No.: 8000-0728-A00Version 1 | 2020 | 04Sales and Service ContactsFor further contacts, visit Essen BioScience, A Sartorius Company /incucyte Sartorius Lab Instruments GmbH & Co. KGOtto-Brenner-Strasse 20 37079 Goettingen, Germany Phone +49 551 308 0North AmericaEssen BioScience Inc. 300 West Morgan Road Ann Arbor, Michigan, 48108USATelephone +1 734 769 1600E-Mail:***************************EuropeEssen BioScience Ltd.Units 2 & 3 The Quadrant Newark CloseRoyston Hertfordshire SG8 5HLUnited KingdomTelephone +44 (0) 1763 227400E-Mail:***************************APACEssen BioScience K.K.4th floor Daiwa Shinagawa North Bldg.1-8-11 Kita-Shinagawa Shinagawa-ku, Tokyo 140-0001 JapanTelephone: +81 3 6478 5202E-Mail:*************************5. Analysis GuidelinesAs the labeled antibody is internalized into the acidic environment of the lysosome, the area of fluorescence intensity inside the cells increases.This can be reported in two ways:Ways to Report Basic AnalyzerCell-by-Cell Analysis* To correct for cell proliferation, it is advisable to normalize the fluorescence area to the total cell area using User Defined Metrics.For Research Use Only. Not For Therapeutic or Diagnostic Use.LicensesFor non-commercial research use only. Not for therapeutic or in vivo applications. Other license needs contact Essen BioS cience.Fabfluor-pH Red Antibody Labeling Reagent: This product or portions thereof is manufactured under license from Carnegie Mellon University and U.S. patent numbers 7615646 and 8044203 and related patents. This product is licensed for sale only for research. It is not licensed for any other use. There is no implied license hereunder for any commercial use.Fabfluor-pH Orange Antibody Labeling Reagent: This product or portions thereof is manufactured under a license from Tokyo University and is covered by issued patents EP2098529B1, JP5636080B2, US8258171, and US9784732 and related patent applications. This product and related products are trademarks of Goryo Chemical. Any application of above mentioned technology for commercial purpose requires a separate li -cense from: Goryo Chemical, EAREE Bldg., SF Kita 8 Nishi 18-35-100, Chuo-Ku, Sapporo, 060-0008 Japan.SupportA complete suite of cell health applications is available to fit your experimental needs. Find more information at /incucyte Foradditionalproductortechnicalinformation,************************************************************/incucyte。
一种基于金纳米簇锚定羟基氧化钴纳米片的吡虫啉荧光免疫分析方法

专利名称:一种基于金纳米簇锚定羟基氧化钴纳米片的吡虫啉荧光免疫分析方法
专利类型:发明专利
发明人:卢革宇,闫旭,李红霞,金蕊,孙鹏,刘方猛
申请号:CN201811476773.1
申请日:20181205
公开号:CN109580939A
公开日:
20190405
专利内容由知识产权出版社提供
摘要:本发明公开了一种基于金纳米簇锚定羟基氧化钴纳米片的吡虫啉荧光免疫分析方法,属于生物传感器技术领域,本发明通过金纳米簇锚定在二维羟基氧化钴纳米片表面,形成纳米复合材料,导致荧光强度显著降低。
通过引入能够触发CoOOH纳米片分解的抗坏血酸,可有效逆转猝灭效应。
值得注意的是,抗坏血酸诱导的相应荧光反应与抗体标记的ALP活性有关。
经过竞争免疫反应
后,ALP标记的抗体可与固定化抗原相结合,可调节检测平台的荧光变化。
利用系统的荧光切
换,FIA对吡虫啉的检测浓度(IC50)为1.3ng mL,比常规ELISA(86.4ng mL‑1)敏感60倍。
本发明的荧光免疫分析方法能够实现靶抗原吡虫啉的高灵敏检测,不仅为农药检测开辟了新的前景,而且为荧光免疫分析开辟了有效的策略。
申请人:吉林大学
地址:130012 吉林省长春市前进大街2699号
国籍:CN
代理机构:长春吉大专利代理有限责任公司
代理人:刘世纯
更多信息请下载全文后查看。
癌症诊断标记物和方法[发明专利]
![癌症诊断标记物和方法[发明专利]](https://img.taocdn.com/s3/m/e1fe4d9aa26925c52dc5bf2c.png)
专利名称:癌症诊断标记物和方法
专利类型:发明专利
发明人:李相烨,柳来春,刘昭永,琴基昌,柳元敏申请号:CN200780002628.3
申请日:20070118
公开号:CN101443449A
公开日:
20090527
专利内容由知识产权出版社提供
摘要:本发明涉及使用粒细胞群落刺激因子(G-CSF)的基因表达变异的癌症诊断标记物及其制备方法,具体涉及使用具有与G-CSF的外显子2区域的3’-末端和外显子4区域的5’-末端连接的寡聚核苷酸作为癌症诊断标记物的诊断癌症和/或评估癌症发展状态的方法。
根据本发明,可使用G-CSF基因表达快速精确地诊断癌症。
申请人:株式会社美迪基尼斯
地址:韩国首尔市
国籍:KR
代理机构:南京经纬专利商标代理有限公司
代理人:楼高潮
更多信息请下载全文后查看。
211281730_阿魏酸抑制p38_MAPK信号传导对巨噬细胞M1极化的作用
广东药科大学学报Journal of Guangdong Pharmaceutical University May,2023,39(3)阿魏酸抑制p38MAPK信号传导对巨噬细胞M1极化的作用韦子强1,张雯雯1,郭嘉亮1,3,罗文汇2,3,郑兆广1,3,刘正1,3,谢倩1,曾煦欣1,3(1.佛山科学技术学院,广东佛山528000;2.广东一方制药有限公司,广东佛山528000;3.佛山市药学会,广东佛山528000)摘要:目的研究阿魏酸对脂多糖(LPS)与干扰素-γ(IFN-γ)诱导巨噬细胞M1极化的影响与作用机制。
方法THP-1细胞加入佛波酯(PMA)诱导成M0型巨噬细胞,使用LPS+IFN-γ诱导成M1型巨噬细胞。
采用CCK-8法确定阿魏酸对M1型巨噬细胞的实验浓度范围;流式细胞术检测阿魏酸对M1型巨噬细胞极化情况;酶联免疫吸附实验(ELISA)和实时荧光定量PCR法检测阿魏酸对M1型巨噬细胞分泌产物肿瘤坏死因子-α(TNF-α)、白细胞介素-1β(IL-1β)mRNA和蛋白表达的影响;Western blot法检测p38MAPK、p38MAPK磷酸化(p-p38MAPK)蛋白表达水平的变化。
结果阿魏酸浓度在80μmol/L以下对M1型巨噬细胞的活性无影响。
在阿魏酸作用下,与对照组比较,M1型巨噬细胞标志物CD80+的表达显著降低(P<0.05);同时,阿魏酸能抑制M1型巨噬细胞分泌的TNF-α、IL-1β和p38MAPK磷酸化(p-p38MAPK)蛋白表达,其作用呈剂量依赖性。
结论阿魏酸抑制M0型巨噬细胞向M1型极化,降低促炎因子表达,其抗炎作用机制与抑制p38MAPK信号通路活化有关。
关键词:阿魏酸;巨噬细胞;p38MAPK;炎症中图分类号:R285.5文献标识码:A文章编号:2096-3653(2023)03-0068-05DOI:10.16809/ki.2096-3653.2023031103Effect of ferulic acid on M1polarization of macrophages by inhibiting p38MAPK signalingWEI Ziqiang1,ZHANG Wenwen1,GUO Jialiang1,3,LUO Wenhui2,3,ZHENG Zhaoguang1,3,LIU Zheng1,3,XIE Qian1,ZENG Xuxin1,3*(1.Foshan University,Foshan528000,China;2.Guangdong Yifang Pharmaceutical Co.Ltd,Foshan528000,China;3.Foshan Pharmaceutical Association,Foshan528000,China)*Corresponding author Email:********************Abstract:Objective To study the effect and mechanism of ferulic acid on M1polarization of macrophages induced by LPS and IFN-γ.Methods THP-1cells were induced into M0type macrophages by adding PMA,and M1type macrophages were induced using LPS+IFN-γ.The concentration range of ferulic acid on M1macrophages was determined by CCK-8method.Flow cytometry was used to detect the polarization of M1 macrophages induced by ferulic acid.ELISA and real-time quantitative PCR were used to detect the effects of ferulic acid on the expression of tumor necrosis factor-α(TNF-α)and interleukin-1β(IL-1β)mRNA and protein by M1type macrophages.Western blot was used to detect the expression of p38MAPK and p-p38MAPK.Results Ferulic acid concentration below80μmol/L had no effect on the activity of M1type pared with the control group,the expression of M1type macrophage marker CD80+was significantly decreased under ferulic acid treatment(P<0.05).Ferulic acid also inhibited the expression of TNF-α,IL-1βand p-p38MAPK by M1type macrophages in a dose-dependent manner.Conclusion Ferulic acid can inhibit the polarization of M0macrophages towards M1type and reduce the expression of pro-inflammatory factors,which is related to the inhibition of p38 MAPK signaling pathway.Key words:ferulic acid;macrophages;p38MAPK;inflammation收稿日期:2023-03-11基金项目:广东省基础与应用基础研究基金自然科学基金项目(2019A1515010806);广东省示范性产业学院(粤教高函[2020]21号);广东省教育厅重点领域专项(2020ZDZX2057);佛山市工程技术研究中心项目(2017GA00025)作者简介:韦子强(1997-),男,2020级硕士研究生,主要从事天然药物的药理学与药剂学研究通信作者:曾煦欣(1978-),男,副教授,硕士生导师,主要从事天然药物的药理学与药剂学研究,Email:********************。
《2024年基于CRISPR-Cas系统建立牛、羊支原体性肺炎主要亚种的快速检测方法》范文

《基于CRISPR-Cas系统建立牛、羊支原体性肺炎主要亚种的快速检测方法》篇一基于CRISPR-Cas系统建立牛、羊支原体性肺炎主要亚种的快速检测方法一、引言牛、羊支原体性肺炎(Mycoplasma pneumoniae,Mp)是一种常见于牛、羊等动物的呼吸道疾病,对畜牧业的发展和动物健康构成了严重威胁。
近年来,随着分子生物学技术的飞速发展,以CRISPR/Cas系统为基础的基因编辑技术逐渐被广泛应用于生物医学领域。
本文旨在探讨基于CRISPR/Cas系统建立牛、羊支原体性肺炎主要亚种的快速检测方法,以期为该病的早期诊断和治疗提供新的技术手段。
二、CRISPR/Cas系统概述CRISPR/Cas系统是一种广泛存在于细菌和古菌中的适应性免疫系统,具有高度的序列特异性。
该系统主要由CRISPR阵列、Cas蛋白和其他辅助蛋白组成,可对外源入侵的DNA进行识别和切割,从而实现免疫防御。
近年来,CRISPR/Cas系统在基因编辑、基因诊断等领域得到了广泛应用。
三、基于CRISPR/Cas系统的牛、羊支原体性肺炎检测方法(一)方法原理本研究基于CRISPR/Cas系统的序列特异性识别和切割功能,设计针对牛、羊支原体性肺炎主要亚种的特异性CRISPR-Cas系统。
通过将待检测样本的DNA与CRISPR-Cas系统进行体外杂交,利用Cas蛋白对特定序列的切割活性,实现对牛、羊支原体性肺炎的快速检测。
(二)实验材料与方法1. 实验材料:包括PCR扩增试剂、Cas蛋白、CRISPR RNA 等。
2. 实验方法:首先,通过PCR技术扩增待检测样本中的Mp 基因片段;然后,将扩增得到的DNA与CRISPR-Cas系统进行体外杂交;最后,通过观察是否有切割现象来判断是否为Mp感染。
(三)实验结果及分析通过与传统的PCR技术相比,基于CRISPR/Cas系统的检测方法具有更高的敏感性和特异性。
在实验中,我们成功建立了针对牛、羊支原体性肺炎主要亚种的CRISPR/Cas检测系统,并成功应用于实际样本的检测。
- 1、下载文档前请自行甄别文档内容的完整性,平台不提供额外的编辑、内容补充、找答案等附加服务。
- 2、"仅部分预览"的文档,不可在线预览部分如存在完整性等问题,可反馈申请退款(可完整预览的文档不适用该条件!)。
- 3、如文档侵犯您的权益,请联系客服反馈,我们会尽快为您处理(人工客服工作时间:9:00-18:30)。
a rXiv:as tr o-ph/36262v112J un23Long Term X-ray Variability in GX13+1:Energy Dependent Periodic Modulation Robin H.D.Corbet 1Laboratory for High Energy Astrophysics,Code 662,NASA/Goddard Space Flight Center,Greenbelt,MD 20771corbet@ ABSTRACT A search is made for periodic modulation in the X-ray flux from the low mass X-ray binary GX13+1using Rossi X-ray Timing Explorer All Sky Monitor data collected over a period of almost seven years.From a filtered data set,which excludes measurements with exceptionally large error bars and so maximizes signal to noise,modulation is found at a period of 24.065±0.018days.The modulation is most clearly detectable at high energies (5-12keV).Spectral changes are revealed as a modulation in hardness ratio on the 24day period and there is a phase shift between the modulation in the 5-12keV energy band compared to the 1.5-5keV band.The high-energy spectrum of GX13+1is unusual in displaying both emission and absorption iron line features and it is speculated that the peculiar spectral and timing properties may be connected.Subject headings:stars:individual (GX13+1)—stars:neutron —X-rays:stars1.IntroductionThe low mass X-ray binary GX13+1is a bright persistent source which exhibits X-ray bursts (Fleischman 1985,Matsuba et al.1995).Counterparts have been identified in the infra-red (Naylor,Charles &Longmore 1991,Garcia et al.1992)and radio (Grindlay &Seaquist 1986)wavebands.The X-ray and radio fluxes of GX13+1are not correlated (Garcia et al.1988).The IR counterpart has been seen to vary on timescales of days to tens of days but no definite orbital period has been found (e.g.Charles &Naylor 1992,Groot et al.1996,Bandyopadhyay et al.2002).However Groot et al.(1996)did find maximumpower at a period of12.6days from observations spanning18days.From IR spectroscopy Bandyopadhyay et al.(1999)derive a spectral type of K5III for the mass donating star. This classification implies a mass of5M⊙(Allen1973)and so the mass-donor is the primary star.GX13+1is usually classified as an“atoll”source but has some characteristics such as the properties of its quasi-periodic oscillations(QPOs)which make it more similar to a“Z”source(Homan et al.1998and references therein).Schnerr et al.(2003)find that while GX13+1follows a track in an X-ray color-color diagram on timescales of hours apparently similar to atoll sources,the count rate and power spectrum change in ways unlike any other atoll or Z source.X-ray observations of GX13+1with CCD detectors have revealed the presence of a number of features that are attributed to iron(Ueda et al.2001,Sidoli et al. 2002).These include an emission line near6.4keV,an absorption line at7.0keV and a deep absorption edge at8.83keV.Previously the only other X-ray binaries which had shown such iron absorption lines were the“superluminal”black hole candidates GRO J1655-40(Ueda et al.1998,Yamaoka et al.2001)and GRS1915+105(Kotani et al.2000,Lee et al.2002).From one year of observations with the All Sky Monitor(ASM)on board the Rossi X-ray Timing Explorer(RXTE)a modulation of the soft(1.3-4.8keV)flux at a period of24.7±1day was reported(Corbet1996;hereafter C96).Subsequent ASM observations,however, apparently failed tofind confirmation of this periodic modulation.Bandyopadhyay et al. (2002)examined5years worth of ASM data and concluded that while there was evidence for quasi-periodicity on a timescale of20-30days this modulation was not consistently present.Here RXTE ASM light curves of GX13+1,covering just under seven years,are analyzed separated into three energy bands and different methods for dealing with variable data quality are investigated.It is concluded that the X-rayflux does indeed show a persistent modulation at a period of24days as initially reported.2.ObservationsThe RXTE ASM(Levine et al.1996)consists of three similar Scanning Shadow Cam-eras,sensitive to X-rays in an energy band of approximately1.5-12keV,which perform sets of90second pointed observations(“dwells”)so as to cover∼80%of the sky every∼90 minutes.Light curves are available in three energy bands:1.5to3.0keV(“soft”),3.0to5 keV(“medium”),and5to12keV(“hard”).The Crab produces approximately75counts/s in the ASM over the entire energy range.Observations of blankfield regions away from the Galactic center indicate that background subtraction may produce a systematic uncertaintyof about0.1counts/s(Remillard&Levine1997).Two standard ASM light curve products are routinely available-one withflux mea-surements from individual dwells which preserves the90s time resolution,and one which gives averages of all dwells performed during each day.The ASM light curve of GX13+1 considered here covers approximately6.7years(MJD50094to52536).The overall light curve of GX13+1as obtained with the RXTE ASM is shown in Figure1.The meanflux for the entire ASM energy range is23counts/s and no long term trend is obvious from the full energy-range light curve.In C96it was reported that the overallflux level of GX13+1was anti-correlated with the hardness ratio.However,further investigation suggests that the major contribution to this apparent effect is gain changes in two of the three SSCs that comprise the ASM. These instrumental effects cause slow drifts in hardness ratios dependent on source spectrum with only sources with spectra identical to the Crab showing no change(Remillard private communication).A change in the channel definitions used to define the three energy bands also occurred at MJD51548.625.This can give discontinuous jumps in the count rates in different energy bands again dependent on source spectrum.These two instrumental effects can both be seen in Figure1.The approximately linear trends in the soft and medium energy bands give exactly the apparent hardness-ratio/intensity correlation reported in C96.The anti-correlation reported in C96is thus at least primarily an instrumental artifact.In order to remove these trends from the lower energy bands which,in addition to giving apparent hardness ratio changes,result in spurious low-frequency power in a periodogram,the low and medium energy bands were corrected byfitting two linear trends to the light curves before and after MJD51548and subtracting these.The high energy light curve does not have an obvious trend and so no correction was needed.3.Analysis and ResultsTo investigate long termflux variability it is often convenient to use the daily averaged ASM light curves rather than the dwell light curves.The error on theseflux measurements can vary significantly due to,for example,the different number of dwells covering a source from day to day.The errors onflux measurements in individual dwells can also vary de-pending on factors such as the location of the source in each SSC’sfield of view,proximity to the position of the Sun,and the number and brightness of other sources in thefield of view.When searching for periodic modulation in faint sources,for example,it can thus be advantageous to weight data points contributions to a power spectrum.In weak sources this weighting may reveal periodic modulation not otherwise easily detectable(e.g.Corbet,Finley&Peele1999,Corbet et al.1999).However,this procedure is not appropriate if the variations in sourceflux are significantly larger than typical data point errors.For the full en-ergy range daily averaged light curve of GX13+1the standard deviation of the data points is 2.8counts/s and the mean error on measurements is0.7counts/s.A simple direct weighting of all data points may thus not be appropriate for an analysis of GX13+1.The light curve does,however,contain some points with exceptionally large error bars because,for example, the points were obtained with only a very small number of dwells or the observations were obtained when the source was at a small angular distance from the Sun.Another simple technique was therefore considered to improve signal to noise in period searches.While the data contributions to the power spectrum are not weighted,some points with errors larger than an arbitrary value are completely excluded from the calculation of the power spectrum. How this arbitrary value is chosen is discussed below.A further complication in weighting the data points is that the variation in the number of dwells per day is significantly non-random.The number of ASM observations made per day of GX13+1was investigated and a very strong modulation at a period of52.6days was found(Figure2).This periodicity is also found in the size of the error bars on the daily averagedflux measurements.This52.6day periodicity is probably linked to the precession period of RXTE’s orbit.Note that,even if unweighted techniques are used to extract power spectra,if the dwell light curve is used instead of the daily averaged light curve,then a similar weighting will effectively result.In order to compare these different techniques for searching for periodic signals in the variable quality ASM data the effects of weighting and screening the data were investigated. In Figure3power spectra of the light curve of GX13+1calculated infive different ways are shown.The techniques employed were:(a)using unweighted daily averages(b)weighted daily averages(c)unweighted daily averages with points with large error bars removed(d)weighted dwell data(e)unweighted dwell dataIt can be seen that the unweighted procedure(a)shows a peak at near24days that is stronger compared to the weighted procedure(b).This peak strongly increases in significance when the points with large error bars are excluded(c).The power spectra obtained from the dwell data(d and e)show similar shapes to the weighted power spectrum with the weighted dwell data(d)almost identical to(b).To obtain the screened unweighted power spectrum(c)data points were removed based on the size of the error bars and the power spectrum calculated.This technique is basedon the assumption that the peak exhibited in the unweighted power spectrum arises from a real modulation present in the data and that the parameters of this modulation can best be measured by utilizing a subset of the data which gives the highest overall signal to noise ratio.Thefiltering procedure was repeated with different data exclusion thresholds until the maximum ratio of signal peak at∼24days to average power was obtained.The distribution of error bar sizes in shown in Figure4with the optimum screening threshold of an error of1.4counts/s marked.The peak of the error bar distribution is at approximately0.4 cts/s which is considerably less than the mean error of0.7cts/s noted above which reflects the contribution of an extended tail on the distribution.It was found that only a relatively small number of points had to be excluded(8.2%of the original1897points).These excluded points all come from the extended tail and the“core”of the data is completely included. Thus,the presence of a strong peak at24days is unlikely to be an artifact of this screening procedure.The power spectra of each of the ASM energy bands were next investigated individually. For each band data points were again reiterativelyfiltered by the size of their error bars to maximize the signal near24days.The fraction of data excluded was22%,15%and4.5% for the soft,medium,and hard bands respectively with associated screening thresholds were 0.5,0.5and1.0counts/s.For comparison the mean and distribution peak of the errors in each band were:0.4and0.19(soft),0.35and0.17(medium),and0.39and0.22(hard).The larger fraction of data excluded for the softer bands might be due to the relatively larger effects of solar contamination at low energies as the soft energy band in particular light curve exhibits very large error bars when the GX13+1is close to the position of the Sun.However other unknown effects might also be involved.Figure5shows the resulting power spectra in terms of relative power.That is,the power spectra are normalized by the meanflux in each energy band and so show relative modulation.Figure6shows details of the power spectra near the24day period but plotted as absolute modulation.From Figures5and6the following conclusions can be drawn:(i)some signal is present in all three energy bands near24days.However,significant independent detection of the signal could only be made in the hard(5to12keV)and summed energy bands.(ii)The greatest relative modulation occurs in the soft band(1.5to3keV).There are,however,other peaks in the soft power spectrum of almost comparable size to the signal near24days.(iii) The greatest absolute modulation occurs in the hard band(5to12keV).The periodic modulation in each energy band was quantified byfitting sine waves to the light curves and the results of thesefits are given in Table1.Note that the periods derived from each energy band are all consistent within the errors with the value found from the summed energy band of24.07±0.02days.This gives additional confidence that a realperiod has been detected.This period is also consistent with the value reported in C96of 24.7±1days.The phase of maximumflux,however,differs between the soft(1.5to3 keV)and medium(3to5keV)energy bands(which are consistent with each other)and the hard(5to12keV)band which trails by4.8±0.7days(∆φ=0.20±0.03).This phase difference is also clearly seen directly in the folded light curves(Figure7).Due,at least in part,to this energy dependent phase difference the folded hardness ratio is also seen to be modulated on the24day period.These folded light curves are rather smooth thus justifying the parameterization using sine wavefits.To investigate the coherency of the modulation the width of the peak in the power spec-trum was compared to that of a transform of a sine wave sampled with the same frequency as the actual data.For the peak in the transform of the summed energy bands wefind a FWHM of0.00031day−1and the peak in the periodogram of the pure sine wave has a FWHM of0.00033day−1.The width of the power spectrum peak is thus fully consistent with coherency.In order to further investigate the stability of the∼24day period we calculated power spectra for each energy band using a sliding box to investigate subsets of the data.Figure 8shows that while the strength of the modulation is variable all data segments for the hard and summed energy bands show some signal near24days.This variability,along with the problem of determining the optimal method to calculate the power spectra,has probably contributed to the previous difficulty in determining the reality and properties of the modulation in GX13+1(Bandyopadhyay et al.2002).parison with Other SystemsIn order to compare the properties of GX13+1the RXTE ASM light curves of several other sources were also investigated.These were the“GX atoll”sources(Hasinger&van der Klis1989)which are not known to be pulsars or transient black hole systems:GX3+1, GX9+1and GX9+9.In each case power spectra were constructed from the daily averaged light curves both with and without weighting.Some sources showed smooth variations on long timescales caused by intrinsic variability rather than the ASM instrumental effects noted in Section2.Quadraticfits were therefore subtracted from the lightcurves before the power spectra were calculated.The resulting power spectra are shown in Figure9.In the weighted power spectra GX3+1shows prominent peaks at51.3and54.0days.These are both close to the sampling period of52.6days for GX13+1.Thus these peaks may be an artifact.GX9+1 shows no significant peaks in the weighted power spectrum.GX9+9shows peaks at51.6 and54.6days which are again close to the52.6day sampling period for GX13+1.In the unweighted power spectra the peaks near52days disappear for both GX3+1and GX9+9.For GX9+1a modest peak appears in the unweighted power spectrum at59.5days. However,when the data screening technique was employed for this source,it was found that exclusion of data actually reduced the relative height of the peak.This suggests that this peak in GX9+1may be spurious.Thus none of the other“GX atoll”sources show the same type of timing properties in the RXTE ASM as GX13+1.4.DiscussionPeriodic modulation in X-ray binaries is known to arise from three types of underlying physical processes:neutron star rotation period,binary orbital period,and super-orbital modulation by a less clear physical mechanism(White,Nagase&Parmar1995).Since neutron star rotation can be excluded because of the length of the period,two likely possi-bilities remain for GX13+1of orbital or super-orbital modulation.The modulation found for GX13+1is unusual with no directly comparable modulation found for other bright low mass X-ray binaries observed with the RXTE ASM.Modulation of X-rayflux from low-mass X-ray binaries on the orbital period is only seen for high inclination systems.In only a few cases(e.g.EXO0748-676,Wolffet al.2002and references therein)are eclipses seen in bright sources as the mass-donating star occults the central X-ray source.X-ray dipping is seen for a number of sources with moderate inclination. These dips are caused by vertical structure in the accretion disk and are tied to the orbital period but are irregular in their morphology and phasing.Spectral changes are typically seen during the dips with the spectrum becoming harder.For still lower inclination systems X-ray modulation on the orbital period typically cannot be seen but optical modulation may be observed(e.g.van Paradijs&McClintock1995)as varying aspects of the X-ray heated mass-donating star are observed.In all cases modulation on the orbital period should be intrinsically coherent as it is locked to the orbital period,but deviations from strict periodicity can arise due to,for example,changes in the phase at which dipping occurs.Super-orbital modulation has been seen in several systems with the strongest effects demonstrated by the high mass systems SMC X-1and LMC X-4and the intermediate mass system Her X-1(e.g.Ogilvie&Dubus2001).For low mass systems periodic super-orbital modulation appears to be rare and the best evidence for such modulation may come from X1820-30which has a172day period(e.g.Chou&Grindlay2001and references therein). Since super-orbital modulation is likely not tied to an underlying good clock such as orbital modulation,but may instead be caused by a mechanism such as accretion disk precession forced by radiation pressure(e.g.Ogilvie&Dubus2001and references therein),modulationmay have low coherence.In Cyg X-2,which initially appeared to show a“clean”78day super-orbital periodicity(Wijnands,Kuulkers,&Smale1996),the modulation was later found to be more complex with the excursion times between X-ray minima characterized as a series of integer multiples of the9.8binary orbital period(Boyd&Smale2001).If the modulation that is observed in GX13+1is orbital in origin then a requirement is that the mass-donating star must not overfill the predicted Roche lobe size.Bandyopadhyay et al.(1999)find that a mass donor of spectral type K5III,as found from their IR spec-troscopy,wouldfill the Roche lobe if the orbital period is about25days.If this spectral type is correct then it implies that the modulation observed would have to be orbital in nature.The folded light curves(Figure7)show a smooth modulation over the entire24day period.This indicates that theflux is being affected at all phases rather than the periodicity being caused by,for example,a sharp eclipse or dips restricted to a limited phase range. Although Accretion Disk Corona(ADC)sources,where the central X-ray source is not observed directly,can exhibit rather broad modulation the ADC sources have low X-ray luminosities and so are unlike GX13+1which is estimated to have a luminosity of4−6×1037(d/7kpc)2ergs s−1(1-20keV,Matsuba et al.1995).The mechanism for the periodic modulation in GX13+1is unclear.However,the “cleaner”modulation observed in the hard ASM energy band may be related to the un-usual high energy features reported by Ueda et al.(2001)and Sidoli et al.(2002).The periodic modulation might be caused by material located in different parts of the binary system,such as different parts of accretion disk structure,at different energies.Note that Smith,Heindl,&Swank(2002)find from monitoring observations with the RXTE Propor-tional Counter Array orbital periods of12.7and18.5days for the black hole candidates1E 1740.7-2942and GRS1758-258.Thus the presence of a long orbital period for GX13+1may be another common factor,along with the iron spectral features,between GX13+1and some black hole systems.It is noted that Schnerr et al.(2003)interpret their unusual timing and spectral results for GX13+1as showing the presence of an additional source of hard variable emission.This component could plausibly be identified with the periodic component of theflux that is seen most clearly in the hard band with the RXTE ASM.Schnerr et al.(2003)propose that this hard component might come from a jet and that variability could be caused by precession of the jet or to variations in jet activity itself.However,the periodicity seen in the hard component suggests that precession is unlikely to drive this variability.However,variable occultation of part of the jet by,for example,structure in the accretion disk could account for the variability if the system inclination is sufficiently high.It may be that a portion of the hardflux does originate in a physically separate region of the system such as a jet,while softer emission comes from the inner accretion disk and/or the surface of the neutron star.If so,this could account for the different timing properties of GX13+1found at different energies.5.ConclusionThe X-ray light curve of GX13+1shows strong evidence for the presence of a periodicity near24days with modulation properties that are energy dependent.The most likely origin for this is some type of orbital modulation if the mass donor is a Roche-lobefilling K5III star.Because of the unusual nature of this modulation and the somewhat non-standard tech-nique used to maximize the signal in the ASM data it would be desirable to confirm the24 day period through other observations and determine whether the modulation is present at other wavelengths.Unfortunately no other high-quality long term observations appear to exist.Although GX13+1was observed by the all-sky monitors on both Ariel V and Vela5 the sensitivity of these experiments was significantly less than that of the RXTE ASM.The Ginga all-sky monitor,which was more sensitive than the Ariel V and Vela5instruments,did not include GX13+1in the objects for which light curves were produced(S.Kitamoto,pri-vate communication).Infra-red light curves have been obtained by several groups(Charles &Naylor1992,Groot et al.1996,Wachter1996,Bandyopadhyay et al.2002).While these show modulations on timescales of tens of days,which could be consistent with a24day period,the observations do not cover sufficient durations to demonstrate whether the24day period is also exhibited in the infra-red.The best prospect for confirmation of the24day period may come from further RXTE observations.If the RXTE ASM continues to operate for at least a few more years then the additional observations obtained will form a statistically independent data set that can be investigated for the presence of the24day period.Additional constraints on models that could account for the periodic modulation may come from an investigation of whether the high energy spectral features also vary on the24 day period.Extended IR observations would be valuable as they may show whether the24 day period exists at these wavelengths and so constrain the system inclination.I thank R.A.Remillard for useful comments on the properties of the RXTE ASM and S.Kitamoto for information on the Ginga ASM.REFERENCESAllen,C.W.,1973,“Astrophysical Quantities”,Athlone PressBandyopadhyay,R.M.,Shahbaz,T.,Charles,P.A.,&Naylor,T.,1999,MNRAS,306,417 Bandyopadhyay,R.M.,Charles,P.A.,Shahbaz,T.,&Wagner,R.M.,2002,ApJ,570,793 Bradt,H.V.,Rothschild,R.E.,&Swank,J.H.,1993,A&AS,97,355Charles,P.A.,&Naylor,T.,1992,MNRAS,225,6PChou,Y.&Grindlay,J.E.,2001,ApJ,563,934Corbet,R.,1996,IAUC6508(C96)Corbet,R.H.D.,Finley,J.P.,&Peele,A.G.,1999,ApJ,511,876Corbet,R.H.D.,Marshall,F.E.,Peele,A.G.,&Takeshima,T.,1999,ApJ,517,956 Fleischman,J.R.,1985,A&A,153,106Garcia,M.R.,Grindlay,J.E.,Molnar,L.A.,Stella,L.,White,N.E.,&Seaquist,E.R., 1988,ApJ,328,552Garcia,M.R.,Grindlay,J.E.,Bailyn,C.D.,Pipher,J.L.,Shure,M.A.,&Woodward,C.E., 1992,ApJ,103,1325Grindaly,J.E.&Seaquist,E.R.,1986,ApJ,310,172Groot,P.J.,van der Klis,M.,van Paradijs,J.,Augusteijn,T.&Berger,1996,in“Cata-clysmic Variables and Related Objects”,ed.A.Evans&J.H.Wood,p.367 Hasinger,G.&van der Klis,M.,1989,A&A,225,79Homan,J.,van der Klis,M.,Wijnands,R.,Vaughan,B.,&Kuulkers,E.,1998,ApJ,499, L41Kotani,T.,Ebisawa,K.,Dotani,T.,Inoue,H.,Nagase,F.,Tanaka,Y.,&Ueda,Y.,2000, ApJ,539,413Lee,J.C.,Reynolds,C.S.,Remillard,R.,Schulz,N.S.,Blackman,E.G.,&Fabian,A.C., 2002,ApJ,567,1102Levine,A.M.,Bradt,N.,Cui,W.,Jernigan,J.G.,Morgan,E.H.,Remillard,R.,Shirey,R.E., &Smith,D.A.,1996,ApJ,469,L33Matsuba,E.,Dotani,T.,Mitsuda,K.,Asai,K.,Lewin,W.H.G.,van Paradijs,J.,&van der Klis,M.,1995,PASJ,47,575Naylor,T.,Charles,P.A.,&Longmore,1991,MNRAS,252,203Ogilvie,G.I.&Dubus,G.,2001,MNRAS,320,485Schnerr,R.S.,Reerink,T.,van der Klis,M.,Homan,J.,M´e ndez,M.,Fender,R.P.,& Kuulkers,E.,2003,A&A,in press.Sidoli,L.,Parmar,A.N.,Oosterbroek,T.,&Lumb,D.,2002,A&A,385,940Smith,D.M.,Heindl,W.A.,&Swank,J.H.,ApJ,578,L129Stella,L.,White,N.E.,&Taylor,B.G.,1985,ESA SP-236,p.125Ueda,Y.,Inoue,H.,Tanaka,Y.,Ebisawa,K.,Nagase,F.,Kotani,T.,&Gehrels,N.,1998, ApJ,492,782(erratum500,1069)Ueda,Y.,Asai,K.,Yamaoka,K.,Dotani,T.,&Inoue,H.,2001,ApJ,556,L87van Paradijs,J.&McClintock,J.E,1995,in“X-ray Binaries”,p.58,ed.W.H.G.Lewin,J.van Paradijs,&E.P.J.van den Heuvel,Cambridge University Press.Wachter,S.,1996,BAAS,189,4404White,N.E.,Nagase,F.,&Parmar,A.N.,1995,in“X-ray Binaries”,p.1,ed.W.H.G.Lewin,J.van Paradijs,&E.P.J.van den Heuvel,Cambridge University Press. Wijnands,R.A.D.,Kuulkers,E.,&Smale,A.P.,1996,ApJ,473,L45Wolff,M.T.,Hertz,P.,Wood,K.S.,Ray,P.S.,&Bandyopadhyay,R.M.,2002,ApJ,575,348 Yamaoka,K.,Ueda,Y.,Inoue,H.,Nagase,F.,Ebisawa,K.,Kotani,T.,Tanaka,Y.,& Zhang,S.N.,2001,PASJ,53,179Figure CaptionsFig. 1.—The RXTE ASM light curve of GX13+1divided into three energy bands and the summed light curve.The linear trends and the discontinuities in the low-and medium-energy light curves at MJD51548.6are due to instrumental effects.All light curves are smoothed and rebinned versions of the standard one day averaged light curves.Fig.2.—Lower panel:Number of ASM observations(“dwells”)per day of GX13+1.Upper panel:power spectrum of the curve shown in the lower panel.The strongest power is found at a period of52.6days.Fig.3.—Power spectra of the ASM light curve of GX13+1obtained infive different ways.(a)Unweighted power spectrum of daily average light curve;(b)Weighted power spectrum of daily average light curve;(c)Unweighted power spectrum of daily average light curve with datafiltered to exclude points with large error bars;(d)Weighted power spectrum of individual dwell data;(e)Unweighted power spectrum of individual dwell data.Fig. 4.—Distribution of error bar sizes from the daily averaged ASM light curve.The vertical dashed line shows where the cut was made which maximizes the relative strength of the signal near a period of24days in the power spectrum.Fig.5.—Power spectra of the ASM light curve of GX13+1divided into three energy bands. In each case data screening was performed to maximize the signal at a period near24days. The power is normalized to the average count rate in each energy band and is in units of “percentage modulation squared”,i.e.the Fourier amplitude is divided by the meanflux and the square of this quantity plotted.Fig.6.—Details of the power spectra of the ASM light curve of GX13+1near the24day period(equivalent to a frequency of approximately0.042day−1).For this plot the power is not normalized to the average count rate.Fig.7.—Folded ASM light curves of GX13+1and hardness ratio(5-12keV/1.5-5keV). Two cycles are shown for clarity.The orbital period and epoch of maximum are taken from the sine wavefit to the hard band alone(Table1).Fig.8.—Variations in power spectra of GX13+1as a function of time separated by energy. In each power spectrum21/3years worth of data were analyzed with the start time of the power spectrum increased by6months between each power spectrum.The individual power spectra for each energy band are thus not statistically independent.The plots for the energy separated power spectra are all on the same scale but the summed energy band power spectra use a different y axis scale.The vertical dashed lines indicate the proposed。