Amcharts 设置详细
JS插件amCharts实现绘制柱形图默认显示数值功能示例
JS插件amCharts实现绘制柱形图默认显⽰数值功能⽰例本⽂实例讲述了JS插件amCharts实现绘制柱形图默认显⽰数值功能。
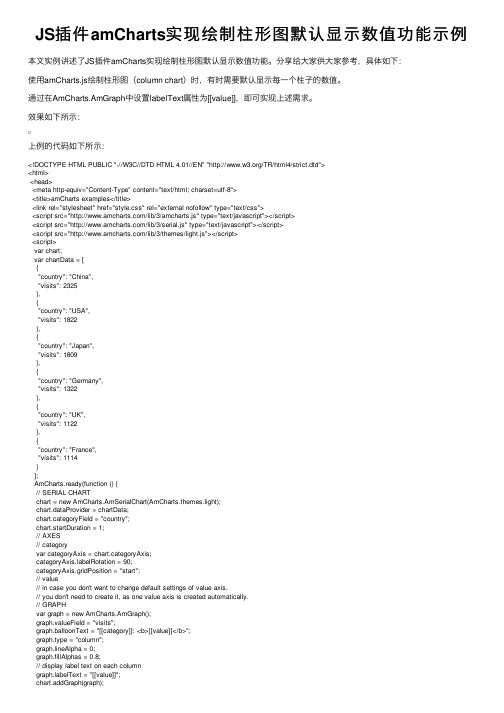
分享给⼤家供⼤家参考,具体如下:使⽤amCharts.js绘制柱形图(column chart)时,有时需要默认显⽰每⼀个柱⼦的数值。
通过在AmCharts.AmGraph中设置labelText属性为[[value]],即可实现上述需求。
效果如下所⽰:上例的代码如下所⽰:<!DOCTYPE HTML PUBLIC "-//W3C//DTD HTML 4.01//EN" "/TR/html4/strict.dtd"><html><head><meta http-equiv="Content-Type" content="text/html; charset=utf-8"><title>amCharts examples</title><link rel="stylesheet" href="style.css" rel="external nofollow" type="text/css"><script src="/lib/3/amcharts.js" type="text/javascript"></script><script src="/lib/3/serial.js" type="text/javascript"></script><script src="/lib/3/themes/light.js"></script><script>var chart;var chartData = [{"country": "China","visits": 2325},{"country": "USA","visits": 1822},{"country": "Japan","visits": 1809},{"country": "Germany","visits": 1322},{"country": "UK","visits": 1122},{"country": "France","visits": 1114}];AmCharts.ready(function () {// SERIAL CHARTchart = new AmCharts.AmSerialChart(AmCharts.themes.light);chart.dataProvider = chartData;chart.categoryField = "country";chart.startDuration = 1;// AXES// categoryvar categoryAxis = chart.categoryAxis;belRotation = 90;categoryAxis.gridPosition = "start";// value// in case you don't want to change default settings of value axis,// you don't need to create it, as one value axis is created automatically.// GRAPHvar graph = new AmCharts.AmGraph();graph.valueField = "visits";graph.balloonText = "[[category]]: <b>[[value]]</b>";graph.type = "column";graph.lineAlpha = 0;graph.fillAlphas = 0.8;// display label text on each columnbelText = "[[value]]";chart.addGraph(graph);// CURSORvar chartCursor = new AmCharts.ChartCursor();chartCursor.cursorAlpha = 0;chartCursor.zoomable = false;chartCursor.categoryBalloonEnabled = false;chart.addChartCursor(chartCursor);chart.creditsPosition = "top-right";chart.write("chartdiv");});</script></head><body><div id="chartdiv" style="width: 100%; height: 300px;"></div></body></html>更多关于JavaScript相关内容可查看本站专题:《》、《》、《》、《》、《》、《》及《》希望本⽂所述对⼤家JavaScript程序设计有所帮助。
amCharts开发笔记

AmCharts学习笔记
2012-4-6
基本属性说明 (3)
第一章AmChart基本属性说明图种类
坐标系
图元元素
事件
关系
属性
在相应的图表组件中,会有一些关键的属性,需要去了解,在此处罗列一些在开发中需要用到的几个关键点。
AmSerialChart
图形类型介绍:
Line,线性图smoothedLine,平滑曲线Column,柱状图
Step,连续的柱状图
smoothedLine, candlestick, ohlc
Error messages //错误信息、
第二章开发功能点说明
水文过程线
◆极大值,极小值的标注说明(颜色标注,符号标注)
◆所选数据计算,计算所选区数据总和
◆水位、流量的双数据显示
注意事项:
1、数据一定得排序,数据的显示顺序是按数据添加的顺序出现(有可能不需要)
11。
WPF中使用amCharts绘制股票K线图

本想自己用GDI绘图, 通过数据直接绘制一张蜡柱图, 但觉得这样子的功能比较少, 所以到网上搜索一些能画出K线图的控件. 发现DynamicDataDisplay挺好的, 在它的开发截图里也发现可以绘制蜡柱图, 但文档好像做的不是很好, 不知道怎么用它来画, 在寻找它比较好的例子的时候发现有人推荐用amCharts绘制, 所以便去看了一下, 发现挺好用的, 效果如下:
准备工作
先要去这里下载amCharts Stock Chart for WPF并解压, 新建一个WPF Project, 在Toolbox里右击, 选择Choose Items, 然后点击Browse, 找到解压后的文件夹里有
上面的代码都是产生的K线图, amCharts控件还可以在K线图下面画一个成交量的柱形图或者折线图.。
Memograph M高级数据管理器批次分析软件用户手册说明书

Products Solutions Services BA01411R/09/en/01.1571302210SoftwareENU000A, V02.00.xxAdditional instructionsMemograph M, RSG45Advanced Data ManagerBatch Software OptionAdditional Functions for Automatic Batch AnalysisAdvanced Data Manager 2Advanced Data Manager 3Table of contents1 General description of the function . . .42 Device configuration, application setup 52.1 General programming guidelines . . . . . . . . . . . . . . 52.2 Expert - Application - Batch mode . . . . . . . . . . . . . 52.3 Expert - Inputs - Digital inputs . . . . . . . . . . . . . . . . 92.4 Expert - Application - Signal groups . . . . . . . . . . 102.5 Use during operation . . . . . . . . . . . . . . . . . . . . . . 113 Error messages and troubleshooting .154 Technical data . . . . . . . . . . . . . . . . . . . .155 Appendix. . . . . . . . . . . . . . . . . . . . . . . . .16General description of the function Advanced Data Manager41General description of the functionThis manual constitutes an additional description for a special software option. These additional instructions are not intended as a substitute for the Operating Instructions!For detailed information, refer to the Operating Instructions and other documentation. Available for all device versions via:•Internet: /deviceviewer•Smart phone/Tablet: Endress+Hauser Operations AppDefinition of the batch function:A batch in production refers to the total of all units of a product, produced, manufactured or packed under the same conditions. A total of this type is generally assigned a unique lot number (batch number) and this number is also often marked on the products in this lot.The batches are assigned to a fixed signal analysis in the device (batch 1 -> analysis 1, batch 2 -> analysis 2 etc.).Note: if 4 batches are running in parallel, the operator cannot carry out any further analyses (e.g. daily analysis). Only the totalizer is always determined.A batch can be started or stopped manually at the device, using an external keyboard, barcode reader, control input (digital input) or via remote operation (fieldbus/OPC).At the end of the batch, a batch report ("Signal analysis") is created with min/max/average values and quantities. This can also be printed automatically.The batch software also contains the Math package.The following information concerning FDA 21 CFR Part 11 compliance is the responsibility of the user:‣Incorrect data logging will result if incorrect start and stop times are entered‣Incorrect data logging will result if incorrect or no batch information is entered‣Only authorized persons (controlled by user administration) may sign a batchAdvanced Data Manager Device configuration, application setup 52Device configuration, application setup 2.1General programming guidelines 1.First install and configure the device as described in the Operating Instructions BA01338R. Observe all the safety instructions!2.Make the additional settings needed for batch mode (see the next section).3.Configure the display, for example choose the display mode. See Chapter 11 of the Operating Instructions BA01338R.2.2Expert - Application - Batch mode Required settings for batch mode.Depending on the selected function, the device's user interface adapts itself, so that each time only required parameters have to be checked/set.Fig.1:Expert - Application - Batch mode "Application - Batch mode" menu itemsConfigurable parameters (factory settings are highlighted in bold)Direct access code The device processes The device can record up to 4 batches simultaneously. Configure how many batches the device should process simultaneously.Picklist: Switched off , 1 batch per device, x batches simult. per device490000/000Batch number Configure how the batch number is generated:"Manual": You can enter any text as the batch number."Increase automatically": the batch number is automatically increased by 1 after the batch is finished.490001/000Autom. batch readout Activate this function to make the PC software automatically read out the data and print it out as soon as the batch is finished.Note: Only available if the device is connected via Ethernet and the readout automation system isstarted in the "Field Data Manager (FDM)" evaluation software.Picklist: no , yes490002/000IP address Enter the IP address of the reader PC here. Where necessary, contact your network administrator tofind out the IP address. Note: A DNS name can also be used.Factory setting: 000.000.000.000490003/000Device configuration, application setup Advanced Data Manager6Port A connection to the reader PC is established through this communication port.Note: If your network is protected by a firewall, this port may have to be enabled. In such instances,contact your network administrator.Factory setting: 8001490004/000"Required inputs"submenuSpecify which data fields must be input before a batch can be started. A batch cannot be started untilthe selected required fields have been input.Fig.2: Expert - Application - Batch mode, "Required inputs" submenuIdentifier Specify if the batch designation must be input so that a batch canbe started. Picklist: no, yes490005/000Batch name Specify if the batch name must be input so that a batch can bestarted. Picklist: no, yes490006/000Batch number Specify if the batch number must be input so that a batch can bestarted. Picklist: no, yes490007/000Preset counter Specify if the preset counter must be input so that a batch can bestarted. If "no", the last preset counter is reused.Note: Only relevant if batch is ended per preset counter.Picklist: no, yes490008/000 "Application -Batch mode"menu itemsConfigurable parameters(factory settings are highlighted in bold)DirectaccesscodeAdvanced Data Manager Device configuration, application setup 7"Printout" submenu Settings for batch printout (only relevant if device has printer connected).Note: Only channels which are assigned to an active batch are printed out, i.e. if "Batch x“ or "Assignall batches“ is configured under "Application -> Signal groups -> Group x -> Batch assignment" - in Setup. All other channels are disabled.Note: The batch printout can be activated in "Expert -> Application -> Signal evaluation -> Autom.printout".Fig.3: Expert - Application - Batch mode, "Printout" submenuPrintout: Field 1The batch report has 3 fields which the user can fill in individuallyafter printing out the report. Here, configure the name for this field. Text entry: max. 22-digit.Factory setting: Operator490010/000Printout: Field 2The batch report has 3 fields which the user can fill in individually after printing out the report. Here, configure the name for this field.Text entry: max. 22-digit.Factory setting: QA responsible490011/000Printout: Field 3The batch report has 3 fields which the user can fill in individuallyafter printing out the report. Here, configure the name for this field.Text entry: max. 22-digit. Factory setting: Date/Time490012/000Number of copies Configure how many copies should be printed out.Picklist: 1, 2, 3490013/000"Batch 1-4" submenu Batch-specific settings.Fig.4: Expert - Application - Batch mode, "Batch x" submenu"Application - Batch mode" menu itemsConfigurable parameters (factory settings are highlighted in bold)Direct access codeDevice configuration, application setup Advanced Data Manager8Description Enter a unique description for the batch here (recommended whenseveral batches are running in parallel on the device.) If no data areentered, the device generates a description automatically.Text entry: max. 16-digit.490014/000490014/001490014/002490014/003 Start/stop Specify how batches are started/ended."Per control input": the batch is started/ended externally via adigital control input (effect: start/stop batch x)."At device/barcode/fieldbus": the batch can be started/ended byoperating the device, using a barcode or remotely (PC software,fieldbus)."Preset counter": the batch can be started by operating the device,using a barcode reader or control input. The batch is ended whenthe counter value >= the default value.490015/000490015/001490015/002490015/003Control inputonly if "Start/stop" - "Presetcounter"Select the control input that starts the batch. Alternatively, thebatch can be started via on-site operation.Note: The batch cannot be ended using this input. The assignedinput is automatically pre-configured!Picklist: Switched off, Digital input x490017/000490017/001490017/002490017/003Control inputonly if "Start/stop" - "Percontrol input"Select the control input that starts/ends the batch.Note: The assigned input is automatically pre-configured!The input must be active during the batch. The minimum durationof the batch is one second.Picklist: Switched off, Digital input x490017/000490017/001490017/002490017/003Preset counteronly if "Start/stop" - "Presetcounter"Select the channel that ends the batch when the quantity preset inthe preset counter is reached.Note: The assigned input is automatically pre-configured!Picklist: Switched off, Analog input x, Digital input x, Maths x490016/000490016/001490016/002490016/003Max. Preset counteronly if "Start/stop" - "Presetcounter"The maximum preset counter defines the maximum value that maybe entered as the preset counter value to prevent incorrec t entries.User input: max. 8-digit.490021/000490021/001490021/002490021/003Default batch numberonly if "Batch number" -"Automatic"Configure the default value of the batch number, to which the batchnumber is set if it is reset via control input.User input: max. 8-digit.490019/000490019/001490019/002490019/003Reset batch numberonly if "Batch number" -"Automatic"Select the digital input that resets the batch number to its defaultvalue.Note: The assigned input is automatically pre-configured!Picklist: Switched off, Digital input x490020/000490020/001490020/002490020/003Switches relay The assigned relay is switched as long as the batch is running.Picklist: Not used, Relay x490018/000490018/001490018/002490018/003 "Application -Batch mode"menu itemsConfigurable parameters(factory settings are highlighted in bold)DirectaccesscodeAdvanced Data Manager Device configuration, application setup 92.3Expert - Inputs - Digital inputs Settings for digital inputs for batch mode.Only settings relevant for batch mode are described here. For all the other signal analysis functions, see the Operating Instructions.Fig.5:Expert - Inputs - Digital inputs - Digital input x "Inputs - Digital inputs" menu itemsConfigurable parameters (factory settings are highlighted in bold)Direct access code Function Select the required function. Digital inputs are High active, this means the described effect is achieved by a high input. Low = -3...+5 V, High = +12...+30 VThe following functions are available:"Switched off": digital input is not active."Control input": various control functions can be activated for batch mode using the digital input.250000/000 to250000/013Channel ident.Description of the function of this input (e.g. "Batch 1 start"). User input: 16-digit. Factory setting: Digital x250001/000 to 250001/013ActionSet up the function of the control input for batch mode:"Start/end batch x": starts/stops external analysis (analysis only runs while the signal is High). Measured value acquisition for the graphic display continues. Batches are also started/stopped usingthis function."Reset batch number x": resets the automatically generated batch number to 0 (for Low -> Highchange)"Batch x limit values on/off": switch the batch's limit values on/off.250003/000 to 250003/013Copy settings Copies settings from actual channel to selected channel. The last two positions of the channel ident.of the target channel are replaced by this channel number.250200/000 to 250200/013Device configuration, application setup Advanced Data Manager102.4Expert - Application - Signal groupsSettings for signal groups for batch mode.Only settings relevant for batch mode are described here. For all the other signal analysisfunctions, see the Operating Instructions.Fig.6: Expert - Application - Signal Groups - Group xNOTICEThe modified settings do not take effect until you return to display mode (groupdisplay) after parameterization. The operating menu is exited by repeatedly selectingthe menu item "Back"."Application -Signal groups"menu itemsConfigurable parameters(factory settings are highlighted in bold)DirectaccesscodeBatch assignment Configure what batch this group belongs to.Note:- Channels can be assigned to multiple batches/groups.- Only relevant for batch printout.Picklist: Do not assign any batch, Assign all batches, Batch x 460025/000 to 460025/009Save group(only if "Batch assignment" - "Batch x")The group will always be saved or only when the allocated batch is active.Picklist: Only when batch is active, always460026/000 to460026/009Advanced Data Manager Device configuration, application setup112.5Use during operation2.5.1"Batch" menuDuring operation, an individual symbol is displayed for each batch at the top, right in the measured value display. A green symbol indicates the batch has started. A red symbol indicates the batch has stopped.Only channels which are assigned to an active batch are displayed, i.e. if "Batch x“ or "Assign all batches“ is configured under "Application -> Signal groups -> Group x -> Batch assignment" - in Setup. All other channels are disabled.Fig.7: "Batch" menuCall up the "Batch" menu by pressing softkey 3 or using "Main menu -> Operation":Fig.8: "Batch" menuThis menu is used to enter batch information and control the batch."Batch - Batch x" menuitemsDescriptionStatus Current status of the batch.Identifier Text field for identifying the batch. Text entry: max. 30-digit Batch nameText field for identifying the batch. Text entry: max. 30-digitDevice configuration, application setup Advanced Data Manager122.5.2Starting/ending batchesBatches are started or ended using the following•Control input (an individual control input for each batch)•Operating the device (softkey 3 or under "Main menu -> Operation -> Batch")•Preset counter•Remote access (OPC server)•Profibus DP, Modbus, EtherNet/IP or PROFINET •Barcode readerAn analysis is saved at the end of a batch. The analysis is displayed under "Main menu -> Operation -> Signal analysis -> Batch x".Note:•The batch status (started or ended) is retained even after a power failure.•There must be at least 200 ms between 2 of the same batches (stop/start).•The minimum duration of a batch is 1 s. Batches that are shorter than this are not recorded.•A new batch cannot be started until the old one is ended.•The start and end of batches are recorded in the event log.Batch numberEnter a batch number. Text entry: max. 30-digitCan also be generated by the device as an option. An automaticlly generated batch number has 9 digits max., is numerical and does not have a leading sign.Note: the function depends on the settings under "Expert -> Application -> Batch mode -> Batch number".Preset counterConfigure the default value for the preset counter here. User input: max. 8-digit.The batch is automatically ended when the counter value >= the default value.Start time Once a batch is started, the start date and time are displayed here.Started by If user administration is activated, the name of the user who started the batch is displayed here.Start or end batchYou can start or end the batch here.Note: If user administration is activated, a user must be logged on so that a batch can be started/ended."Batch - Batch x" menuitemsDescriptionAdvanced Data Manager Device configuration, application setup132.5.3Displaying and printing out the batches in the Field Data Man-ager (FDM) PC softwareThe PC software supplied must first be installed before these functions can be executed. See the instructions and information on the CD-ROM of the PC software supplied.Procedure for batch read out with the PC software:1.Start the "Readout Data -> Mass Storage" or "Readout Data -> Online Connection"function. Step-by-step navigation makes operation easy. 2.Over the next few steps, the device is created in the database and the data are read out.Procedure for visualizing and printing out the batches with the PC software:1.Start the "Visualization -> New" function. Step-by-step navigation opens. Over the nextfew steps, the device must be selected as must the channels and batches to be visualized.2.The curves, reports, values and events now displayed can be printed out by clicking the print icon.3.With "Close", you can close the visualization or save it as a template.Details about the functions are provided in the integrated online help and in the manuals on the CD-ROM of the PC software supplied.2.5.4Automatic device readout at the end of a batchThis function is only possible if the device is connected via Ethernet.Port "8001" of the firewall must be enabled.The following settings must be made so that the device is automatically read out at the end of a batch:At the device:1.In the main menu, under "Expert -> Application -> Batch Mode", set "Autom. Batch Readout" to "Yes". Under "IP address" configure the IP address of the PC with the PC software installed.In the PC software provided:2.Start the "Data Management -> Automatic" function. Step-by-step navigation opens.3.In Step 1, select "Automatic Information -> Automatic New/Edit" and "Select Task: -> Read Out Device".4.In Step 2, select the right device.5.In Step 3, select "Read Out Job -> Active" and "Interval: Device".The effect of the "Additional Batch Triggered" function is that the device is additionally read out automatically at the selected interval (e.g. daily) after the end of the batch.6."Save" saves and activates the automatic function.7.The automatic function can be stopped or restarted under "Extras -> Settings -> Automatic".Details about the functions are provided in the integrated online help and in the manuals on the CD-ROM of the PC software supplied.Device configuration, application setup Advanced Data Manager142.5.5Input using a barcode readerBatch information can be entered in two ways using a barcode reader:Using the "Batch" menu:The barcode reader can be used for the following batch information: identifier, batch name and batch number. However, the relevant input dialogs must be called up manually using the "Batch" menu.Via command sequence as barcode:Steps:1.Read in the relevant barcode (= command sequence).(Refer to the Appendix for the barcodes of the command sequences for batches 1 to 4).2.Read in the actual data for the relevant batch.3.The device issues a message for 30 seconds on which data were read in. Description of the barcodes in the Appendix:CAUTION!Failsafe mode:‣If the relevant data are not read in within x seconds (x can be configured in the main menu under "Expert -> System -> Barcode reader -> Timeout sequences", 10 to 180 s, default = 30 s) after the command sequence is read in, the process is canceled without any messages.‣It is possible to read in a command sequence multiple, consecutive times. The last command sequence read in is always the valid one.Barcodeno.Code Function, descriptionm START BATCH x Start batch: scanning of the barcode starts the batch.Note: If user administration is activated, a user must be logged on so that a batch can be started.n STOPP BATCH x Stop batch: scanning of the barcode ends the batch.Note: If user administration is activated, a user must be logged on so that a batch can be ended.o BATCH x ID Identifier: after the barcode is scanned, the designation which identifies the batch can be scanned. Max. 30-digit. p BATCH x NAME Batch name: after the barcode is scanned, the batch name which identifies the batch can be scanned. Max. 30-digit. q BATCH x NO Batch number: after the barcode is scanned, the batch number can be scanned. Max. 30-digit.Can also be generated by the device as an option. An automatically generated batch number has 9 digits max., isnumerical and does not have a leading sign.Note: The function depends on the settings in "Expert -> Application -> Batch mode -> Batch number".r BATCH x ENTERALL After the barcode is scanned, the identifier, batch name and batch number can be scanned one after another. In this way, individual scanning of barcode 3, 4 and 5 is not necessary.s BATCH xDEFAULT Preset counter: after the barcode is scanned, the default value can be scanned. Max. 8-digit. The batch is automatically ended when the counter value >= the default value.t CANCEL Scanning of the barcode cancels barcode entry.Note: The batch is not canceled!Advanced Data Manager Error messages and troubleshooting153Error messages and troubleshootingYour unit informs you of faults or incorrect entries using plain text on the screen. During display operation (measured values display), the error codes are displayed in the upper righthand corner of the screen.Version with navigator and front interfaces:In addition a red LED signals failures or flashes in the event of warnings or required maintenance.Detailed error messages and troubleshooting can be found in the Operating Instructions.4Technical dataThe technical data of the Operating Instructions apply for this device option.Appendix Advanced Data Manager165AppendixBatch 1 + 2 command sequences (code 128):$$$_BAT CH_1_ST ART$$$_B A T CH_1_S T OP$$$_BAT CH_1_I D$$$_BAT CH_1_NAME$$$_B A T CH_1_NO$$$_BAT CH_1_ENT ER_AL L$$$_BAT CH_1_DEF AUL T$$$_CANCEL$$$_BAT CH_2_ST ART$$$_B A T CH_2_S T OP$$$_BAT CH_2_I D$$$_BAT CH_2_NAME$$$_B A T CH_2_NO$$$_BAT CH_2_ENT ER_AL L$$$_BAT CH_2_DEF AUL T$$$_CANCELm n o p q r s t m n o p q r s tAdvanced Data Manager Appendix17Batch 3 + 4 command sequences (code 128):$$$_BAT CH_3_ST ART$$$_B A T CH_3_S T OP $$$_BAT CH_3_I D $$$_BAT CH_3_NAME $$$_B A T CH_3_NO $$$_BAT CH_3_ENT ER_AL L $$$_BAT CH_3_DEF AUL T $$$_CANCEL $$$_BAT CH_4_ST ART$$$_B A T CH_4_S T OP$$$_BAT CH_4_I D$$$_BAT CH_4_NAME$$$_B A T CH_4_NO$$$_BAT CH_4_ENT ER_AL L$$$_BAT CH_4_DEF AUL T$$$_CANCELm n o p q r s tm n o p q r s tAppendix 18Appendix19。
Aplot 0.2.2 用户指南说明书

Package‘aplot’October6,2023Title Decorate a'ggplot'with Associated InformationVersion0.2.2Description For many times,we are not just aligning plots as what'cowplot'and'patch-work'ers would like to align associated information that requires axes to be ex-actly matched in subplots,e.g.hierarchical clustering with a heatmap.This package pro-vides utilities to aligns associated subplots to a main plot at differ-ent sides(left,right,top and bottom)with axes exactly matched.Depends R(>=4.1.0)Imports ggfun(>=0.1.3),ggplot2,ggplotify,patchwork,magrittr,methods,utilsSuggests ggtreeURL https:///YuLab-SMU/aplotLicense Artistic-2.0Encoding UTF-8RoxygenNote7.2.3NeedsCompilation noAuthor Guangchuang Yu[aut,cre](<https:///0000-0002-6485-8781>), Shuangbin Xu[ctb](<https:///0000-0003-3513-5362>),Thomas Hackl[ctb]Maintainer Guangchuang Yu<***********************>Repository CRANDate/Publication2023-10-0604:30:02UTCR topics documented:as.patchwork (2)gglist (2)gglistGrob (3)insert_left (3)plot_list (4)xlim2 (6)12gglist Index7 as.patchwork as.patchworkDescriptionas.patchworkUsageas.patchwork(x,align=getOption("aplot_align",default="xy"))Argumentsx objectalign"x","y","xy","none",align the axis of x/y or not.gglist construct a‘gglist‘objectDescriptionconstructure a‘gglist‘object that contains a list of plots(‘gglist‘)and parameters(via‘...‘),the object can be displayed via the‘plot_list()‘function.Usagegglist(gglist,...)Argumentsgglist a list of plots...parameters for plotting the‘gglist‘Valuegglist objectAuthor(s)Guangchuang YugglistGrob3 gglistGrob This function converts’gglist’object to grob(i.e.gtable object)Descriptiontitle gglistGrobUsagegglistGrob(x)Argumentsx A’gglist’objectValueA’gtable’objectinsert_left plot-insertionDescriptioninsert an associated plot to left,right,top and bottom of a main plotUsageinsert_left(.data,plot,width=1)insert_right(.data,plot,width=1)insert_top(.data,plot,height=1)insert_bottom(.data,plot,height=1)Arguments.data an’aplot’or’gg’objectplot a’gg’plot to be insertedwidth relative width to the main plotheight relative height to the main plotDetailsThefirst input serve as a main plot,and other plots can be progressively inserted to different sides on left,right,top and bottom.Valuean’aplot’objectAuthor(s)Guangchuang YuExampleslibrary(ggplot2)library(aplot)p<-ggplot(mtcars,aes(mpg,disp))+geom_point()p2<-ggplot(mtcars,aes(mpg))+geom_density(fill= steelblue ,alpha=.5)+ggfun::theme_noxaxis()p3<-ggplot(mtcars,aes(x=1,y=disp))+geom_boxplot(fill= firebrick ,alpha=.5)+theme_void()ap<-p%>%insert_top(p2,height=.3)%>%insert_right(p3,width=.1)apap[2,1]<-ap[2,1]+theme_bw()ap[2,1]<-ap[2,1]+aes(color=as.factor(am))+scale_color_manual(values=c( steelblue , darkgreen ))ap[1,1]<-ap[1,1]+theme(axis.line.x.bottom=element_line())applot_list plot a list of ggplot objectsDescriptionplot a list of ggplot objects using patchwork,similar to‘cowplot::plot_grid(plotlist)‘Usageplot_list(...,gglist=NULL,ncol=NULL,nrow=NULL,byrow=NULL,widths=NULL,heights=NULL,guides=NULL,labels=NULL,tag_levels=NULL,tag_size=14,design=NULL,output="patchwork")Arguments...list of plots to be arrangedgglist(optional)list of plotsncol number of columnsnrow number of rowsbyrow If"FALSE"the plots will befilled in in column-major order widths relative widthsheights relative heightsguides A string specifying how guides should be treated in the layout.labels manual specified labels to label plotstag_levels format to label plots,will be disable if’labels’is not NULL tag_size size of tagsdesign specification of the location of areas in the layoutoutput one of’gglist’or’patchwork’Valuecomposite plotAuthor(s)Guangchuang Yu6xlim2 xlim2xlim2Descriptionset axis limits(x or y)of a‘ggplot‘object(left hand side of‘+‘)based on the x(‘xlim2‘)or y (‘ylim2‘)limits of another‘ggplot‘object(right hand side of‘+‘).This is useful for using‘cowplot‘or‘patchwork‘to align‘ggplot‘objects.Usagexlim2(gg,limits=NULL)ylim2(gg,limits=NULL)Argumentsgg ggplot objectlimits vector of limits.If NULL,determine from‘gg‘.Valueggplot2object with new limitsAuthor(s)Guangchuang YuExampleslibrary(ggplot2)library(aplot)p1<-ggplot(mtcars,aes(cyl))+geom_bar()p2<-ggplot(subset(mtcars,cyl!=4),aes(cyl))+geom_bar()p2+xlim2(p1)Indexas.patchwork,2gglist,2gglistGrob,3insert_bottom(insert_left),3insert_left,3insert_right(insert_left),3insert_top(insert_left),3plot_list,4xlim2,6ylim2(xlim2),67。
android AChartEngine XYMultipleSeriesRenderer样式属性说明
android AChartEngine XYMultipleSeriesRenderer样式属性说明前两天再做一个关于AChartEngine曲线的实时显示,学习了一些AChartEngine基本用法,现在将XYMultipl eSeriesRend erer样式属性说明记录下来和大家一起分享一下[java]XYMultipl eSeriesRend erer renderer = new XYMultipl eSeriesRend erer();renderer.setChartTitl e(depid+"号房间"+type+"实时曲线");//标题renderer.setChartTitl eTextSize(20);renderer.setXTitl e(); //x轴说明renderer.setAxisTitl eTextSize(16);renderer.setAxesCol or(Col or.BLACK);renderer.setLabelsTextSize(); //数轴刻度字体大小renderer.setLabelsCol or(Col or.BLACK);renderer.setLegendTextSize(); //曲线说明renderer.setXLabelsCol or(Col or.BLACK);renderer.setYLabelsCol or(0,Col or.BLACK);[url]http://downl /detail/best198706/5351956[/u rl]renderer.setMargins(new int[] {20, 30, 100, 0});XYMultipl eSeriesRenderer renderer = new XYMultipl eSeriesRend erer();renderer.setChartTitl e(depid+"号房间"+type+"实时曲线");//标题renderer.setChartTitl eTextSize(20);renderer.setXTitl e(); //x轴说明renderer.setAxisTitl eTextSize(16);renderer.setAxesCol or(Col or.BLACK);renderer.setLabelsTextSize(); //数轴刻度字体大小renderer.setLabelsCol or(Col or.BLACK);renderer.setLegendTextSize(); //曲线说明renderer.setXLabelsCol or(Col or.BLACK);renderer.setYLabelsCol or(0,Col or.BLACK);[url]http://downl /detail/best198706/5351956[/u rl]renderer.setMargins(new int[] {20, 30, 100, 0});[java]XYSeriesRend erer r = new XYSeriesRenderer();r.setCol or(Col or.BLUE);r.setChartValuesTextSize(15);r.setChartValuesSpacing(2);r.setPointStyl e(PointStyl e.CIRCLE);r.setFillPoints(true);renderer.ad dSeriesRenderer(r); //加载曲线信息,r为XYSeriesRenderer对象renderer.setMarginsCol or(Col or.WHITE);renderer.setPointSize(1.5f);renderer.setYLabels(10);renderer.setPanEnabl ed(false,false); //曲线是否是可滑动触摸的renderer.setShowGrid(true);renderer.setYAxisMax(hlim); //数轴上限renderer.setYAxisMin(llim); // 数轴下限来源:清源教育。
swift charts 用法
swift charts 用法Charts 是一个功能强大的图表框架,使用 Swift 编写。
可以将其看作是Android 上大名鼎鼎的图表库 MPAndroidChart 在 iOS 上的移植。
它为我们提供了多种图表类型,如折线图、柱状图、饼状图、雷达图、散点图、K线图、气泡图等。
以下是使用 Charts 的基本步骤:1. 导入 Charts 库:在 Swift 文件中,使用 `import Charts` 语句导入Charts 库。
2. 创建图表视图:使用 `let chartView = ChartView()` 语句创建一个图表视图对象。
3. 设置图表数据:使用 `setChartData()` 方法设置图表数据。
该方法接受一个数据集对象作为参数,数据集对象包含了图表需要的数据。
4. 配置图表配置对象:使用 `configure()` 方法配置图表配置对象。
该方法接受一个图表配置对象作为参数,该对象包含了图表的样式、坐标轴、提示信息等设置。
5. 将图表视图添加到视图层次结构中:使用 `addSubview()` 方法将图表视图添加到当前视图中。
6. 刷新图表:使用 `refreshChart()` 方法刷新图表,使图表显示最新的数据。
以下是使用 Charts 创建折线图的示例代码:```swiftimport Chartslet chartView = ChartView()let dataSet = LineChartDataSet(values: [10, 20, 30, 40, 50], labels: ["A", "B", "C", "D", "E"])let data = LineChartData(dataSets: [dataSet])(data)(xAxis: Axis(format: .number), yAxis: Axis(format: .number))()(chartView)```以上代码创建了一个折线图,并设置了数据集、坐标轴格式等配置。
qtcharts队列的基本操作
qtcharts队列的基本操作
Qt Charts是Qt官方提供的用于创建图表和数据可视化的模块,它可以帮助开发者快速、轻松地在Qt应用程序中集成各种类型的图表,包括折线图、柱状图、饼图等。
在Qt Charts中,队列的基本
操作通常涉及到创建队列、向队列中添加数据、从队列中移除数据
以及对队列中的数据进行操作和展示。
首先,要使用Qt Charts中的队列,需要在Qt项目中引入相应
的头文件并链接相应的库。
然后,可以创建一个队列对象,例如QBarSeries、QLineSeries等,用于存储和管理图表中的数据。
接
下来,可以通过调用相应的方法向队列中添加数据,例如使用append方法添加新的数据点。
同时,也可以使用remove方法从队
列中移除数据。
在进行队列的基本操作时,还可以对队列中的数据进行排序、
筛选等操作,以便更好地展示数据。
另外,可以通过设置队列的样式、颜色、标签等属性来定制图表的外观,使其更符合实际需求。
除了基本的队列操作外,Qt Charts还提供了丰富的交互功能,例如缩放、平移、数据点选中等,可以让用户通过交互方式更直观
地查看和操作图表数据。
总之,Qt Charts提供了丰富而强大的队列操作功能,开发者
可以根据具体需求灵活运用,从而实现各种图表和数据可视化效果。
希望以上回答能够全面、详尽地解答你关于Qt Charts队列的基本
操作的问题。
mschart annotations 使用方法
一、概述在数据可视化中,注释是一种重要的功能,它可以帮助用户更清晰地理解图表中的数据,传达更加准确和清晰的信息。
MSChart是微软公司提供的一种图表绘制工具,具有丰富的功能和灵活的应用方式。
本文将介绍MSChart中注释的使用方法,帮助读者更好地利用这一功能进行数据可视化和分析。
二、MSChart注释的基本概念1. MSChart是什么?MSChart是微软公司提供的一种用于绘制图表的工具,它能够生成丰富多样的图表,包括线形图、柱状图、饼图等。
MSChart提供了丰富的功能和参数,能够满足用户在数据可视化方面的需求。
2. 注释在数据可视化中的作用注释是指在图表中添加文字、箭头、线条等元素,用来对图表中某个特定的数据点或趋势进行解释和说明。
注释能够让用户更加直观地理解数据,传达更加有效和清晰的信息。
三、在MSChart中使用注释的方法1. 添加注释在MSChart中,用户可以通过以下步骤添加注释:(1)通过代码:在代码中使用Annotation类的实例来创建并添加注释。
(2)通过设计器:在设计器中选择需要添加注释的图表,右键点击选择“添加注释”,然后在图表上选择需要添加注释的位置,并输入注释内容。
2. 设置注释的样式和格式MSChart提供了丰富的接口和属性来设置注释的样式和格式,包括字体、颜色、格式、位置等。
用户可以根据自己的需求对注释进行定制化设置,使得注释更加符合实际应用场景和用户需求。
3. 对注释进行交互操作在MSChart中,用户可以对注释进行交互操作,包括拖动、调整大小、隐藏、显示等。
这种交互操作能够帮助用户更好地理解数据,并进行更深入的分析和研究。
4. 多种类型的注释除了常见的文字注释外,MSChart还支持添加箭头、线条等元素作为注释,这些不同类型的注释能够更好地帮助用户理解数据,传达更加清晰的信息。
四、注意事项和常见问题1. 注释的数量和位置在使用注释时,需要注意不要添加过多的注释,这会导致图表混乱,影响用户的观感。
aachartkit用法aastates

Aachartkit是一个优秀的图表库,它可以用于创建各种类型的图表,包括折线图、柱状图、饼图等。
本文将介绍Aachartkit的基本用法和一些常用的功能。
一、基本用法1. 引入Aachartkit库要使用Aachartkit,首先需要在项目中引入该库。
可以通过npm安装,也可以直接下载Aachartkit的源代码并放置在项目中。
2. 创建图表容器在HTML文件中创建一个容器,用来放置图表。
可以使用一个div元素来作为容器,然后通过JavaScript代码来动态生成图表。
3. 初始化图表使用Aachartkit提供的方法,可以初始化图表并设置相关的参数,如图表的类型、标题、X轴和Y轴的标签等。
4. 渲染图表调用Aachartkit提供的渲染方法,将图表渲染到之前创建的容器中。
这样就完成了一个简单的图表的创建过程。
二、常用功能1. 设置图表类型Aachartkit支持多种图表类型,可以通过设置图表的type参数来指定需要创建的图表类型。
常见的图表类型包括折线图、柱状图、饼图等。
2. 数据绑定通过设置图表的data参数,可以将数据绑定到图表上。
数据可以是一个数组,也可以是一个对象,具体格式取决于图表的类型和要展示的数据内容。
3. 设置图表样式Aachartkit提供了丰富的样式设置选项,可以通过设置图表的style参数来调整图表的颜色、字体、边框等样式。
4. 配置图表交互图表可以添加交互功能,例如鼠标悬停时显示数据、点击图表时跳转到相关页面等。
通过设置图表的interaction参数,可以配置图表的交互行为。
5. 自定义图表除了使用Aachartkit提供的默认配置外,还可以通过设置图表的custom参数来自定义图表的样式和行为。
这样可以实现更加个性化的图表效果。
三、总结Aachartkit是一个功能强大、灵活性高的图表库,可以满足各种不同类型图表的需求。
通过本文介绍的基本用法和常用功能,相信读者们已经对Aachartkit有了初步的了解,并能够在实际项目中灵活运用这个优秀的图表库。
AMcharts
1.AMCharts
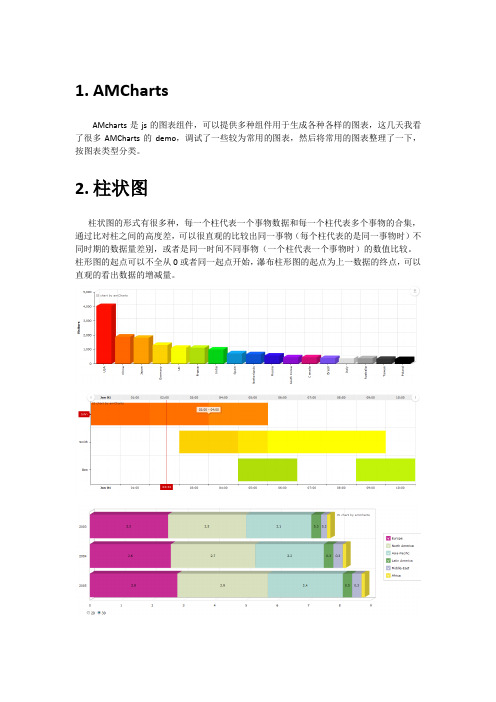
AMcharts是js的图表组件,可以提供多种组件用于生成各种各样的图表,这几天我看了很多AMCharts的demo,调试了一些较为常用的图表,然后将常用的图表整理了一下,按图表类型分类。
2.柱状图
柱状图的形式有很多种,每一个柱代表一个事物数据和每一个柱代表多个事物的合集,通过比对柱之间的高度差,可以很直观的比较出同一事物(每个柱代表的是同一事物时)不同时期的数据量差别,或者是同一时间不同事物(一个柱代表一个事物时)的数值比较。
柱形图的起点可以不全从0或者同一起点开始,瀑布柱形图的起点为上一数据的终点,可以直观的看出数据的增减量。
3.饼图
饼图可以直观的看出各个模块在总量中所占的比重,各个模块上显示出占有总量的百分比,在amcharts的饼图中,可以关闭不需要显示的模块,然后重新计算各个模块所占总量的百分比。
4.折线图
折线图可以只有一条折线和多条折线组合,单折线多用来表示一个事物的走向趋势起伏状态,多条折线组合在一起可以比较不同事物的数据变化走势和大小差距。
5.锥形图
锥形图可以显示出层级关系,还可以显示出各个层级所占的数据量值是多少,多表示流程的层级。
6.组合图:
组合图就是将以上几种图表组合在一个图里,有的时候多种图表组合在一起更容易比对出我们想要看到的数据趋势和数据的增减量等等变化,但组合在一起也要注意便于分辨。
Amcharts首页、文档和下载
Amபைடு நூலகம்harts最新更新资讯,共1条 (投递新闻)
Amcharts的特点包括:
*动画或静态 *价值轴能够扭转 *线性或对数轴的价值尺度 *预定义或定制的子弹 *定制描述任何数据点 *点击栏目/酒吧(可用于钻孔下来图表) *梯度弥漫 *价值指标插入式 *轴价值观内样区 *平台无关 *可以输出作为一项形象 *可控制在途经的JavaScript *设置和数据可以通过直接从一个HTML文件 *度身定做的形象或Flash (动画)背景 *无限标签 *旋转标签及轴价值观 *数据可自动重装上阵与预设频率 *任何格式文本气球
Amcharts首 页 、 文 档 和 下 载
Web 图表控件 Amcharts
编辑/纠错 分享到: 已用 +7 收藏 +74 报名参加深圳OSC源创会,抢樱桃机械键盘>>> ?
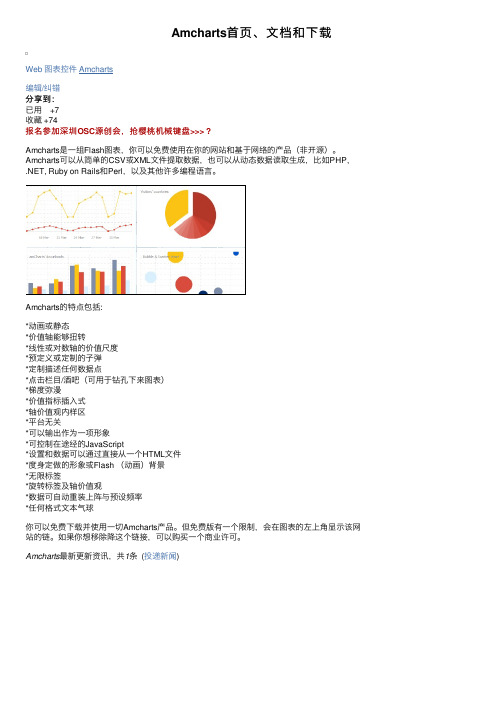
Amcharts是一组Flash图表,你可以免费使用在你的网站和基于网络的产品(非开源)。 Amcharts可以从简单的CSV或XML文件提取数据,也可以从动态数据读取生成,比如PHP, .NET, Ruby on Rails和Perl,以及其他许多编程语言。
amcharts应用配置操作总结大全
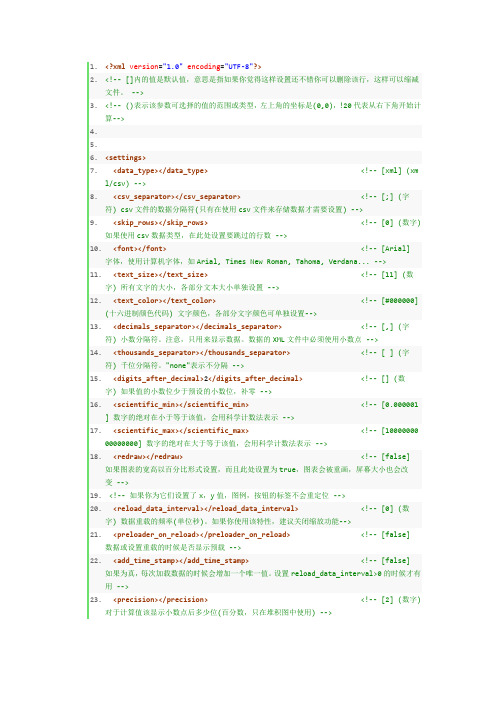
1.<?xml version="1.0"encoding="UTF-8"?>2.<!-- []内的值是默认值,意思是指如果你觉得这样设置还不错你可以删除该行,这样可以缩减文件。
-->3.<!-- ()表示该参数可选择的值的范围或类型,左上角的坐标是(0,0),!20代表从右下角开始计算-->4.5.6.<settings>7.<data_type></data_type><!-- [xml] (xml/csv) -->8.<csv_separator></csv_separator><!-- [;] (字符) csv文件的数据分隔符(只有在使用csv文件来存储数据才需要设置) -->9.<skip_rows></skip_rows><!-- [0] (数字)如果使用csv数据类型,在此处设置要跳过的行数 -->10.<font></font><!-- [Arial]字体,使用计算机字体,如Arial, Times New Roman, Tahoma, Verdana... -->11.<text_size></text_size><!-- [11] (数字) 所有文字的大小,各部分文本大小单独设置 -->12.<text_color></text_color><!-- [#000000](十六进制颜色代码) 文字颜色,各部分文字颜色可单独设置-->13.<decimals_separator></decimals_separator><!-- [,] (字符) 小数分隔符。
amcharts参考总结

以下是amchart相关资料总的来说:amcharts 要一个“配置文件”(setting.xml),一个数据文件 (amile_data.xml),一个 S WFObject.js ,一个对应的SWF 就可以生成漂亮的统计报表了1 SWFObject v1.5的对象结构deconcept util getRequestParameter(_2b) // 取得url参数value。
_2b是URL的key。
SWFObjectUtil getPlayerVersion() // 取得版本号对象。
major.minor.rev。
cleanupSWFs() // 清除页面上所有<OBJECT>元素。
SWFObject(_1, id, w, h, _5, c, _7, _8, _9, _a)// _1: swf,指定SWF文件路径。
// _id: id,<embed>或者<object>标签的id。
// w: width,属性width。
// h: height,属性height。
// _5: version,flash版本,默认自动会去读取本地的flash插件版本的。
// c: bgcolor,背景色。
// _7: quality,品质(low, high, autolow, autohigh, best ) 。
// _8: xiRedirectUrl// _9: redirectUrl// _a: url参数key useExpressInstall(_d) // 设置xiSWFPath, useExpressInstall属性setAttribute(_e, _f) // 设置属性attributes。
_e是key,_f是value。
getAttribute(_10) // 取得属性attributes中的值。
_10是key。
addParam(_l1, _l2) // 设置参数params。
Amcharts设置详细讲解
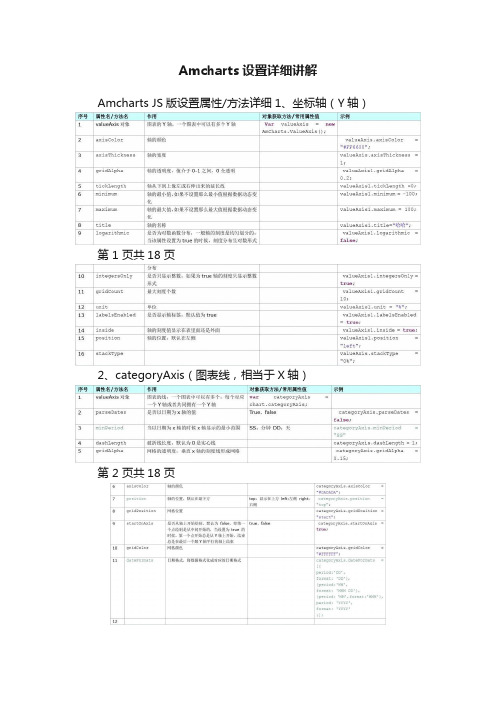
Amcharts设置详细讲解Amcharts JS版设置属性/方法详细1、坐标轴(Y轴)
第 1 页共18 页
2、categoryAxis(图表线,相当于X轴)
第 2 页共18 页
3、Legend(图例)
第 3 页共18 页
4、Guide(向导线)
第 4 页共18 页
5、Scrollbar(滚动条)
第 5 页共18 页
6、Graph (图表)
第 6 页共18 页
7、Chart (amcharts 对象)
第7 页共18 页
第8 页共18 页
8、ChartCursor(光标)
第9 页共18 页
9、动态图表示例
1、需要在html页面增加一个div,同时设置div的id和样式,amcharts将图表显示在指定的id
的div中
2、引用amcharts js 库和css样式
第10 页共18 页
3、设定一个定时器,循环调用函数
第11 页共18 页
第12 页共18 页
第13 页共18 页
第14 页共18 页
第15 页共18 页
4、写一个servlet程序,给amcharts提供动态数据
第16 页共18 页
5、效果截图
第17 页共18 页
第18 页共18 页。
Amcharts 设置详细
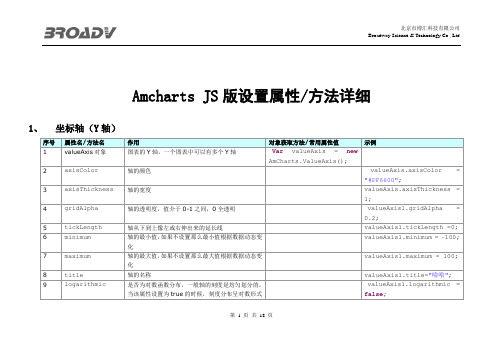
Amcharts JS版设置属性/方法详细1、坐标轴(Y轴)序号属性名/方法名作用对象获取方法/常用属性值示例1 valueAxis对象图表的Y轴,一个图表中可以有多个Y轴Var valueAxis = newAmCharts.ValueAxis();2 axisColor 轴的颜色 valueAxis.axisColor ="#FF6600";3 axisThickness轴的宽度valueAxis.axisThickness =1;4 gridAlpha轴的透明度,值介于0-1之间,0全透明 valueAxis1.gridAlpha =0.2;5 tickLength轴从下到上像左或右伸出来的延长线valueAxis1.tickLength =0;6 minimum 轴的最小值,如果不设置那么最小值根据数据动态变化valueAxis1.minimum = -100;7 maximum 轴的最大值,如果不设置那么最大值根据数据动态变化valueAxis1.maximum = 100;8 title 轴的名称valueAxis1.title="哈哈";9 logarithmic 是否为对数函数分布,一般轴的刻度是均匀划分的,当该属性设置为true的时候,刻度分布呈对数形式 valueAxis1.logarithmic = false;第 1 页共18 页分布10 integersOnly 是否只显示整数,如果为true轴的刻度只显示整数形式 valueAxis1.integersOnly = true;11 gridCount 最大刻度个数 valueAxis1.gridCount =10;12 unit 单位valueAxis1.unit = "%";13 labelsEnabled 是否显示轴标签,默认值为true belsEnabled= true;14 inside 轴的刻度值显示在表里面还是外面 valueAxis1.inside = true;15 position 轴的位置,默认在左侧valueAxis1.position ="left";16 stackType valueAxis.stackType ="0%";2、categoryAxis(图表线,相当于X轴)序号属性名/方法名作用对象获取方法/常用属性值示例1 valueAxis对象图表的线,一个图表中可以有多个,每个对应一个Y轴或者共同拥有一个Y轴var categoryAxis = chart.categoryAxis;2 parseDates是否以日期为x轴的值True、false categoryAxis.parseDates =false;3 minPeriod当以日期为x轴的时候x轴显示的最小范围SS:分钟DD:天categoryAxis.minPeriod ="SS"4 dashLength破折线长度,默认为0是实心线categoryAxis.dashLength = 1;5 gridAlpha网格的透明度,垂直x轴的刻度线形成网格 categoryAxis.gridAlpha =0.15;第 2 页共18 页6 axisColor 轴的颜色categoryAxis.axisColor ="#DADADA";7 position轴的位置,默认在最下方top:显示在上方left:左侧right:右侧 categoryAxis.position = "top";8 gridPosition 网格位置categoryAxis.gridPosition ="start";9 startOnAxis 是否从轴上开始绘制,默认为false,即第一个点绘制是从中间开始的,当设置为true的时候,第一个点开始总是从Y轴上开始,结束总是在最后一个跟Y轴平行的轴上结束true、false categoryAxis.startOnAxis =true;10 gridColor 网格颜色categoryAxis.gridColor ="#FFFFFF";11 dateFormats日期格式,将数据格式化成对应的日期格式categoryAxis.dateFormats =[{period:'DD',format: 'DD'},{period:'WW',format: 'MMM DD'},{period: 'MM',format:'MMM'},period: 'YYYY',format: 'YYYY'}];123、Legend(图例)序号属性名/方法名作用对象获取方法/常用属性值示例第 3 页共18 页1 legend对象在图表的上方或者下方显示图例,图例的颜色就是对应线条的颜色var legend = new AmCharts.AmLegend();2 align排列样式center legend.align = "center";3 marginLeft左边缘legend.marginLeft = 0;4 title标题legend.title="测试";5 horizontalGap水平间隔,一个图表可以有多个图例,图例之间的间隔用此属性legend.horizontalGap = 10;6 equalWidths 是否等宽 legend.equalWidths =false;7 valueWidth 值的宽度,在图例的右侧会显示该线或者图表的当前选中的值,设置为0时则不显示值legend.valueWidth = 120;8 switchType暂时没明白什么意思legend.switchType = "v"; 4、Guide(向导线)序号属性名/方法名作用对象获取方法/常用属性值示例1 guide对象向导线可以是一条根Y轴平行的线,也可以是一个矩形区域var guide = new AmCharts.Guide();2 fillAlpha区域透明度 guide.fillAlpha = 0.1;3 lineAlpha线透明度guide.lineAlpha = 0;4 value其实值,其实指对应Y坐标的值guide.value = 50;5 toValue到达值,其实指对应Y坐标的值,跟上面属性共同确定了一个从value到toValue的区域,宽度为图表的宽度,高度为(toValue-value)的绝对值guide.toValue = 0;6 lineColor 相导线的颜色 guide.lineColor =第 4 页共18 页"#CC0000";7 dashLength 破折长度,默认为0为实心线条,设置值后为破折线guide.dashLength = 4;8 label 标签,就是给向导线显示一个名字 bel = "平均值";9 inside 是否让向导线显示在图形里面,默认为true True,false guide.inside = true; 5、Scrollbar(滚动条)序号属性名/方法名作用对象获取方法/常用属性值示例1 scrollbar对象滚动条可以选择图表显示的区域var chartScrollbar = newAmCharts.ChartScrollbar();3 backgroundAlpha 滚动条背景透明度chartScrollbar.backgroundAlpha = 0.1;4 backgroundColor 滚动条背景颜色chartScrollbar.backgroundColor = "#000000";5 graphLineAlpha图像线条的透明度chartScrollbar.graphLineAlpha = 0.1;6 graphFillAlpha图像的填充透明度chartScrollbar.graphFillAlpha = 0;7 selectedGraphFillAlpha 选中图像的填充色的透明度chartScrollbar.selectedGraphFillAlpha = 0;8 selectedGraphLineAlpha 选中区域的图像线条透明度chartScrollbar.selectedGraphLineAlpha = 0.25;9 scrollbarHeight 滚动条高度chartScrollbar.scrollbarHeight = 30;10 selectedBackgr选中区域的背景颜色chartScrollbar.selectedBa第 5 页共18 页oundColor ckgroundColor = "#FFFFFF";6、Graph (图表)序号属性名/方法名作用对象获取方法/常用属性值示例1 graph对象图像对象,必须有该属性var graph1 = newAmCharts.AmGraph();2 valueAxis图像的Y轴,一个chart可以添加多个graph,一个graph只能有一个valueAxis graph1.valueAxis = valueAxis1;3 valueField指定一个字段作为Y坐标值graph1.valueField = "visits";4 bullet图像的节点类型graph1.bullet = "round";5 dashLength绘制图像时延时,默认为0秒,设置为正整数时可以看到动态生成效果graph1.dashLength = 0;6 hideBulletsCount 一个图像中当节点大于一定数值后隐藏节点形状graph1.hideBulletsCount = 10;7 balloonText 节点显示的文本内容 graph1.balloonText ="[[date]] ([[visits]])";8 lineColor 图像线颜色graph1.lineColor = "#d1655d";9 connect 是否连接起来,是指如果数据有x轴值,但是y轴值丢失的时候,如果设置为true则忽略该点,设置为false则线条在此点处断开graph1.connect = false;10 bulletBorderColor 节点边框颜色 graph1.bulletBorderColor ="#FFFFFF";11 bulletBorderThickness 节点边框宽度graph1.bulletBorderThickness = 2;12 customBulletFi用户自定义节点字段graph.customBulletField =第 6 页共18 页eld"bullet";13 bulletOffset节点偏移量graph.bulletOffset = 16;14 cornerRadiusTopgraph.cornerRadiusTop = 8;15 bulletSize节点大小graph.bulletSize = 14;16 colorField颜色字段,颜色可以从数据中读取graph1.colorField = "color";17 type 图像类型,有line、column、smoothedLine类型,第一种为线形图,第二种为柱状图line /column/smoothedLine graph1.type = "line";18 fillAlphas填充区透明度,默认为0,最大值为1,当设置值时,在线条跟x轴之间的区域会填充颜色graph1.fillAlphas = 0.3;19 negativeLineColor 当数值为负数时线条的颜色graph1.negativeLineColor ="#efcc26";7、Chart (amcharts 对象)序号属性名/方法名作用对象获取方法/常用属性值示例1 chart对象Amcharts 的核心对象var chart = newAmCharts.AmSerialChart();2 pathToImages指定chart图片的引用地址 chart.pathToImages ="amcharts/images/";3 zoomOutButton设置放大/缩小按钮的背景色和透明度chart.zoomOutButton = {backgroundColor:'#000000',第7 页共18 页backgroundAlpha: 0.15};4 dataProvider指定数据来源,一般指向一个数组对象chart.dataProvider =chartData;5 categoryField指定X轴由哪个字段决定chart.categoryField ="date";6 autoMargins 自动调整边距,如果设置为true则边距设置不起效chart.autoMargins = true;7 fontSize 字体大小chart.fontSize = 14;8 color 图标颜色chart.color = "#FFFFFF";9 marginTop 上边距chart.marginTop = 100;10 marginLeft 左边距chart.marginLeft = 50;11 marginRight 右边距chart.marginRight = 30;12 addGraph(graph) 添加一个图形,可以添加多个,想要绘制图形,必须有此方法chart.addGraph(graph1);13 validateNow(div)当数据改变时或者属性改变时,想要重新绘图,可以调用该方法chart.validateNow('chartd iv');14 chart.write('chartdiv'); 将amcharts对象写到一个div中,最常用方法chart.chart.write('chartdiv');;15 addListener('dataUpdated', zoomChart)添加一个监听函数,第一个参数是指定事件,第二个是调用的函数名chart.addListener('zoomed', handleZoom);chart.addListener('dataUpdated', zoomChart);16 rotate 图像是否xy轴互换,默认为false,如果想让图像顺时针旋转90°,则设置为trueFalse,true chart.rotate = false;17 depth3D设置为3d图像的厚度值chart.depth3D = 5018 angle角度,当设置图像为3d图时使用该属性,默认为0chart.angle = 40第8 页共18 页19 startDuration chart.startDuration = 220 plotAreaBorderColor 绘图区域边框颜色chart.plotAreaBorderColor= "#000000";21 plotAreaBorderAlpha 绘图区域边框透明度chart.plotAreaBorderAlpha= 5;22 backgroundImage设置背景图片的地址chart.backgroundImage ="amcharts/images/bg.jpg";23 addChartScrollbar(chartScrollbar)添加滚动条,只能添加一个chart.addChartScrollbar(chartScrollbar);24 addLegend(legend) 添加图例,可以添加多个chart.addLegend(legend);25 addValueAxis(valueAxis1) 添加Y轴。
amcharts柱状图配置中文解析

<xml version="" encoding="UTF-8"><!-- Value between [] brackets, for example [#FFFFFF] shows default value which is used if this parameter is not set --><!-- This means, that if you are happy with this value, you can delete this line at all and reduce file size --><!-- value or explanation between () brackets shows the range or type of values you should use for this parameter --><!-- the top left corner has coordinates x = 0, y =--><!-- "!" before x or y position (for example: <x>!20</x>) means that the coordinate will be calculated from the right side or the bottom --> <settings><type></type><!-- 柱状图是纵向还是横向,默认纵向[column] (column / bar) --> <data_type></data_type> <!-- 数据类型[xml] (xml / csv) --><csv_separator></csv_separator> <!-- CSV数据类型的分隔符[;] (string)csv file data separator (you need it only if youare using csv file for your data)--><skip_rows></skip_rows> <!-- [0] (Number) if you are using csv data type, you can set thenumber of rows which should be skipped here --><font>Tahoma</font><!-- [Arial] (font name) use device fonts, such as Arial,Times New Roman, Tahoma, Verdana... --><text_size></text_size> <!-- [11] (Number) text size of all texts. Every text size can beset individually in the settings below --> <text_color></text_color> <!-- [#000000] (hex color code) main text color. Every textcolor can be set individually in the settings below--><decimals_separator></decimals_separator> <!-- [,] (string) decimal separator. Note, that this is fordisplaying data only. Decimals in data xml file must beseparated with a dot --><thousands_separator></thousands_separator> <!-- [ ] (string) thousand separator. use "none"if you don't want to separate --><scientific_min></scientific_min> <!-- [] If absolute value of your number is equal orless then scientific_min, this number will be formatted usingscientific notation, for example: ->--><scientific_max></scientific_max> <!-- [000] If absolute value of your number is equalor bigger then scientific_max, this number will be formattedusing scientific notation, for example: 0000 -> --><digits_after_decimal></digits_after_decimal> <!-- [] (Number) if your value has less digits after decimalthen is set here, zeroes will be added --><redraw>true</redraw> <!--如果chart的宽度或高度是用百分比设置的话,redraw为true则将在屏幕变化时自动调整大小[false] (true / false) if your chart's width or height is set in percents,and redraw is set to true, the chart will be redrawn then screen size changes --><!-- this function is beta, be careful. Legend, buttons labels will not be repositionedif you set your x and y values for these objects --><reload_data_interval></reload_data_interval> <!-- [0] (Number) how often data should be reloaded (time in seconds) --><preloader_on_reload></preloader_on_reload> <!-- [false] (true / false) Whether to show preloaded whendata or settings are reloaded --> <add_time_stamp></add_time_stamp> <!-- [false] (true / false) if true, a unique number will be addedevery time flash loads data. Mainly this feature is useful ifyou set reload _data_interval --> <precision></precision><!-- [2] (Number) shows how many numbers should be shown aftercomma for calculated values (percents) --><depth>0</depth> <!-- 柱子的纵深,用于3D效果[0] (Number) the depth of chart and columns (for 3D effect) --><angle>0</angle> <!-- 柱子倾斜角度,用于3D效果[30] (0 - 90) angle of chart area and columns (for 3D effect) --><colors></colors> <!-- [#FF6600,#FCD202,#B0DE09,#0D8ECF,#2A0CD0,#CD0D74,#CC0000,#00CC00,#0000CC,#DDDDDD,# 999999,#333333,#990000] Colors of graphs. if the graph color is not set,color from this array will be used --><js_enabled></js_enabled> <!-- [true] (true / false) In case you don't use any flash - JavaScript communication,you shuold set this setting to false - this will save some CPU and will disablethe security warning message which appears when opening the chart from hard drive. --><column><type></type> <!--柱子类型(集中型、堆栈图、100%堆栈图、3D柱状图)[clu stered] (clustered, stacked, 100% stacked, 3d column) --><width>85</width> <!--柱子占栏的百分比 [80](0 - 100) width of column (in percents) --><spacing>0</spacing> <!--柱子间的间距 [5] (Number) space between columns of one category axis value, in pixels.Neg ative values can be used. --><grow_time>3</grow_time> <!--柱子生成时间 [0] (Number) grow time in seconds. Leave 0 to appear instantly --><grow_effect></grow_effect> <!-- 柱子生成效果[elastic] (elastic, regular, strong) --><sequenced_grow>true</sequenced_grow> <!-- 逐个显示还是一起显示[false] (true / false) whethercolumns should grow at the same time or one after another --><alpha></alpha><!-- [100] (Number) alpha of all columns --><border_color></border_color> <!-- [#FFFFFF] (hex color code) --><border_alpha></border_alpha> <!-- [0] (Number) --><data_labels><![CDATA[]]></data_labels> <!--柱子值显示 [] ({title} {value} {series} {percents} {start} {difference}{total}) You can format any data label: {title} will be replacedwith real title, {value} - with value and so on. You can add yourown text or html code too. --><data_labels_text_color></data_labels_text_color><!-- [text_color] (hex color code) --><data_labels_text_size></data_labels_text_size><!-- [text_size] (Number) --><data_labels_position></data_labels_position><!-- 柱子值显示位置[outside] (inside, outside, above).Thissetting is only for clustered chart. --><!-- if you set "above" for column chart, the data labelwill be displayed inside column, rotated by 90 degrees --><data_labels_always_on></data_labels_always_on><!--是否始终显示柱子值 [false] (true / false)If the data label is placed inside of the baror column (stacked chart) and the bar or columnistoo small for the label to fit, it is hidden.If you set this setting to "true",the data labelswill always be visible. --><balloon_text><![CDATA[]]></balloon_text> <!--气球显示数据格式 [] ({title} {value} {series} {percents}{start} {difference} {total}) You can format any data label:{title} will be replaced with real title, {value} - with valueand so on. You can add your own text or html code too. --><link_target></link_target> <!-- [] (_blank, _top ...) --><gradient></gradient> <!--颜色渐变方向 [vertical] (horizontal / vertical) Direction of column gradient.Gradient colors are defined in graph settings below. --><bullet_offset></bullet_offset> <!--子弹与柱子的间距[0] (Number) distance from column / bar to the bullet --><hover_brightness>30</hover_brightness> <!--鼠标指向柱子时的明暗度 [0] (from -255 to 255)The column may darken/lighten。
AStyle的使用方法
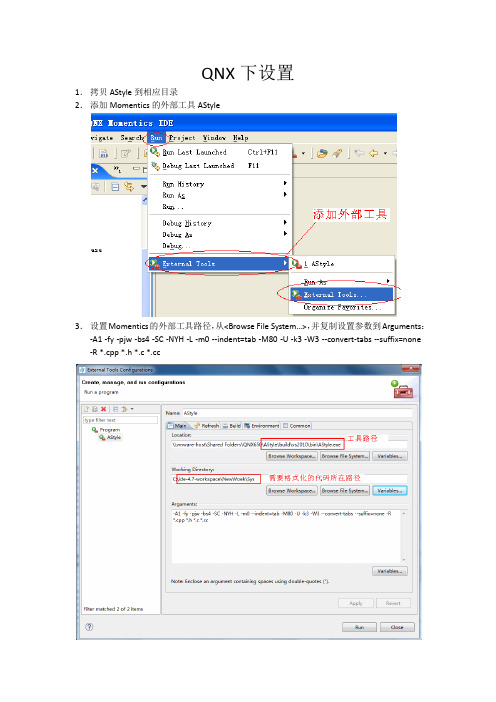
QNX下设置1.拷贝AStyle到相应目录2.添加Momentics的外部工具AStyle3.设置Momentics的外部工具路径,从<Browse File System…>,并复制设置参数到Arguments:-A1 -fy -pjw -bs4 -SC -NYH -L -m0 --indent=tab -M80 -U -k3 -W3 --convert-tabs --suffix=none -R *.cpp *.h *.c *.cc参数说明:1.-A1 :选用的代码风格类型--style=allman / --style=ansi / --style=bsd / --style=break / -A1Allman style formatting/indenting uses broken brackets.int Foo(bool isBar){if (isBar){bar();return 1;}elsereturn 0;}2.-f:在( 'if', 'for', 'while'...)后加空行3.-y:碰到else则换行4.-p:在运算符前后插入空格5.-j:if后的单行添加{}大括弧6.-w:使用“\”连接的多行,将使用缩进设置7.-b:旧的选项,同-A1设置,大括弧{}都换行8.-s4:tab代表的字符设置9.-S:switch的case缩进,但case后的{}不再缩进(-K将引起case后的{}也同样缩进)10.-C:类设置,public等自动缩进11.-N:namespace设置,需要缩进12.-Y:common和程序行一样缩进,可以取消?13.-H:计算符后插入空格14.-L:Lable也缩进15.-m0:条件语句换行后缩进量,缺省为2字符16.--indent=tab:或者设置--indent=space,缩进使用tab或者空格,缺省都是4个字符位置。
AM教程-扫盲实验篇

将【原点的位置】后面的选择框勾选上,这样人物的下方中心会和预览框中
的十字中心对齐,方便调整。(人物和怪物基本上都会勾选上,当然也有特
殊情况,这里先不涉及)
之后,在【画像】后面的下拉菜单中选择刚才我们导入的素材,就会在下方
生成该素材的预览。下面的放大镜图标提供放大缩小预览图的功能。
这时你会发现素材已经被划分好了,因为我们在刚才的素材管理器中已经做
这里放了几个路灯。
OK,现在场景搭建好了,我们开始制作人物和怪物。
不过看看时间不早了,我决定去睡觉。。。。。。
接下来的重头戏要明天神清气爽的时候写~~XD
【AM】教程:AM教程-扫盲实验篇(二)
2009-04-08 14:22
道德三皇五帝,功名夏后商周.
英雄五霸闹春秋,顷刻兴亡过手.
青史几行名姓,北邙无数荒丘.
日即将完成的汉化版为准,当然,所谓不日即将完成是我的期待而已)。
这个选项卡有一个约定,就是第一个事件默认就是主人公的事件。所有关于
主人公的操作都在这里设置。
图1
我们来看中间的小框
图2
这里,就是我们将要放置人物动作的地方。我们还是先来看一个制作实例,
再讲解这里面的运行机制。
首先,如图,先给这第一个事件起名叫【主人公】或者类似草泥马、凹凸曼
这里我们看到的是已经搭建好的场景。
搭建的过程:
1.如图所示,在图块选项卡中选择新规追加,并起一个名字。
2.在右边的判定与属性设定中,导入已经起好名字的图像,这里我把地图图块起名叫地图块。
3.因为这次不涉及重力问题,所以壁判定我没有动,以后再讲这个问题。
4.在最后边那个选项卡中,就是那个【乱七八糟不知道是什么の设定】中,选择素材的分割尺寸。这幅地图块
- 1、下载文档前请自行甄别文档内容的完整性,平台不提供额外的编辑、内容补充、找答案等附加服务。
- 2、"仅部分预览"的文档,不可在线预览部分如存在完整性等问题,可反馈申请退款(可完整预览的文档不适用该条件!)。
- 3、如文档侵犯您的权益,请联系客服反馈,我们会尽快为您处理(人工客服工作时间:9:00-18:30)。
Amcharts JS版设置属性/方法详细1、坐标轴(Y轴)序号属性名/方法名作用对象获取方法/常用属性值示例1 valueAxis对象图表的Y轴,一个图表中可以有多个Y轴Var valueAxis = newAmCharts.ValueAxis();2 axisColor 轴的颜色 valueAxis.axisColor ="#FF6600";3 axisThickness轴的宽度valueAxis.axisThickness =1;4 gridAlpha轴的透明度,值介于0-1之间,0全透明 valueAxis1.gridAlpha =0.2;5 tickLength轴从下到上像左或右伸出来的延长线valueAxis1.tickLength =0;6 minimum 轴的最小值,如果不设置那么最小值根据数据动态变化valueAxis1.minimum = -100;7 maximum 轴的最大值,如果不设置那么最大值根据数据动态变化valueAxis1.maximum = 100;8 title 轴的名称valueAxis1.title="哈哈";9 logarithmic 是否为对数函数分布,一般轴的刻度是均匀划分的,当该属性设置为true的时候,刻度分布呈对数形式 valueAxis1.logarithmic = false;第 1 页共18 页分布10 integersOnly 是否只显示整数,如果为true轴的刻度只显示整数形式 valueAxis1.integersOnly = true;11 gridCount 最大刻度个数 valueAxis1.gridCount =10;12 unit 单位valueAxis1.unit = "%";13 labelsEnabled 是否显示轴标签,默认值为true belsEnabled= true;14 inside 轴的刻度值显示在表里面还是外面 valueAxis1.inside = true;15 position 轴的位置,默认在左侧valueAxis1.position ="left";16 stackType valueAxis.stackType ="0%";2、categoryAxis(图表线,相当于X轴)序号属性名/方法名作用对象获取方法/常用属性值示例1 valueAxis对象图表的线,一个图表中可以有多个,每个对应一个Y轴或者共同拥有一个Y轴var categoryAxis = chart.categoryAxis;2 parseDates是否以日期为x轴的值True、false categoryAxis.parseDates =false;3 minPeriod当以日期为x轴的时候x轴显示的最小范围SS:分钟DD:天categoryAxis.minPeriod ="SS"4 dashLength破折线长度,默认为0是实心线categoryAxis.dashLength = 1;5 gridAlpha网格的透明度,垂直x轴的刻度线形成网格 categoryAxis.gridAlpha =0.15;第 2 页共18 页6 axisColor 轴的颜色categoryAxis.axisColor ="#DADADA";7 position轴的位置,默认在最下方top:显示在上方left:左侧right:右侧 categoryAxis.position = "top";8 gridPosition 网格位置categoryAxis.gridPosition ="start";9 startOnAxis 是否从轴上开始绘制,默认为false,即第一个点绘制是从中间开始的,当设置为true的时候,第一个点开始总是从Y轴上开始,结束总是在最后一个跟Y轴平行的轴上结束true、false categoryAxis.startOnAxis =true;10 gridColor 网格颜色categoryAxis.gridColor ="#FFFFFF";11 dateFormats日期格式,将数据格式化成对应的日期格式categoryAxis.dateFormats =[{period:'DD',format: 'DD'},{period:'WW',format: 'MMM DD'},{period: 'MM',format:'MMM'},period: 'YYYY',format: 'YYYY'}];123、Legend(图例)序号属性名/方法名作用对象获取方法/常用属性值示例第 3 页共18 页1 legend对象在图表的上方或者下方显示图例,图例的颜色就是对应线条的颜色var legend = new AmCharts.AmLegend();2 align排列样式center legend.align = "center";3 marginLeft左边缘legend.marginLeft = 0;4 title标题legend.title="测试";5 horizontalGap水平间隔,一个图表可以有多个图例,图例之间的间隔用此属性legend.horizontalGap = 10;6 equalWidths 是否等宽 legend.equalWidths =false;7 valueWidth 值的宽度,在图例的右侧会显示该线或者图表的当前选中的值,设置为0时则不显示值legend.valueWidth = 120;8 switchType暂时没明白什么意思legend.switchType = "v"; 4、Guide(向导线)序号属性名/方法名作用对象获取方法/常用属性值示例1 guide对象向导线可以是一条根Y轴平行的线,也可以是一个矩形区域var guide = new AmCharts.Guide();2 fillAlpha区域透明度 guide.fillAlpha = 0.1;3 lineAlpha线透明度guide.lineAlpha = 0;4 value其实值,其实指对应Y坐标的值guide.value = 50;5 toValue到达值,其实指对应Y坐标的值,跟上面属性共同确定了一个从value到toValue的区域,宽度为图表的宽度,高度为(toValue-value)的绝对值guide.toValue = 0;6 lineColor 相导线的颜色 guide.lineColor =第 4 页共18 页"#CC0000";7 dashLength 破折长度,默认为0为实心线条,设置值后为破折线guide.dashLength = 4;8 label 标签,就是给向导线显示一个名字 bel = "平均值";9 inside 是否让向导线显示在图形里面,默认为true True,false guide.inside = true; 5、Scrollbar(滚动条)序号属性名/方法名作用对象获取方法/常用属性值示例1 scrollbar对象滚动条可以选择图表显示的区域var chartScrollbar = newAmCharts.ChartScrollbar();3 backgroundAlpha 滚动条背景透明度chartScrollbar.backgroundAlpha = 0.1;4 backgroundColor 滚动条背景颜色chartScrollbar.backgroundColor = "#000000";5 graphLineAlpha图像线条的透明度chartScrollbar.graphLineAlpha = 0.1;6 graphFillAlpha图像的填充透明度chartScrollbar.graphFillAlpha = 0;7 selectedGraphFillAlpha 选中图像的填充色的透明度chartScrollbar.selectedGraphFillAlpha = 0;8 selectedGraphLineAlpha 选中区域的图像线条透明度chartScrollbar.selectedGraphLineAlpha = 0.25;9 scrollbarHeight 滚动条高度chartScrollbar.scrollbarHeight = 30;10 selectedBackgr选中区域的背景颜色chartScrollbar.selectedBa第 5 页共18 页oundColor ckgroundColor = "#FFFFFF";6、Graph (图表)序号属性名/方法名作用对象获取方法/常用属性值示例1 graph对象图像对象,必须有该属性var graph1 = newAmCharts.AmGraph();2 valueAxis图像的Y轴,一个chart可以添加多个graph,一个graph只能有一个valueAxis graph1.valueAxis = valueAxis1;3 valueField指定一个字段作为Y坐标值graph1.valueField = "visits";4 bullet图像的节点类型graph1.bullet = "round";5 dashLength绘制图像时延时,默认为0秒,设置为正整数时可以看到动态生成效果graph1.dashLength = 0;6 hideBulletsCount 一个图像中当节点大于一定数值后隐藏节点形状graph1.hideBulletsCount = 10;7 balloonText 节点显示的文本内容 graph1.balloonText ="[[date]] ([[visits]])";8 lineColor 图像线颜色graph1.lineColor = "#d1655d";9 connect 是否连接起来,是指如果数据有x轴值,但是y轴值丢失的时候,如果设置为true则忽略该点,设置为false则线条在此点处断开graph1.connect = false;10 bulletBorderColor 节点边框颜色 graph1.bulletBorderColor ="#FFFFFF";11 bulletBorderThickness 节点边框宽度graph1.bulletBorderThickness = 2;12 customBulletFi用户自定义节点字段graph.customBulletField =第 6 页共18 页eld"bullet";13 bulletOffset节点偏移量graph.bulletOffset = 16;14 cornerRadiusTopgraph.cornerRadiusTop = 8;15 bulletSize节点大小graph.bulletSize = 14;16 colorField颜色字段,颜色可以从数据中读取graph1.colorField = "color";17 type 图像类型,有line、column、smoothedLine类型,第一种为线形图,第二种为柱状图line /column/smoothedLine graph1.type = "line";18 fillAlphas填充区透明度,默认为0,最大值为1,当设置值时,在线条跟x轴之间的区域会填充颜色graph1.fillAlphas = 0.3;19 negativeLineColor 当数值为负数时线条的颜色graph1.negativeLineColor ="#efcc26";7、Chart (amcharts 对象)序号属性名/方法名作用对象获取方法/常用属性值示例1 chart对象Amcharts 的核心对象var chart = newAmCharts.AmSerialChart();2 pathToImages指定chart图片的引用地址 chart.pathToImages ="amcharts/images/";3 zoomOutButton设置放大/缩小按钮的背景色和透明度chart.zoomOutButton = {backgroundColor:'#000000',第7 页共18 页backgroundAlpha: 0.15};4 dataProvider指定数据来源,一般指向一个数组对象chart.dataProvider =chartData;5 categoryField指定X轴由哪个字段决定chart.categoryField ="date";6 autoMargins 自动调整边距,如果设置为true则边距设置不起效chart.autoMargins = true;7 fontSize 字体大小chart.fontSize = 14;8 color 图标颜色chart.color = "#FFFFFF";9 marginTop 上边距chart.marginTop = 100;10 marginLeft 左边距chart.marginLeft = 50;11 marginRight 右边距chart.marginRight = 30;12 addGraph(graph) 添加一个图形,可以添加多个,想要绘制图形,必须有此方法chart.addGraph(graph1);13 validateNow(div)当数据改变时或者属性改变时,想要重新绘图,可以调用该方法chart.validateNow('chartd iv');14 chart.write('chartdiv'); 将amcharts对象写到一个div中,最常用方法chart.chart.write('chartdiv');;15 addListener('dataUpdated', zoomChart)添加一个监听函数,第一个参数是指定事件,第二个是调用的函数名chart.addListener('zoomed', handleZoom);chart.addListener('dataUpdated', zoomChart);16 rotate 图像是否xy轴互换,默认为false,如果想让图像顺时针旋转90°,则设置为trueFalse,true chart.rotate = false;17 depth3D设置为3d图像的厚度值chart.depth3D = 5018 angle角度,当设置图像为3d图时使用该属性,默认为0chart.angle = 40第8 页共18 页19 startDuration chart.startDuration = 220 plotAreaBorderColor 绘图区域边框颜色chart.plotAreaBorderColor= "#000000";21 plotAreaBorderAlpha 绘图区域边框透明度chart.plotAreaBorderAlpha= 5;22 backgroundImage设置背景图片的地址chart.backgroundImage ="amcharts/images/bg.jpg";23 addChartScrollbar(chartScrollbar)添加滚动条,只能添加一个chart.addChartScrollbar(chartScrollbar);24 addLegend(legend) 添加图例,可以添加多个chart.addLegend(legend);25 addValueAxis(valueAxis1) 添加Y轴。
